1 . INTRODUCTION
Of late, the potential of satellite data in generating valuable information for land-use and land-cover is well recognized (Mundia and Murayama, 2009; Melese et al., 2014; Mukete et al., 2018; Mekasha et al., 2020). Last few decades marked massive changes in land-use and land-cover in forest ecosystems all over the world including Ethiopia (Melakneh et al., 2010; Misrak et al., 2102; Othow et al., 2017; Dinku and Suryabhagavan, 2019). Such changes are attributed to increase in human population, agricultural expansion, and socioeconomic well-being that triggered unsustainable exploitation of natural resources. The level and intensity of use and exploitation of natural resources, especially forests/vegetation and spatial distribution of wildlife animal diversity, in the world have led to significant changes in the environment and degradation of resources with serious consequences such as reduction of natural resources ecosystem services, and food production.
Ethiopia is well known for civiculture with a very long history of production of the civet perineal gland secretion (Civet) which is extensively used in perfume industry besides in traditional practices of the locals. Initially, Civet farming tradition had originated in the northern part of Ethiopia. Later it was introduced in the southwest (Jimma area), and from there the practice spread to other parts of the country. At present, southwestern regions of Oromia, namely, Jimma, Illu-Abbabora and Wollega are the strongholds of Civet farming (; Pugh, 1998; Abebe Yilma, 2003). Ethiopia is world’s main supplier of Civet with an export share of 90%. Civet cats are naturally wild in Ethiopia (Dannenfeldt, 1985). However, there are over 600 civet farmers in the country with around 6000 captive civets (Bekele et al., 2008). Most of these farms are located in the low-lying areas of West Ethiopia while a few are in south Ethiopia (FAO, 2000; Kumera, 2005).
The habitat of an organism incorporates biophysical characteristics in the surroundings (Smith, 1974). Understanding the causes of spatial distribution of wildlife and information on their habitat would enhance the effectiveness of scientific plans for wildlife management and conservation (Kafley, 2008; Mannan et al., 2018). Remote sensing data from several satellite sensors (ASTER, Landsat, MODIS, Sentinel-2A), now available free, provide temporal datasets of a few decades and are increasingly used to identify the habitat cover types and their relative changes (Lambin et al., 2003; Röder et al., 2008; Shimabukuro et al., 2009; Lu et al., 2018; Novo-Fernandez et al., 2018). Essentially, change detection involves the ability to quantify temporal effects and encompasses application of multi-date or multi-temporal data sets to differentiate areas of LULC between the imaging dates (Singh, 1989; Erener et al., 2012). Change detection analysis is useful in diverse applications as analysis of land-use, monitoring of shifting cultivation, assessment of deforestation, study of vegetation phenology, monitoring the disasters, mapping the ecology, analysis of area suitability and other environmental findings (Singh, 1989). Information collected through a GPS receiver could be combined with other geographic data using GIS technology for habitat mapping of key species (Lenton et al., 2000; Anwar and Stein, 2012; Belete and Suryabhagavan, 2019) as each species requires a particular habitat to meet the requirement of space, food, cover and other needs of life. The ability to model spatial distribution and changes in the distribution of wildlife is of utmost importance in wildlife management (Qamar et al., 2011; Melese et al., 2014). Different environmental factors such as slope, elevation, precipitation, soil and proximity to rivers, roads and settlements are used as important components in the analysis of habitat suitability, presence and abundance mapping and modeling purposes (Roy et al., 1995; Pleguezuelos and Caro, 1996).
Civet dwells in natural forests, riverine habitats, human landscapes, and has adapted to degraded forests. The present study area in Ethiopia supports a good population of Civets though pressures do exist due to increased human population and enhanced urbanization. In the present context, geospatial techniques are used as a tool to analyze and compare habitats suitable for Civets.
2 . MATERIALS AND METHODS
2.1 Study Area
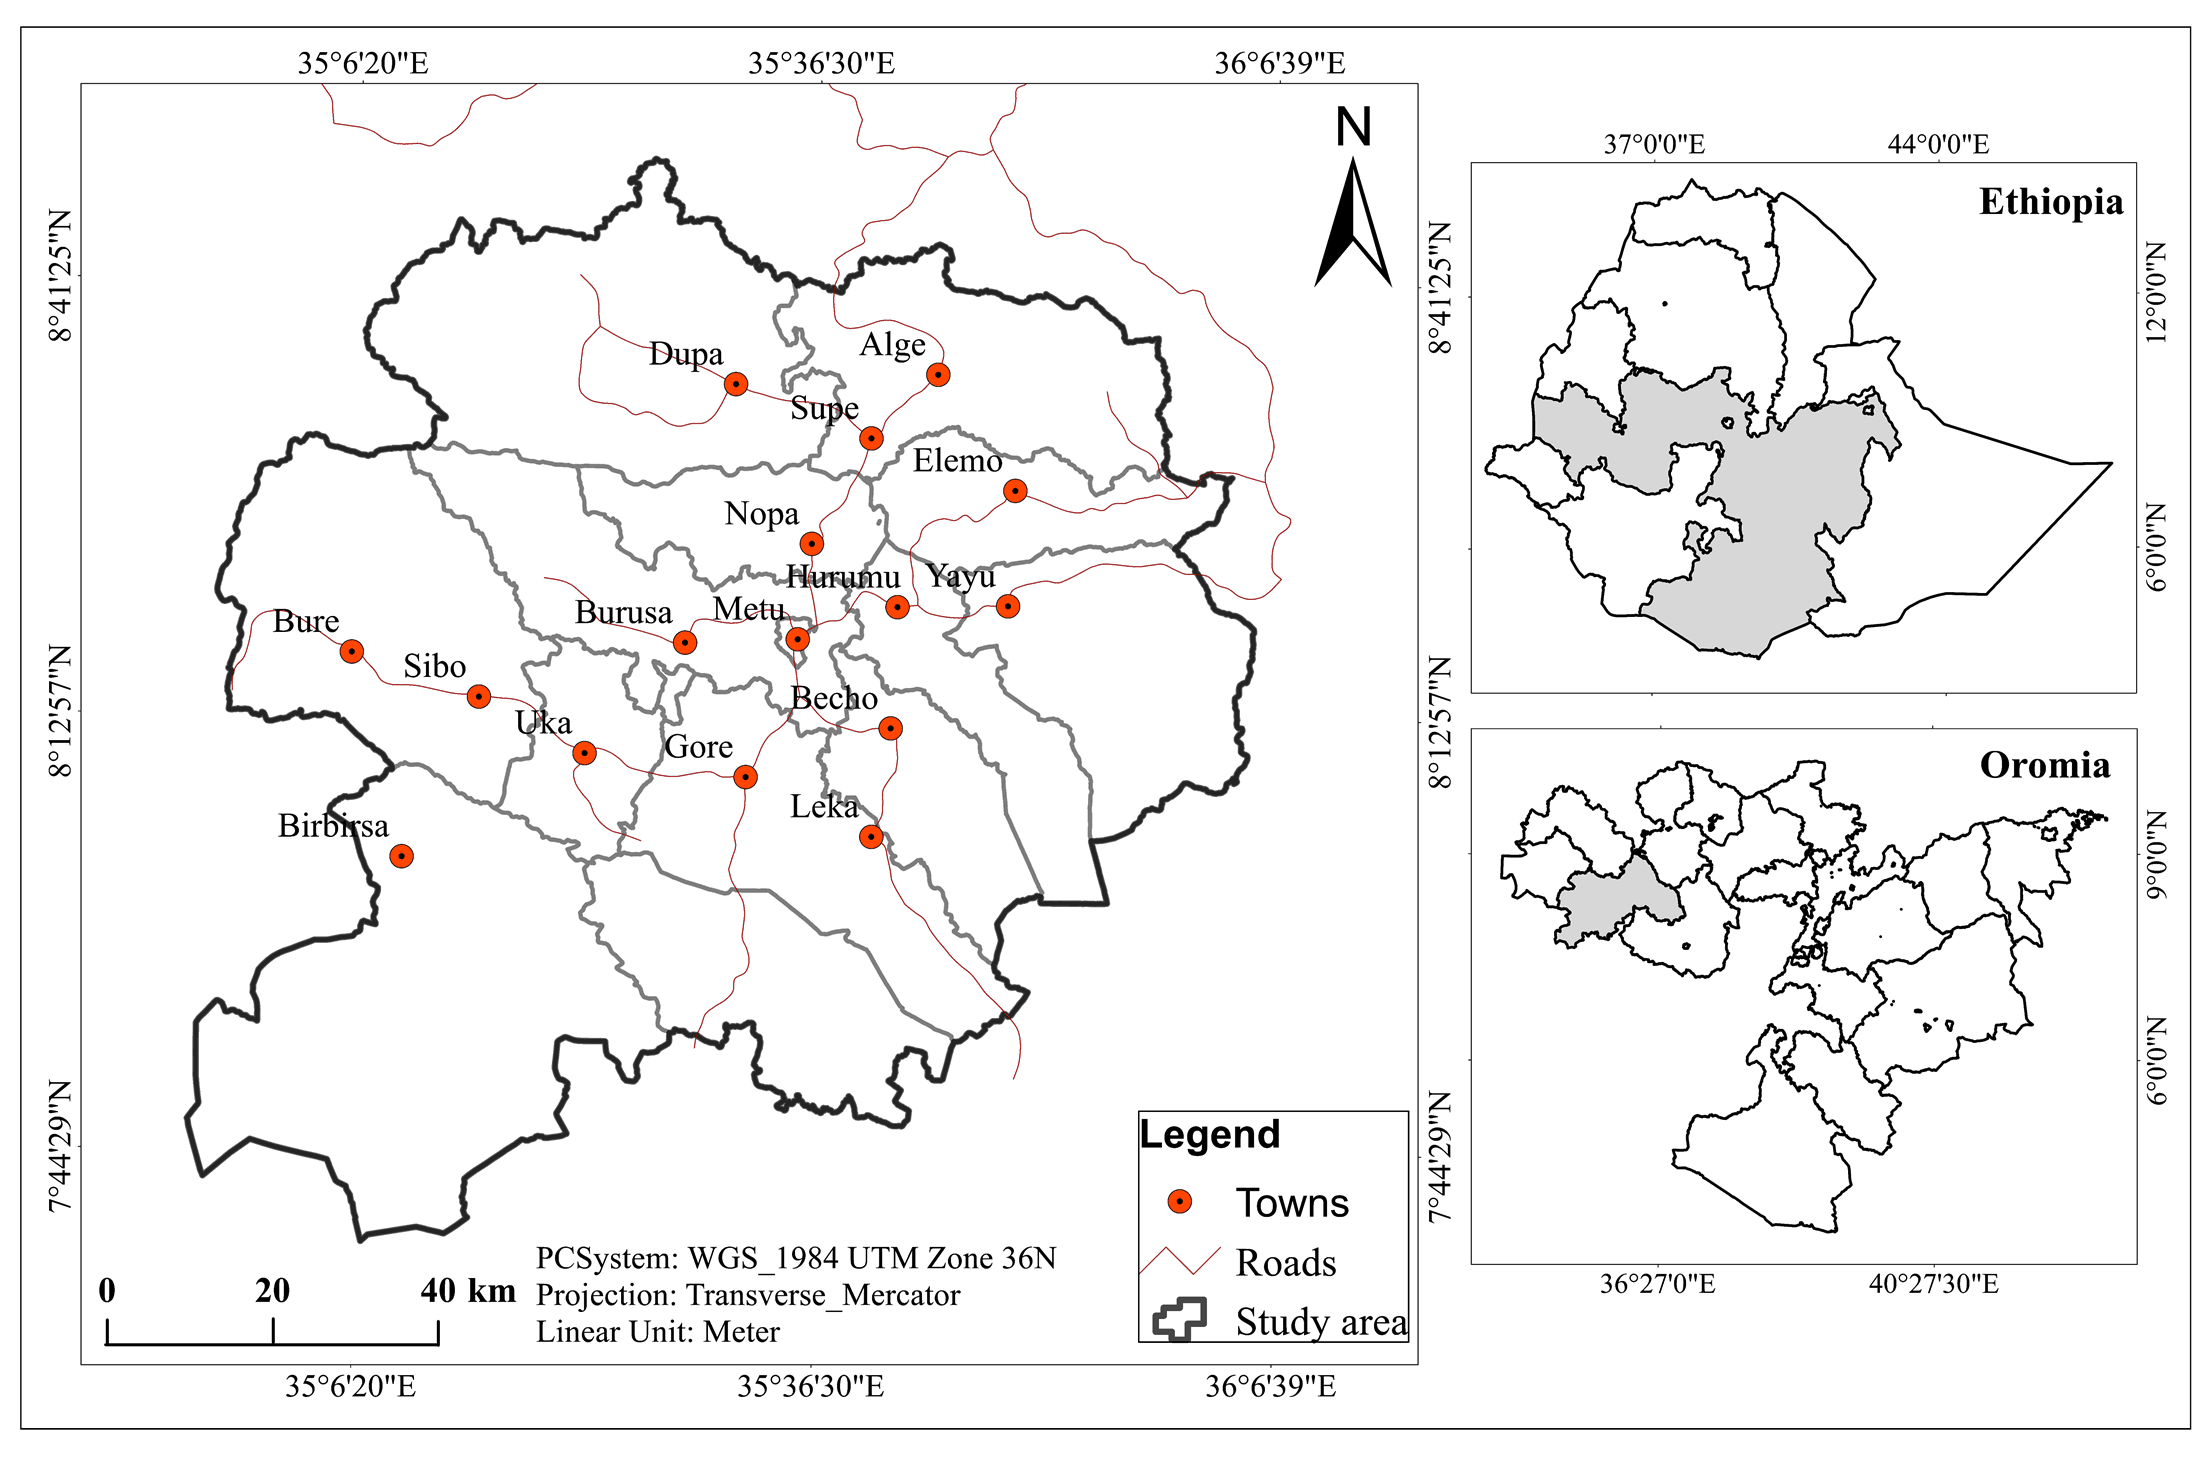
Illu-Abbabora is one of the administrative zones of the Oromia Regional State in Ethiopia. Geographically, the study area is bounded by latitudes 7°13′57″-7°59′64″N and longitudes 35°13′25″-35°49′ 27″ E covering an area of 7125. 35km2 (Figure 1). Elevation of the region ranged from 545 to 2660 MSL. Mean temperature in the study area ranged from 14° to 18°C. Rainfall is of unimodal in nature with slight fluctuations. Natural habitat in the area is mainly of tropical montane evergreen type. Soil texture in general is calcic xerosols, followed by leptosols, orthic solonchaks, and pellic vertisols.
2.2 Data Sources
The present study was conducted using remote sensing data, topographic maps (Ethiopian Mapping Agency, scale 1:50,000), secondary data obtained from various Government organizations and primary data collected from field observations. Multi-temporal Landsat-5 Thematic Mapper (TM), and the Operational Land Imager (OLI) imageries of 1985, 2000, and 2018 (path/row 170-054/171-055) were used for mapping LULC classes in Illu-Abbabora zone. All the imageries were retrieved from the United State Geological Survey (USGS) database (http://glovis.usgs.gov/). The imageries selected for the analysis were cloud free and of 30m spatial resolution, captured during the dry season to avoid over estimation of the vegetation cover. Shuttle Radar Topography Mission (SRTM) of the area was used with a spatial resolution of 90m to assess the topography of the study area.
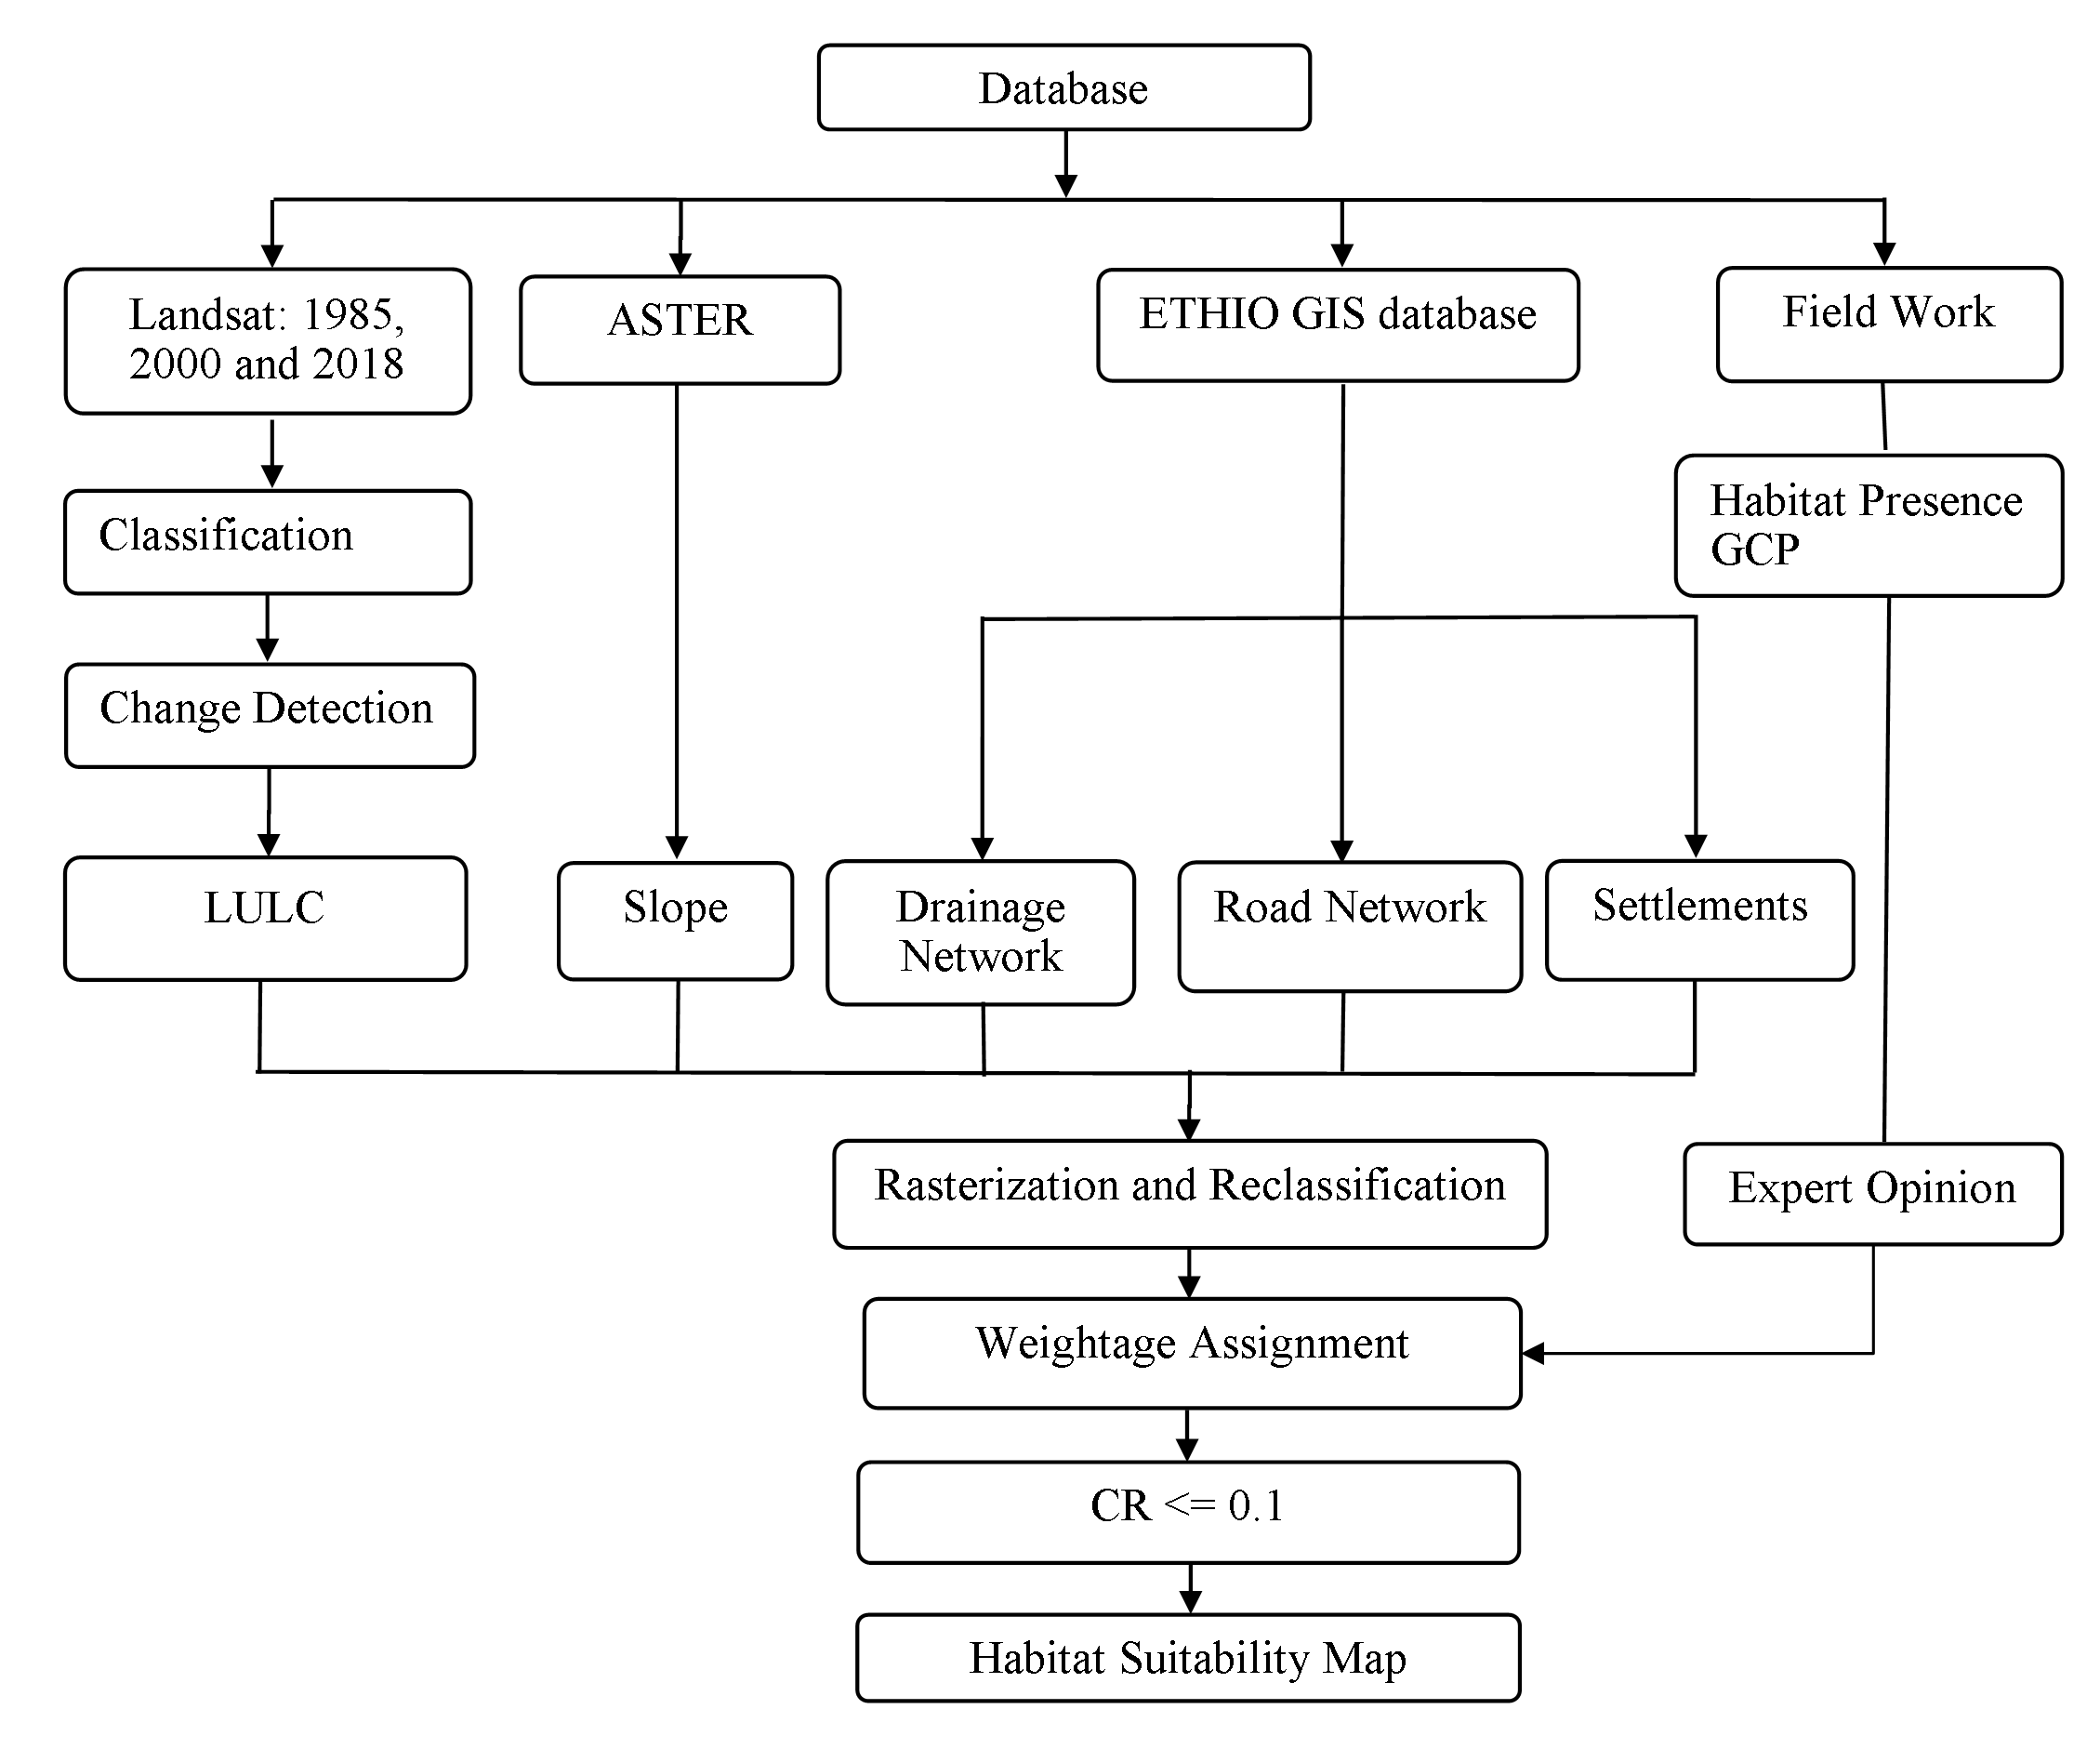
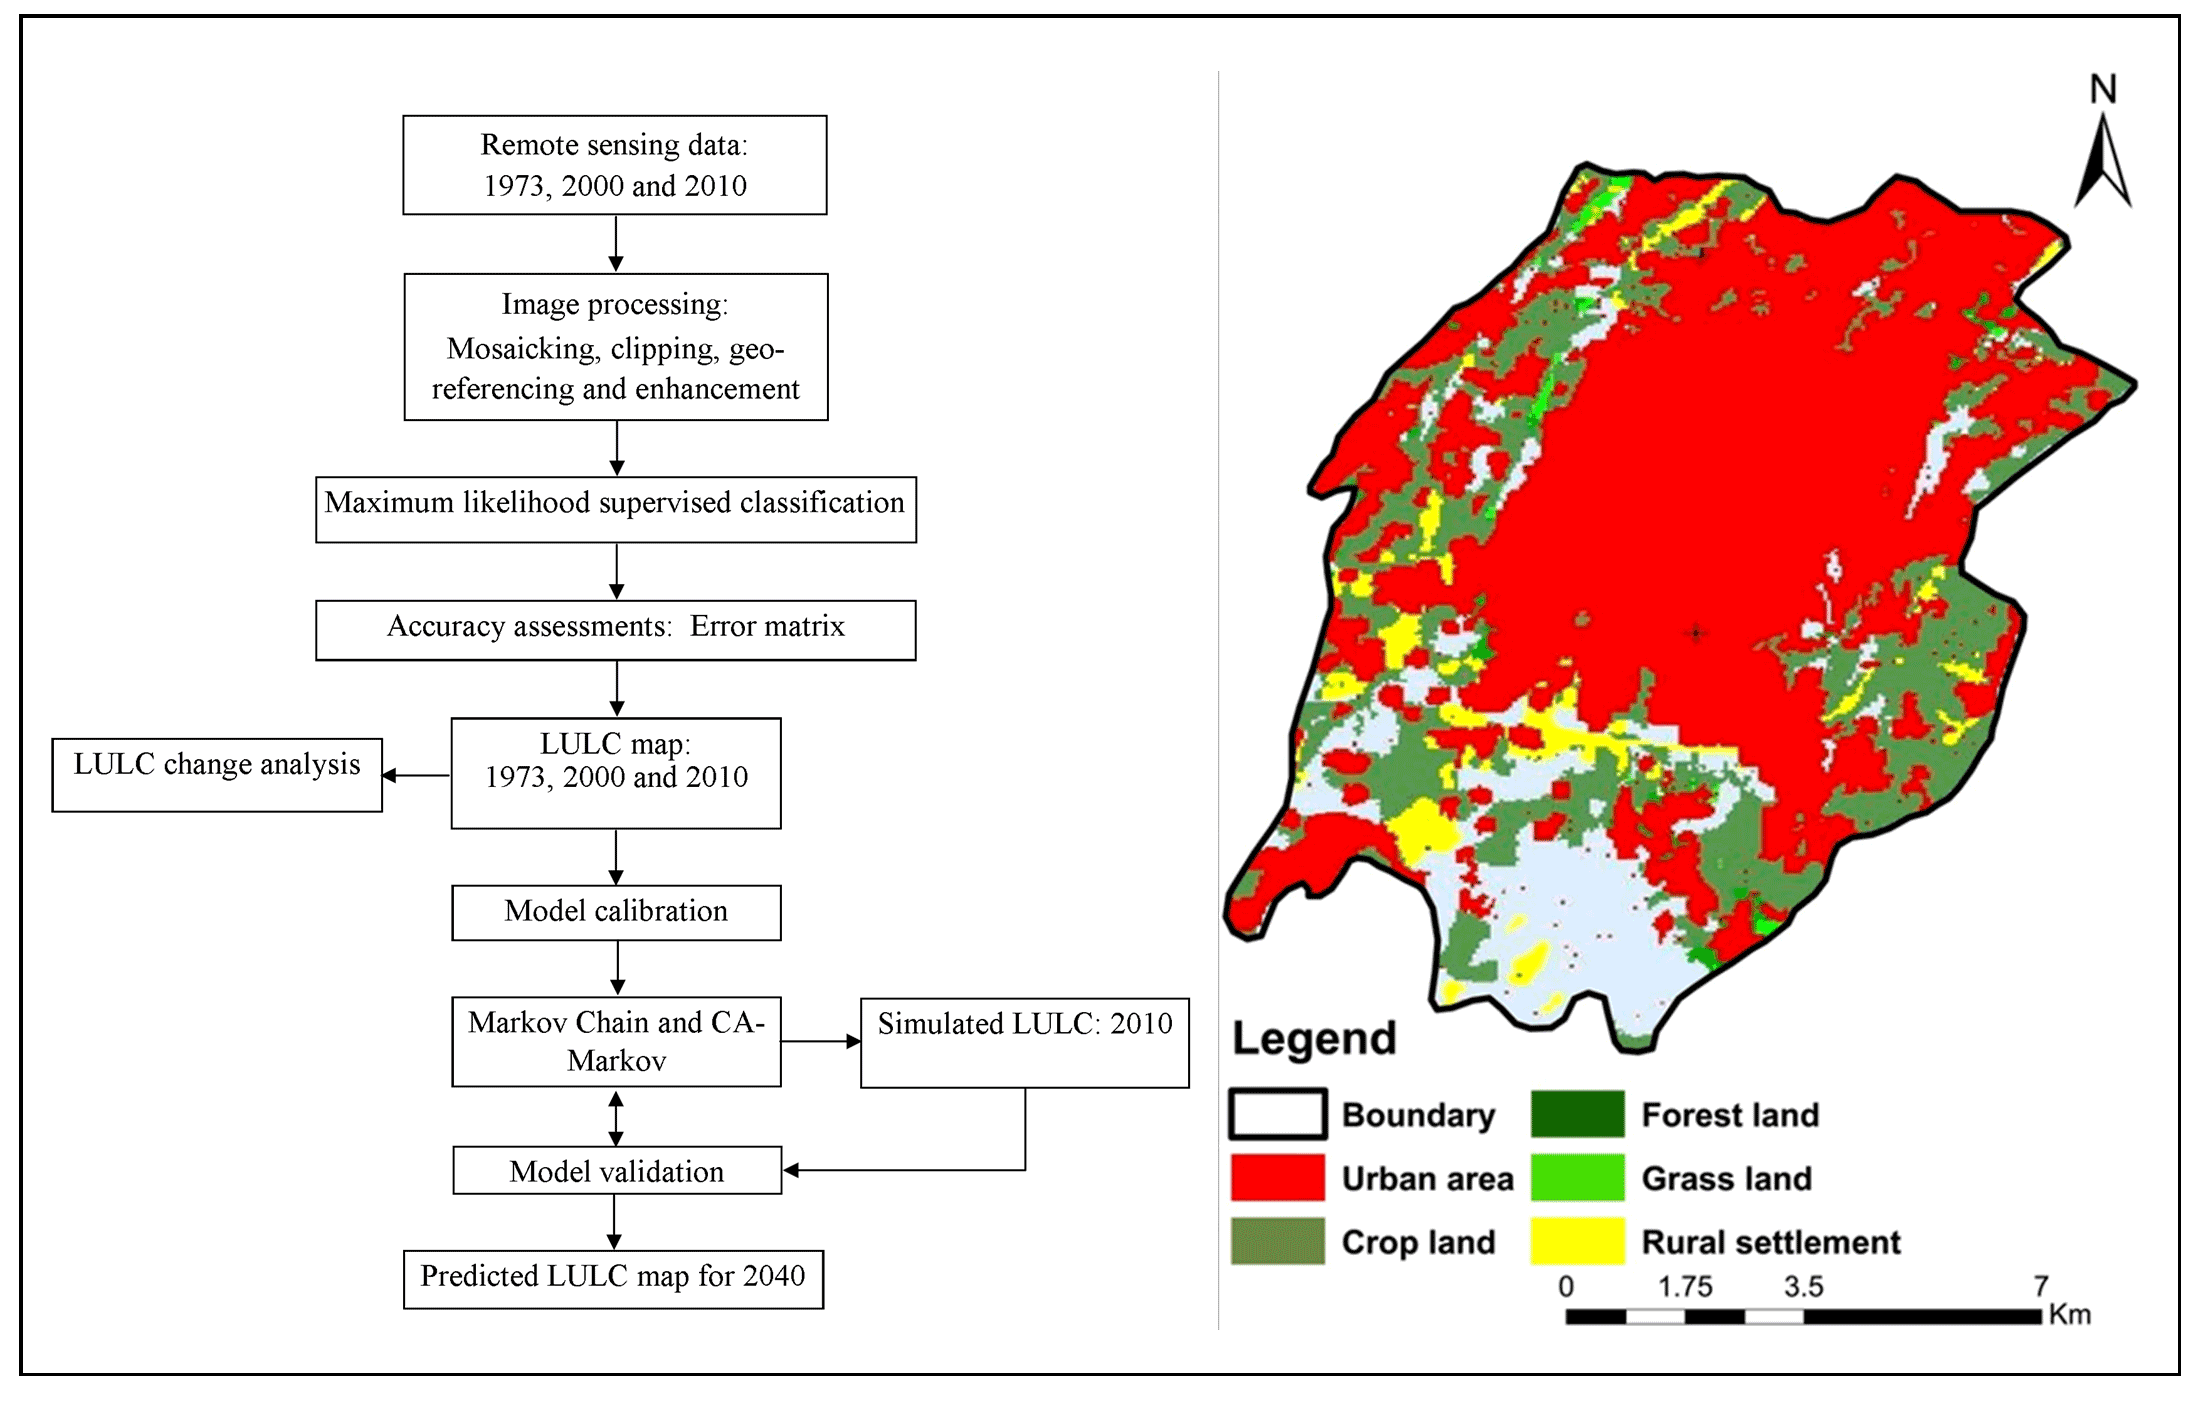
Field surveys were conducted during July, 2018-February, 2019 to identify the distribution and habitats of African Civets, by locating naturally scent-marked areas and defecation sites. Close and intensive direct observations were made in the habitats for the presence of Civets through environmental sign-posts on which civets scent-marked with their perineal glands. Civets have the habit of defecating in the same location known as “civetry”, where droppings get accumulated. Ground truth information on scent-marked signposts and civetries were collected from 250 GPS points employing a Garmin GPS, and were used as input for satellite data and to understand the characteristics of the animals in the area. Information on the presence of civets was also gathered from literature and locals. All GPS points of presence data were converted to UTM WGS 84 Zone 36 N projections similar to that of the satellite imagery, and superimposed on the study area map to portray the distribution map of Africa Civets in the place. The flowchart of methodology and using hierarchical structure is depicted in Figure 2.
2.3 Suitability Model
Factors that influence the presence of Civets in the area were analyzed in the order of their importance as land-use/land-cover (LULC) > river > slope > road > settlement. Analytical hierarchical technique was
followed to evaluate each criterion (Saaty and Vargas, 2001). Determination of the general weight of each of the sub-criteria is carried out by multiplying the two preceding matrixes (lack of relation) and (relation) in each other (Saaty and Vargas, 2001; Mussa and Suryabhagavan, 2019). Among the sub-criteria, impact on the ecological environment is important and spatial models are generally validated in the neighborhood context because maps may not always match pixel by pixel, but they may present similar spatial patterns and spatial agreement within certain cell vicinity (Thapa et al., 2013). Weightages for specific criteria were established by ranking their importance and suitability, adopting a nine point scale, 9, 8, 7, . . ., 1/7, 1/8, 1/9, where 9 means extreme preference, 7 means very strong preference, 5 means strong preference, and so on down to 1, meaning no preference (Table 1). This pair-wise comparison allowed for independent evaluation of each factors contribution thereby simplifying the decision making process (Rezaei-Moghaddam and Karami, 2008).
Table 1. AHP: Comparison scale
|
Degree of importance
|
Definition
|
Explanation
|
|
1
|
Equal importance
|
Two activities contribute equally to the objective
|
|
3
|
Weak importance of one over another
|
Experience and judgment slightly favor one activity over another
|
|
5
|
Essential or strong importance
|
Experience and judgment strongly favor one activity over another
|
|
7
|
Demonstrated importance
|
An activity is strongly favored and its dominance demonstrated in practice
|
|
9
|
Absolute importance
|
The evidence favoring one activity over another is of the highest possible order of affirmation
|
|
2, 4, 6 and 8
|
Intermediate values between two adjacent judgments
|
When compromise is needed
|
|
Reciprocals of above nonzero
|
If activity i has one of the above nonzero numbers assigned to it compared to the activity j, then j will have the reciprocal value.
|
|
Pair-wise comparisons of different criteria were organized into a square matrix. The diagonal elements of the matrix were 1. Principal eigenvalue and the corresponding normalized right eigenvector the matrix denote relative importance of the criteria under comparison. The elements of normalized eigenvector were weighted with respect to the criteria or sub-criteria and rated as alternatives (Melese et al., 2014). Consistency of the matrix of the order n was then evaluated. In instances where consistency index does not reach a threshold level, then of the results comparisons were re-examined. The consistency index, CI, was calculated as:
\(CR = { \lambda{max}-n \over n-1}\) (1)
where, CI is the consistency index (1), λmax is the largest or principal eigenvalue of the matrix, and n is the order of the matrix. The CI was compared to that of a random matrix (RI) such that the ratio of CI/ RI gives a consistency ratio (CR). As a general rule, CR ≤0.1 should be maintained for the matrix to be consistent. Homogeneity of the factors within each group combined with their limit along with a better understanding of the decision issue improves the consistency ratio (Saaty, 1993). In this study, the CR is 0.04 indicating the formation of a consistent matrix. The local ratings were then multiplied by the weights of the criteria and aggregated to determine the global ratings (Melese et al., 2014). In this study, each criterion was assigned a different rating on a scale of 1 (suitable) to 4 (less suitable). Subsequently, overall score of alternatives in GIS environment and of the African civet presence suitability in the study area were determined by calculating the suitability factor index. Each criterion was weighted by AHP and mapped using GIS techniques. All criteria considered and sub-criteria used are summarized in Tables 2 and 3. Final presence suitability map of the African Civet was prepared using the five criterion layers through overlay analyses in GIS environment.
Table 2. Significance weights of main factors and ranking of habitat suitability classes
|
Factors
|
Weight
|
Classes
|
Rank
|
Suitability Class
|
|
LULC
|
0.5181
|
Forest
|
1
|
Very suitable
|
|
Shrub land
|
2
|
Suitable
|
|
Wetland
|
3
|
Moderately suitable
|
|
Agricultural land
|
4
|
Less suitable
|
|
Settlements
|
Restricted
|
-
|
|
River
|
0.1266
|
<6 km
|
1
|
Suitable
|
|
6−12 km
|
2
|
Moderately suitable
|
|
>12 km
|
3
|
Less suitable
|
|
Slope
|
0.2411
|
0−10o
|
1
|
Suitable
|
|
10−20o
|
2
|
Moderately suitable
|
|
>20o
|
3
|
Less suitable
|
|
Road
|
0.0540
|
<6 km
|
1
|
Suitable
|
|
6−12 km
|
2
|
Moderately suitable
|
|
>12 km
|
3
|
Less suitable
|
|
Settlement
|
0.0602
|
< 6 km
|
1
|
Suitable
|
|
6−12 km
|
2
|
Moderately suitable
|
|
>12 km
|
3
|
Less suitable
|
Table 3. Pair-wise comparison of habitat suitability factors
|
Factors
|
Land-use
|
River
|
Road
|
Slope
|
Settlement
|
|
LULC
|
1
|
|
|
|
|
|
River
|
1/5
|
1
|
|
|
|
|
Road
|
1/7
|
1/3
|
1
|
|
|
|
Slope
|
1/3
|
3
|
5
|
1
|
|
|
Settlement
|
1/7
|
1/3
|
1
|
1/3
|
1
|
2.4 Change Detection Matrix
In order to make a detailed analysis of the dynamics of LULC change, transition matrices were developed as tables with symmetric arrays composed of LULC classes from the initial date in one axis and the same classes from the subsequent date in the other (date 1 and date 2). Each cell of the main diagonal of the matrix contained surface area (ha) of each class of habitat cover that remained unchanged during the period under consideration, while the remaining cells contained the estimated forest area of a given cover class that transformed into a different class within the same period (Singh, 1989). Parameters such as food sources, breeding sites, and movement of the animals were used to model suitable habitats of the species. These parameters were grouped as proximity factors, which have an influence on the access of food, reproduction, water, and effect of human activities on the habitat. Natural factors (physiographic datasets) influencing access of the human hunters and predators of the civets were proximity to roads, settlements and water sources (proximity datasets). Among natural factors, slope was used as a major input in deciding the mobility of the civets. In order to examine the properties and differences in the training samples, the digital spectral signature of TM of 1985-2000 and OLI of 2018 were evaluated and examined using training areas of the original scenes. A maximum-likelihood classifier algorithm of supervised classification was applied using ERDAS Imagine. The rate of change in each LULC category from 1985 to 2018 based on Landsat temporal data was calculated as a measure of the habitat change of the civets in terms of human impact affecting the habitat range annual deforestation rates were computed as follows:
\(P=[100⁄t1-t2] ln A1-A2\) (2)
where, P is the percentage of forest lost per year. A1 and A2 are the extent of forest cover in time t1 and t2, respectively.
In addition change in LULC was deducted detection was computed using the following equation (Ayele et al., 2014) as:
LULC change = Area final year − Area initial year (3)
LULC change (%) = ((Area final year-Area initial year)/(Area initial year)) × 100 (4)
i.e., change in extent of each LULC classes in hectares/percentage, positive values suggest an increase and negative values a decrease.
Accuracy assessment of the land-cover maps produced through the Landsat imagery should be based on field data or higher resolution imageries (Liu et al., 2007; Strahler et al., 2006). However, these reference datasets are very difficult to obtain, especially in the case of historical information. Therefore, for assessing the accuracy of our results, we opted to build a reference dataset through visual interpretation by an independent expert, based on the same imagery used for the production of maps. Classification accuracy assessment was conducted by collecting 250 in-situ ground control points (GCP) systematically distributed throughout the accessible locations of the study area. Accuracy of results was assessed through error matrices. Further, Kappa test was also performed to measure the extent of accuracy of the classified images from the following formula.
K = P (A) – P (E) / 1− P (E) (5)
where, P(A) is the frequency of positive responses of K raters and, P(E) is the frequency of expected positive responses of K raters (Gwet, 2002; Viera and Garrett, 2005).
3 . RESULTS
3.1 Land Use / Land Cover
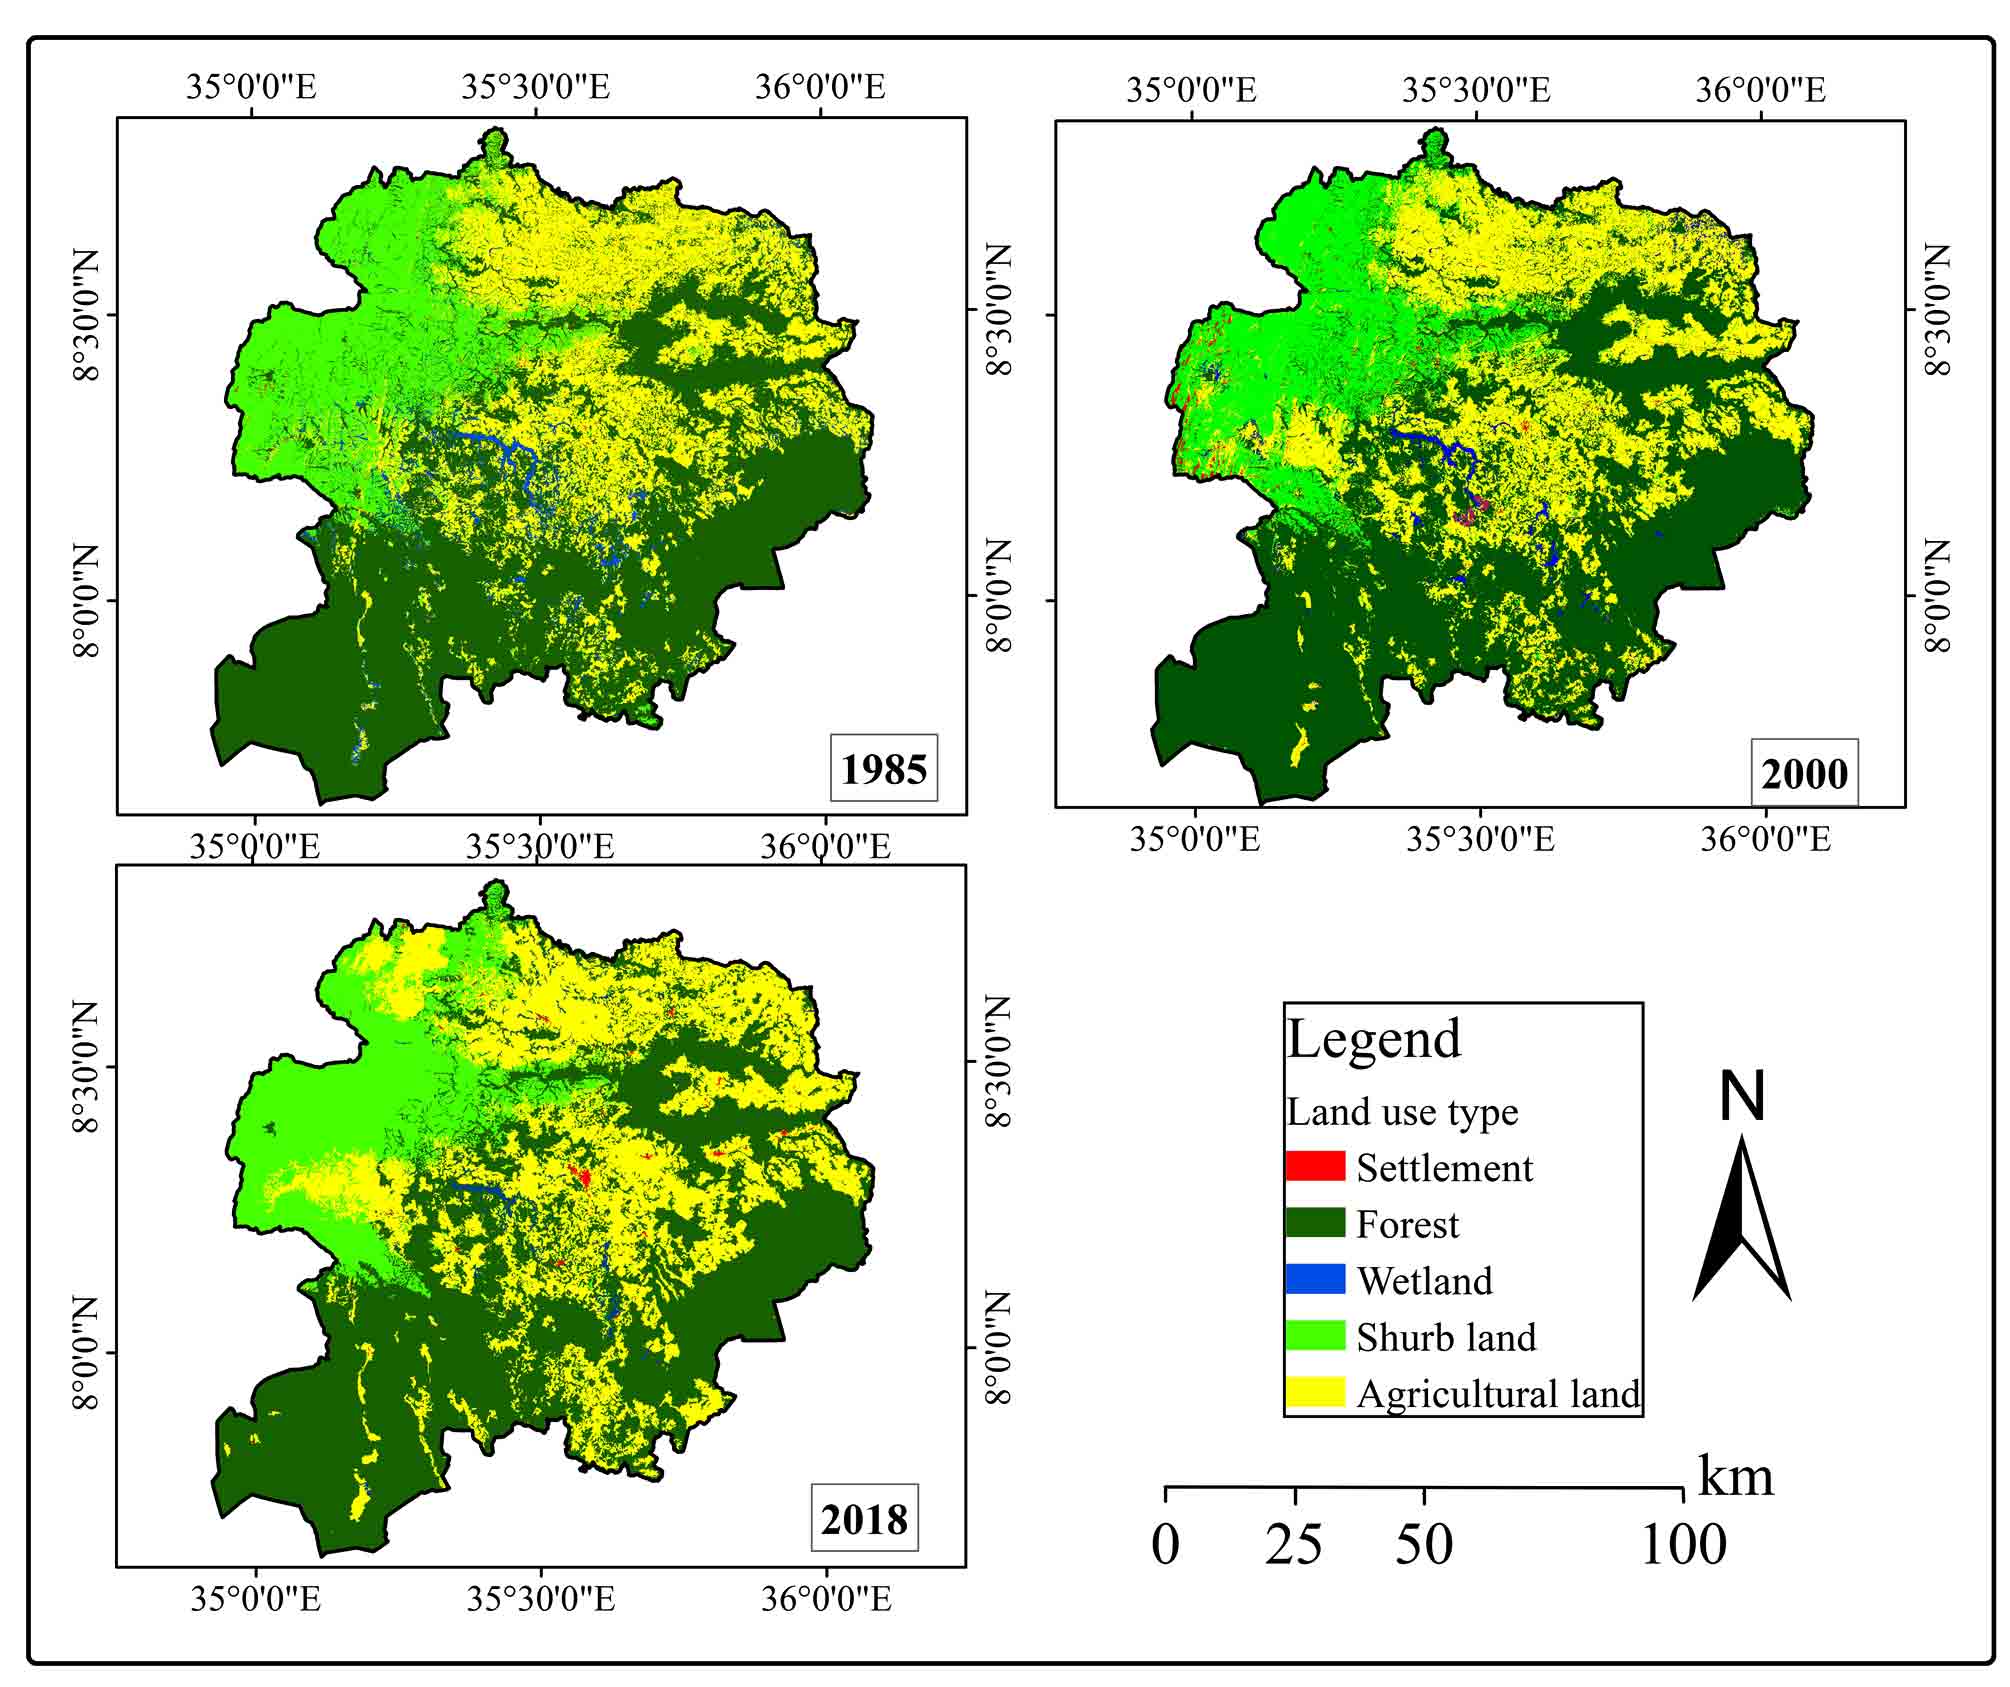
Five LULC were derived from the classified imagery (Table 4). LULC 1985 to 2018 within the forest reserve was very dynamic, characterized by land-cover conversion sequences. Throughout the evaluation period (1985-2018), forest and agricultural areas were dominant LULC types. Common observable sequences of land-cover changes were spatiotemporal changes wetland, agricultural land and forest (Figure 3). According to the classified maps of 1985, percent extent of forest, agricultural land, shrub land, wet land, and settlement area were 53.33, 26.05, 16.70, 3.20, and 0.69, respectively.
Table 4. Land-use and land-cover areas for the years of 1985, 2000 and 2018
|
Land use / land cover classes
|
1985
|
2000
|
2018
|
|
Area (km2)
|
Area (%)
|
Area (km2)
|
Area (%)
|
Area (km2)
|
Area (%)
|
|
Forest
|
5564.4
|
53.33
|
4801.43
|
45.95
|
4465.36
|
42.91
|
|
Wetland
|
334.78
|
3.20
|
249.89
|
2.39
|
102.1
|
0.98
|
|
Shrub land
|
1743.29
|
16.70
|
1552.38
|
14.85
|
1321.04
|
12.70
|
|
Settlement
|
72.28
|
0.69
|
143.67
|
1.37
|
297.52
|
2.86
|
|
Agricultural land
|
2718.22
|
26.05
|
3701.73
|
35.42
|
4207.97
|
40.48
|
|
Total
|
10433
|
100
|
10449.1
|
100
|
10394
|
100
|
3.2 Land Use / Land Cover Changes
On the other hand, in 2000 about 45.95% (-7.38%), 35.42% (+9.37%) were covered by forest, and agricultural land, respectively. Shrub land and wetland areas covered 14.85% (-1.85%) and 2.39% (-0.81%), respectively. The area covered by settlement was less than 2% (143.67 km2) (+1.31%) of the total geographical area for the years 1985-2000 (Table 4). By 2018, the extent of forest got reduced still to 42.91%, whereas agricultural land occupied 40.48%, shrub land 12.70%, while wet land and settlements collectively covered 3.84% area (Figure 4).
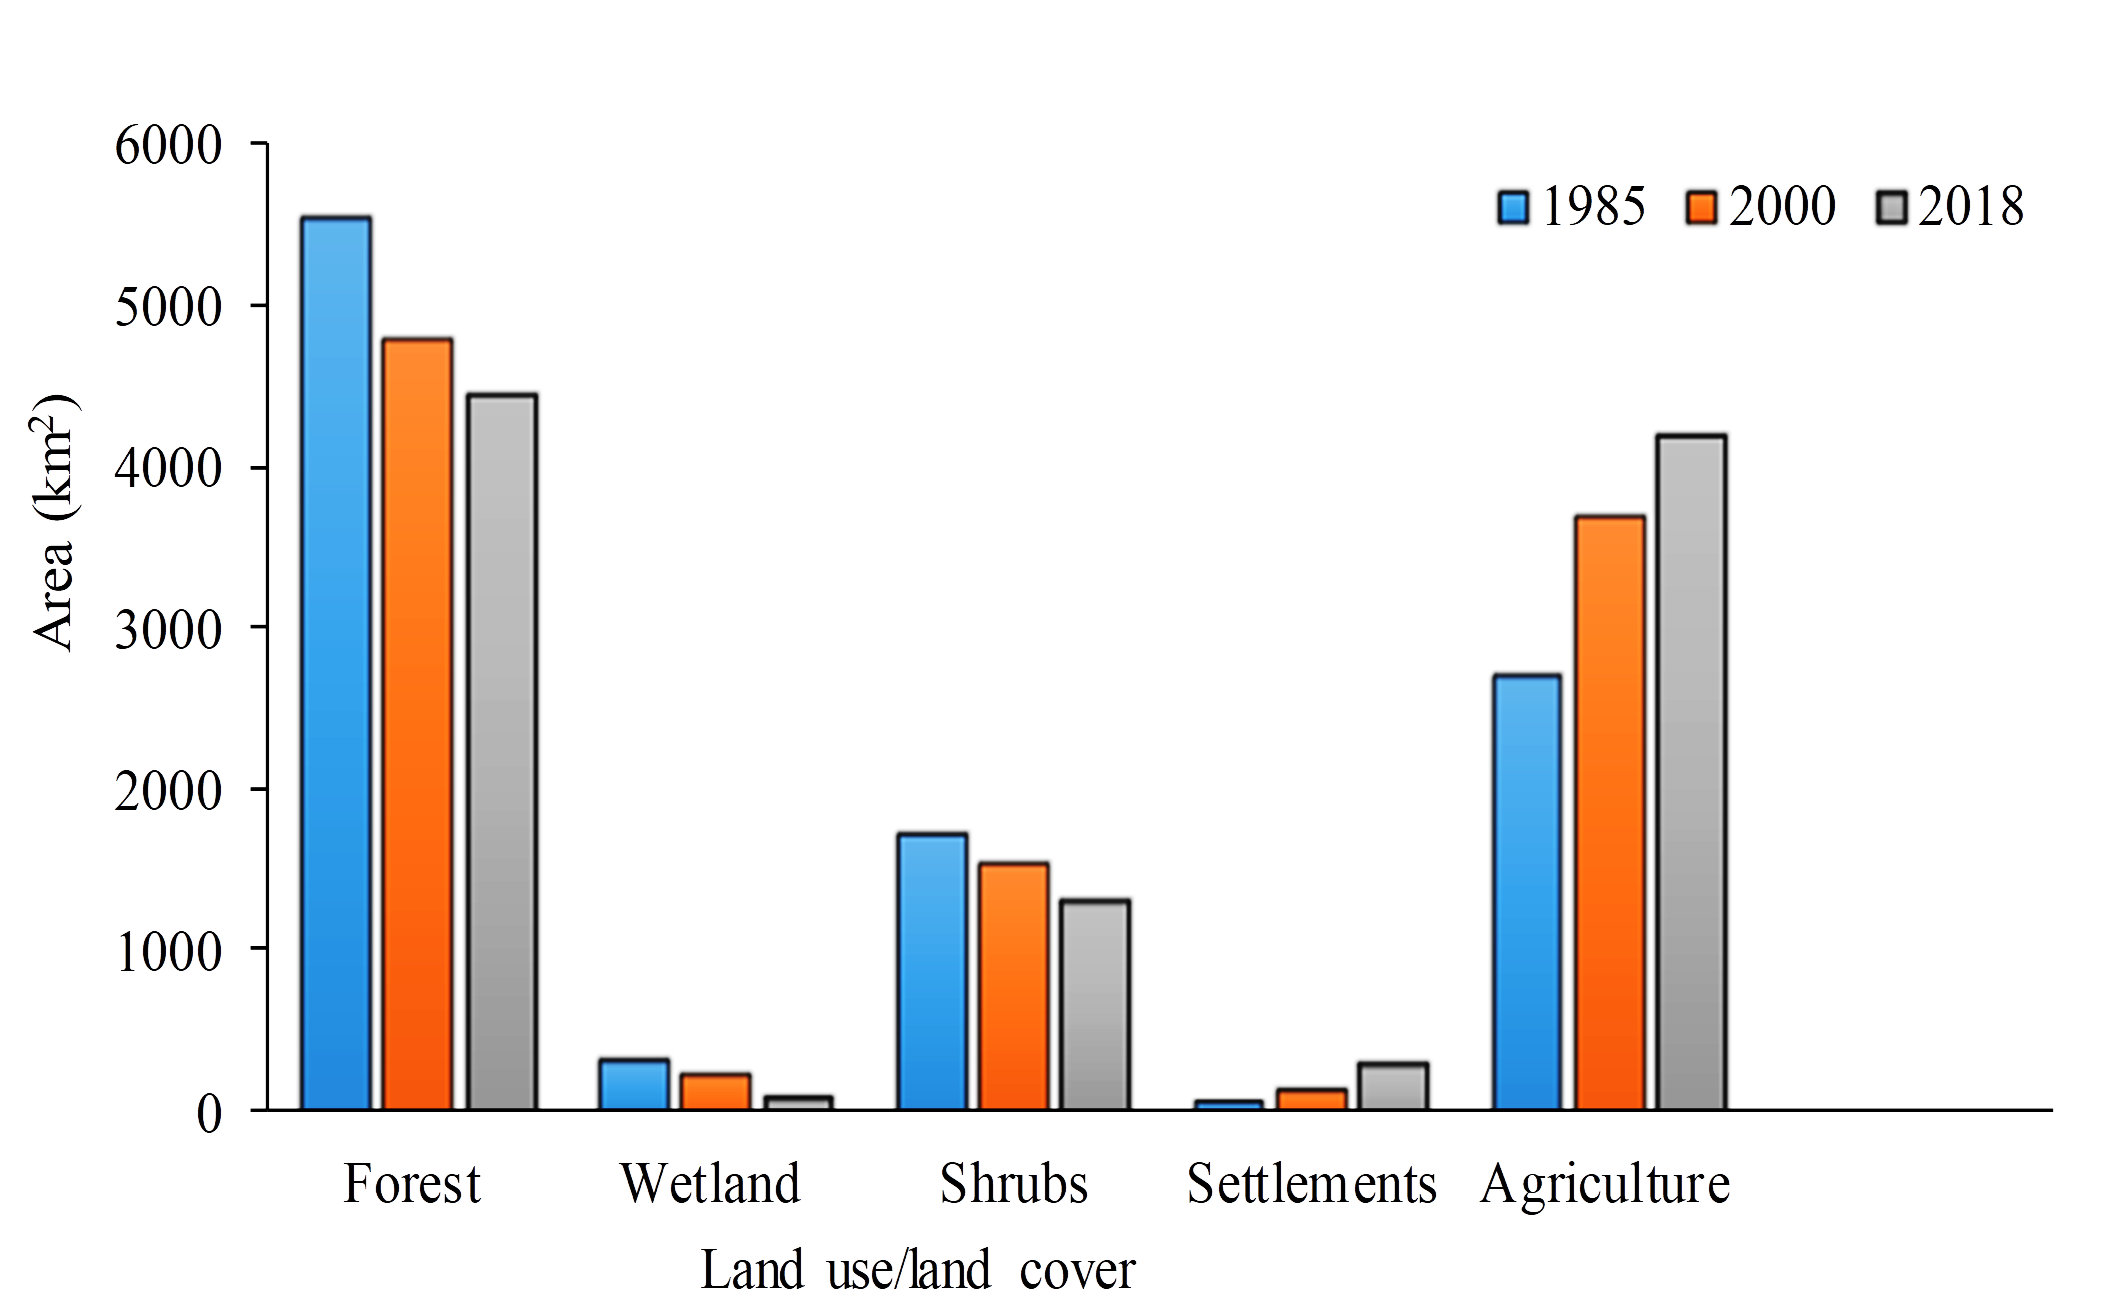
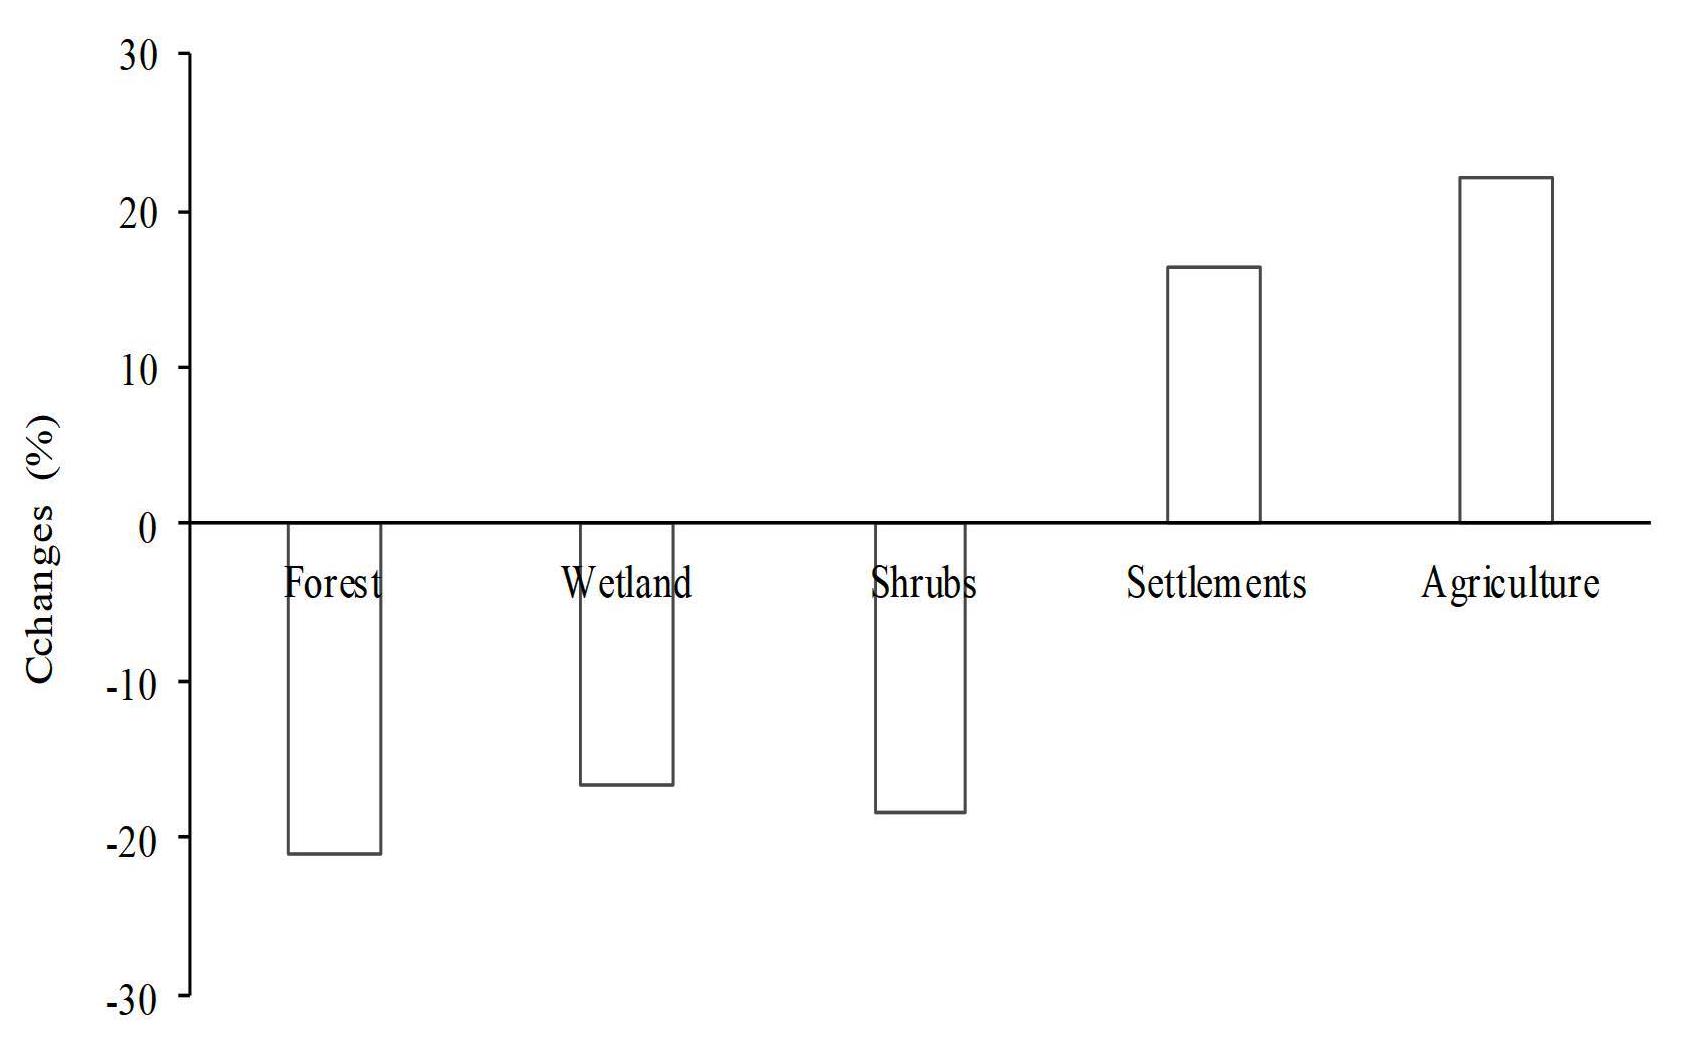
Table 5 indicates overall changes from 1985 to 2018. One of the major land-cover classes, dense forest which is showing a significant increase in the last three decades and is a welcome development. Forest area has increased by 21.1 km2 from1985 to 2018. Overall loss of agricultural land in the three decades was found to be -22.13 km2. Major reason for this change is identified as of growth of open forest into a dense forest. Major changes in agricultural land to wetland and forest to wetland were observed during all the periods due to conversion of irrigated agricultural lands in widely practiced traditional agroforestry system and vice versa. Overall change in agricultural area was -2718.22 km2 from 26.05% (1985) to 40.48% (2018). Quantitative analysis of LULC change rate clearly shows that forest, agricultural land and wetland classes have recorded highest change compared to change in other LULC classes between 1985 and 2018. The magnitude of forest and wetland classes has showed in highest negative values as a result of deforestation and wetland degradation in the study area. Proportionally, agricultural land, urban area, and Gumro tea plantations have shown a positive change.
Table 5. LULC class change rate between 1985 and 2018
|
Land use / land cover classes
|
Area (km2)
|
Overall change (%)
|
|
1985
|
2018
|
|
Forest
|
5564.4
|
4465.36
|
21.1
|
|
Wetland
|
334.78
|
102.10
|
16.51
|
|
Shrubs
|
1743.29
|
1321.04
|
18.31
|
|
Settlements
|
72.28
|
297.52
|
−16.41
|
|
Agriculture
|
2718.22
|
4207.97
|
−22.13
|
On the contrary, forest, wetland and scrub/bush land categories have shown a decreasing trend between 1985-2018 (Figure 5). Forest and wetland areas declined by an estimated 11.12 km2/yr−1 and 2.39 km2/yr−1, respectively, during the period from 1985 to 2018. In contrast, agricultural land, urban area and Gumro tea plantation have shown highest increase inclining by an estimated 13.36 km2/yr−1, 0.59 km2/yr−1 and 0.43 km2/yr−1, respectively, during the study period. Finally, as land-cover analysis indicate that continuous expansion of agricultural land took place at a rate of 13.36 km2/yr−1 between 1985 and 2018. Further, there has been a continuous decrease of wetland, forest land and shrub land between the two periods (1985 and 2018) at a rate of 2.39 km2/yr−1, -11.12 km2/yr-1, and -0.68 km2/yr-1, respectively.
3.3 Accuracy Assessment
Overall accuracies of the LULC maps for the years 1985, 2000 and 2018 are 84.2%, 83.06% and 86%, respectively. Calculated overall Kappa statistics of the years 1985, 2000 and 2018 were 0.77, 0.77 and 0.79, respectively.
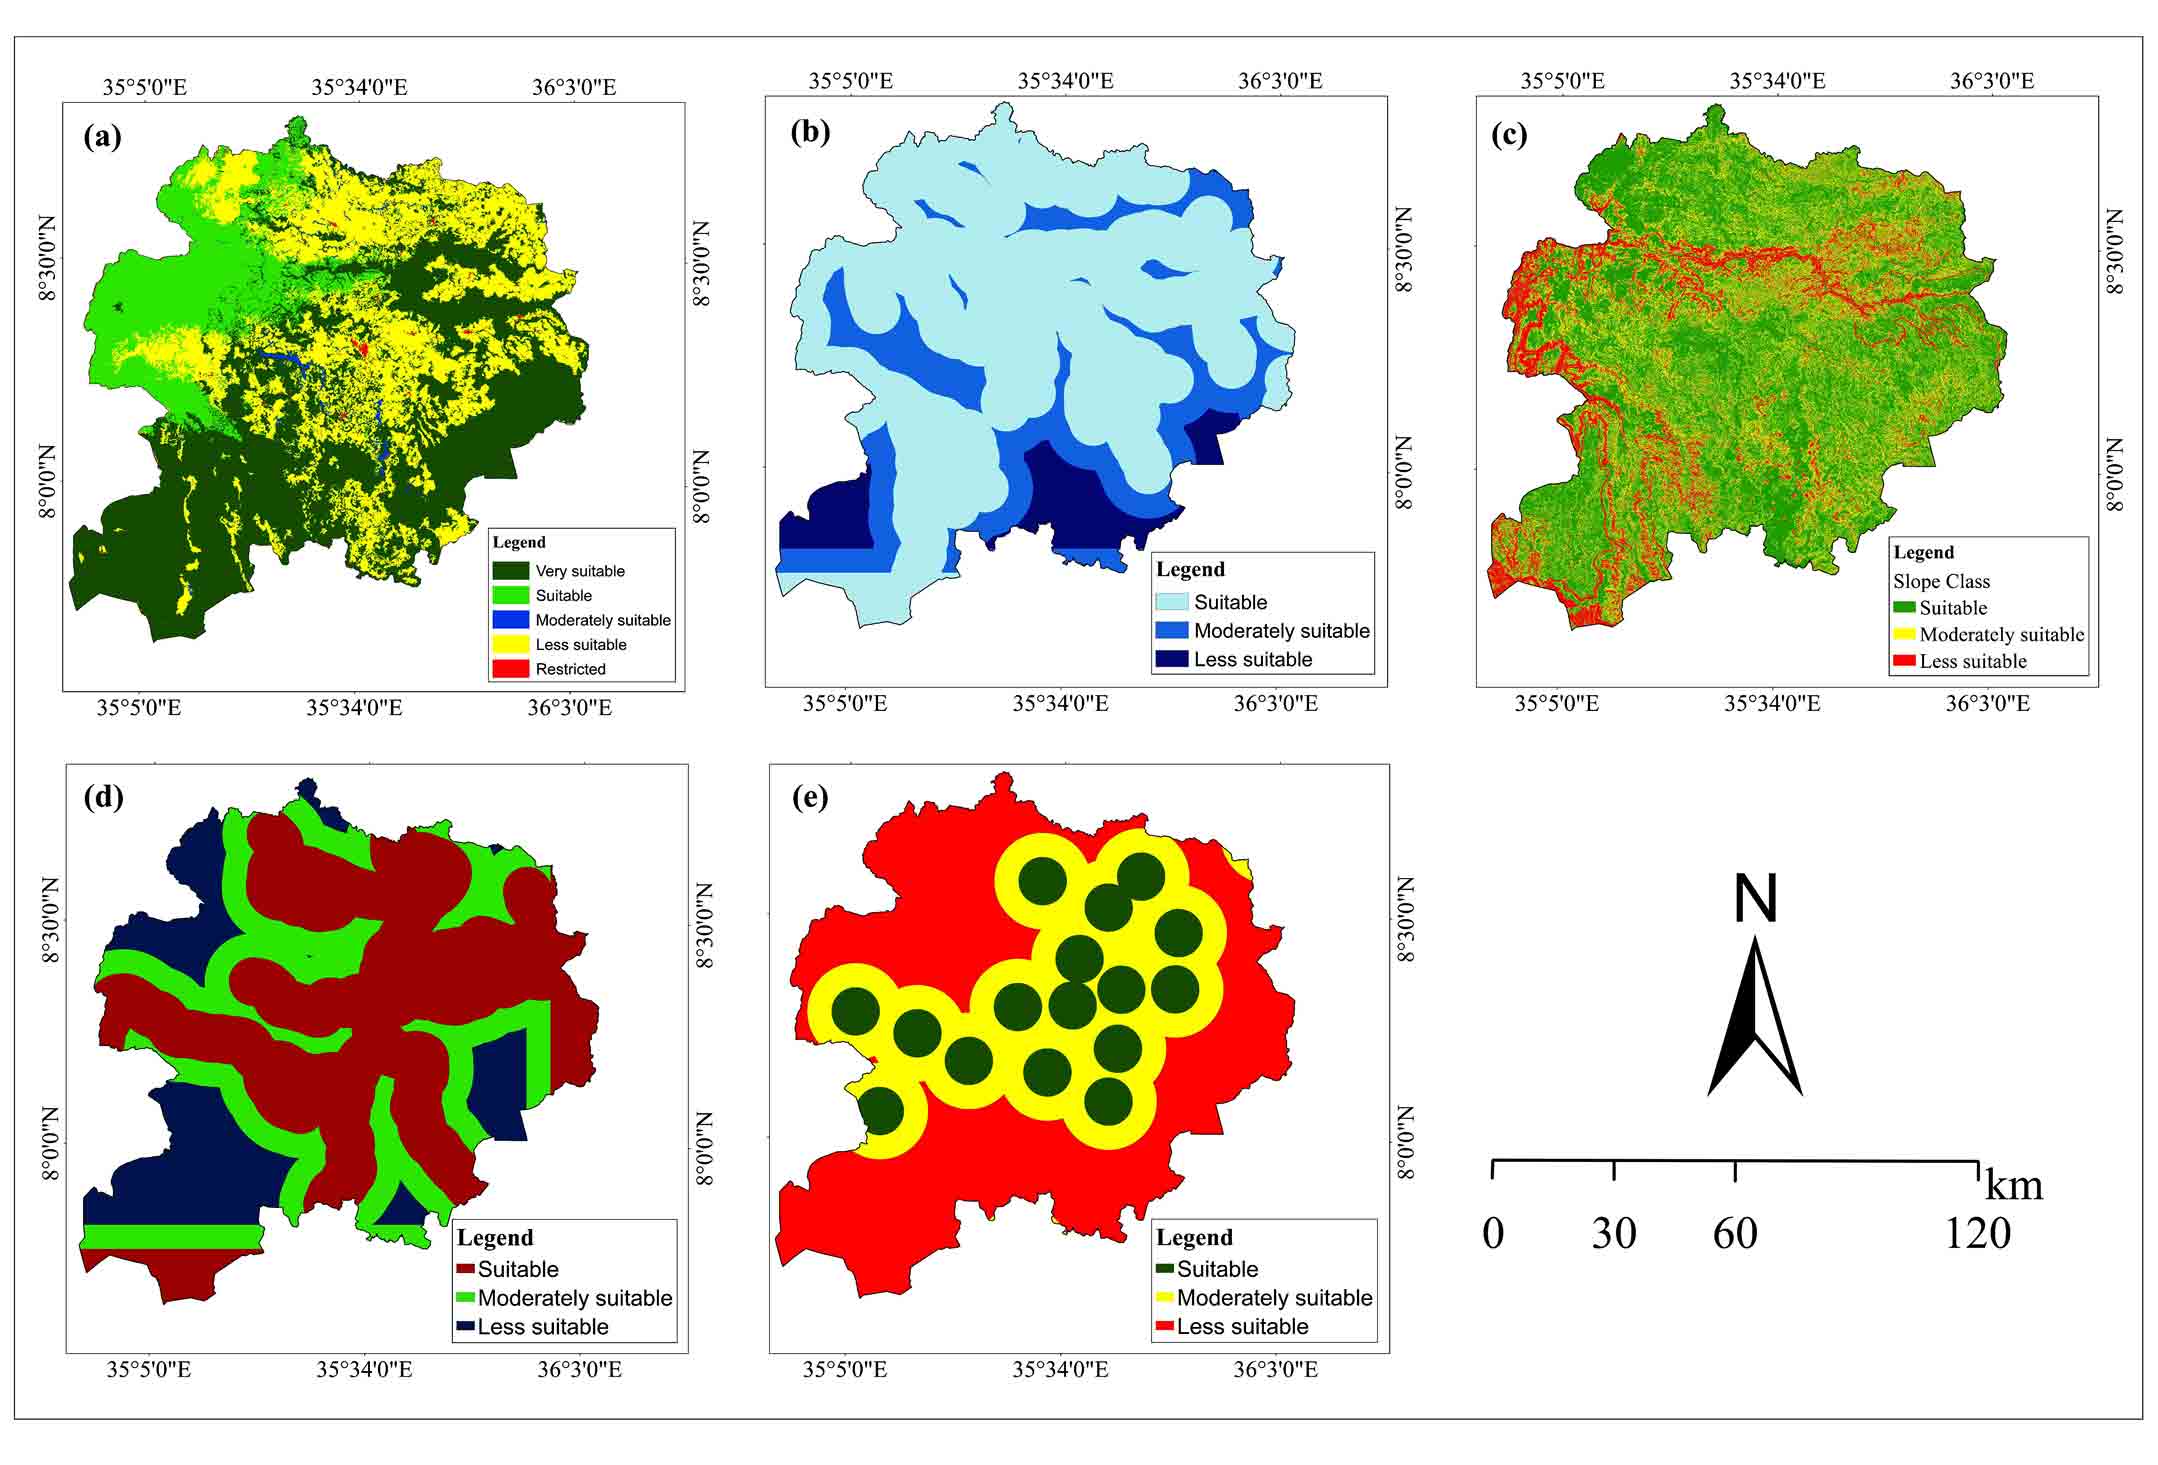
Presence of the Civet depends on several topographic and allied factors of an area. Combined assessment of all known factors of using geospatial techniques provides a detailed picture of the African civet suitability locations. The study area was classified into five habitat types, viz., forest, shrub land, wetland, agricultural land and settlement. Values were assigned to each land-use based on its suitability level. Areas such as sensitive ecosystems, protected forest, and shrub land were assigned with score 1 while areas like agricultural lands and settlement were given a score of 4. Local people have revealed that the civet is the most frequently sighted animal around their locality, and they consider it a pest as Civets encroach the farmlands and damage crops. From the drainage network map it can be seen (Figure 6), that the study area has a fifth order drainage network, with good drainage network in the western part. On the basis of drainage density, the study area was grouped in three classes, ‘suitable’ (<6 km), ‘moderately suitable’ (6-12 km), and ‘less suitable’ (>12 km) depending upon its (length/width). Slope is another important criterion in sighting the civet. The slope of the area was divided into three classes 0-10o suitable, 10-20o moderately suitable and >20o suitable. Proximity to roads was considered for the presence of Civets. Road data includes information on highways, major and minor roads, and their connections. Accessibility of the site was considered, especially for vehicles used for collection and transport to collection points. Due to this reason, high scores were given to areas near the roads (Figure 6). This criterion does not permit civet site presence in the area. Presence of any civet site near or within urban and rural residential areas is likely to cause health and environmental problems. Therefore, a distance of <6 km above was taken as suitable.
3.4 Habitat suitability
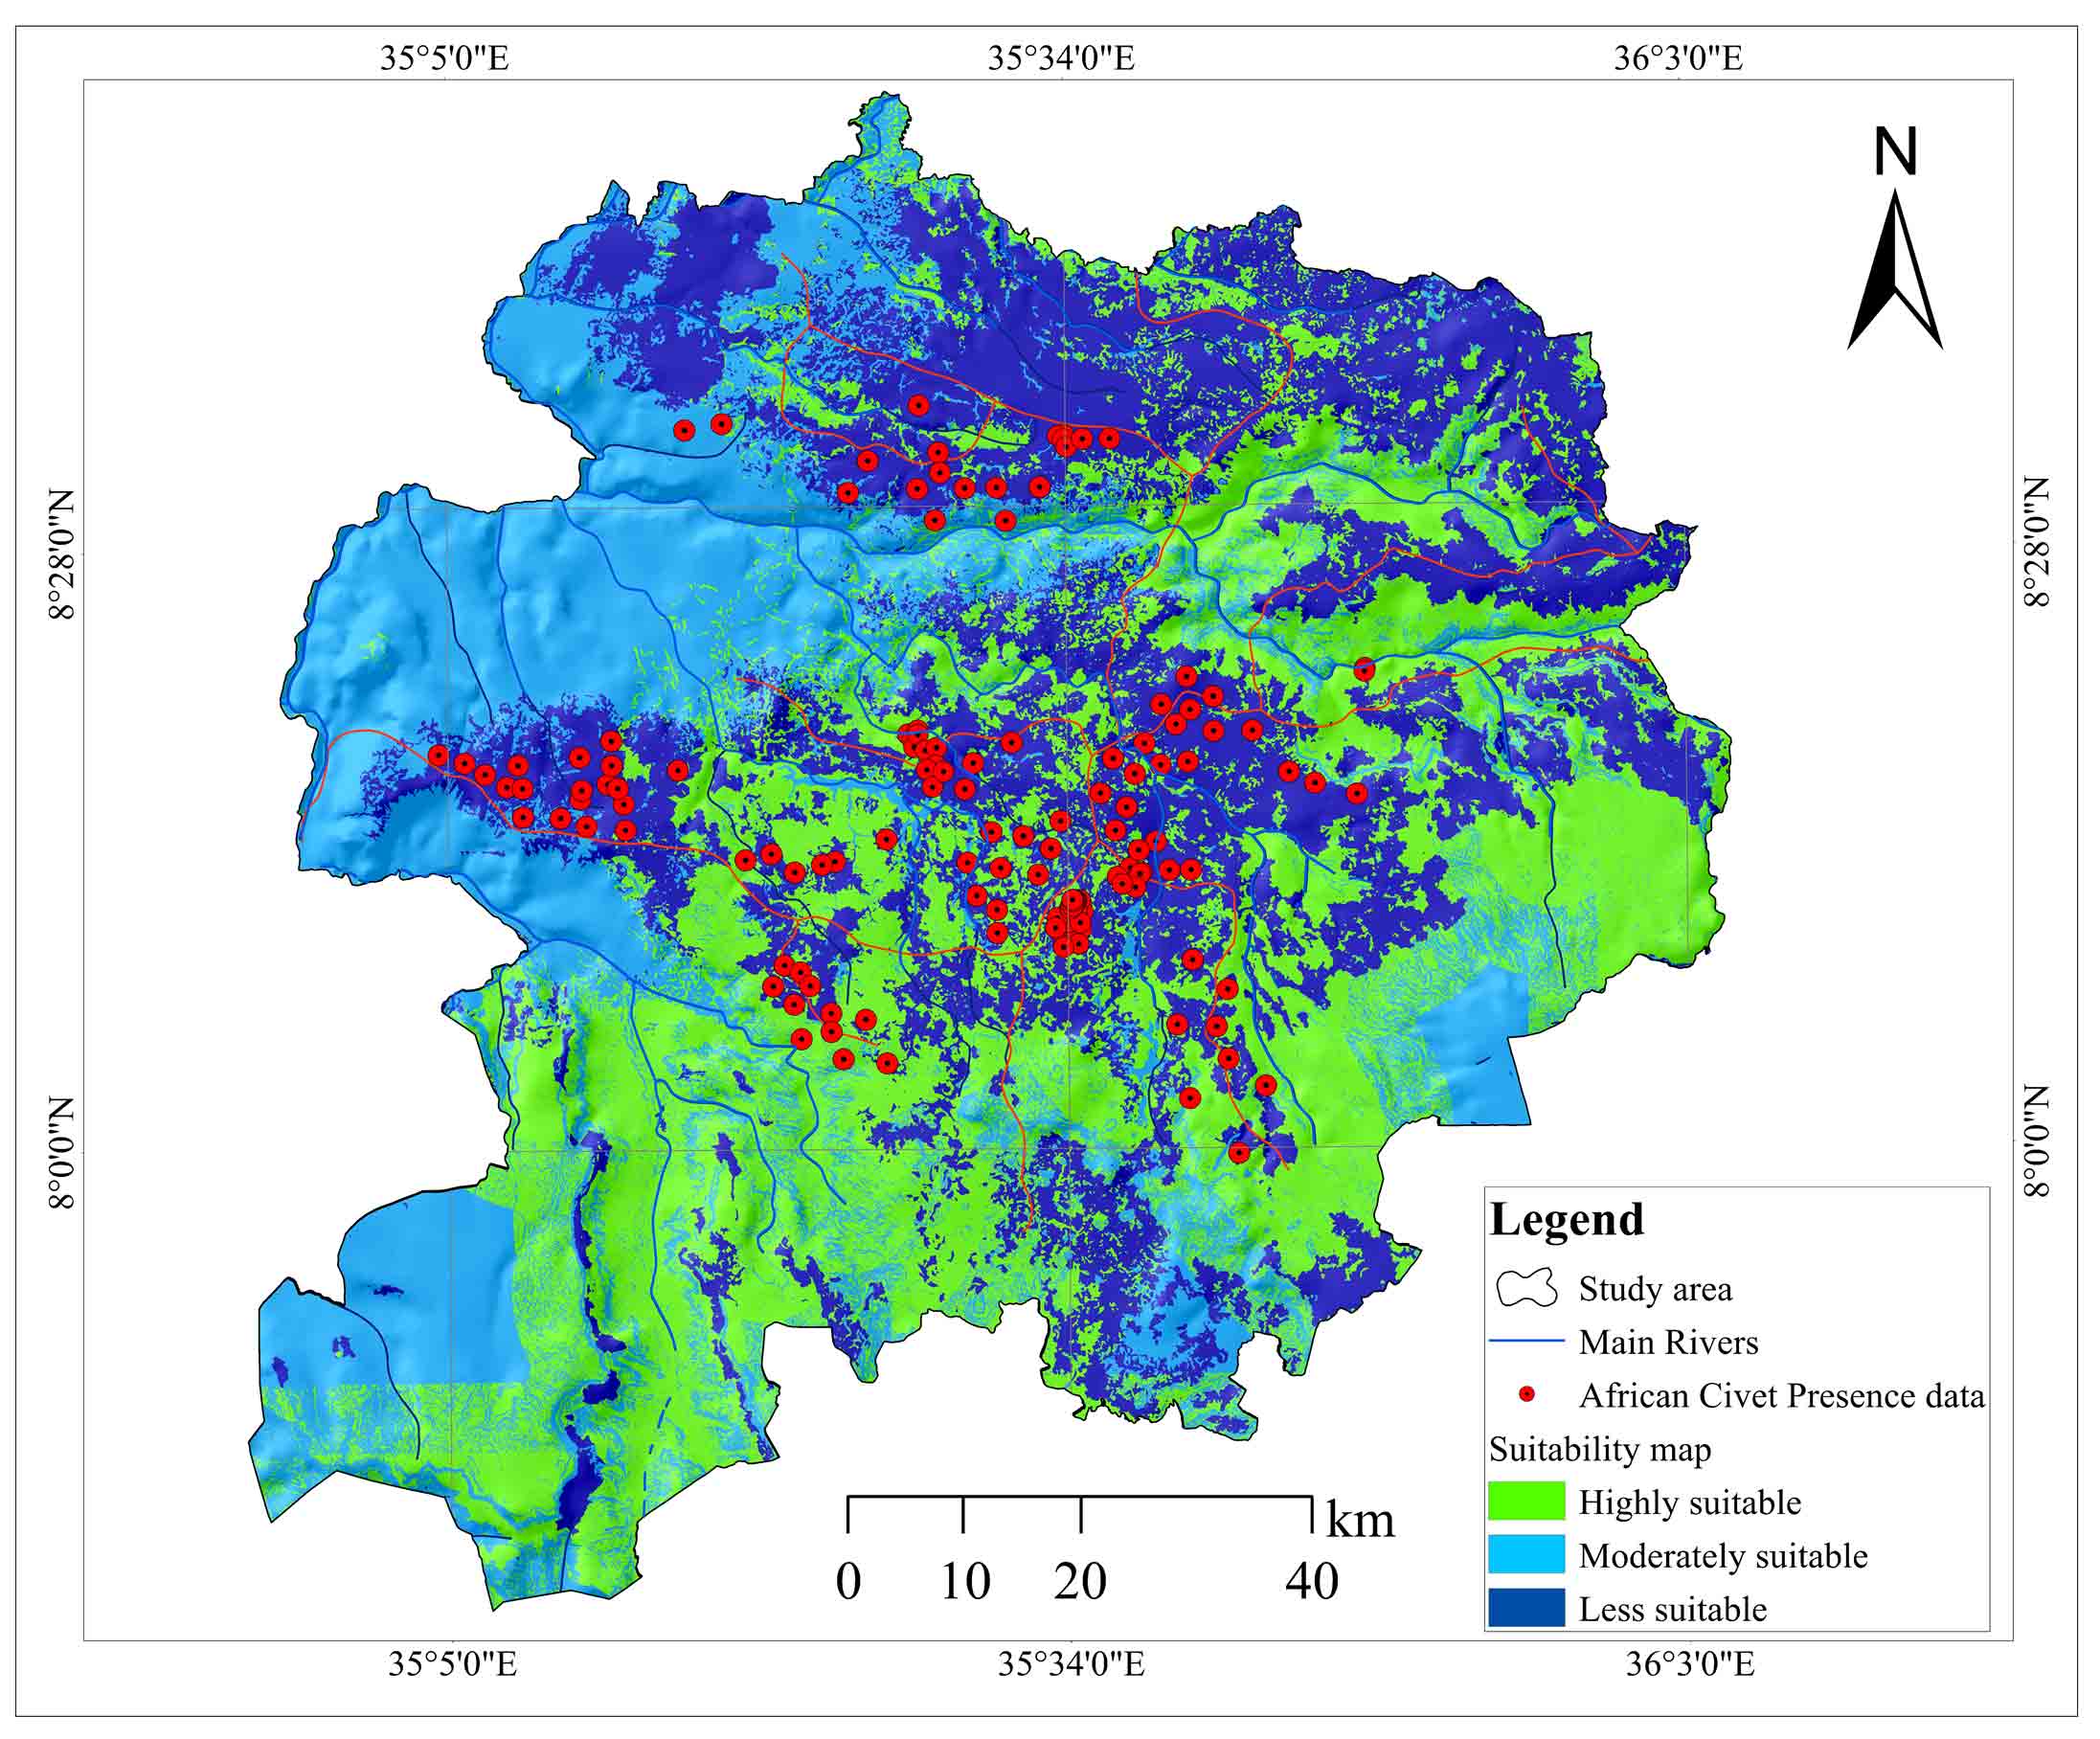
The civet habitat suitability map of the study area (Figure 7) was generated by integrating the thematic layers of slope, drainage, road, settlement, LULC and then computing suitability model using equation (1) and Table 2 mentioned above. The LULC types, within a distance of 6 km from human habitation with road access have emerged as suitable, while regions within 3 to 6 km with less vegetation cover and away from water bodies have formed moderately suitable and areas >6 km from human habituation with roads and dense vegetation cover have proved less suitable for the civets. Dense vegetation cover was found in areas >3 km from human settlements. Eigen vector ratio matrix of the pair-wise comparison has confirmed that the consistency ratio was 0.04. Suitability model map gave the highest weight for the LULC factor and denoted water resources as second important factor. Some parts of the sampled sites were under highly preferred class for civets, whereas others fell under moderately to less preferred classes. Most of the presence data recorded was around settlements, farms and degraded forests (Figure 7). As a whole, present findings have revealed that the African Civets mostly prefer areas around human habitation, followed by dense forests as their habitat. The Civets were only sparsely distributed in shrub land located away from human settlements in the western part of the study area.
Table 6 shows habitat suitability areas of the civets. Out of a total area of 6, 80,592km2, 36.45% falls under category ‘suitable’ followed by 31.03% moderately suitable and 32.52% less suitable categories. Validation of the output map (tested by overlaying all GPS points of presence data spot points) revealed that the civet areas were located in very high most of susceptibility areas (Figure 7).Validation of a suitability model is usually carried out to determine the prediction ability of the model by comparing the predicted result with the reference map.
Table 5. LULC class change rate between 1985 and 2018
|
Land use / land cover classes
|
Area (km2)
|
Overall change (%)
|
|
1985
|
2018
|
|
Forest
|
5564.4
|
4465.36
|
21.1
|
|
Wetland
|
334.78
|
102.10
|
16.51
|
|
Shrubs
|
1743.29
|
1321.04
|
18.31
|
|
Settlements
|
72.28
|
297.52
|
−16.41
|
|
Agriculture
|
2718.22
|
4207.97
|
−22.13
|
4 . DISCUSSION
Land-use and land-cover is considered as an upper most layer of the Earth that changes both by natural and anthropogenic factors (Misrak et al., 2012; Datiko and Bekele, 2014; Mekasha et al., 2020). Such changes are effectively captured by remote sensing satellite sensors with different spectral, spatial, and temporal resolutions. The present study proves the relation of dense forest habitats and the civet population density via habitat suitability modeling and mapping. The attempt also correlates suitable habitats with the abundance of the species. Establishment of civetries and scent-marked sites in the habitats are special behavioral features of the African civets. These features were gathered from field observations to confirm the presence of African civets in the Illu-Abbabora Zone. The presence of the civets is seen more in disturbed areas around human habitats and only sparsely seen in remote areas of dense forests in the study area. The results of this study indicate that the ability of the model and the methodology are an effective and simple for the prediction of potential habitats of African civets in the area.
Remote sensing and GIS amalgamated with Habitat Suitability Index (HSI) model provide an efficient, low cost method for determining habitat quality and requirement of wild animals in the forest as opined by Schamberger and Krohn (1982). Even though the technique is less used due to limited knowledge of the biologists it did already prove as to be a powerful tool in the acquisition of accurate and up-to-date information effectively applicable to the civet habitat findings and ecosystem monitoring, particularly in inaccessible large areas (De Wulf et al., 1988; Roy et al., 1995; Porwal et al., 1996; Kushwaha et al., 2000, 2001; Kushwaha and Roy, 2002). It is possible to quantify and analyze wildlife attributes, and wildlife status, identification of new sites for protected areas, impacts on wildlife habitat in the context of logging, agricultural expansion and road development through habitat suitability modeling and LULC changes patterns. A variety of information on wildlife habitats obtained from RS and GIS are found to be useful guides in wildlife management. The primary value of RS is that it can substantially reduce the need for laborious conventional ground survey, as ground surveys in wildlife habitat evaluation are time consuming, costly and inadequate in the case of inaccessible areas (Berwick and Saharia, 1995; Rawat and Kumar, 2015).
By developing a model civet farm in the study area in consultation with the concerned Government Agency, breeding colonies could be maintained so as to have sufficient number of civets for carrying out the farming practices. Such a practice would support the farms with number of Civets from time to time, and no fresh trapping from the natural habitats required for to particularly continuing the Civet farming practices in the country. Ethiopian civet farmers may be trained to maintain such farms where they can have individuals born to their own captive Civets, and thus reduce the pressure on natural populations. The present results indicate that over 36.45% of the Illu-Abbabora Zone area is an inappropriate habitat region for African civets. The present investigation, thus, infers that incorporated GIS with AHP technique is an effective device for determining the African Civets suitability sites. Earlier, similar conclusions were made by Zarri et al. (2008). Melese et al. (2014) utilized RS and GIS strategies in combination with AHP to conduct habitat suitable analysis for African civet habitat mapping in Andracha area in Ethiopia. The area is a main source locality of good-quality of civets in Ethiopia. The criteria considered included land-use, river, slope, road, settlement etc. It was beyond the scope of the present study to conduct in-depth methodological changes on suitability parameters, assuming that the pros and cons of this model are well known and widely described in literature. However, it is recommended that future researchers may make any modifications in the suitability model based on the points mentioned above in developing of a suitability model.


 ,
Mintesnot Berhanu 2
,
Mintesnot Berhanu 2