The paper introduces a satellite-based tool, Soil Water Index (SWI) to monitor droughts.
The paper addresses the issue of farmer-suicides in Maharashtra and explores the use of SWI in monitoring the suicide rate.
It finds that drought is not a dominant factor in causing farmer suicides.
The paper explores the potential of SWI in monitoring crop yields and precipitation.
Multi-year drought conditions produced greater impact on farmers resulting in better relationships with SWI.
Abstract
Yavatmal is one of the drought prone districts in Maharashtra state of India and has witnessed an agricultural crisis to the extent that hundreds of its farmers have committed suicides in recent years. Satellite data based products have previously been used globally for monitoring and predicting of drought, but not for monitoring their extreme impacts that may include farmer-suicides. In this study, the performance of the Soil Water Index (SWI) derived from the surface soil moisture estimated by the European Space Agency’s Advanced Scatterometer (ASCAT) is assessed. Using the 2007-2015 data, it was found that the relationship of the SWI anomaly was bit stronger (coefficient. of correlation = 0.59) with the meteorological drought or precipitation than with the agricultural drought or crop yields of major crops (coefficient. of correlation = 0.50). The farmer-suicide rate was better correlated with the SWI anomaly averaged annually than with the SWI anomaly averaged only for the monsoon months (June, July, August, and September). The correlation between the SWI averaged annually increased to 0.89 when the averages were taken for three years, with the highest correlation occurring between the suicide rate and the SWI anomaly averaged for three years. However, a positive relationship between SWI and the suicide rate indicated that drought was not a major factor responsible for suicide occurrence and other possible factors responsible for suicide occurrence need to examine in detail.
Droughts occur, globally, whenever the amount of seasonal or annual rainfall turns out to be inadequate to support various water-dependent activities prevalent in the region. These natural phenomena, if not handled wisely, can produce devastating impacts on a nation’s economy. Better monitoring and predicting of droughts contribute to minimizing drought impacts. Various approaches including those involving satellite data have been applied for improving drought monitoring and predicting. If droughts occur in successive years, their impacts magnify and a situation of an agricultural crisis may emerge. As a result, farmers who are unable to cope with the stress due to financial, physiological, or other social factors may commit suicides as has happened in recent decades in various states of India (Vaidyanathan, 2006; Nagraj, 2008; Deshpande and Arora, 2011; Kale et al., 2014) as well as in other countries, for example, in Australia (Page and Fragar, 2002), China (Conner et al., 2007), Canada (Pickett, et al., 1998), France (Bossard et al., 2016), and the United States (Stallones, 1990).
Various reasons, including droughts, are attributed to farmer-suicide occurrence. While satellite data and their products have been applied for drought monitoring and predicting (Boken et al., 2005; Boken, 2009; Kulkarni et al., 2020, Martinez et al., 2016; Mukherjee et al., 2018; Sanchez et al., 2018; Pandey and Srivastava, 2019), their potential has not been explored in monitoring the extreme manifestations of droughts that could lead to farmer-suicides. The goal of the present study was to examine the potential of the Soil Water Index (SWI) derived from the Surface Soil Moisture (SSM) estimated using Advanced Scatterometer (ASCAT) sensors onboard satellites (Wagner et al,. 1999; Bartalis et al., 2008; Brocca et al., 2011; Paulik et al., 2014). Since the satellite data based soil moisture estimates are available for areas across the globe and the farmer-suicides too have occurred in various parts of the world, the present study assumes a global significance.
In case of India, droughts have impacted various states to varying degrees (Sanghmitra, 2013). Farmers have committed suicides across different states but Maharashtra has reported the highest number of suicides by farmers in the past couple of decades. Dhaktode (2020) found that Maharashtra faced severe drought every 7 to 10 years in the majority of districts and its farmers preferred planting commercial crops, such as cotton, that are subjected to significant price fluctuations. Parida et al., (2018) found that the farmer-suicide rate was higher in the cotton-producing areas in India. The objective of this study was to examine the relationship of SWI with precipitation (or meteorological drought), crop yield (or agricultural drought), and the farmer-suicide rate for the Yavatmal district, where the farmer-suicide rate was highest at the district level in Maharashtra.
2 . STUDY AREA
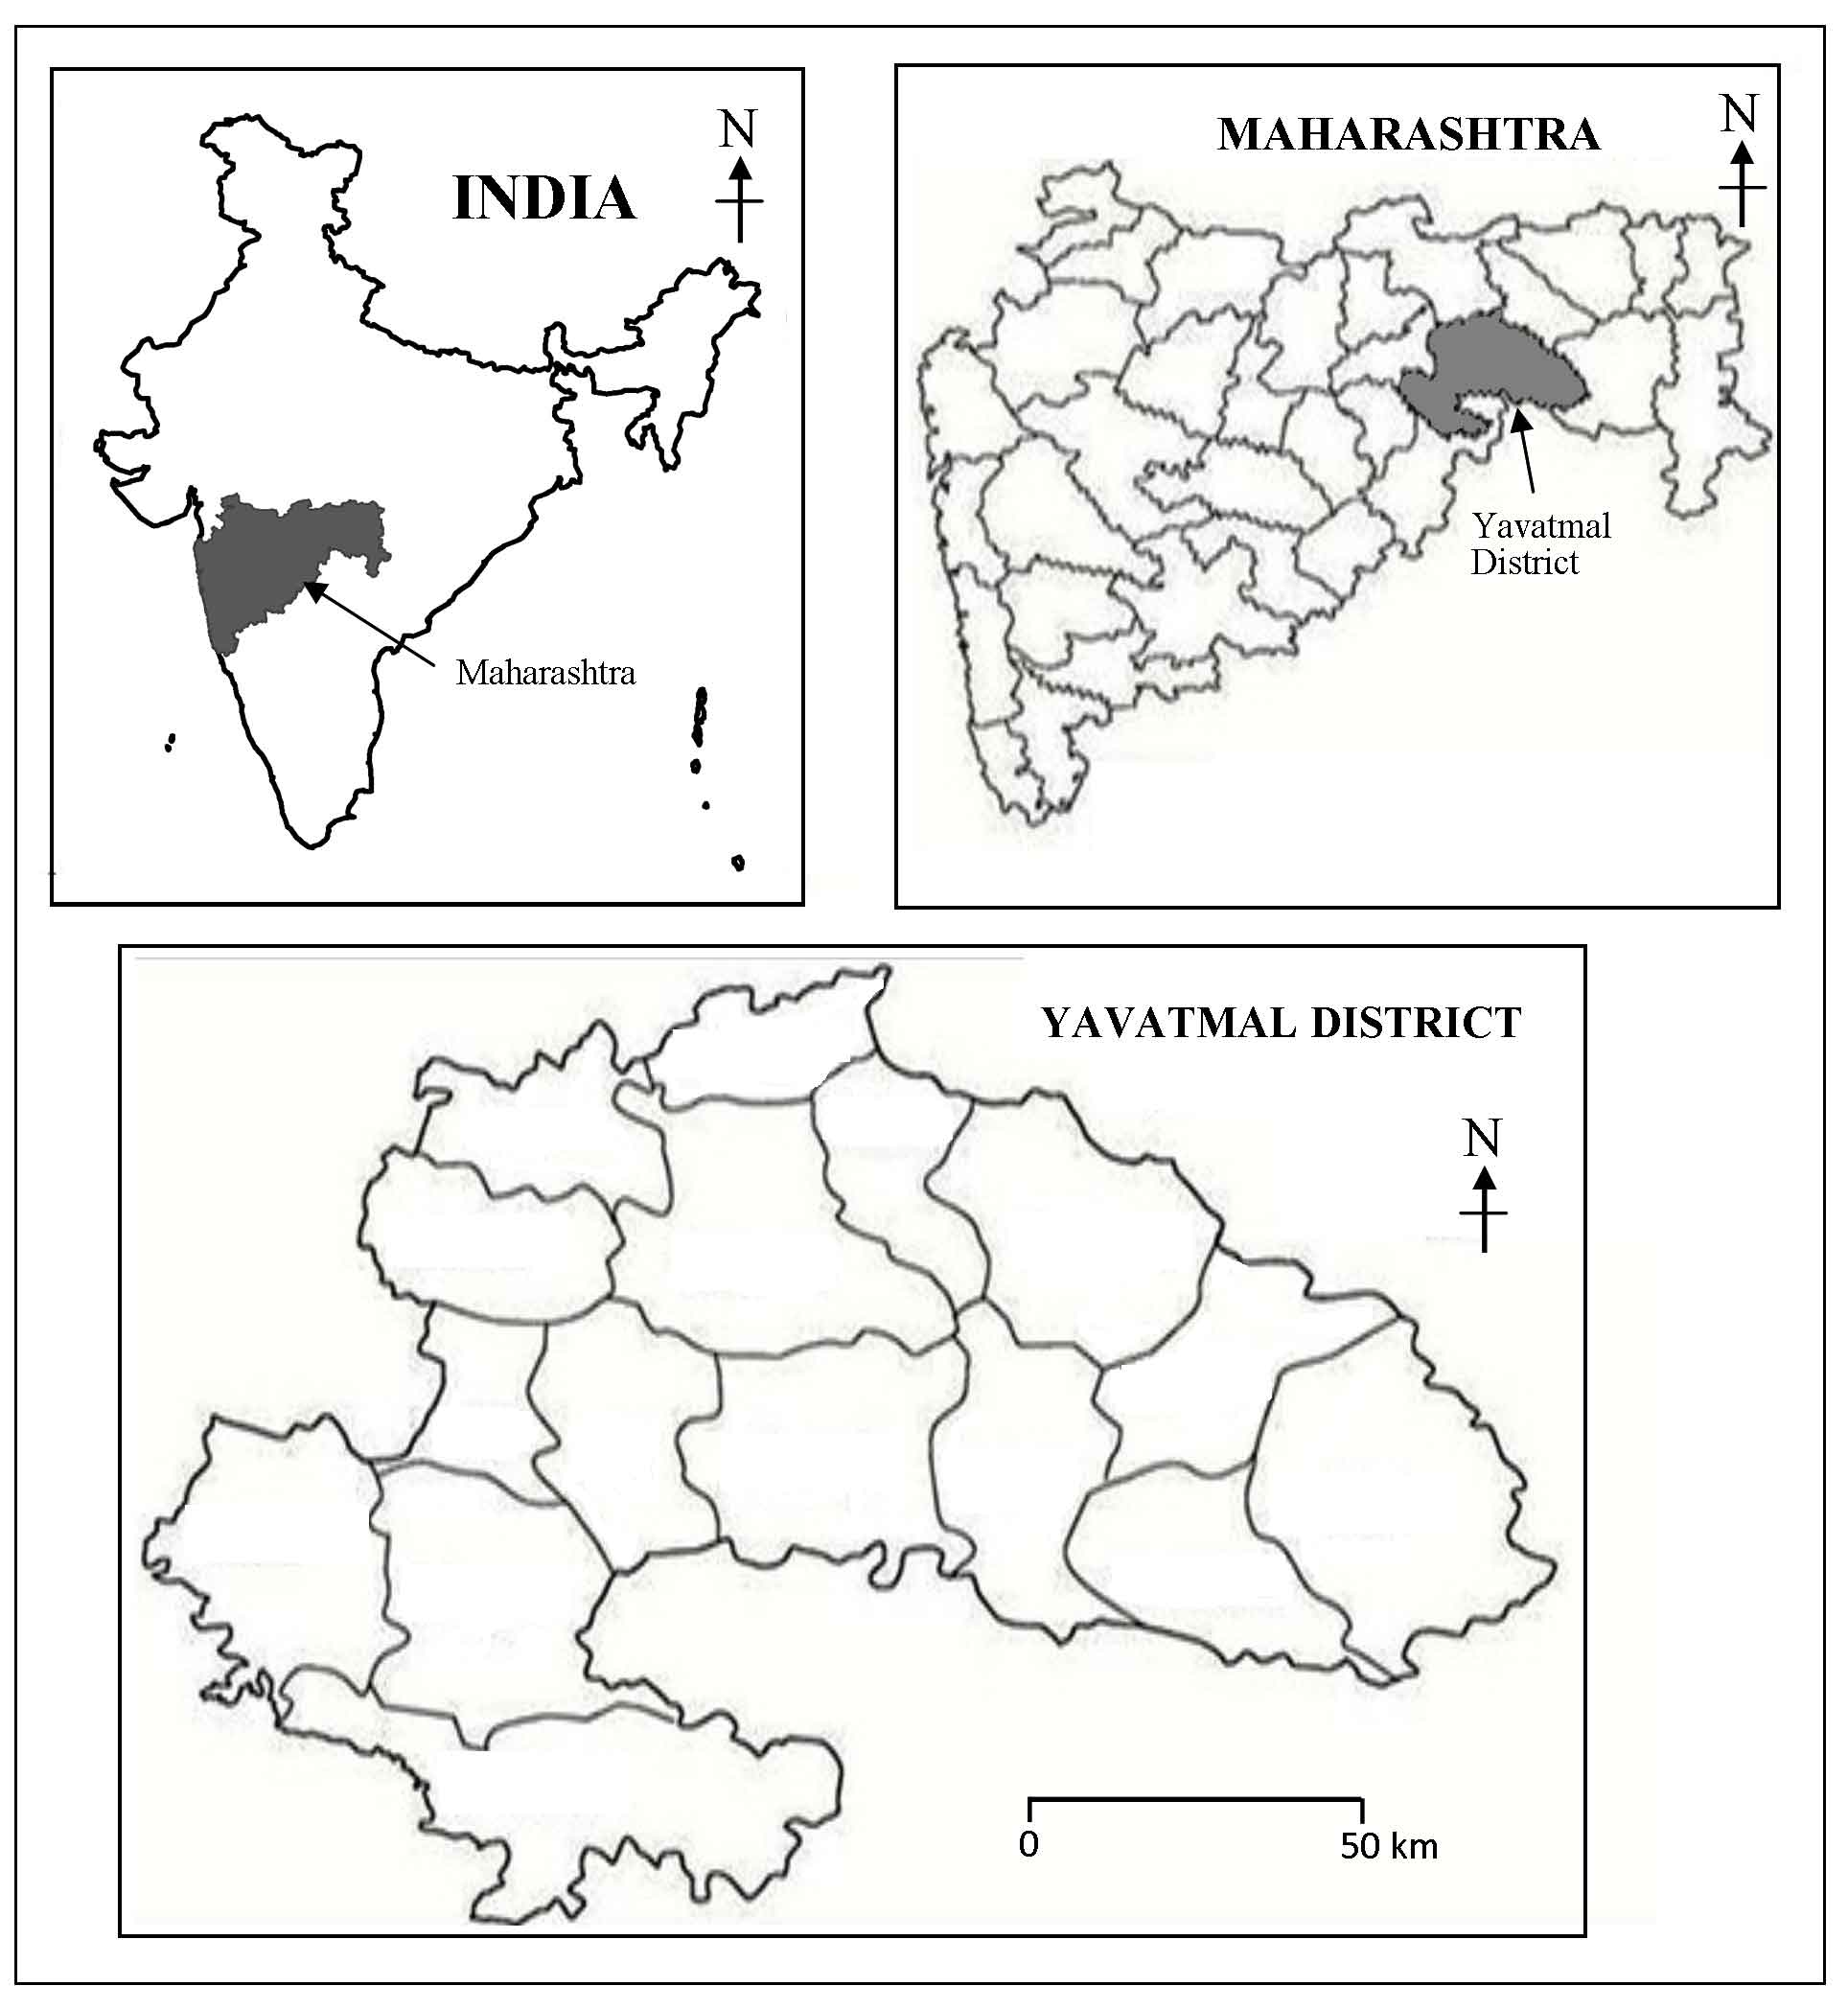
Yavatmal district of Maharashtra (Figure 1) is part of the Vidarbha region that has witnessed more number of suicides than any other region of Maharashtra. The administrative boundaries of the district lie between 19.26° and 20.42° North latitudes and between 77.18° and 79.90° East longitudes occupying about 13582 km2 (i.e. about 4.4 percent of the total area of the state). About three million people live in the district. The
Figure 1. Study area: Yavatmal District (India)
harvested area under different crops has varied over time. Cotton, soybean, sorghum, pigeon pea and chickpea are the main crops of the district and their harvested area has varied over time. During the 2000-2005 period, the cotton area had a declining trend, but since 2005 the cotton area is witnessing an increasing trend. Since 2000, the soybean area has exhibited an increasing trend at the cost of the sorghum area that has declined over years. The harvested area for chickpea or pigeon pea has not changed noticeably. The average maximum temperature of 45°C reaches in May while the average minimum temperature of about 5.6°C occurs in December. Kharif and Rabi are the two main cropping seasons with main crops being planted in the Kharif season. The annual rainfall averaged for recent years turned out to be about 910 mm. Agriculture in the district depends largely on the monsoon rains that begin in June. Only about 10% of the cropped area is irrigated.
Yavatmal is one of the economically challenged districts of Maharashtra. Farmers face a greater risk in planting commercial crops like cotton and pigeon pea due to the fluctuation in market prices for these crops. Drought occurrence, declining market prices, and other credit-relating issues can affect farm incomes significantly. In recent years, hundreds of farmers have committed suicides in Yavatmal district (Table 1).
3 . MATERIALS AND METHODS
In order to assess the performance of the satellite-based Soil Moisture Index (SWI) in monitoring drought conditions and the suicide rate in Yavatmal district, the following data were collected for the 2000-2015 period: SWI values, agricultural data (area, yield, and production of major crops), precipitation data, and the number of reported suicides by farmers. Data on farmer-suicides occurred after 2015 were not collected because the government changed the definition of a farmer-suicide recorded after 2015, which caused inconsistency in the data.
3.1 Satellite Data Based Soil Water Index (SWI)
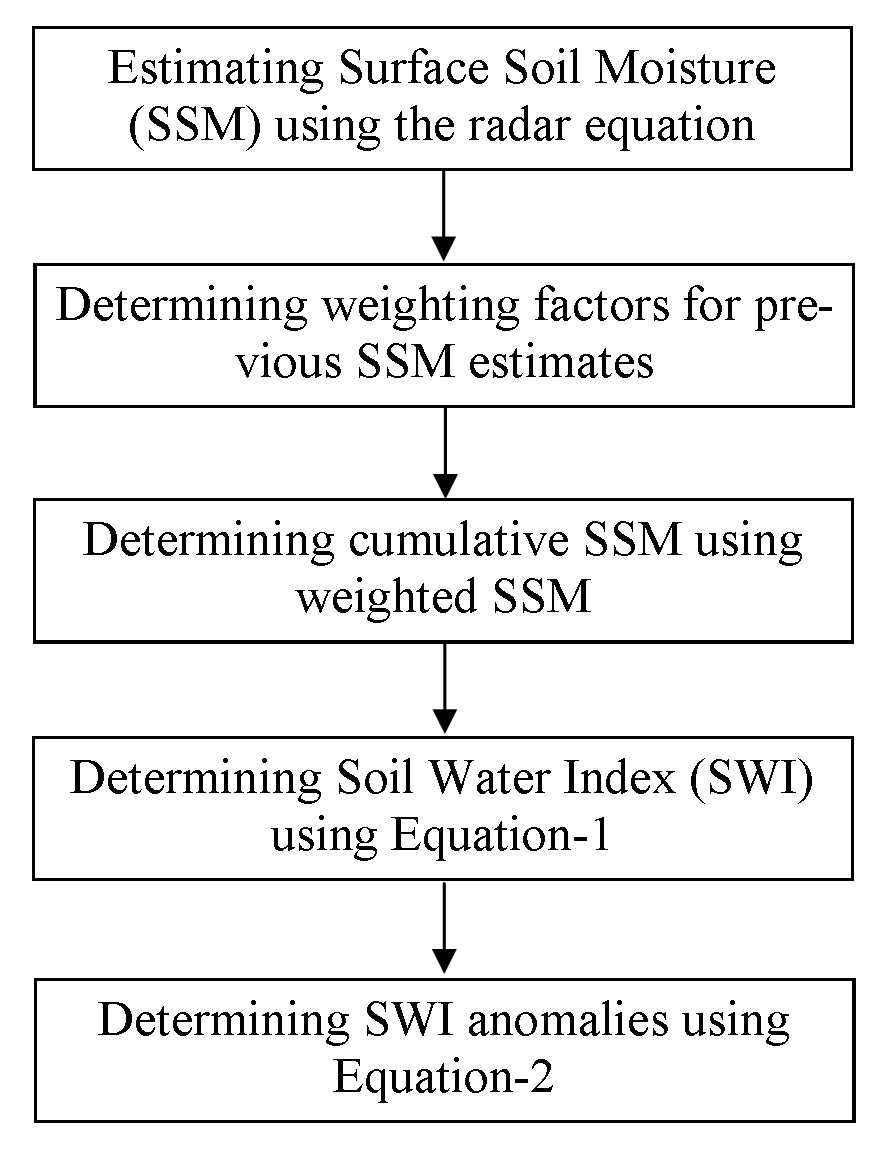
This SWI was derived from the surface soil moisture estimated in the top 5 cm layer of the ground by using advanced microwave sensors, onboard meteorological satellites, with a spatial resolution of about 12.5 to 25 km. The surface soil moisture was retrieved following an algorithm described in Wagner (1999) and Paulik et al., (2014) using a radar equation involving the backscatter coefficient and dielectric properties of soils that are affected by the soil moisture. The SWI algorithm was based on a simple model describing the infiltration process of the surface soil moisture. The infiltration process was modeled with SWI being calculated for time tn integrating the surface soil moisture data over a preceding time period T using the following formula:
where, tn represents the observation time of the current measurement, ti are the observation times of the previous measurements. SSM observations were summed up using exponentially weighted recursive formula developed by Albergel et al., 2008. The factor T determines how fast the weights diminish and how strongly SSM observations taken in the past influence the current SWI (Copernicus SWI ATBD). An increased T value represents a deeper soil layer (Paulik et al., 2014).
For this study the 10-day averaged SWI values were available on the Copernicus Global Land Service website for the period beginning January 1st, 2007. The SWI dataset was available with eight different T values, representing different time scales of soil moisture variation and different layers.
Agricultural droughts are strongly influenced by the lack of water availability in the root zone of the soil, hence SWI anomalies can be used as a measure to describe the water deficit in the soil. SWI anomalies used in this study were calculated using the following equation:
\(SWI_{anom_t } = SWI_t- \overline{SWI}\) (2)
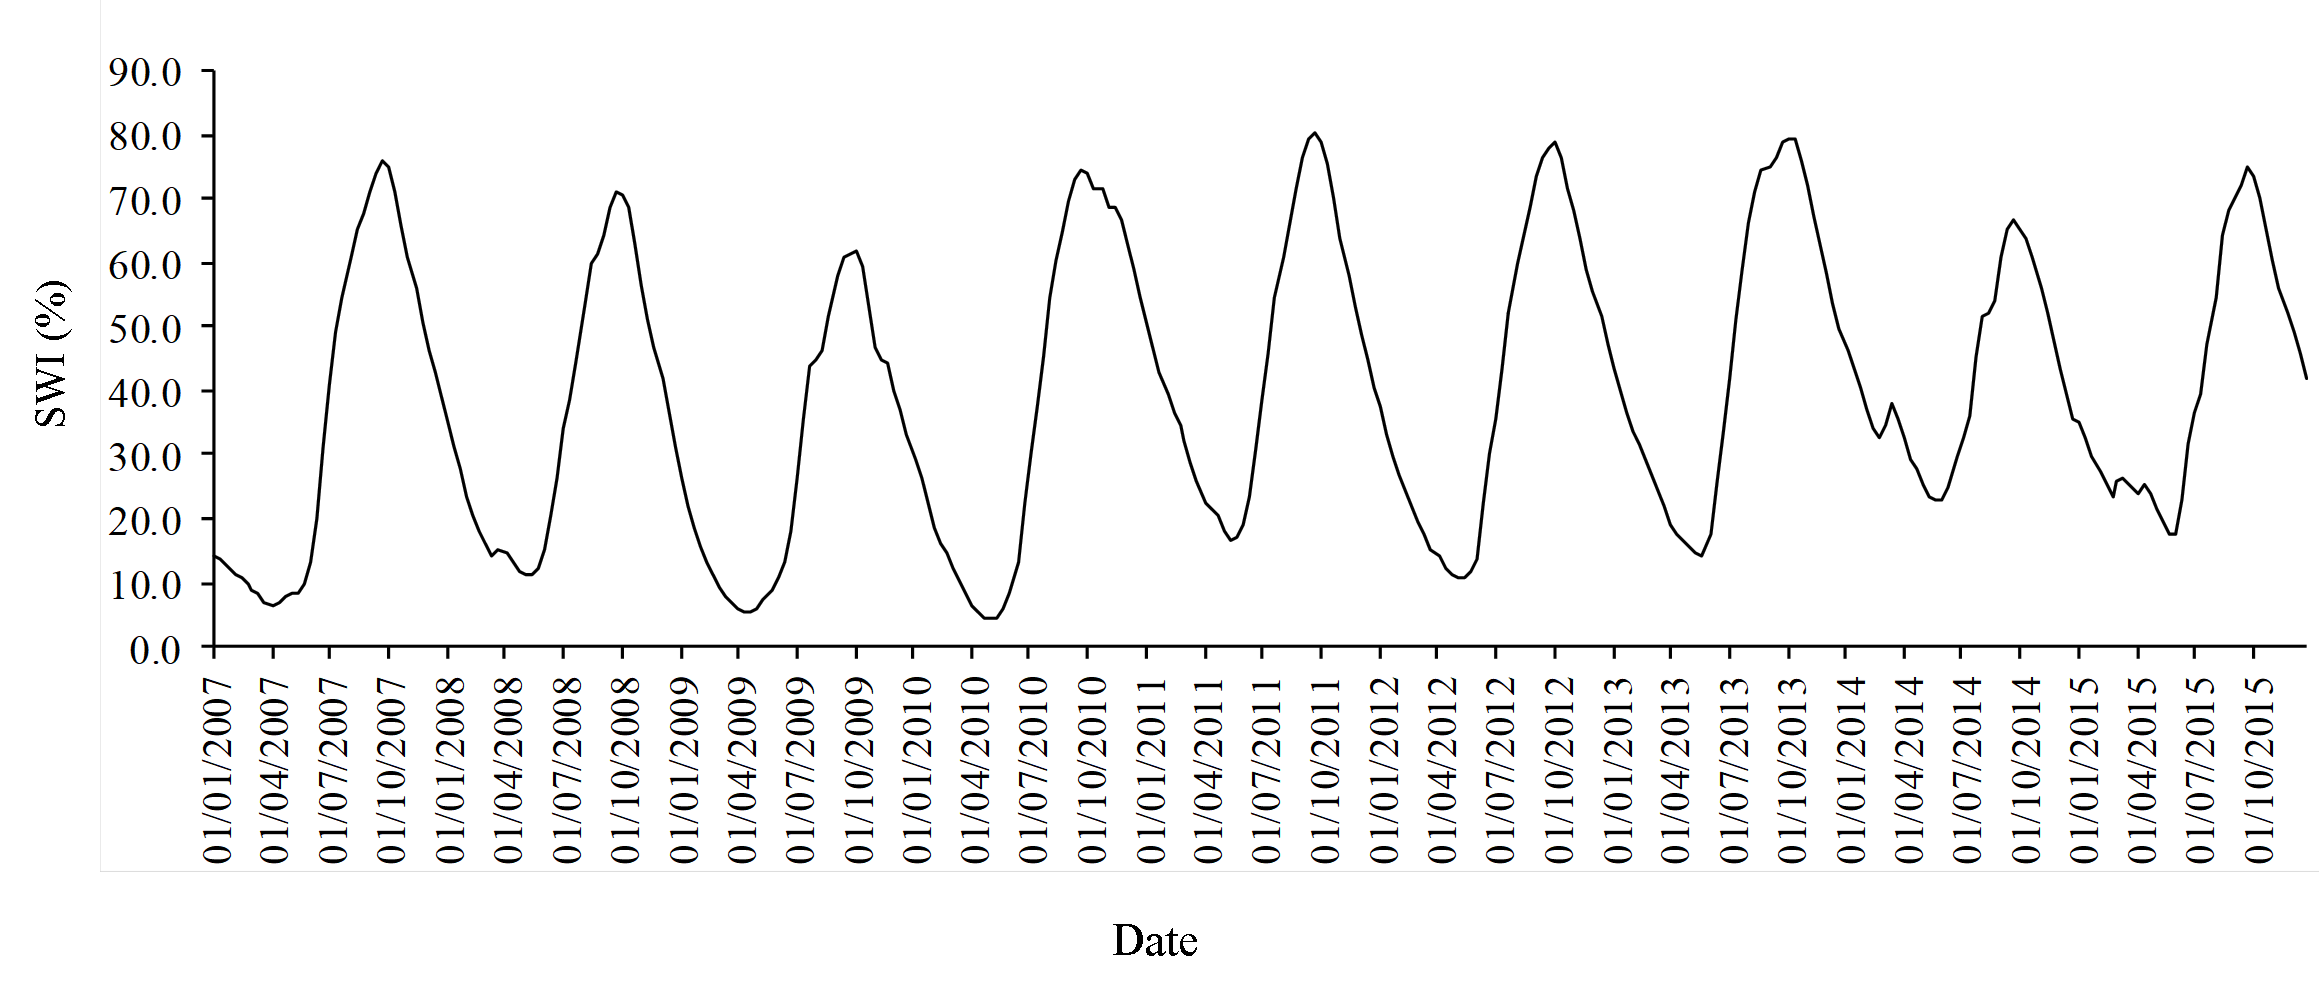
where, \(SWI_{anom_t } \) (Soil Water Index anomaly) is the difference between the \(SWI_t\) (t stands for the 1st, 11th or 21st day of each month) and the average SWI for the same decade over the 2007-2015 period, the common period for which both the SWI data as well as the farmer-suicide data were available. The anomalies, or the deviation from the mean, are expressed in percentages. The SWI data for India were available with the Department of Geodesy and Geoinformation at Technical University Vienna (http://rs.geo.tuwien.ac.at). Table 1 includes these SWI values for the study area and Figure 2 presents their time series.
Figure 2. Variation in the Soil Water Index during 2007-2015
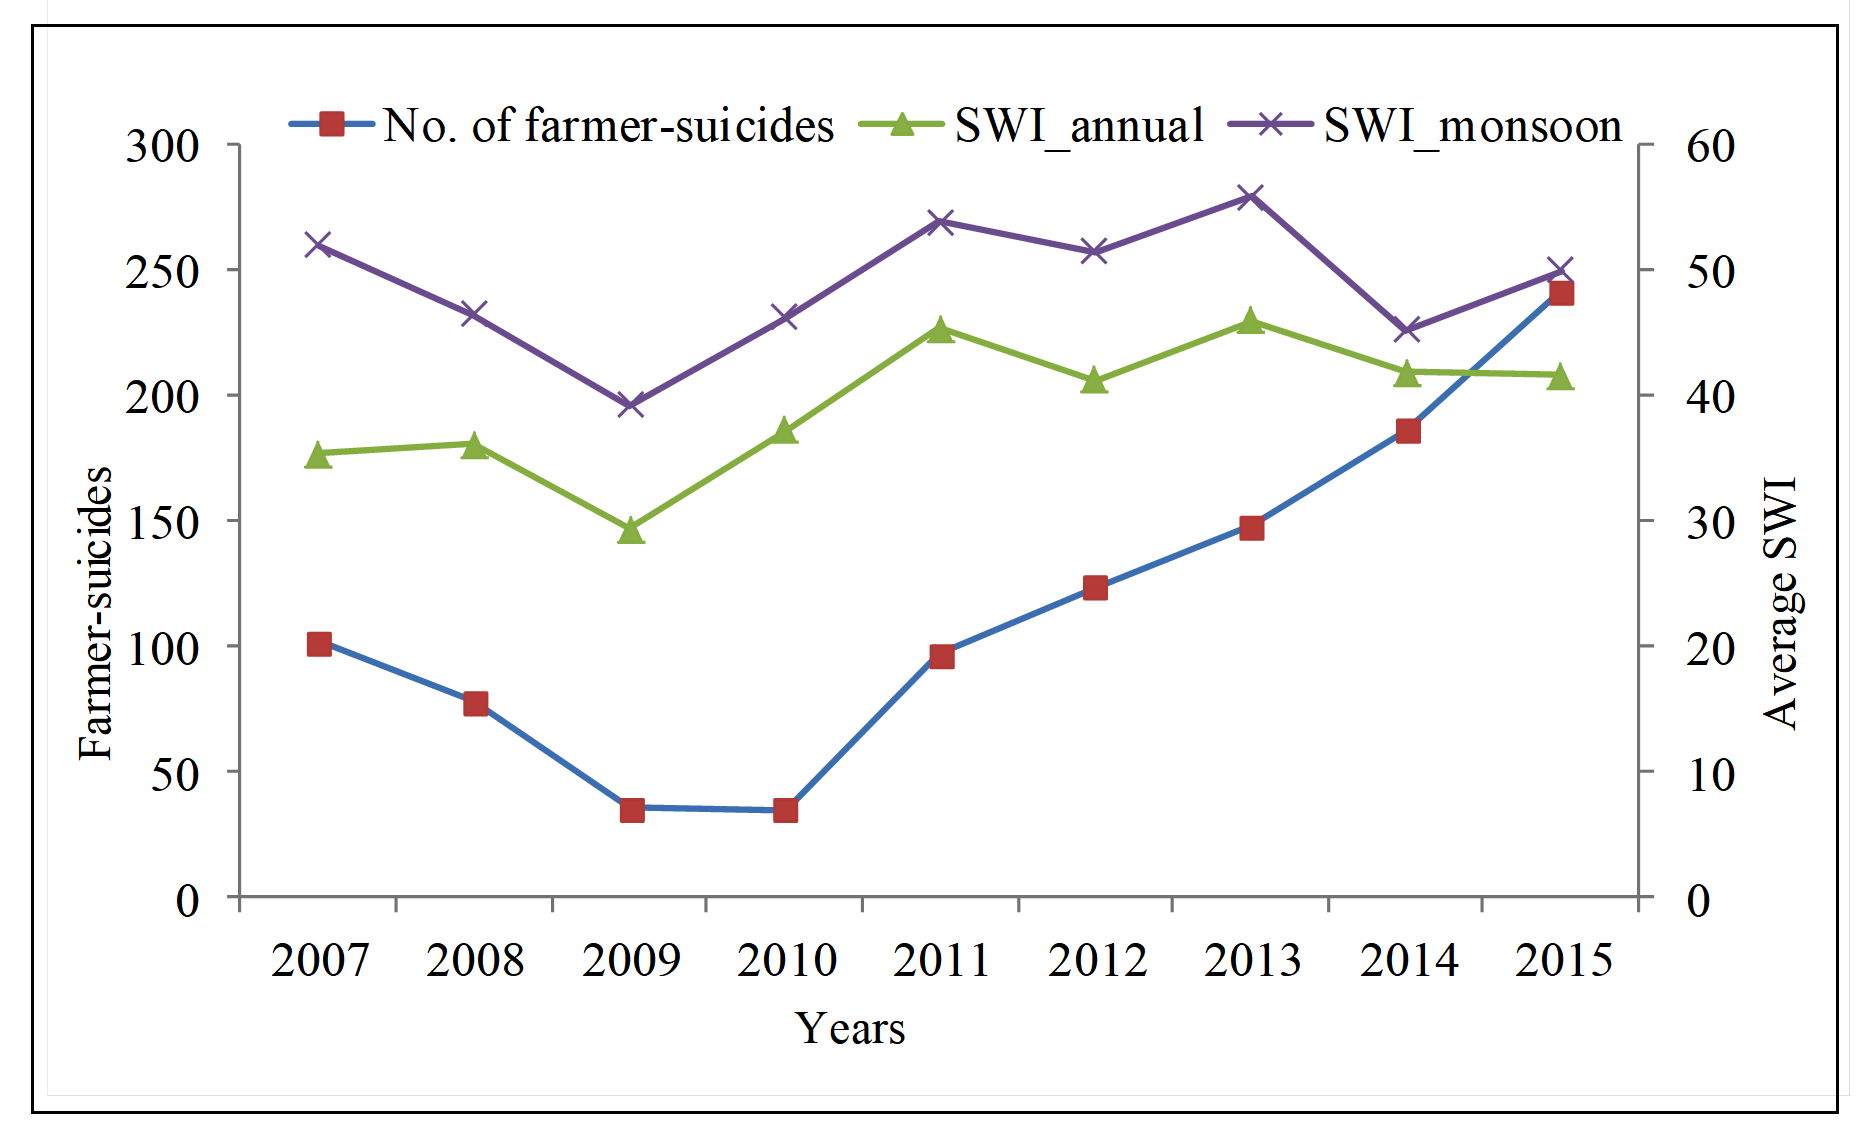
Table 1. The number of suicides and the SWI averaged annually and for monsoon months (June, July, August, and September)
Year
No. of farmer-suicides
Soil Water Index (SWI) averaged for the entire year and for the monsoon months
Single year average
Two-year average
Three-year average
SWI_aa*
SWI_ma**
SWI_2_aa
SWI_2_ma
SWI_3_aa
SWI_3_ma
2007
102
35.4
52.0
2008
78
36.1
46.5
35.8
49.2
2009
36
29.4
39.3
32.8
42.9
33.7
45.9
2010
35
37.2
46.2
33.3
42.7
34.3
44.0
2011
97
45.4
53.9
41.3
50.0
37.3
46.5
2012
124
41.3
51.5
43.3
52.7
41.3
50.5
2013
148
46.0
55.9
43.6
53.7
44.2
53.8
2014
186
41.9
45.2
43.9
50.5
43.1
50.9
2015
242
41.6
50.0
41.7
47.6
43.1
50.4
Coeff. of corr. between the no. of suicides and SWI anomaly
0.60
0.38
0.79
0.52
0.89
0.75
*aa indicates the annual average, ** ma indicates the average for monsoon months (June through September)
3.2 Agricultural and Weather Data
Cropped area, yields, and production of different crops were collected from the agricultural database available at the International Crops Research Institute for the Semi-Arid Tropics (ICRISAT). Monthly precipitation data were collected from the ICRISAT database for 2000-2011 period, and from India Meteorological Department (IMD) for the remaining 2012-2015 period. Figure 3 presents a flowchart showing different steps involved in the methodology.
Figure 3. Methodology
4 . DATA ANALYSIS
The following relationships were examined to explore the potential of SWI in monitoring droughts and the farmer-suicide rate: SWI versus precipitation, SWI versus crop yields, and SWI versus farmer-suicide rate, by determining the coefficient of correlation.
4.1 Meteorological Drought
Meteorological droughts occur when the seasonal or annual precipitation falls short of the average precipitation. The coefficient of correlation between the monthly SWI anomaly and the monthly precipitation during the 2007- 2015 was found to be 0.59.
4.2 Agricultural Drought
Agricultural droughts occur when the crop yields fall below the average crop yields. Out of many crops grown in the district, four crops (cotton, soybean, pigeon pea, and sorghum) that ranked higher on the basis of harvested area were included in the analysis. The harvested area, as percent of the total cropped area, averaged for 2000-2014 period were 44% for cotton,
27% for soybean, 11% for pigeonpea (tur) and 6% for sorghum. SWI was averaged for the monsoon months (June, July, August, and September) and was correlated with crop yields in order to examine the relationship of SWI with agricultural droughts. The coefficient of correlation with the SWI anomaly was found to be 0.51 for cotton, 0.46 for soybean, 0.50 for the pigeon pea, and 0.48 for the sorghum yields (Table 2).
Table 2. The data on farmer-suicide rate, precipitation and crop yields
Years
Farmer-suicides
SWI
Precipitation (mm)
Crop yields (t/ha)
aa*
ma*
Annual average
Seasonal: June-Aug. (mm)
Sorghum
Pigeon pea
Soybean
Cotton
2001
7
817.1
677.3
1.20
1.22
1.30
0.17
2002
23
897.2
719.5
1.10
1.16
1.19
0.09
2003
30
840.5
746.0
1.09
1.27
1.30
0.12
2004
79
471.0
356.8
1.18
1.01
1.36
0.13
2005
97
1295.5
910.1
1.03
0.80
1.45
0.17
2006
145
1290.0
867.5
0.98
0.65
0.54
0.15
2007
102
35.4
52.0
796.1
548.4
0.77
0.81
1.12
0.15
2008
78
36.1
46.5
704.5
458.0
0.98
0.98
1.09
0.20
2009
36
29.4
39.3
499.5
369.8
1.08
1.08
1.25
0.41
2010
35
37.2
46.2
1134.8
897.9
0.97
0.60
0.33
0.32
2011
97
45.4
53.9
783.2
643.3
0.52
0.69
0.41
0.22
2012
124
41.3
51.5
928.7
688.9
0.76
0.74
1.38
0.27
2013
148
46.0
55.9
1317.5
1065.3
1.29
0.86
1.35
0.25
2014
186
41.9
45.2
763.6
475.1
1.15
1.10
1.64
2.10
2015
242
779.5
779.5
Coeff. of corr., with SWI_aa
0.59
0.22
0.48
0.50
0.46
0.51
aa* refers to annual average, ma* refers to the average for monsoon month (June, July, and August)
4.3 SWI Anomaly versus Farmer-Suicide Rate
Cumulative impacts of droughts occurred in successive years may lead farmers to commit suicides. Therefore, the farmer-suicide rate was correlated with the SWI anomaly averaged annually as well as for monsoon months (June, July, August, and September) for the same year, for the same and the previous year (2-year average), and for the same year and the previous two years (3-year average) as shown in Table 1. The coefficient of correlation between the suicide rate and the SWI anomaly averaged for the entire year (SWI_aa) was found to be 0.60 for the same year, 0.79 for the 2-year average and 0.89 for the 3-year average. The coefficient of correlation between the suicide rate and the SWI anomalies averaged only for the monsoon months was found to be relatively lower. This coefficient was 0.38 for the same year, 0.52 for the two-year average, and 0.75 for the 3-year.
5 . RESULTS AND DISCUSSION
The above analysis revealed that the farmer-suicide rate was correlated more strongly with the SWI anomaly averaged annually than with the SWI averaged only during the monsoon months. The relationships of SWI was little stronger (coefficient of correlation = 0.59) with the monthly precipitation or meteorological drought than with the crop-yields or agricultural drought (coefficient of correlation about 0.5 for major crops). An agricultural drought based on crop yield is more complex than precipitation based meteorological drought and depends more on the temporal and spatial distribution of the soil moisture.
The farmer-suicide rate was correlated more strongly with the SWI anomaly averaged annually than with the SWI anomaly averaged only during the monsoon months. It implies that farmers feel the impact of drought conditions prevailing over the entire year covering all cropping seasons than the Kharif season alone. Further, the multi-year droughts tend to impact farmers’ conditions more than the single-year droughts do.
From the analysis presented in this study, it is evident that the relationship between SWI and crop yields is more complex than the relationship between SWI and precipitation. Further, crop yield tends to have a positive relationship with the farmer-suicide rate in Yavatmal district. It also leads to conclude that the farmer-suicide rate did not tend to increase with the reduction in crop yields or precipitation. Drought occurrence, contrary to a popular belief, doesn’t seem to increase the suicide rate. Other factors, such as those relating to socio-economic, psychological, and mental-health conditions, and to the credit availability and high interest-rate issues may play a greater role in causing farmer-suicides.
6 . CONCLUSION
The Soil Water Index anomalies derived from the soil moisture estimates using ASCAT sensors was fairly correlated with the precipitation while its relationship with yields of major crops in Yavatmal district was bit weaker. The SWI averaged during the entire year exhibited a stronger relationship with the farmer-suicide rate than did the SWI anomaly averaged during the monsoon months (June, July, August, and September). Soil Water Index can be used as a variable to monitor precipitation or crop yields in Yavatmal district, but its positive relationship with the farmer-suicide rate tends to conclude that the low crop yields due to drought or inadequate precipitation may not be the reason for the suicide occurrence in the district. Other factors, such as those relating to socio-economic, psychological, mental-health conditions as well as the credit availability and the high interest-rate issues may be playing a greater role, which needs to be further examined in detail.
Tables
Figures
Conflict of Interest
Author declares no conflict of interest.
Acknowledgements
Giriraj Amarnath of the International Water Management Institute (IWMI), Colombo, and Wolfgang Wagner of Technical University, Vienna sent the data on the soil water index, Vinayak Nikam of the Institute of Agricultural Economics and Policy Research, New Delhi helped collect data on crop yields and precipitation. Satish Chandra of the Central Public Works Department (CPWD), New Delhi, helped collect weather data from the Indian Meteorological Department and Chandrashekhar Thakare of Sivshakti Arts and Commerce College, Babhulgaon. District Yavatmal accompanied the author to visit with family members of a few farmers who had committed suicides in Yavatmal district. Author thanks to the above individuals without whose help the study presented here would not have been completed. Author also thanks anonymous reviewers for suggesting changes to improve the manuscript.
Abbreviations
ASCAT: European Space Agency’s advanced scatterometer; IMD: India Meteorological Department; SSM: Surface Soil Moisture; SWI: Soil Water Index.
Boken, V. K., Cracknell A. P. and Heathcote R. L. (Eds.) 2005. Monitoring and Predicting Agricultural Drought: A Global Study, Oxford University Press, New York, 472 pp.