1.Department of Survey of Natural Resources in Environmental Systems, Environmental Studies and Research Institute (ESRI-Sadat), University of Sadat City, Egypt.
2.Department of Environmental Studies, Institute of Graduate Studies and Research, Alexandria University, 22 El-Guish Road, El-Shatby, Alexandria-21526, Egypt.
Promontory is presented main accretion area, unlike the results of the DSAS extension.
It is erosion area, but according to nourishment process it makes it appear like accretion area.
The Burullus area is indicating erosion after calculating the annual scavenging rate between the shoreline of 2017 and 2018.
The two methods showed similarity in results in the Edco area, which shows that the Edco area suffers from erosion.
Abstract
This paper points to changes of the coastline using two ways, calculating the annual rate of erosion using 1) radioactive materials and 2) GIS and DSAS extension. Finally, both results were verified. Radioactivity results indicate both erosion and accretion zones, the annual scavenging rate in Promontory area shows that it is presented main accretion area, unlike the results of the DSAS extension, which showed that the Promontory is erosion area. The Burullus area annual scavenging rate results showing erosion, despite results of DSAS, it shows that it is an accretion area, but this was clarified by calculating the average distance between the shoreline of 2017 and 2018, and the 2018 shoreline retreat with an average distance 41.4 cm, which makes the Burullus region suffer from erosion. Two methods showed similarity in results in the Edco area, which shows that the Edco area suffers from erosion.
Keywords
Radioactive Material , Remote Sensing , Nile Delta , Coastal Stability
1 . INTRODUCTION
The coastal zone is one of the most diverse and dynamic environments in the earth system (Thankappan et al., 2018). Nile Delta with its special rectangle shape and fertile soils consider as the most important zone in Egypt. Unfortunately, during the last years Nile Delta suffered from several impacts. Those impacts either natural like climate changes and its effect on sea level (El-Hattab, 2015) or man-made (like building dams, barrages, and uncontrolled urbanization (El-Hattab, 2016). In addition, recently all the agricultural lands in Egypt suffered from enormous risk according to the political instability during this period (El-Hattab, 2015).
Erosion and accretion gain naturally by environmental factors like wind, currents, tides, terrain change, sediment transportation, storm surges and river discharge, and by direct or indirect human behavior or human activities because of developments and technology for example, and not limited to engineering activities such as seawall, dams, jetty development that called coastal changes (Castelle and Chaumillon, 2019).
Information about coastline and changes in shorelines are very important for management plans and environmental monitoring (El-Hattab, 2015). The coastal studies are an issues of concern to coastal organizers, administration, and engineers as the coast serves as domestic to between 23% and 60% of the world’s populace (Boye and Fiadonu, 2020). Satellite images and GIS are exceptionally imperative procedures for calculating shorelines alter rates and arrives cover changes. Many sources of data for detecting the position of the coastline (satellite images, maps, cross-shore profile survey, etc.). Satellite imagery has a larger ground coverage and revisit capability. Satellite imagery provides an excellent alternative for detecting shoreline changes because of its general availability, extensive ground coverage, sufficient information contents, and the trend of higher spatial resolution.
The resolutions of satellite images have improved in recent years. Thus, the applicability of the images to coastal zone monitoring becomes more promising (Masria et al., 2015). Change detection is a monitoring technique for different land cover over times (El-Hattab, 2015).
Since of getting to be the record of worldwide land-sea conditions at a spatial scale of tens of meter traversing over 37 yrs., multispectral highlights and simple accessibility make landsat reasonable for observing water quality, icy mass retreat, ocean ice development, obtrusive species infringement, coral reef wellbeing, arrive utilize alter, deforestation rates and coastline alter (Kuleli et al., 2011).
Optical pictures are straightforward to decipher and effectively reachable. Retention of infrared wavelength locale by water and its solid reflectance by vegetation and soil make such pictures a perfect combination for mapping the spatial dispersion of arrive and water. Subsequently, the pictures containing obvious and infrared groups have been broadly utilized for coastline mapping (Niya et al., 2013).
Realizing need for assessing the change accurately, USGS developed a system for analysis shorelines (DSAS) as an extension for ArcGIS (Thieler et al., 2005) which is now widely used for calculating the change rate of shoreline migration. DSAS analyzes the shoreline change by subdividing the shorelines into smaller segments by creating transect at right angles to a master shoreline. The master shoreline is usually chosen from among the shoreline models, mainly based on its higher positional accuracy.
Radiation exists in the environment either naturally or because of human activities and practices, radiation arising from natural sources including terrestrial and cosmic origin, and also artificial radioactivity from fallout deposited across the landscape from atmospheric nuclear tests and medical applications. Ponders of natural radionuclides can give us with valuable geophysical data such as the timescales over which normal frameworks are changing or advancing and the basic unthinking causes. They can moreover be utilized to evaluate the radiological or radio-ecological impacts of surrounding radioactivity (Eisenbud and Gesell, 1997).
Beach sands are mineral deposits formed through weathering and erosion of either igneous or metamorphic rock. Among the rock constituent minerals are a few characteristic radionuclides that contribute to ionizing radiation introduction on soil common radioactivity in soils comes from U-238 and Th-2323 arrangement and normal K-40. The consideration of the conveyance of primordial radionuclides permits the understanding of a radiological suggestion of these components (Abdel-Halim and Saleh, 2016).
Owing to the many confinements related with conventional approaches, researchers have had to discover elective approaches to degree soil disintegration by utilizing natural radionuclides aftermath (Othman and Ismail, 2012). They are called natural radionuclides since they are common events and they are broadly disseminated in environment and have low levels. They have become part of the world’s ecosystem as they have remained in the environment for a long time (Bhatia et al., 2015). 137Cs could consider as the main commonly used element in radionuclide tracing in addition to lead-210 and beryllium-7 (Walling, 2006).
The specific objective of this work is to establish and verify a new technique for monitoring coastal changes rather than the old and traditional change detection techniques. The new proposed technique depends on measuring the soil disintegration by utilizing natural radionuclides. The future of this study is to spread the measurements of soil to whole Egyptian coasts.
2 . STUDY AREA
The study area is along the Mediterranean Sea which is located from (31° 18' 52.43 N, 30° 30' 59.41 E) to (31° 16' 45.81 N, 30° 12' 29.65 E). It extended for west of Rosetta to the eastern site (Figure 1).
Figure 1. Study area (Landsat-8 image, 2018)
Rosetta Promontory was built during the years from 500 to 1000 AD when both the Canopic and Cybernetic branches, was redirected normally into one standing canal (Rosetta Nile Branch). This Promontory proceeded developing up effectively till the starting of this century where it amplified towards the ocean by around 14 km. The ancient maps appeared that Rosetta city which was built hundreds of a long time back at the outlet of this Nile department presently got to be inland a few kilometers south of the ocean shore. Since 1900 to the display time the water stream and dregs carried out by Rosetta department to the ocean have been decreased since of: the climate changes, the development of dams (Tall Aswan Dam in 1964) and control works along the stream Nile itself (El-Raey, 1995).
3 . MATERIALS AND METHODS
The methodology in this paper depends on calculating the coastal change rates using two distinguish techniques. The first technique is to calculation the shorelines change rates by GIS algorithm (DSAS) that depends on tracing the shorelines from multi-temporal satellite images. The second technique established according to the fact of shoreline tracing through inaccessible detecting procedures depends on the changed spectral behavior of water and other arrival surfaces at distinctive wavelengths. Water bodies assimilate most of the radiation in infrared range. Hence, the reflectance of water is almost equal to zero in these wavelengths; meanwhile, the reflectance of various land covers in both regions is higher than water (Masria etal., 2015). Methodology flow chart illustrated in figure 2.
Figure 2. Methodology
3.1 Satellite Images
According to this concept, coastline can be extracted from a combination of near-infrared and infrared bands or a single band near infrared image. The combinations band (4, 3, 2), (4, 5, 3), (4, 5, 7), in addition to binary images of different satellite image bands tested for Landsat 5, 7, 8. It was found that the binary image for band 5 is the best representer for the shoreline for all images of three sensors of Landsat (Landsat 5, Landsat 7, Landsat 8).
3.2 Digital Shoreline Analysis System
DSAS is a free program application that works inside the ArcGIS system. DSAS computes change rates for arrangement of shoreline vector information additionally rates of alter for any boundary-change issue that merges a clearly identified highlight position at separate times, such as arrive use/cover boundaries (Himmelstoss, 2009).
3.3 Shorelines Detection
All shoreline positions are to be used in the change rate analysis. Once all shorelines have been traced, then combined, the selection tools in ArcMap used to calculate change statistics on subsets of the entire dataset.
DSAS uses a measurement baseline method (Leatherman et al., 1983) to calculate rates of changes for different shorelines. The pattern is built by the client and assists as the beginning point for all splits used by the DSAS application. Transects intersect each shoreline at the estimation points used to calculate change rates.
The buffer method was used to create a baseline by isolating it to a new set of shoreline feature class and then removed the undesirable segments. We chose the oldest year coast line buffer as a baseline.
3.4 Shoreline Change Analysis
We carried all previous steps out to analyze statistically shoreline change. DSAS has many statistical options for analyzing shoreline change data. These options are, for example, Shoreline Change Envelope (SCE), Net Shoreline Movement (NSM), End Point SCE and NSM provide a shoreline distance at each transect; however, their results do not include information on the rate at which the shoreline changes. SCE calculates the greatest distance between all shorelines without factoring in the shoreline’s year, while NSM represents a total distance between the oldest and the most recent shoreline, i.e. 1992 and 2018, respectively.
The Linear Regression Rate (LRR) method was used to calculate change rate statistics.
3.5 Sampling
Three beach areas were selected for this study, area one was east of the Promontory (protectorate of Alburuls), area two was Borg Rashid and finally third area was Edco which is west of the Promontory. Three profile in each area was selected, 4 soil sample point were taken for each profile (Figure 3). We collected all 36 samples from the surface to about 3-cm. We arranged the weight of from 1.8 to 2 kg.
Figure 3. Samples collection in Borg Rashid
Samples were dried (110 °C) around 24 h and sieved (2-mm size) to expel any macro-impurities. The homogenized samples were weighed and stuffed in radiation vessels (1000-cm3 Marinelli) for radioactive estimations by high purity germanium detection (HPGe) system (Figure 4).
##figure|791#
High-resolution gamma ray’s spectroscopy system equipped by High Pure Germanium (HPGe) detector measured the radioactivity. The gamma spectrometry system used is fully integrated data acquisition system (IAEA, 1989).
4 . RESULTS AND DISCUSSIONS
Interpreting the results of the processing of satellite images show that shorelines change in Rosetta Promontory is very dynamic (Figure 5).
Figure 5. Shorelines changes
4.1 The Distance of Shoreline Change
The total numbers of transect created perpendicular to the shoreline vectors was 2024 line. Under the DSAS module, we measure the distance of shoreline change using SCE (Shoreline Change Evolve). The result of SCE (Figure 6-a, b, c) shows that the smallest distance was 24.43m far east between shoreline of 2013 and 2018 in the transect number 2006 and the greatest distance was 647.04m between shoreline of 1992 and 2002 in the transect number 1394.
Figure 6-a. SCE for smallest distance is 24.43m at transect number 2006 was between 2013 and 2018
Figure 6-b. SCE for greatest distance is 647.04m at transect number 1394 was between 1992 and 2002
Figure 6-c. SCM smallest and greatest location
4.2 Rate of Shoreline Changes
Shoreline change rate (m/year) is obtained technically using distance of shoreline displacement (m), and time period of satellite images used in the analysis (years). EPS value was positive or negative, which represented to accretion and erosion, respectively (Figure 7-a, b).
Figure 7-a. EPR=-30.7 m/year at transect number 1125 between year 1998 and 2018 which represented to maximum
Figure 7-b. EPR=14.3m/year at transect number 1786 between year 1992 and 2017 which represented to the
4.3 Linear Regression Rates (LLR)
Long-term shoreline changes rates were calculated at each transect as the linear regression slope through all shoreline positions from the earliest 1992 to the most recent 2018 as shown in table 1 and figure 8.
Figure 8. LRR Analysis
Table 1. Shoreline analysis, rates, classification and symbols
Sr. No.
Rates
Classification
Symbols
1
\(\geq\) 27 m
High Erosion
_________________
2
0-1 m
Stable
_________________
3
1-2 m
Low Accretion
_________________
4
2-3 m
Medium Accretions
_________________
5
\(\geq\) 15
High Accretions
_________________
4.4 Measurement of Radionuclides
Collected soil samples were analyzed for natural and man-made radionuclides by gamma ray spectroscopy (Figure 9-a, b, c).
Figure 9-a. Gamma-rays spectrum of sediment sample (Edco area profile three)
Figure 9-b. Gamma-rays spectrum of sediment sample (Rashid area profile one)
Figure 9-c. Gamma-rays spectrum of sediment sample (Rashid area profile three)
We classified observed gamma rays photo peaks into 238U daughters (226Ra,214Pb,210Pb, and 214Bi), 232Th daughters (228Ac,212Pb and 208Tl),40K,7Be and finally 137Cs.
The sources of 238U and 232Th decay chains radionuclides are mainly from the geological formation of investigation soil (Bhatia et al., 2015).
137Cs originated from man-made activities during fission or activation process, it’s half-life (30 years) and its chemical properties lead its dispersion into environmental compartments.
7Be is a naturally occurring cosmogonic radionuclide with a half-life of (53.3 days) which use investigation for short environmental change.
210Pb (half-life 22.2 year) is a product of the 238U decay series. Lead-210 and Cesium-137 can use for long environmental change.
It was noticed that in Burulus area 283U concentration in soil is high at profile two for sample three, while its concentration is low at profile two for sample four. 226Ra concentration in soil is high at profile two for sample three and low at profile three for sample four. 228Ra concentration in soil is high at profile two for sample three and low at profile three for sample one. 212Pb concentration in soil is high at profile two for sample three and low at profile one for sample four.
40K concentration in soil is high at profile one for sample four and low at profile two for sample three. 7Be concentration in soil is high at profile two for sample three and low at profile two for sample two and 137Cs concentration in soil is high at profile two for sample three and low at profile three for sample three.
It was noticed that in Rashid area 283U concentration in soil is high at profile one for sample two, while it is low at profile one for sample one. 226Ra concentration in soil is high at profile one for sample three and its concentration in soil is low at profile two for sample two. 228Ra concentration in soil is high at profile one for sample three and low at profile two for sample one. 212Pb concentration in soil is high at profile one for sample three and low at profile two for sample four. 40K concentration in soil is high at profile three for sample four and low at profile one for sample three. 7Be concentration in soil is high at profile three for sample one and low at profile three for sample two and 137Cs concentration in soil is high at profile one for sample three and low at profile
It was noticed that in Edco area 283U concentration in soil is high at profile two for sample two, while its concentration in soil is low at profile three for sample one. 226Ra concentration in soil is high at profile one for sample one and its concentration is low at profile two for sample three. 228Ra concentration is high at profile one for sample two and low at profile two for sample two. 212Pb concentration is high at profile one for sample one and low at profile three for sample four. 40K concentration is high at profile three for sample three and low at profile two for sample three. 7Be concentration is high at profile two for sample two and low at profile one for sample four, and 137Cs concentration is high at profile one for sample two and low at profile two for sample four.
4.5 7Be scavenging rates from soil
The scavenging rates K(year-1) calculation according to (Olsen et al., 1986) equation (1), where “I” is the annual deposition rate and given by (Saleh and Abdel-Halim, 2017). The average value was 785.7 Bq/m2/year, λ is the decay value of 7Be (4.73 year-1), As is the area concentration of 7Be that determined according to equation (2), as A is a mass concentration of 7Be in sample in (Bq/Kg), ꝭ is density and was determined for all measurement samples and d is depth of sample in (m).
\(I= (K+ λ) As \) (1)
\(As=A× ꝭ × d \) (2)
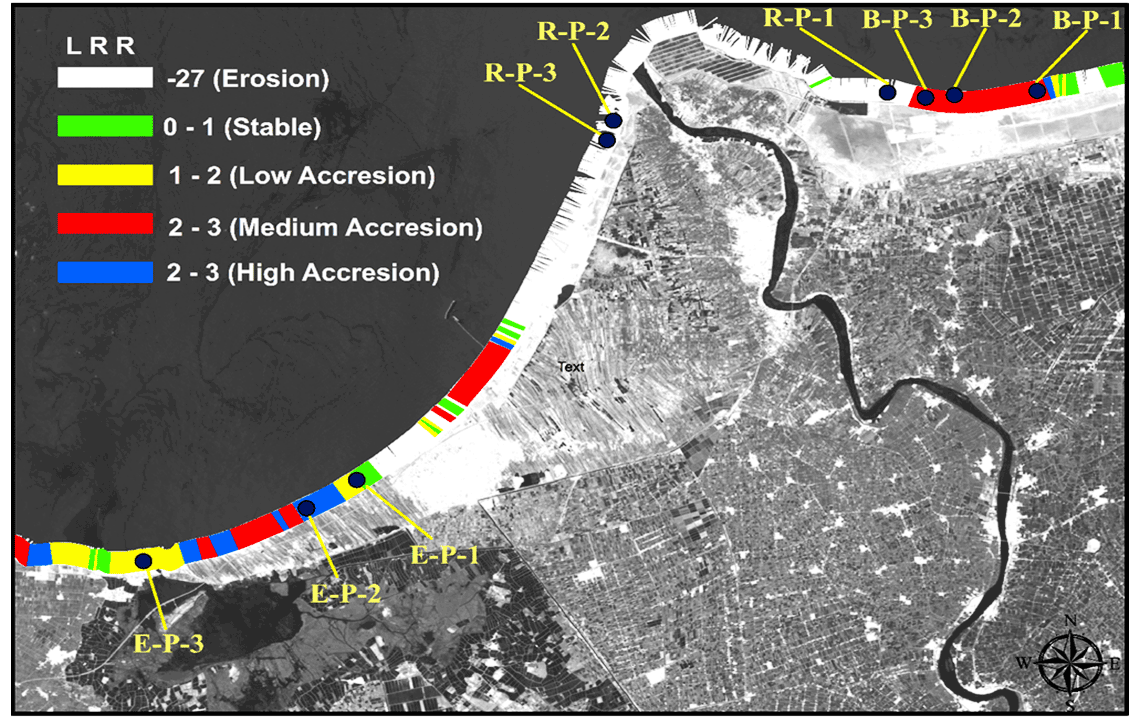
Figure 10-a, b, c displays the values of 7Be scavenging from soil over its removal by nuclear disintegration. K ranged from zero to -1.5 year -1 which means it is accretion region but according to the result of ArcGIS DSAS extension results (Figure 11). It was a high-rate erosion region and during the field observation we noticed that nourishment by external soil at a coastal zone in Rosetta Promontory. Also, k ranged from 1.11 year -1 to 2.33 year -1 it is represented for low-rate erosion, and k ranged from 0.2 year -1 to 5.7 year -1 in Edco it is represented for high rate of erosion.
Figure 10-a. K annual scavenging of 7Be at Burulus from soil
Figure 10-b. K annual scavenging of 7Be at Rashid from soil
Figure 10-c. K annual scavenging of 7Be at Edco from soil
In Rashid profile one has a high concentration of radionuclides, which represented to more nourishment in this area.
In Edco 40K have chief value that referred to biological eco system and that observed in field observation because of this profile have scope of agricultural activity for palm trees, dates palm and citrus like mango.
During field trips, while collecting samples for profile one, fishermen complain about the protection projects of the coast as it speeds up the erosion rates of the coast, and affected their fishing activities.
According to results of ArcGIS DSAS Burulus and Edco are accretion coastal zone, but the accretion at Burulus is more than in Edco. Edco also have variety of accretion value which - on other hand - it is represented for erosion started. The coastal zone in Edco at profile 3 starts suffering from erosion, which is very hazardous on agricultural activity.
The got removal results are correlated with the evidence from our study by remote sensing technique which showed the Rosetta Promontory suffering from sharp erosion and both Burlus and Edco coastal zone suffering changes from accretion zone to erosion zone.
Figure 11. Profile locations
5 . CONCLUSIONS
After calculating the annual scavenging rate in Promontory area, it was found that:
Promontory is presented main accretion area, unlike the results of the DSAS extension, which showed that the Promontory is erosion area.
According to results of field investigation and previous studies, it was confirmed that it is erosion area, but according to nourishment process it makes it appear like accretion area.
The Burullus area showed results indicating erosion after calculating the annual scavenging rate, despite the results of DSAS, it shows that it is an accretion area, but this was clarified by calculating the average distance between the shoreline of 2017 and 2018, and the 2018 shoreline retreat with an average distance 41.4cm, which makes the Burullus region suffer from erosion.
The two methods showed similarity in results in the Edco area, which shows that the Edco area suffers from erosion.
Tables
Figures
Conflict of Interest
We declare that we didn’t received any fund or financial help from any institute of organization to complete this work.
Acknowledgements
Authors acknowledge the laboratory of radioactivity in the Institute of Graduate Studies and Research, Alexandria University for support the radioactivity measures for the work.
Abbreviations
DSAS: Digital Shoreline Analysis System; EPR: End Point Rate; EPS: End Point Slope; GIS: Geographic Information System; LRR: Linear Regression Rate; SCE: Shoreline Change Envelope; SCM: Greatest distance between all shorelines without factoring its years.
El-Hattab, M. M., 2015b. Improving coastal vulnerability index of the Nile Delta coastal zone, Egypt. Journal of Earth Science & Climatic Change, 6(8), 293.
Himmelstoss, E., 2009. DSAS 4.0 Installation Instructions and User Guide. Thieler, E. R., Himmelstoss, E. A., Zichichi, J. L., and Ergul, A., 2008-1278.
Leatherman, S. P., Kearney, M. S. and Clow, B., 1983. Assessment of Coastal Responses to Projected Sea Level Rise: Galveston Island and Bay, Texas. URF report TR-8301, ICF, EPA, College Park, Maryland, 193.
Niya, A. K., Alesheikh, A. A., Soltanpor, M. and Kheirkhahzarkesh, M. M., 2013. Shoreline change mapping using remote sensing and GIS. International Journal of Remote Sensing Applications, 3(3), 102-107.
Thieler, E. R., Himmelstoss, E., Miller, T. and Zichichi, J., 2005. User Guide and Tutorial for the Digital Shoreline Analysis System (DSAS) version 3.2. Extension for ArcGIS v. 9.0. USGS Open-File Report, 1304.


 ,
Ibrahim Saleh 2
,
Ibrahim Saleh 2