Abstract
The study assessed the accuracies of globally available Digital Elevation Models (DEM’s) i.e., SRTM v3, ASTER GDEM v2 and ALOS PALSAR DEM with respect to Topo-DEM derived from topographic map of 5m contour interval. 100 ground control points of the elevation data were collected with the help of kinematic hand held GNSS (Global Navigation Satellite System), randomly distributed over the study area. The widely used RMSE statistic, NCC correlation and sub-pixel-based approach were applied to evaluate the erroneous, correlation, horizontal and vertical displacement in terms of pixels for the individual Digital Elevation Model. Following these evaluations, SRTM DEM was found to be highly accurate in terms of RMSE and displacement compared to other DEMs. This study is intended to provide the researchers, GIS specialists and the government agencies dealing with remote sensing and GIS, a basic clue on accuracy of the DEMs so that the best model can be selected for application on various purposes of the similar region.
2 . MATERIALS AND METHODS
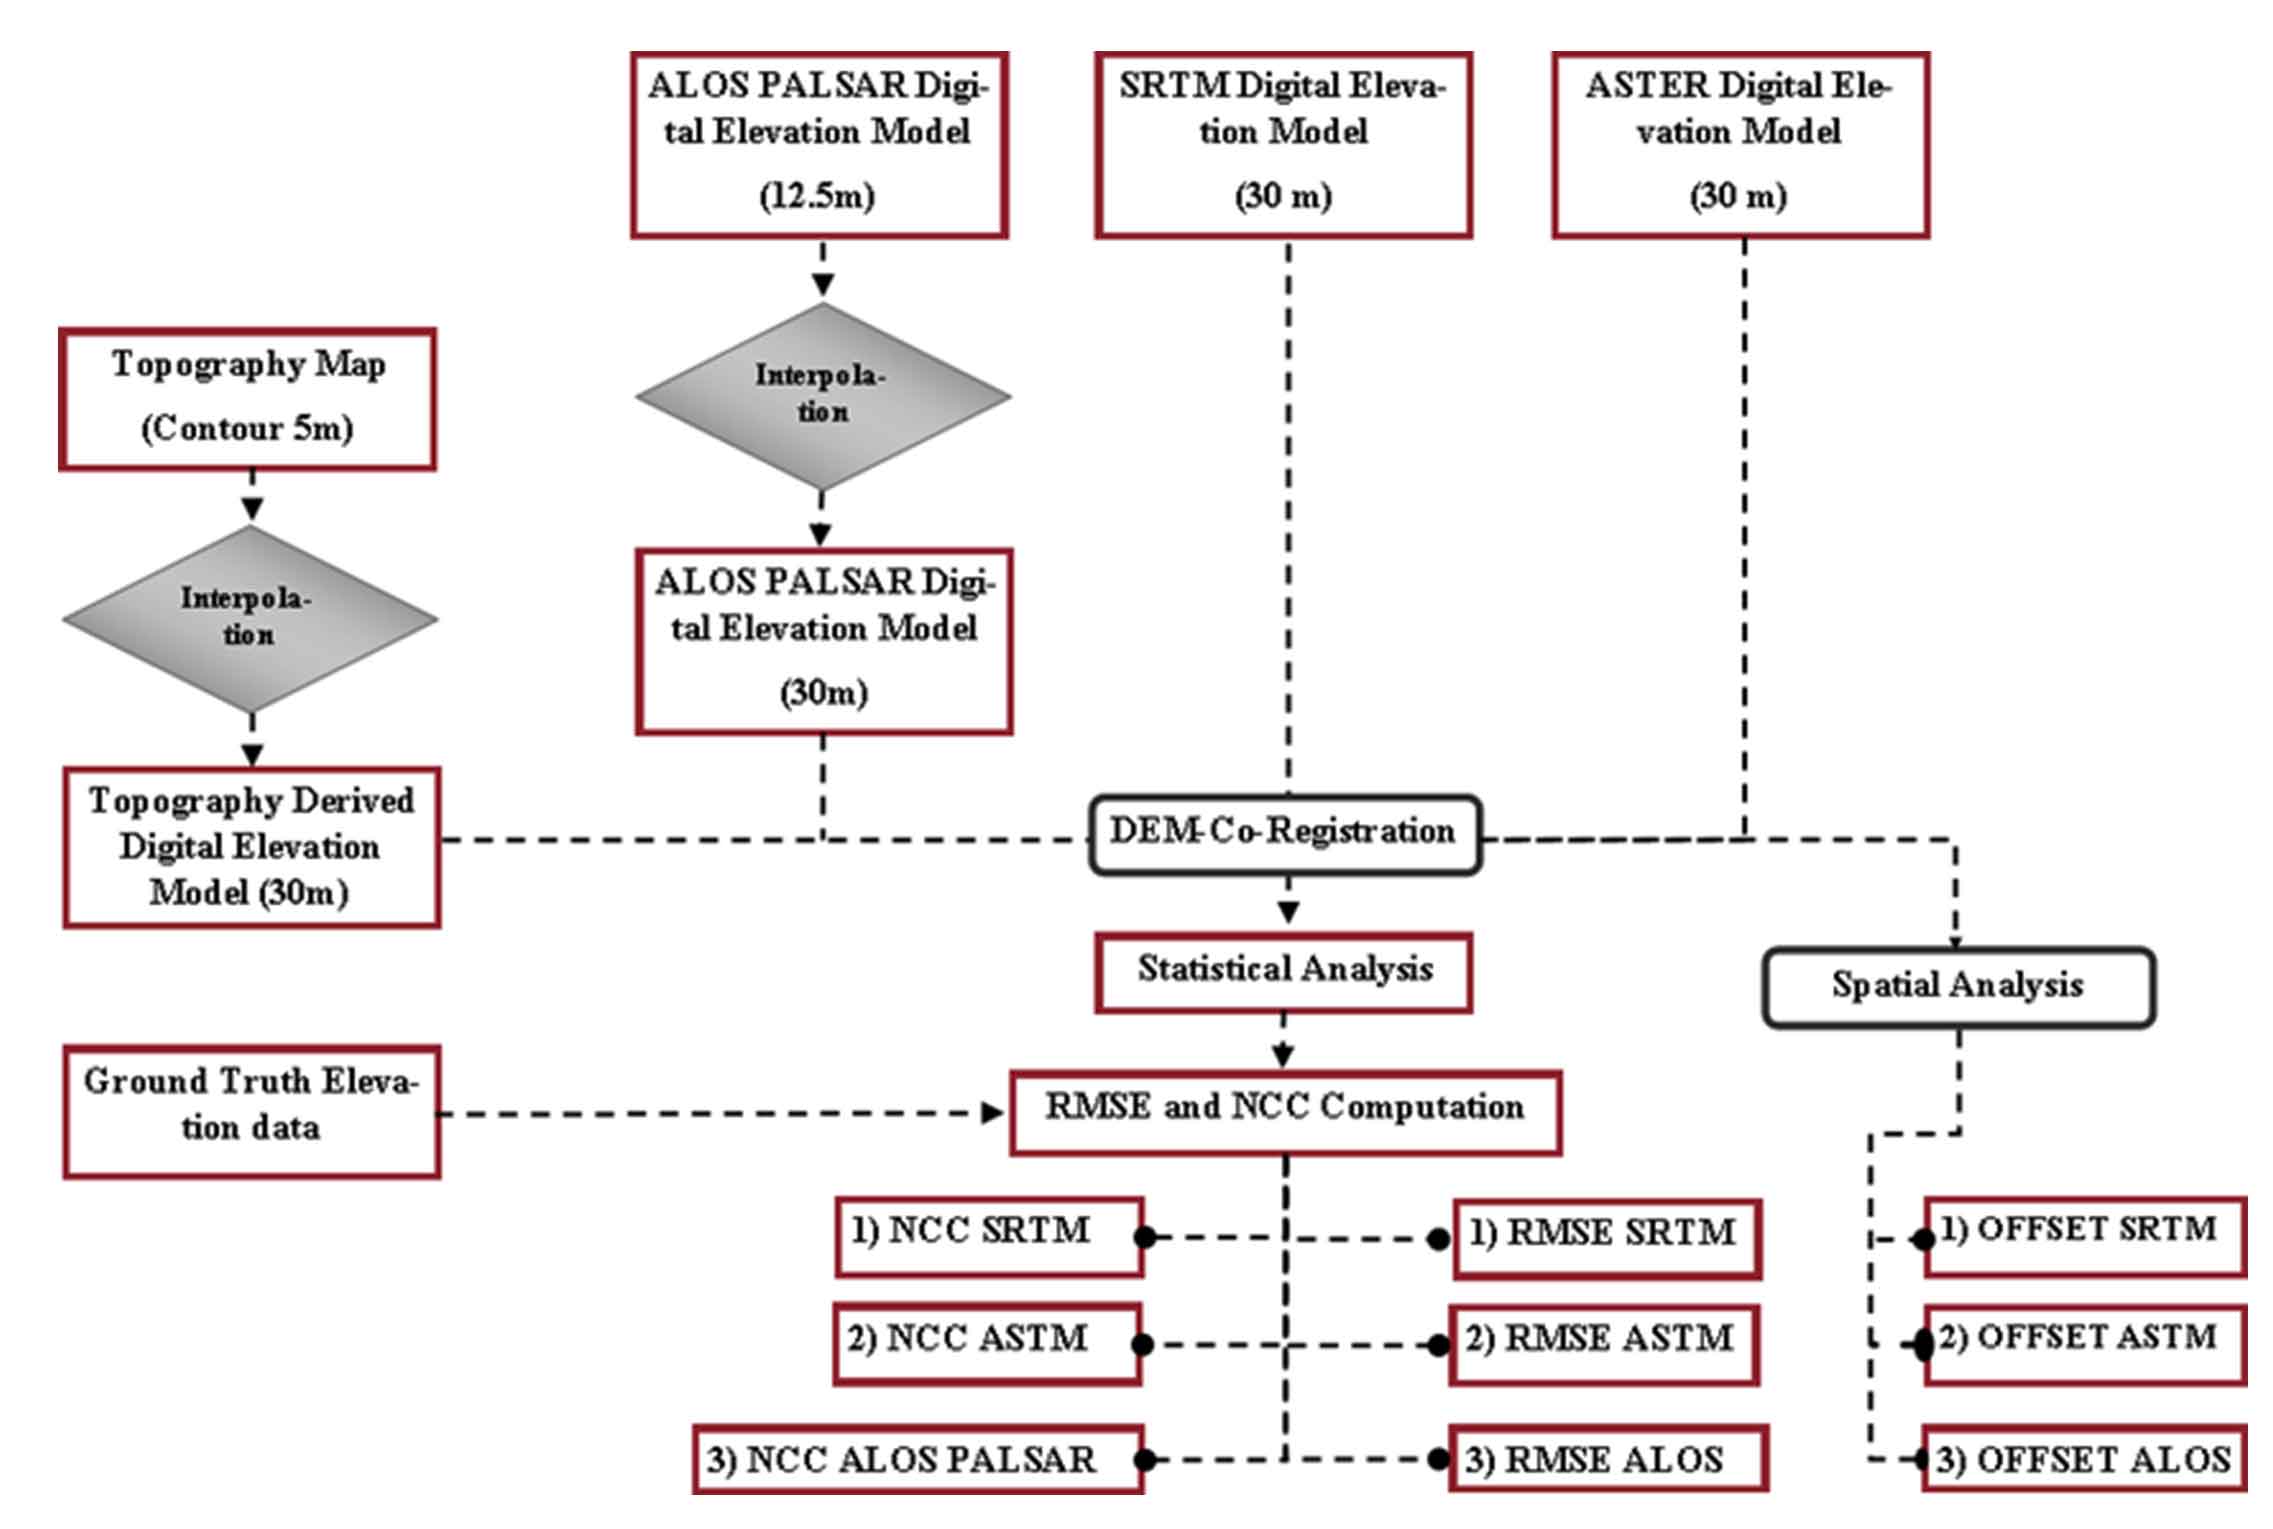
The freely available global DEMs i.e., SRTM, ASTER GDEM and ALOS PALSAR were used in the study. 5m contour topography surveys were conducted by Phuentsholing City Corporation through conventional ground based total station (TS-06) in 2016 for the entire city of Phuentsholing was collected to derive the topographical DEM (herein refer as Topo-DEM) which will be reference to evaluate the other DEM’s. SRTM v3 and ASTER DEM v2 of 30m spatial resolution was downloaded from USGS earth explorer and 12.5m ALOS PALSAR DEM from Alaska Vertex website. All the DEM’s were converted from UTM 46N projected coordinate system with respect to WGS 84 datum to DRUKREF 03 Bhutan National Grid with respect to D-Bhutan National Geodetic Datum coordinate system and analyzed based on local coordinate system. In order to determine the vertical accuracies of the DEM’s 100 GCPs using GPS were collected around the study area. Several researchers have evaluated the qualities of DEMs with vertical RMSE statistic across the globe demonstrated in Table 2. The sources of various material used in the study and typical representation of different DEMs are shown in Figure 2 and Table 1.
Table 1: Digital Elevation Models
|
DEMs
|
Sources
|
Spatial Resolution
|
Website Link
|
|
ASTER GDEM v2
|
USGS Earth Explorer
|
30m
|
www.earthexplorer.usgs.gov
|
|
SRTM v3
|
USGS Earth Explorer
|
30m
|
www.earthexplorer.usgs.gov
|
|
ALOS PALSAR
|
Vertex Alaska
|
12.5m
|
www.vertex.daac.asf.alaska.edu
|
Table 2: RMSE of the three DEMs computed with respect to Topo-DEM
|
Parameters
|
ASTER GDEM v2
|
SRTM v3
|
ALOS PALSAR
|
|
\((P_i-Q_i)^2\)
|
30275.81
|
6365.23
|
162732.4
|
|
\( {\sum (P_i - Q_i )^2 {} \over n}\) ; where n=100
|
302.758
|
63.652
|
1627.324
|
|
\(RMSE = \sqrt{\sum{ {(P_i-Q_i)^2} \over n}}\)
|
17.40m
|
7.98m
|
40.30m
|
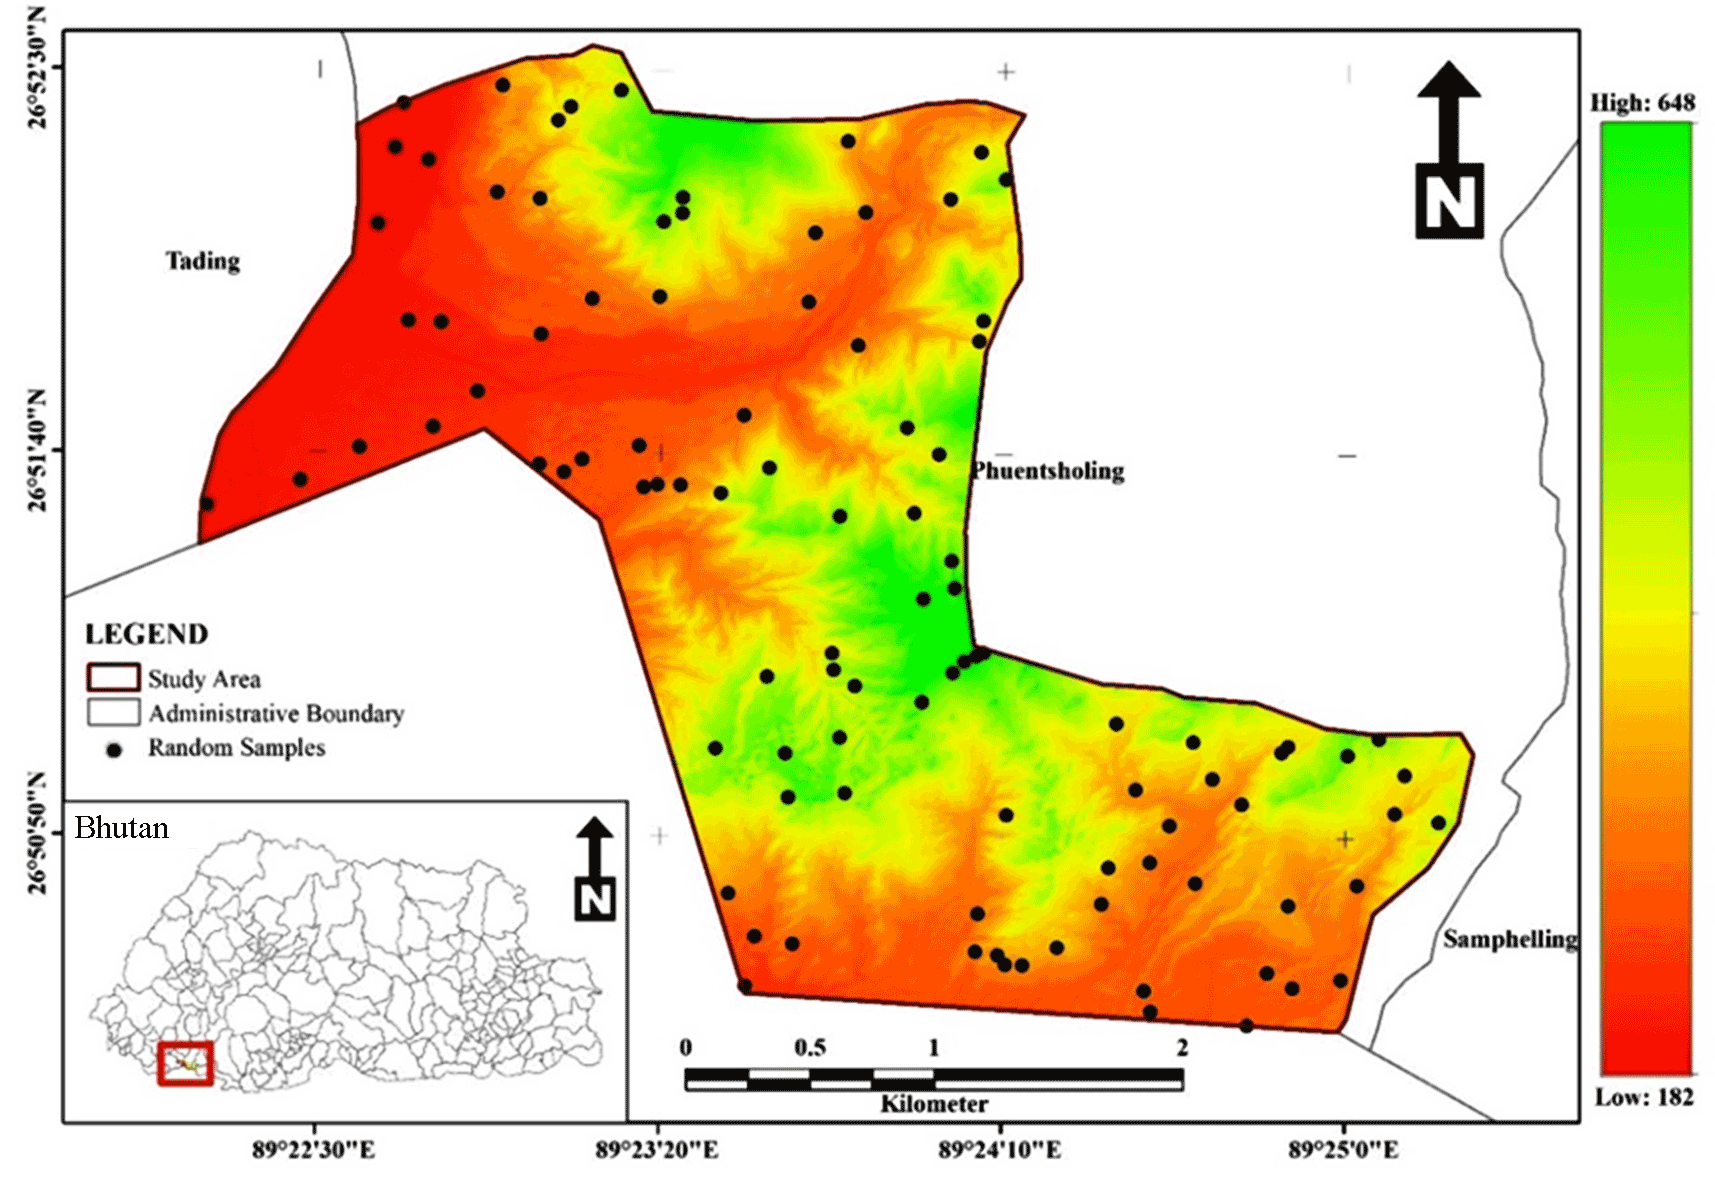
2.1 Study Area
The study area consists of undulating topography with structural geological features which fall under sub-Himalayan region in Bhutan. Phuentsholing is geographically bounded by 26°51'41.51''N and 89°23' 0.95'E with an elevation of 182m above mean seal level. The region is bisected by the parallel drainage pattern of Om Chhu River and valley formation by Ammo Chhu river toward southern part of the study area. The region was covered with rugged terrain features, sparse vegetation cover, and abrupt rise in topography from Indian flood plain along the Ammo Chhu River. Purposely, Phuentsholing area was selected for the analysis of DEM qualities, since the area consist of both plain and undulating topography to compare RMSE of both horizontal and vertical offset with respect to Topo-DEM. The study area map with elevation ranges along with randomly distributed GCPs is shown in figure 1.
2.2 Methods
2.2.1 DEM Generation from Topography maps (Topo-DEM)
The topographic survey was conducted in 2016 by Phuentsholing City Corporation. 5m contour survey data from topography map was used for generation of digital elevation model of 5m spatial resolution. However, the spatial resolution of SRTM and ASTER GDEM is 30m. Therefore, derived Topo-DEM and 12.5m ALOS PALSAR DEM was further converted to 30m spatial resolution using bilinear convolution techniques to rationalize with other DEMs. 100 randomly distributed samples were gathered using kinematic hand held GNSS receiver to compute the vertical RMSE error of each DEM with respect to Topo-DEM.
2.2.2 Root Mean Square Error (RMSE)
The RMSE, in geospatial domain with regard to the present research defined as difference in elevations of the global DEMs with respect to the high-resolution ground base Topo-DEM derived from topographic map which is represented by equation 1.
\(RMSE = \sqrt{\sum{ {(P_i-Q_i)^2} \over n}}\) (1)
where, ‘Pi’ refers to the elevation values for Topo-DEM, ‘Qi’ denote the elevation of other tested DEMs and ‘n’ represent the number of randomly distributed samples in the study area. The RMSE provide the elevation difference between the tested and high-resolution corrected Topo-DEM in term of vertical accuracy, while the normalized cross-correlation (NCC) between different DEMs with respect to the Topo-DEM, determines the correlation among the DEMs and sub-pixel based approach which evaluates the horizontal shift and displacement among the DEMs (Chirico et al., 2013; Elkhrachy, 2018).
2.2.3 Normalized Cross Correlation (NCC) and Sub-pixel Offset techniques
Cross correlation techniques have been used widely with the advancement of digital transformation from analogue system. NCC is the tool that measure the degree of similarity between the two-digital image using correlation coefficient algorithm (Debella-Gilo and Kääb, 2011; Rao et al., 2014). Besides, cross correlation, NCC also evaluates the degree of similarity or dissimilarity between the two images. The normalized correlation can be represented by the formula given in Equation 2.
\(NCC' {_(x,y_)} (t) = {NCC{_(x,y_)(t)} \over {\sqrt NCC_(x,x_) (0) NCC _(y,y_) (0)}}\)
(2)
where \(NCC' {_(x,y_)} (t)\), represent the normalized correlation at acquisition time ‘t’, \(NCC' {_(x,y_)} (t)\) denote the correlation of one image at location x, y at image acquisition time ‘t’ and \(NCC' {_(x,x_)} (0)\) .\(NCC' {_(y,y_)} (0)\)on another image at time ‘0’. The \(NCC' {_(x,y_)} (t)\) values ranges from -1 to +1 where, +1 represent the both the image are exactly correlated, 0 represent the image are uncorrelated and -1 represent similar to +1 which is differ by negative sign only (Rao et al., 2014).
Debella-Gilo and Kääb (2011) and Heid and Kääb (2012) has assessed the velocity dynamic of the glacier flows and ground displacement with an assist from satellite imagery acquired at different time using different image matching algorithm namely; Normalized cross correlation techniques, Cross and Phase correlation on frequency domain using Fast Fourier transform on oriented and non-oriented image and COSI Correlation techniques. The research demonstrates that the area with heterotypic geographical features provide greater accuracies by NCC technique while in the case of homogenous geographical surfaces, is of less accurate compared to other unnormalized matching techniques. The general approach of the entire research is depicted in figure 3.
While, considering the horizontal error, the actual shift in pixel reference to the actual position of the pixel on the real ground is crucial and vital to be considered (Jin et al., 2014). The research also found out that the pixel offset in the DEMs are encountered in most of the global DEMs due to the process in georeferencing and DEM generation through photogrammetric technique. The sub-pixel offset measurement was undertaken with the help of Raster to Topo conversion tool in ArcGIS. The pixel of each resolution of \(30 × 30m\) in vector format is extracted to determine the horizontal and vertical pixel offset of each DEMs with respect the Topo-DEM.
3 . RESULTS AND DISCUSSIONS
3.1 Descriptive Statistics
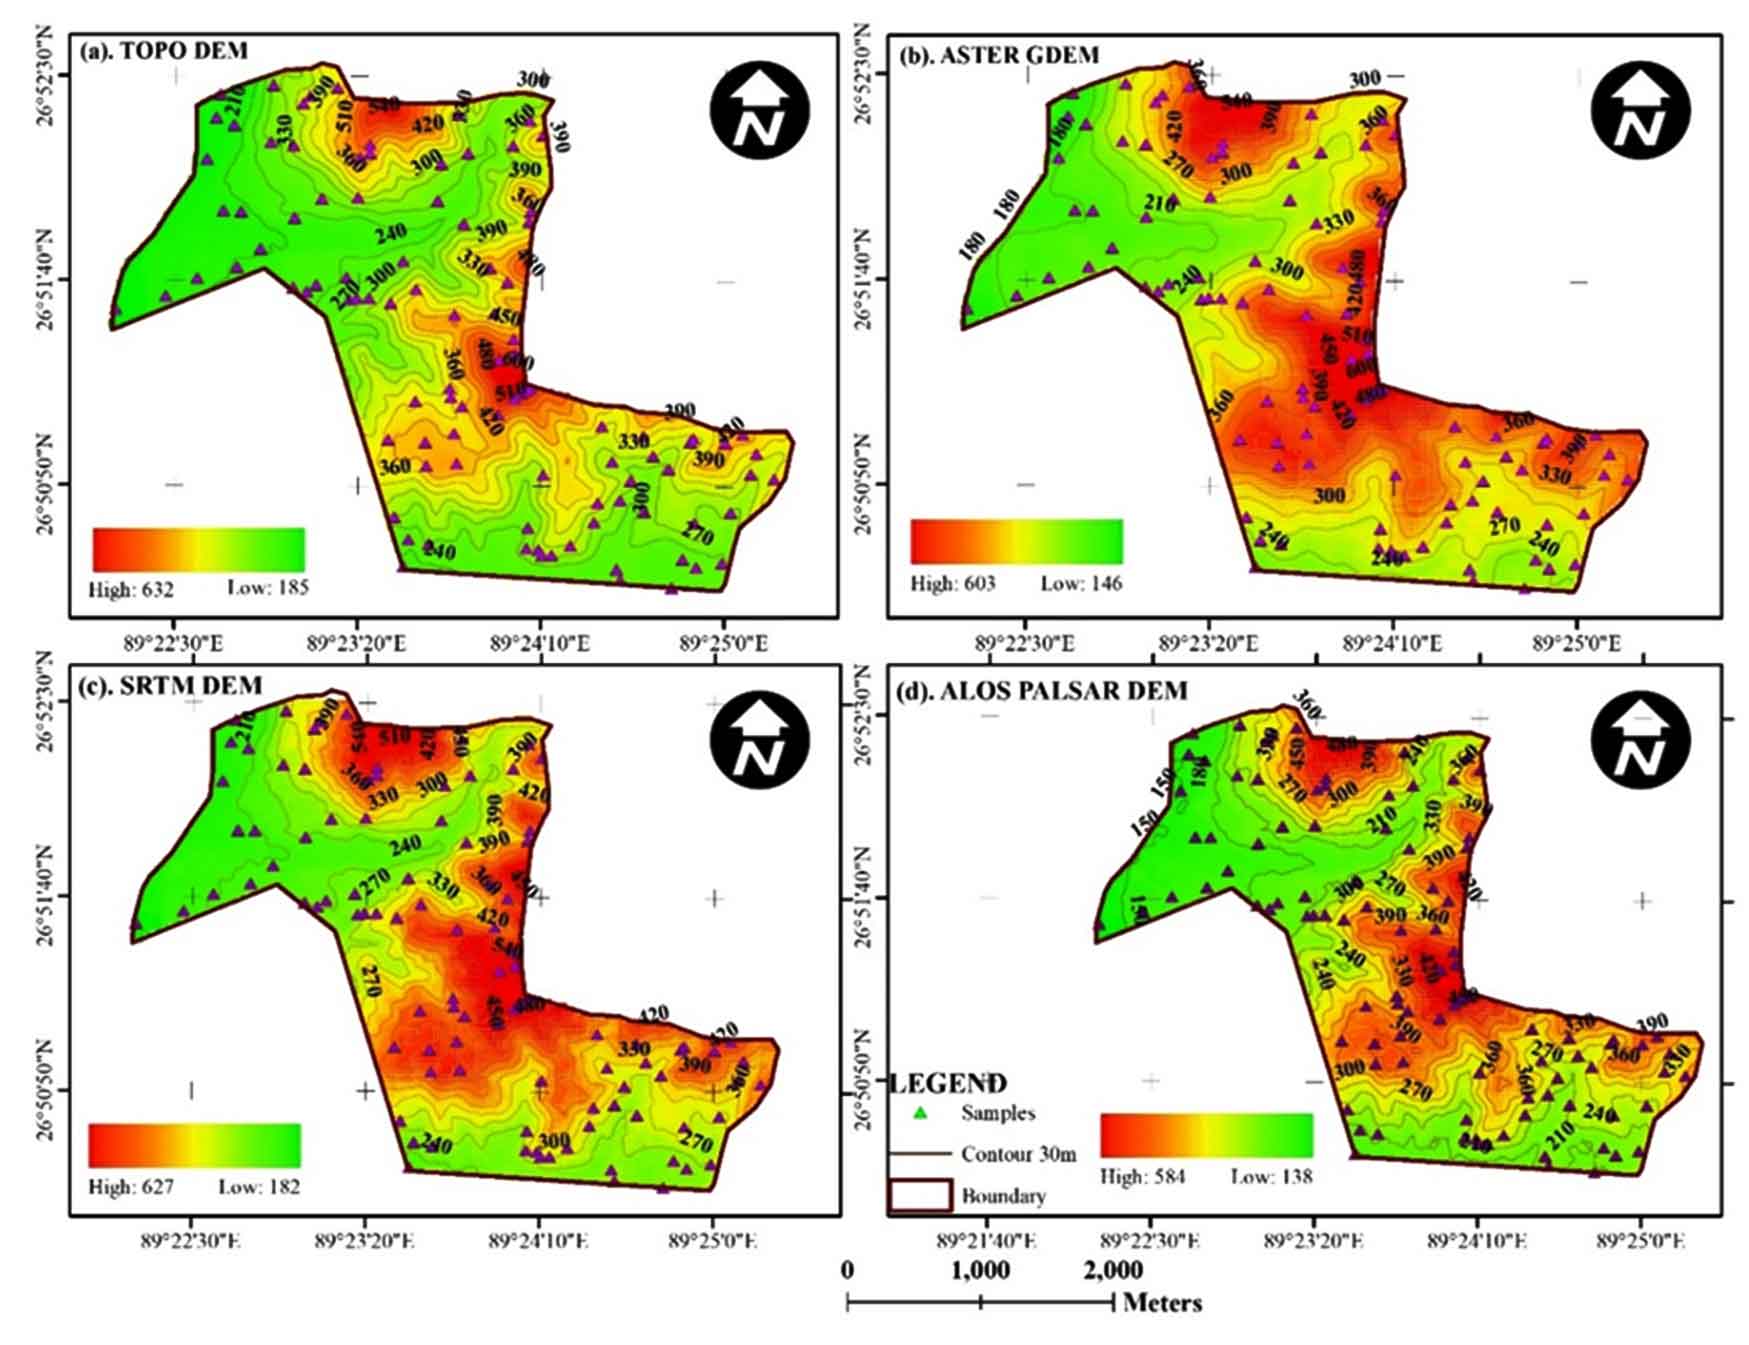
The descriptive statistics on the relative dispersion from the central of tendency (µ) was examined for the respective DEM using Coefficient of variation (CV) and standard deviations (SD). In general, Topo-DEM varied with an elevation from 185.21m to 593.44m with an average of 332.24m, 156.2m to 593.29m with an average of 320.71 for ASTER GDEM v2, 183.64m to 592.34m with an average of 336.34m for SRTM v3 and 139.31m to 557.39m with an average of 292.42m for ALOS PALSAR DEM, respectively. The unit less CV varied with the minimum of 0.29 for Topo-DEM and SRTM v3 followed by ASTER GDEM v2 (0.31) and ALOS PALSAR (0.33).
3.2 Computation of Root Mean Square Error (RMSE)
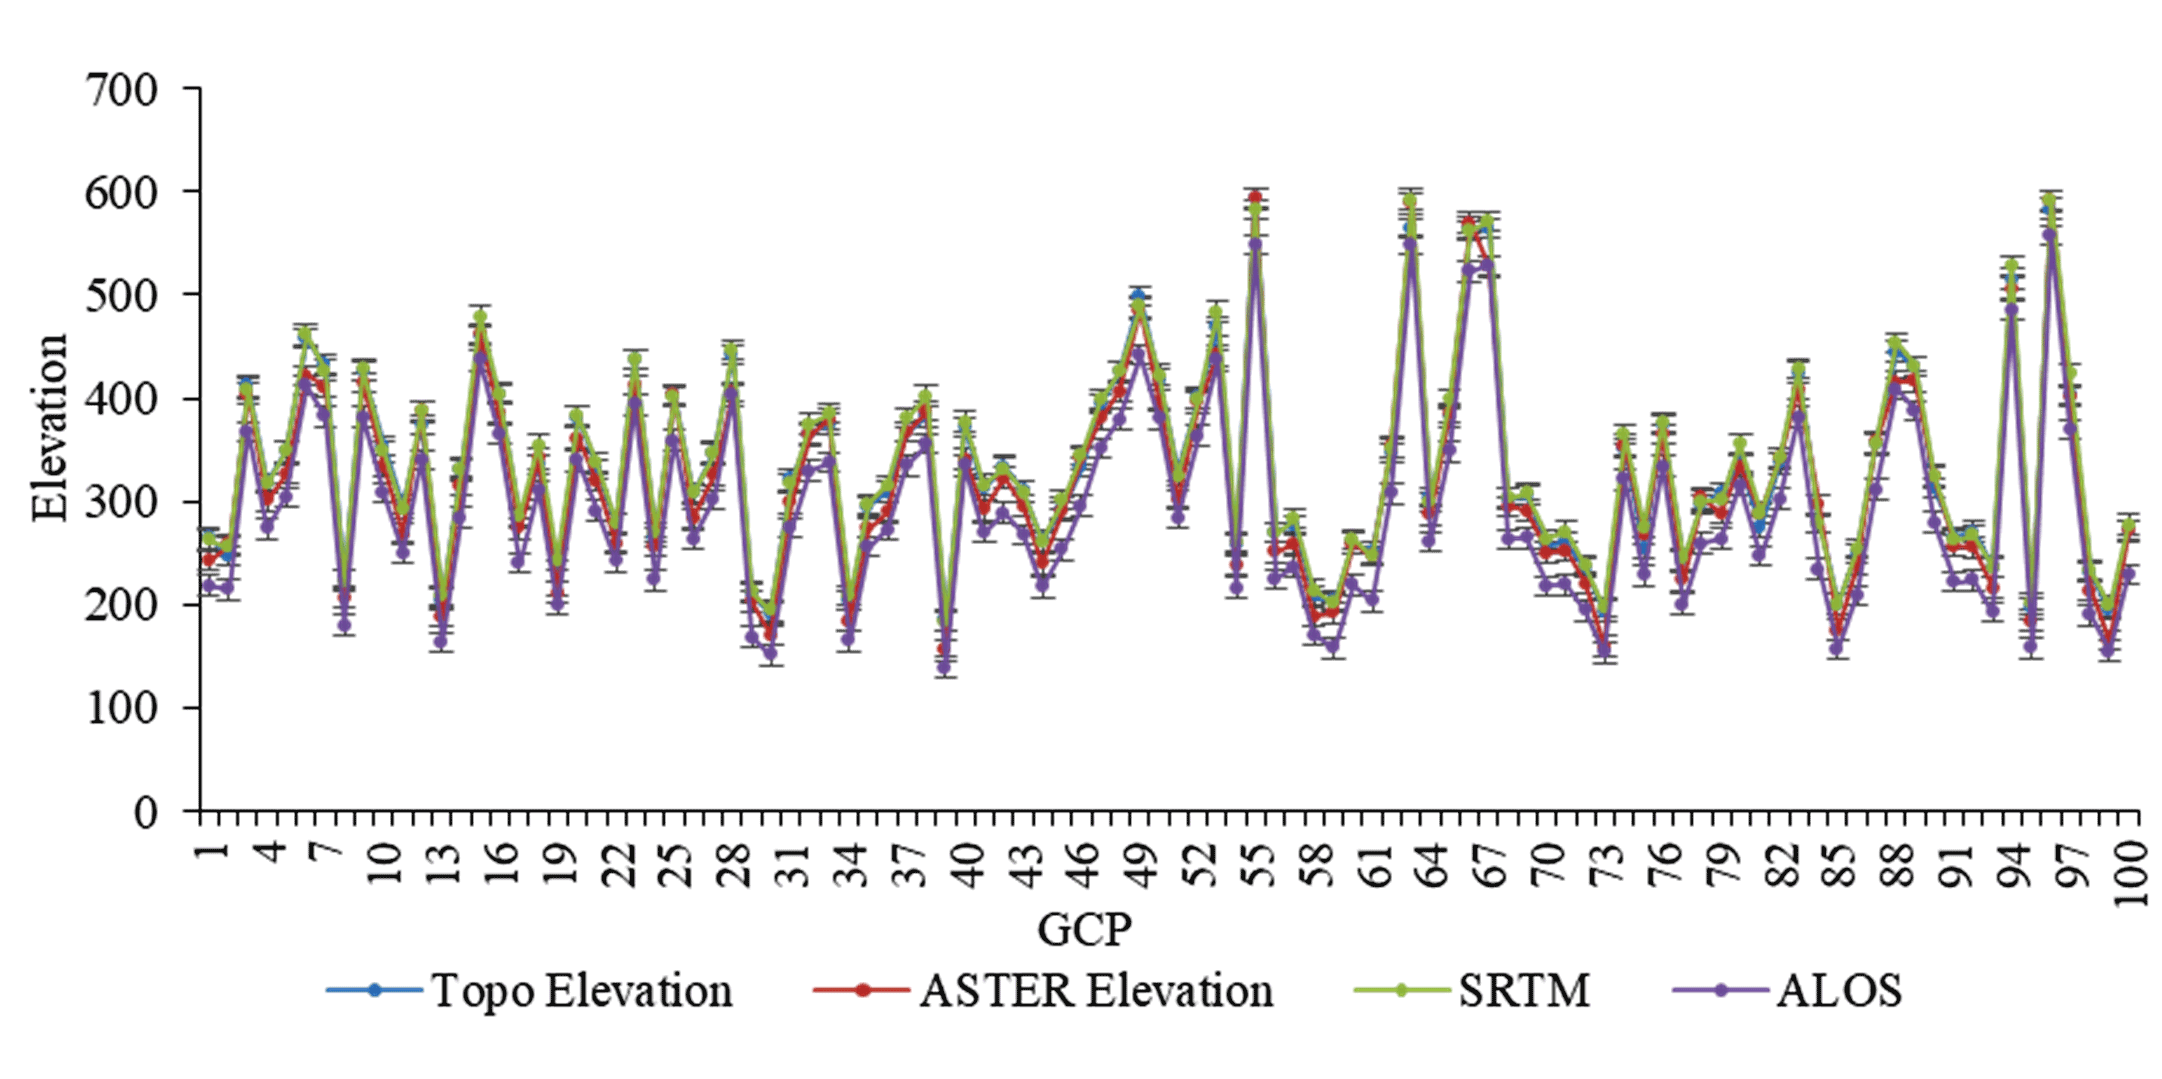
More than 100 randomly distributed ground truth samples over the study area were collected with the help of kinematic hand held GNSS receiver to assess the vertical erroneous of the globally available DEMs. The individual elevation of the DEMs was extracted to GCPs using “Add surface information values” tools in ArcGIS software. The elevations values were further exported to excel sheet for evaluation of RMSE of the individual DEMs. The RMSE of the DEMs are represented in table 2.
From the analysis, the RMSE of SRTM with respect to Topo-DEM is observed less than ASTER GDEM followed by ALOS PALSAR with 7.98m, 17.4m and 40.3m, respectively. Similar observations have been made as listed in Table 3 for undulated topographical region. The variation in RMS error at different region depends on the topographical features, land use types and geomorphological characteristics within the research area.
Table 3: Computed RMS error of the globally available DEMs
3.3 Computation of NCC
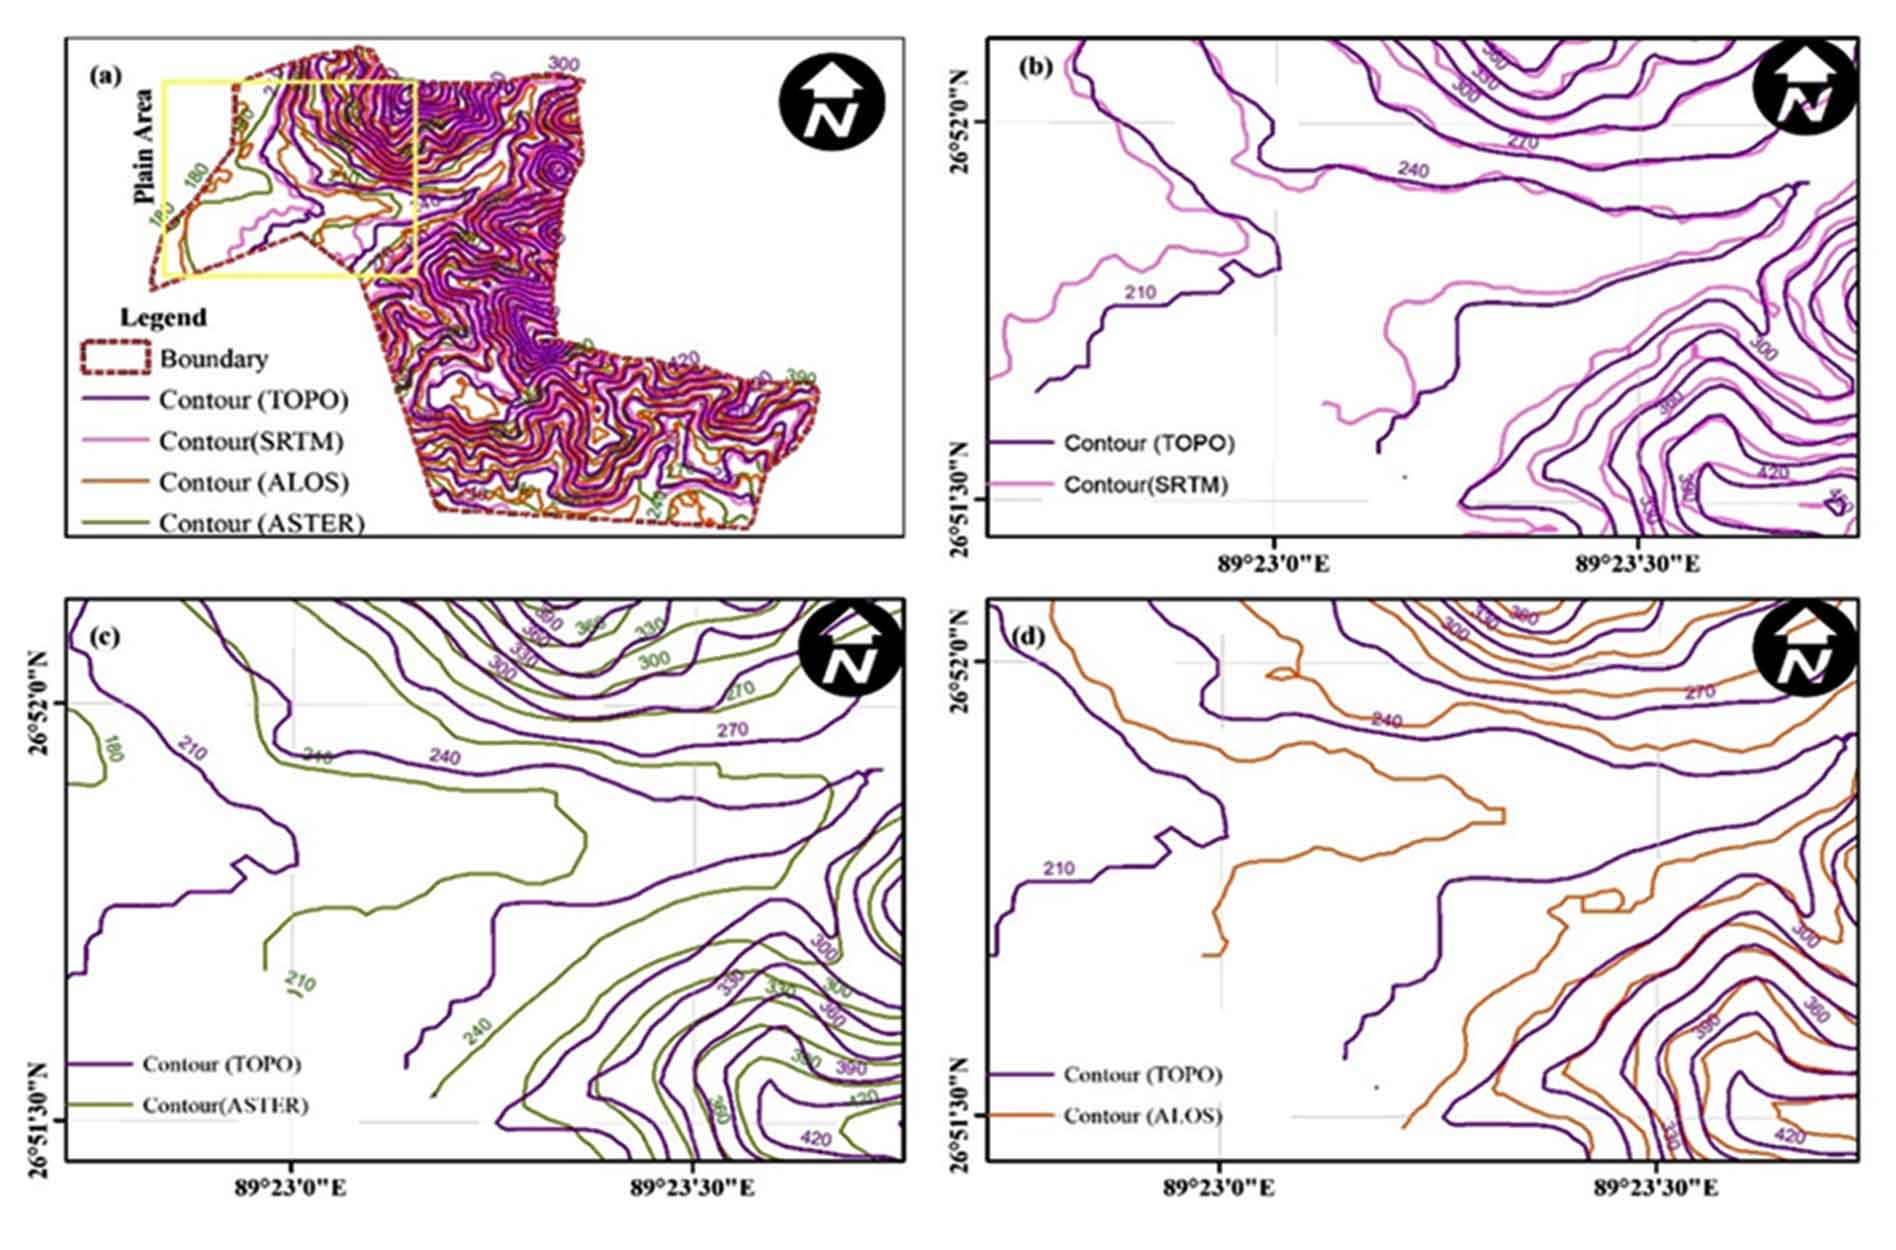
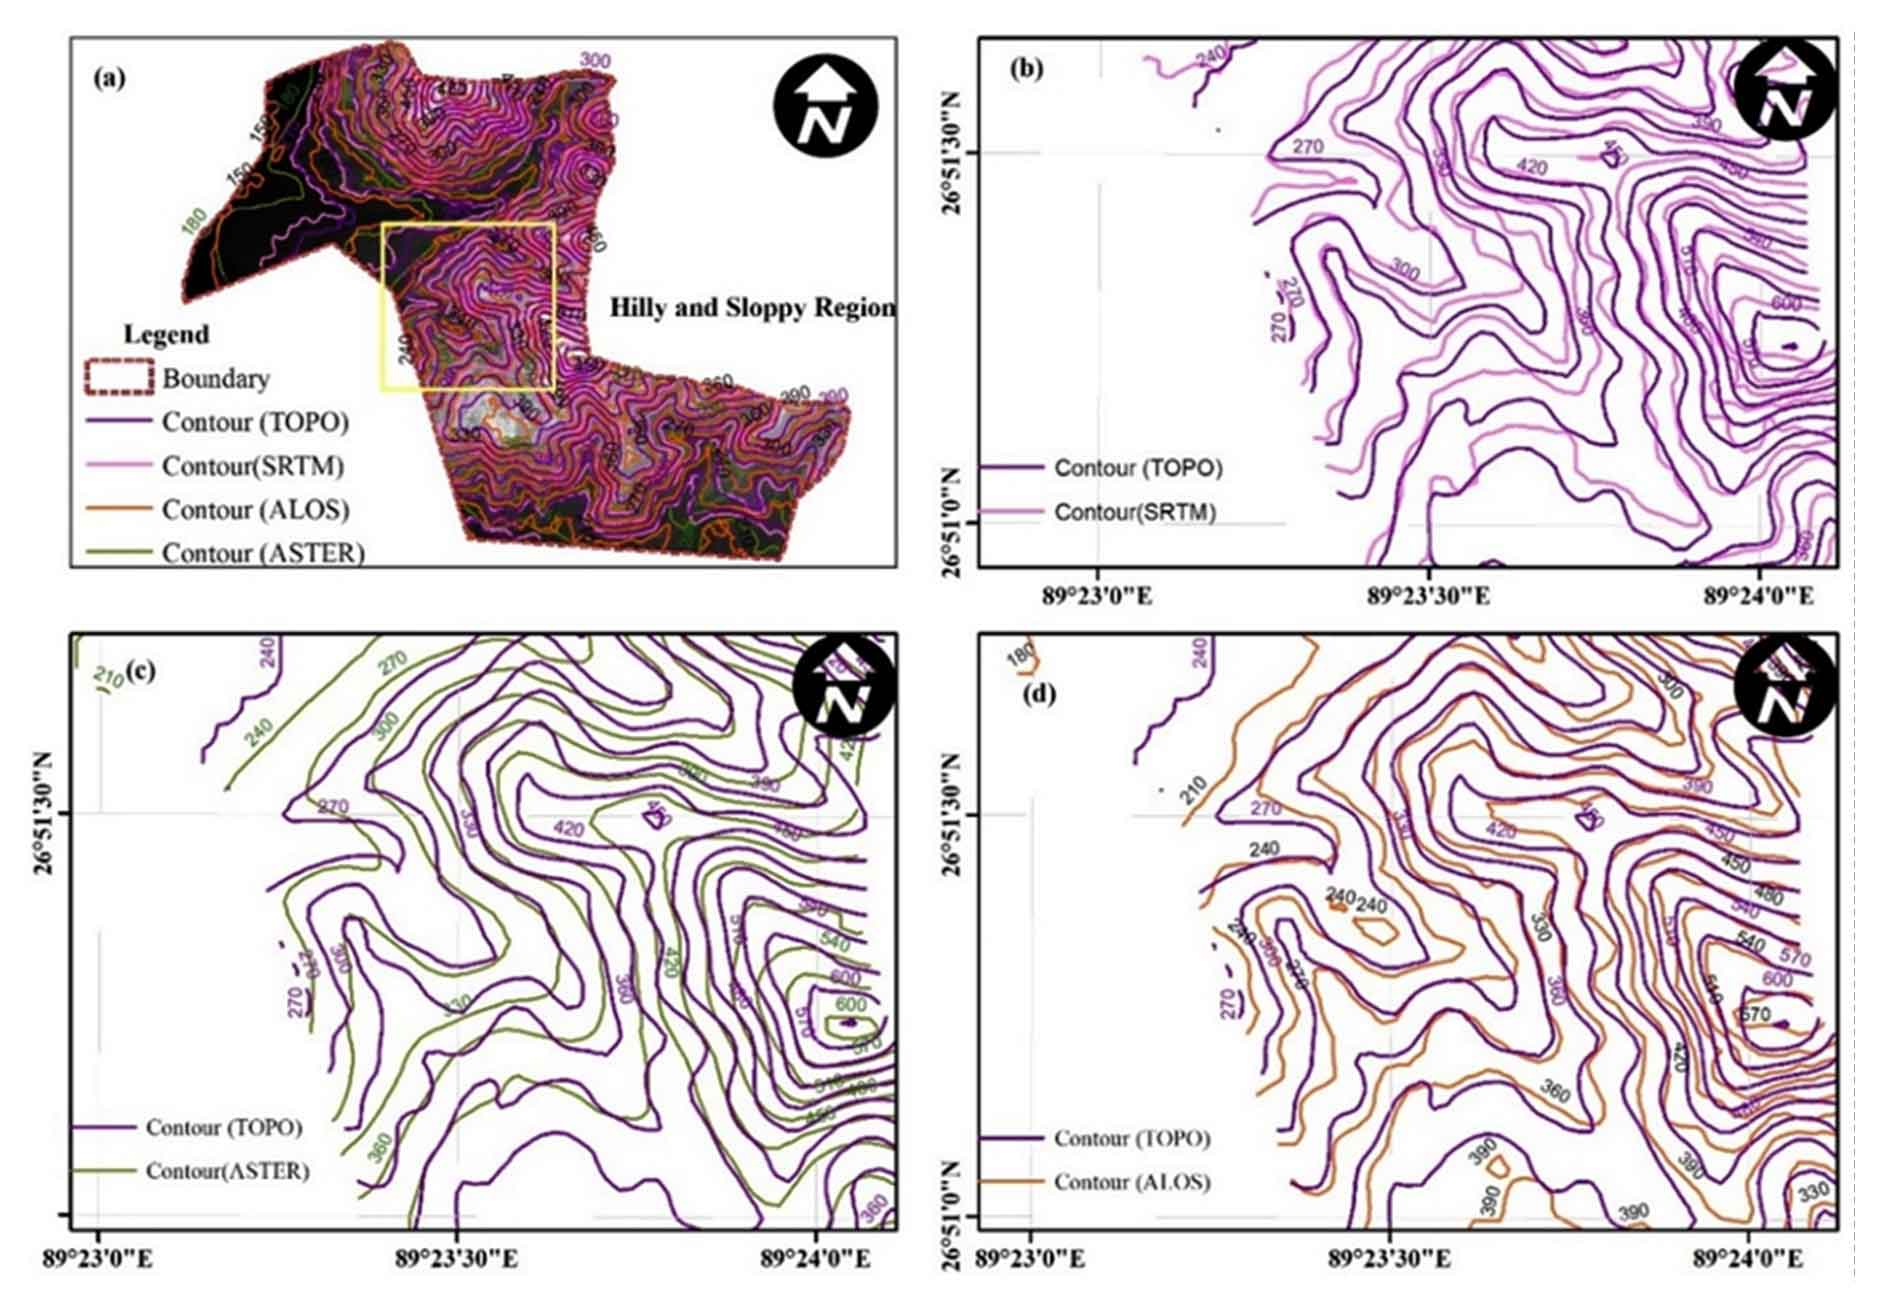
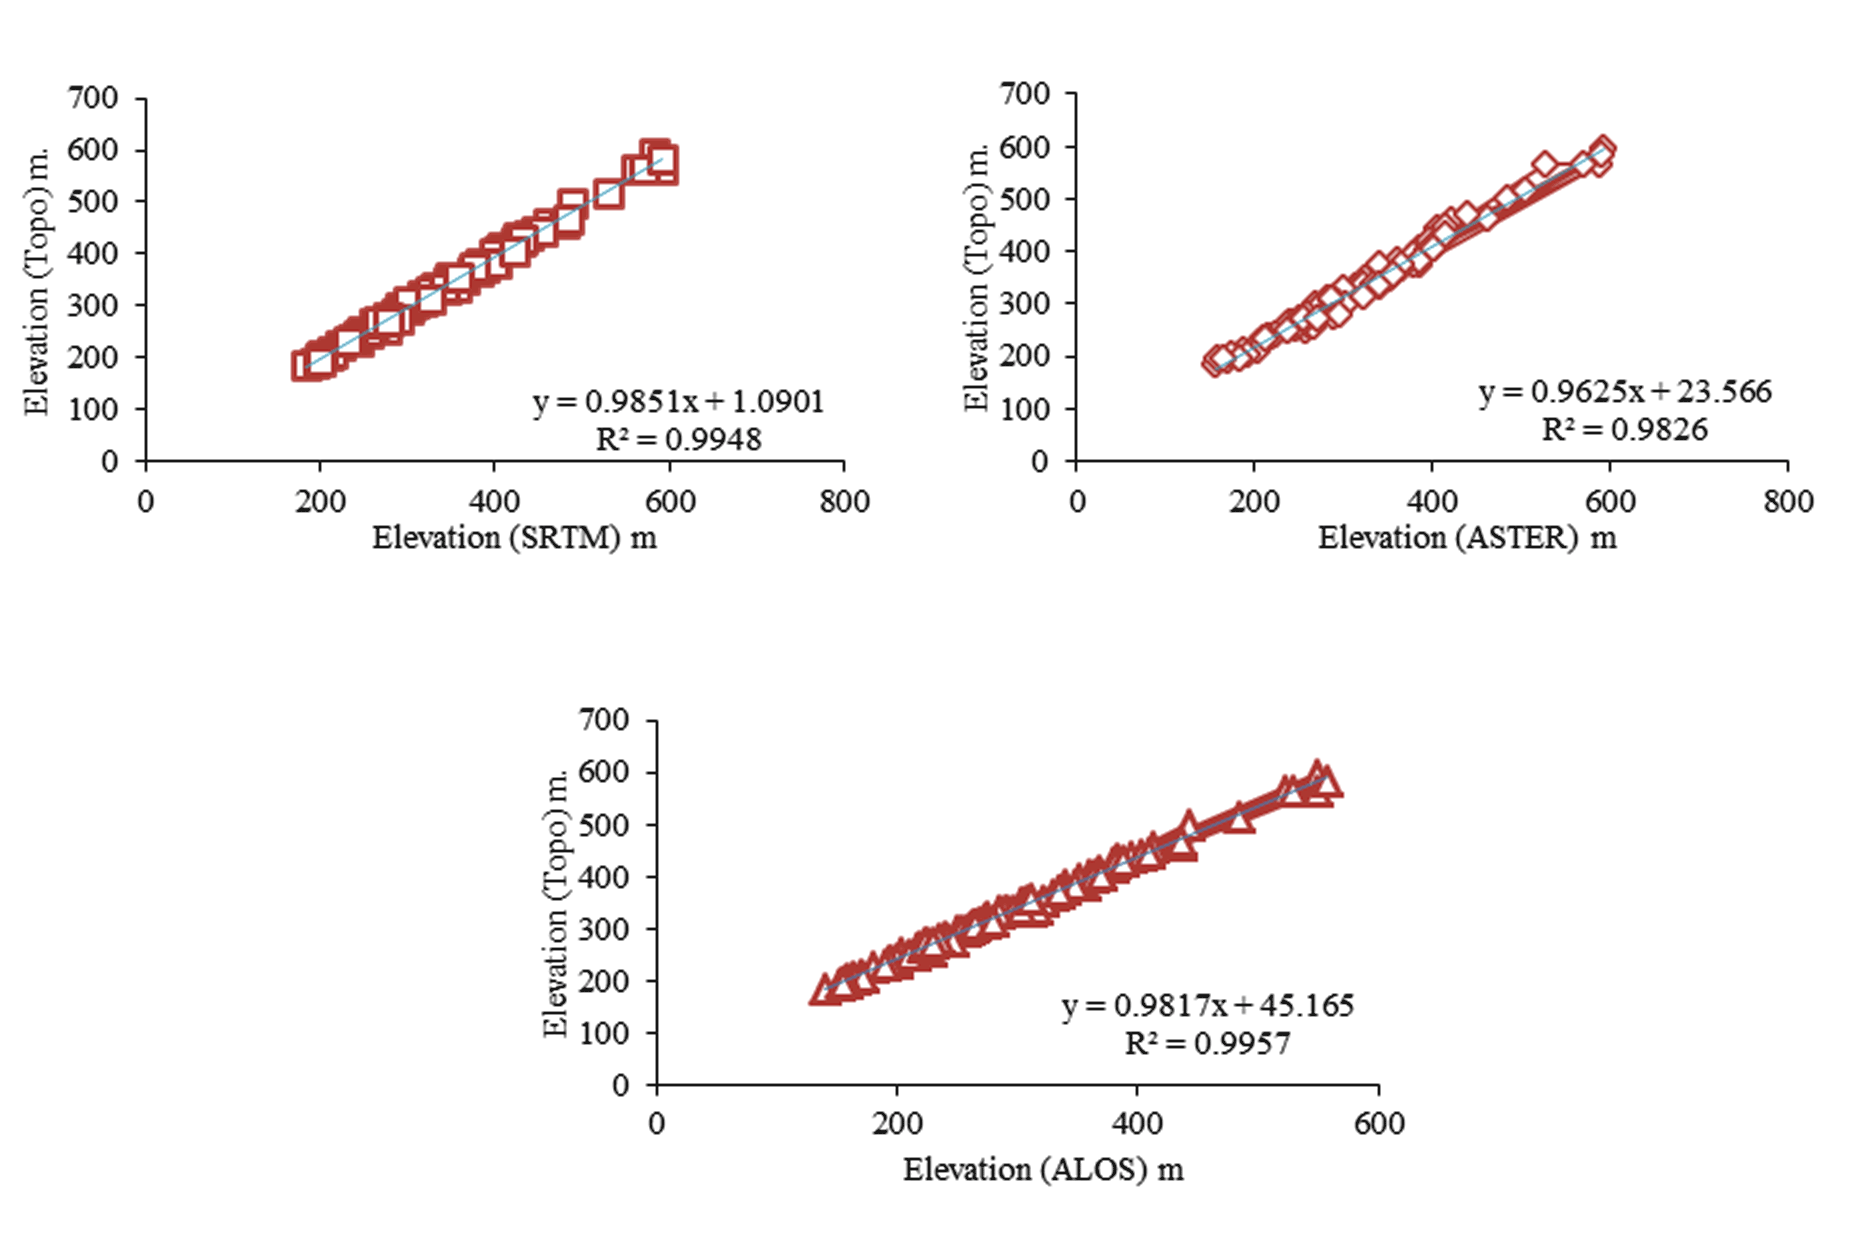
For NCC, the respective DEM files were converted to contour file with 30m interval. NCC was computed for both plain and hilly region to carryout comparative analysis with the reference Topo-DEM. With regards to the horizontal cross correlation, SRTM DEM follows the reference Topo-DEM, however with little shift in both ‘x’ and ‘y’ directions. The correlation coefficient between the reference Topo-DEM and SRTM DEM shows strong positive correlation with 0.995 as shown in figure 6.
Additionally, in context to ASTER GDEM, the contour doesn’t follow the reference DEM and mis-registration occurs in between with the horizontal (x) and vertical (y) shift. Further, mis-registration in contour can be observed in every interval of the ASTER GDEM with reference Topo-DEM. However, the strong correlation coefficient was also observed between the two DEM as shown in figure 6. From the observation made in figure 6, the NCC of DEMs demonstrates strong agreement in plain region as compared to hilly terrains.
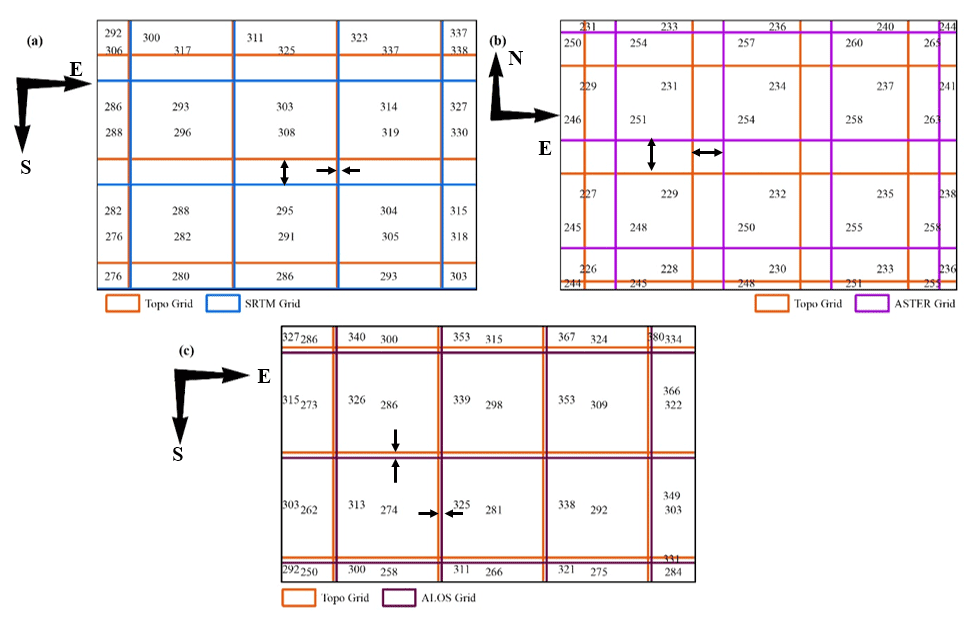
3.4 Pixel Offset and Displacement Measurement
The pixel offset measurement was undertaken manually by converting the raster pixel into polygon using ArcGIS for all the DEMs reference to the Topo-DEM. The measurement was taken along East-West and North-South directions. Besides, the displacement was also measured by the pixels displaced from the original reference pixel (Pixel value of Topo-DEM) to the pixel values of tested DEMs. The minimal offset of 0.48m toward east and 7.45m toward south was observed in the case of SRTM DEM while no displacement of pixel has been observed. Similar observation has been made for SRTM v3 by Jin et al. (2014) with half a pixel offset from the reference DEM. Additionally, for ASTER GDEM v2, the offset of 8.52m toward East and 9.06m toward North direction was observed with no displacement in plain region. In addition, for ALOS PALSAR DEM, the negligible offset of 1.5m toward south and 0.95m toward east was observed with 5 pixels displaced toward East and 10 pixels toward North with reference to Topo-DEM at plain area. The details offset and displacements are shown in figure 8 and table 5.
In the case of sloppy terrain, SRTM v3 follows the reference Topo-DEMs with negligible offset, while, both ASTER v2 and ALOS PALSAR observed the horizontal misregistration of an isoline of 30m from the reference Topo-DEM (Figure 5).
Table 4. NCC of the DEMs with respect to the reference Topo DEM
|
Region
|
Topo Vs ASTER
|
Topo Vs SRTM
|
Topo Vs ALOS PALSAR
|
|
Hill
|
0.999013821
|
0.999792791
|
0.999779347
|
|
Plain
|
0.999823395
|
0.999882999
|
0.999880025
|
Table 5: Horizontal(E-W) and vertical (N-S) offset of the three globally available DEMs and their displacement directions
|
DEM
|
Horizontal (m)
|
Vertical (m)
|
Displacement (Pixel)
|
|
SRTM
|
0.5 E
|
7.45 S
|
0
|
|
ASTER
|
8.52 E
|
9.06 N
|
0
|
|
ALOS
|
0.95 E
|
1.50 S
|
East=5; North=10
|
4 . CONCLUSIONS
The globally available DEMs were converted to the local coordinate system DRUKREF03 National Grid. The kinematic hand held GNSS receiver was used for gathering ground control points (GCP’s). The normalized cross correlation was also computed to compare among the DEMs and observed with high correlation coefficient for all the DEMs value higher than 0.95. However, the 30m SRTM DEM v3 is better in such kind of area covered with relief, sparsely vegetated coverage and mixed with flood plain geomorphic features. The mis-registration are the common limitation observed in all the DEMs, which may be due to the process involved in interpolation, conversion and data manipulation in creating DEMs and its derivations.
The RMSE, horizontal and vertical shift and displacement of the DEMs with respect to the Topo-DEM has been assessed. From the analysis, it was observed that SRTM DEM v3 provide high accuracy than other DEMs with RMSE values less than 10m and horizontal shift of 0.5m toward East and 7.45m toward South direction. In addition, the RMSE of ASTER GDEM v2 was observed with 17.4m with horizontal shift of 8.52m toward East and 9.06m vertically toward North direction. However, ALOS PALSAR DEM was observed with RMSE 40.30m with negligible shift in horizontal and vertical direction but the pixel displacement of 5 pixels toward East and 10 pixels toward North from the reference Topo DEM.
Further, in continuation to the current study which is based on physical calculation on offset measurement and pixel displacement, an automatic code or a tool will be developed for image matching and derived the pixel offset, displacement and its correlation coefficient among the DEMs to reduce the RMSE and pixel offset to generate high accurate DEM to be applied on different purposes.


 ,
Krishna Kumar Subedi 2
,
Krishna Kumar Subedi 2