1 . INTRODUCTION
The advancement of Geospatial Analysis Techniques (GAT), such as Geographic Information Systems (GIS) and Remote Sensing (RS) has ushered in a new age of spatial analysis that is both more effective and precise. GIS has emerged as a useful tool for assessing drainage patterns and groundwater ability and planning (Aziz et al., 2020) and an image processing techniques is also used to define morphological features, determine basin properties and the morphometric parameters such as linear area and relief (Psomiadis et al., 2020).
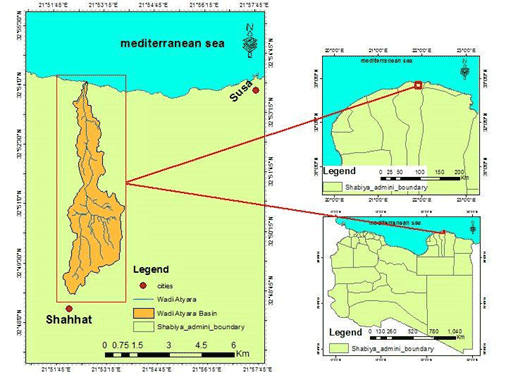
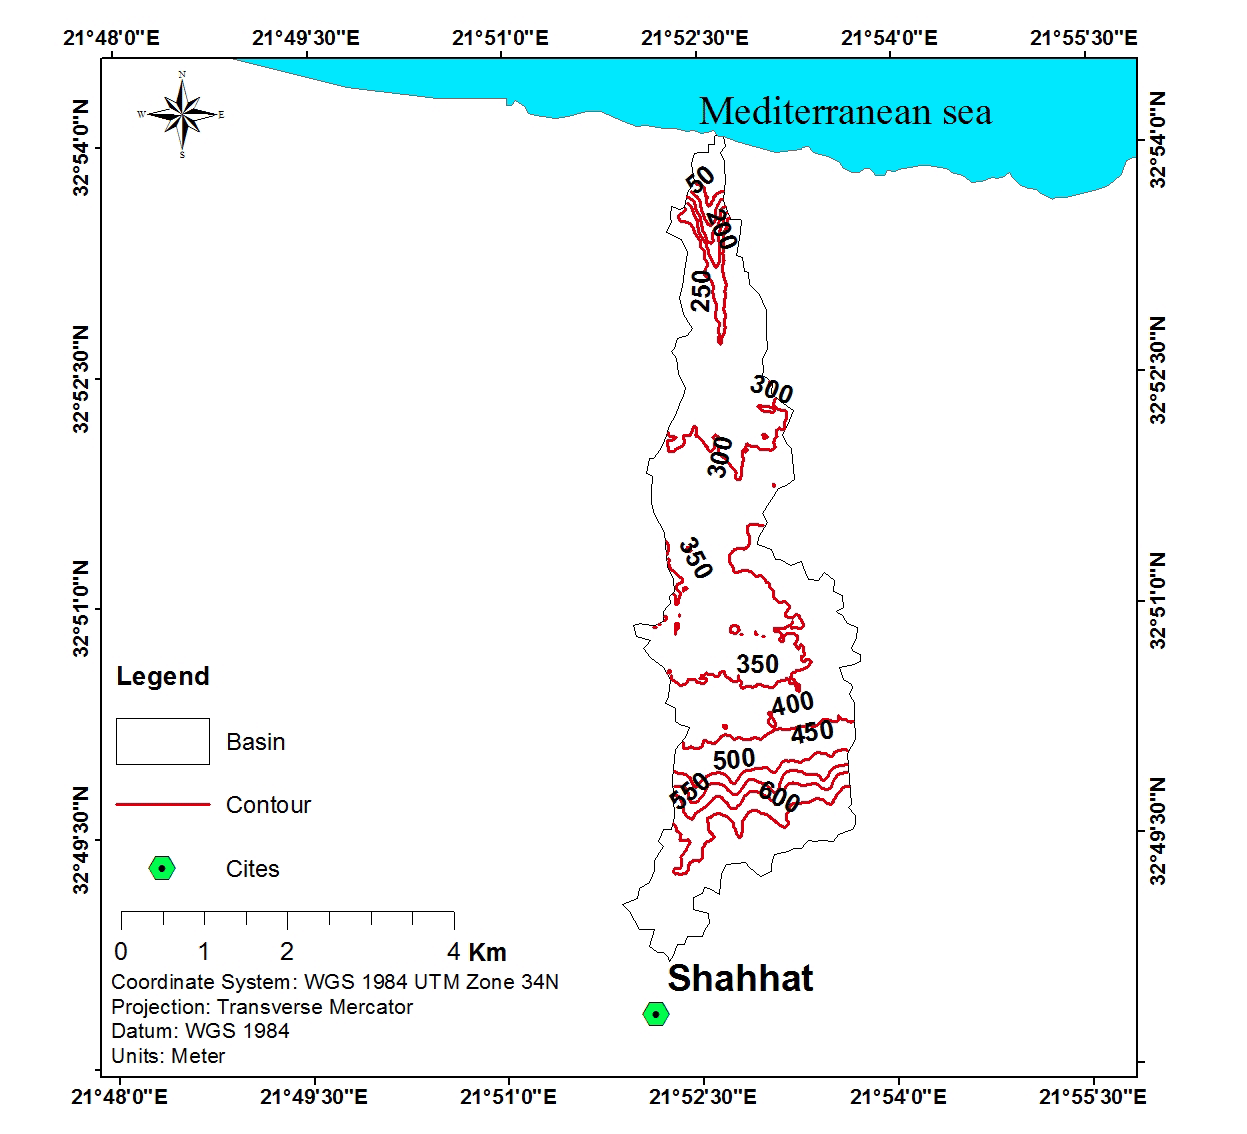
Atyaruh Valley (Wadi Atyaruh) situated on the east coast of the Mediterranean Sea in the north-eastern portion of Al Jabal Al Akhdar. The highest geomorphic feature in the Cyrenaica region is the Al Jabal Al Akhdar uplift. It is located on the northern fringe of Cyrenaica Platform and consists of sedimentary rock ranging in age from Upper Cretaceous to Tertiary.
Al Jabal Al Akhdar was developed on an active continental margin that was rifted at late Triassic-early Createous and was followed by structural inversion in late Cretaceous-Eocene (Abd El-Wahed and Kamh, 2013). During the Maastrichtian, rifting in the northern North Atlantic led to an abrupt shift in the motion of the European Plate that started moving eastward with regard to Africa (Guiraud and Bosworth, 1997). One of the structural belts marked by intra-senonian compression systems is Al Jabal Al Akhdar, so it is part of the Syrian Arc belt that stretches from Northwestern Libya to Syria, including northern Egypt, the Israel fold belt and the Palmyrides. In Cyrenaica, the upper Cretaceous developed an inverted E-W to NE-SW-trending fold belt and was slightly accentuated by the Tertiary (Rohlich, 1978; El-Amawy et al., 2011; Abd El-Wahed and Kamh, 2013).
Others studies indicate that a significant wrench portion of motion through the upper Cretaceous (Turonian-Santonian) was formed by the study area’s structural style to become a major trench-linked, right-lateral, strike-slip fault (Woodcock 1986; Sylvester 1988).
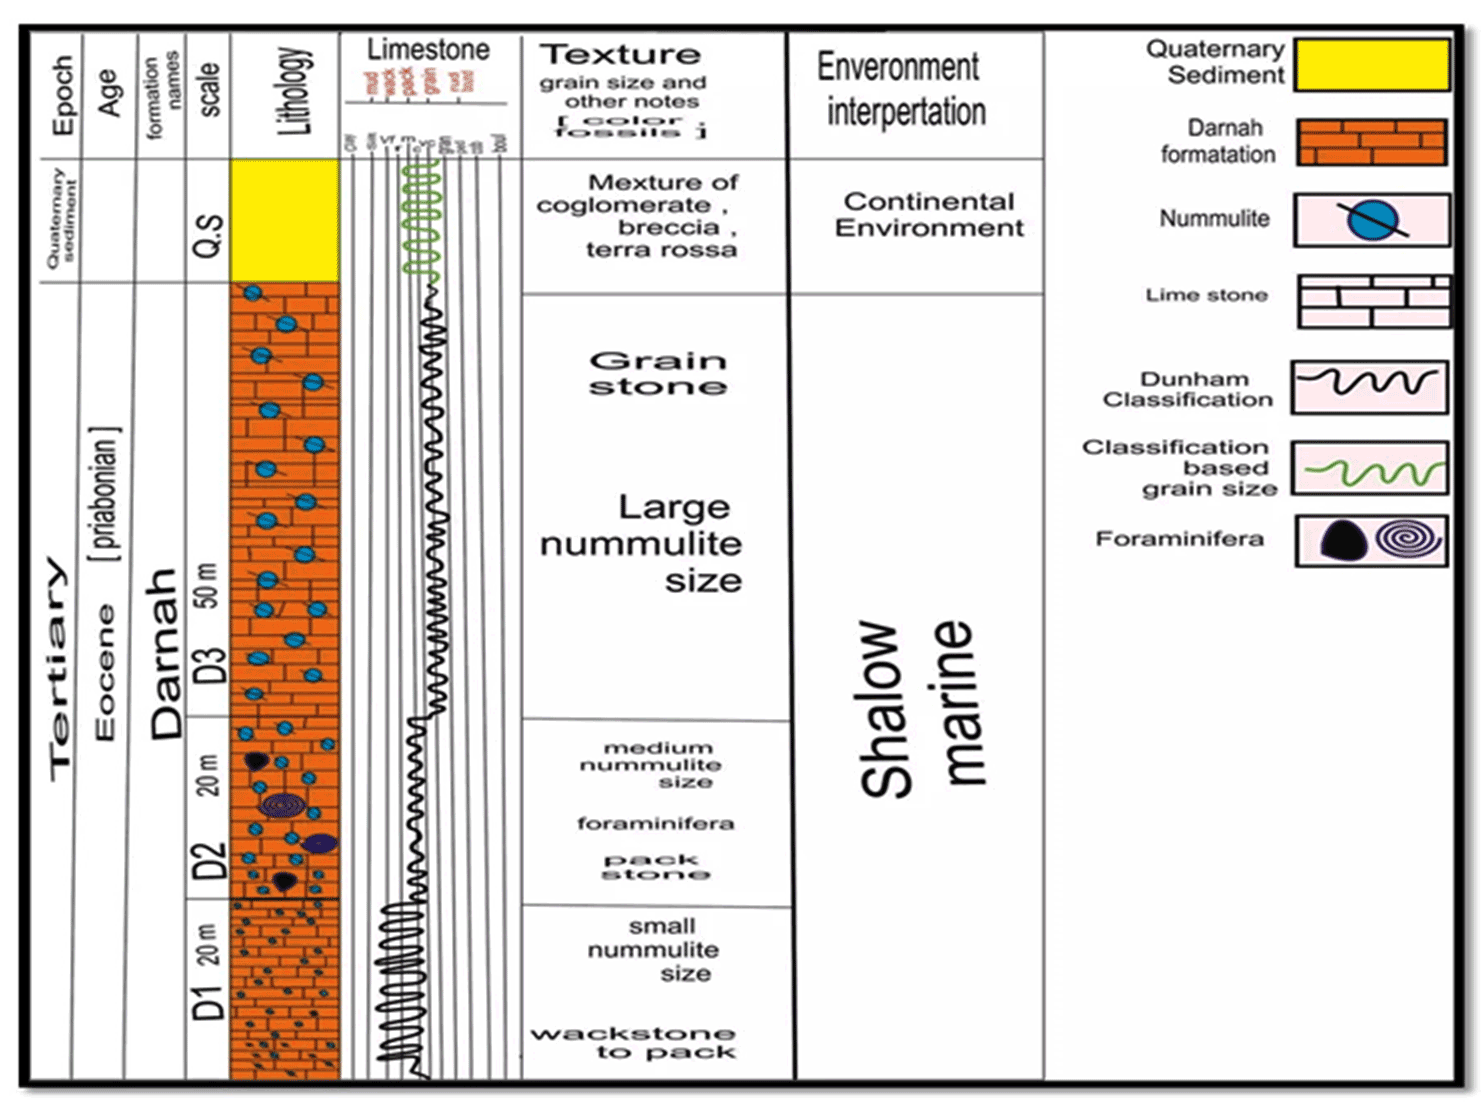
The stratigraphic sequence of Al Jabal Al Ahkdar is represented by a thick sequence of carbonate rocks, ranging in age from Late Cretaceous-Early Miocene. Eight formations have been recognized in Al Jabal Al Ahkdar. These formations, from the oldest to youngest are: Al Hilal, Al Athrun, Al Uwailyah, Apollonia, Darnah, Al Bayda, Al Abraq, and Al Faidiayh formations.
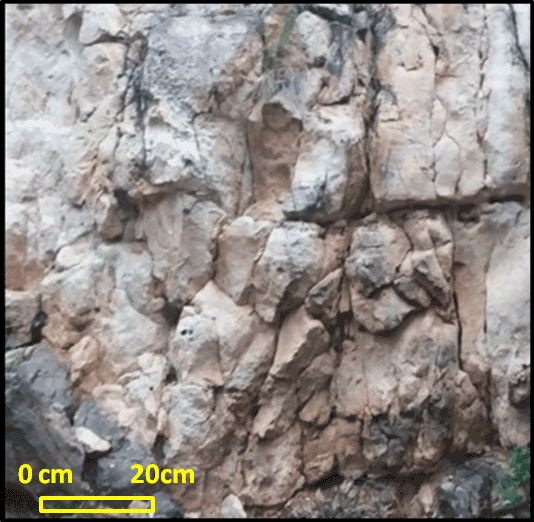
Darnah formation is the only formation in the study area consists of massive limestone, medium to coarse grained, nummulitic, dolomitic and organodetrita limestone with alternating of hard and soft bands of marly limestone. Content of fossil is Nummulites of various sizes are incorporated in micrite cement as well as gastropods, bivalves, corals, shell fragments and echinoids (Pieterz, 1968). The three escarpments of Al Jabal Al Akhdar are marked by three major strike-slip fault zones. The largest fault zone in the area is located between the first and the second escarpments. These zones are accompanied by a great number of small- scale strike-slip faults and normal faults (El Arnauti et al., 2008; El Hawat et al., 2004; El-Amawy et al., 2011; Abd El-Wahed and Kamh 2013).
Al Jabal Al Akhdar region’s geomorphic characteristics are linked to tectonic activity dominated by the Late Cretaceous to late Miocene. Atyaruh Valley has different geomorphic features due to differential weathering processes that took place and climatic conditions during winter seasons where chemical weathering is greatly aided by rainfall.
The aim of this study is to use GIS techniques and structural analysis to define the relationship between faulting and geomorphology in the Wadi Atyaruh by evaluating morphometric parameters such as stream order (Nu), stream length (Lu), bifurcation ratio (Rb), drainage density (D), stream frequency (Fs), texture ratio (T), elongation ratio (Re), circularity ratio (Rc), and shape. Additionally, evaluating karst features to reveal the impact of structures on the morphology and distribution of various karst features.
4 . RESULTS AND DISCUSSIONS
4.1 Structural and Geomorphic Analysis
Al Jabal Al Akhdar was targeted by numerous tectonic events affected Al Jabal Al Akhdar, resulting in uplift in the form of a broad anticline trending NE-SW (El Hawat and Abdulsamad, 2004). Al Jabal Al Akhdar is representing a part in active margin of northern African plate that had been rifted at late Triassic-early Createous and was followed by structural inversion in late Cretaceous-Eocene (Abd El-Wahed and Kamh, 2013). They also identified Al Jabal Al Akhdar as the mobile part of the Cyrenaican platform in the north, which Cyrenaican fault system divided between the south portion (El Werfalli et al., 2000; El-Hawat and Abdulsamad, 2004; El Arnauti et al., 2008; El Amawy et al., 2011).
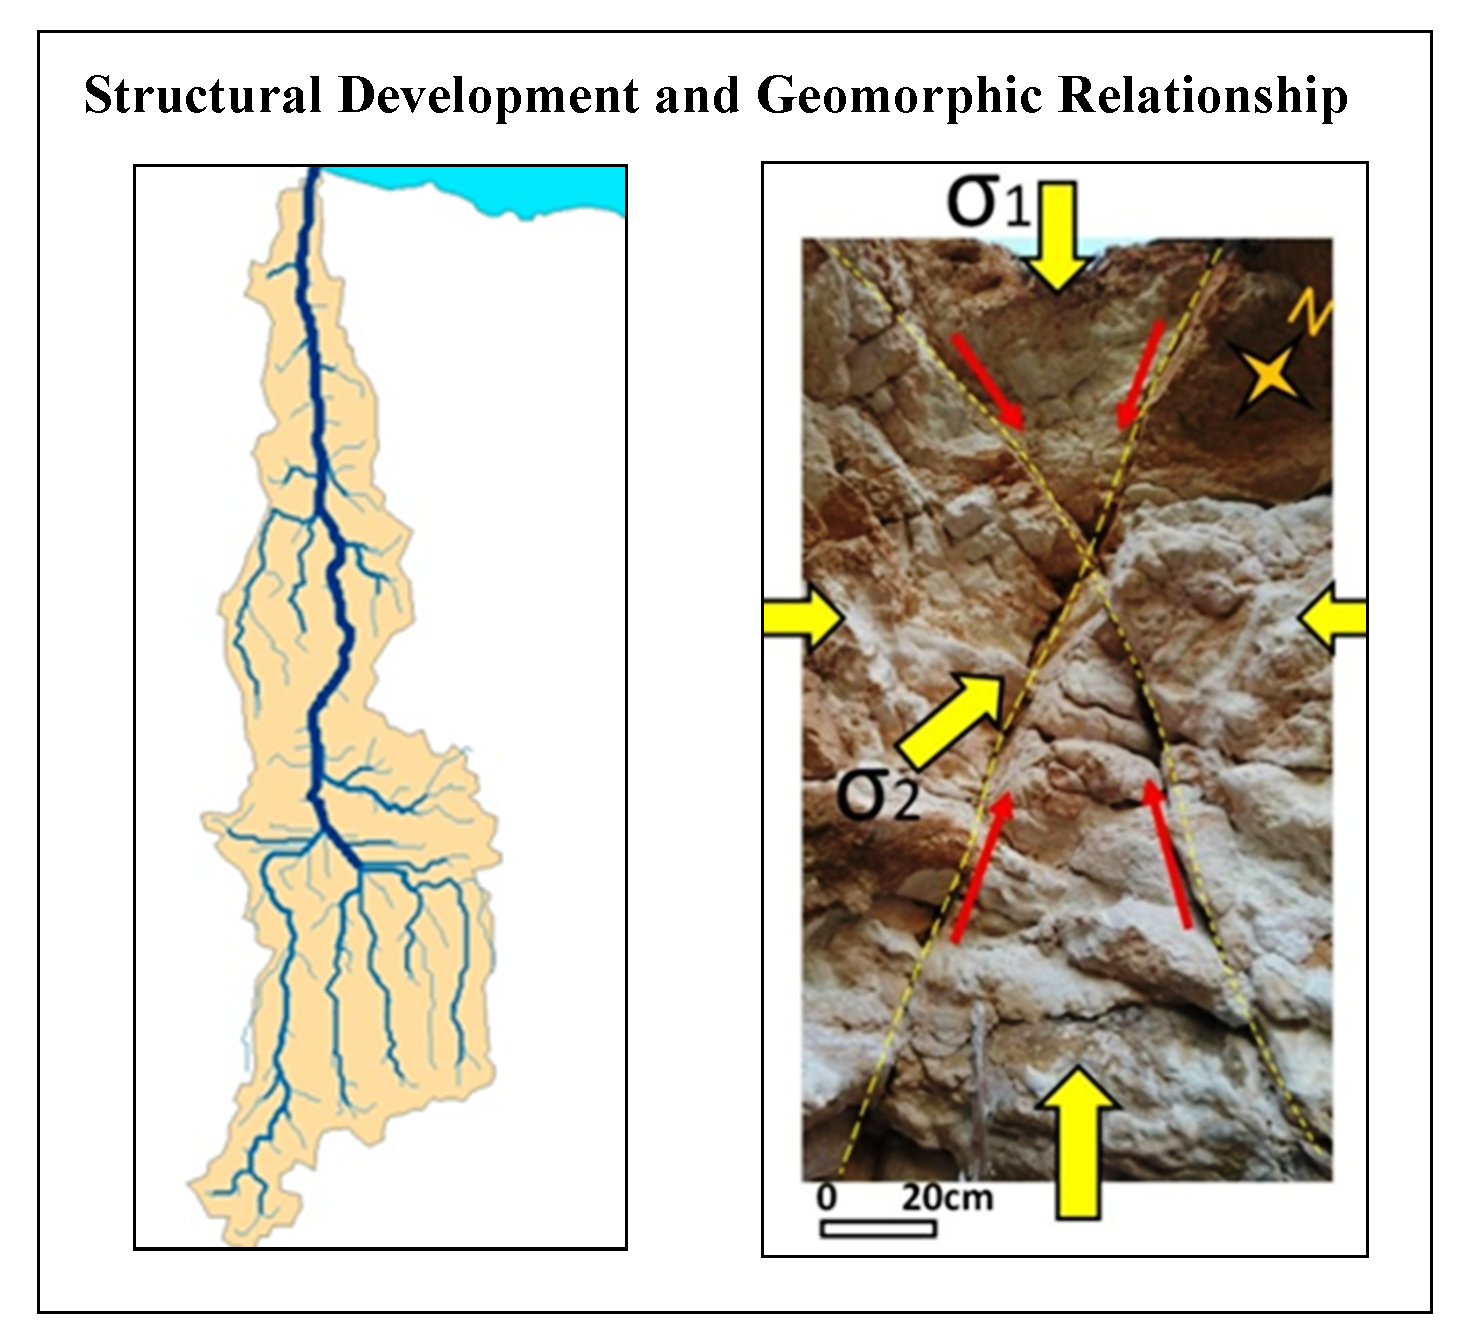
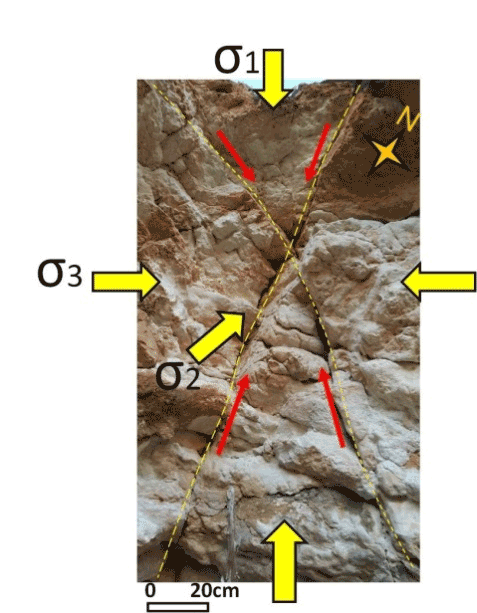
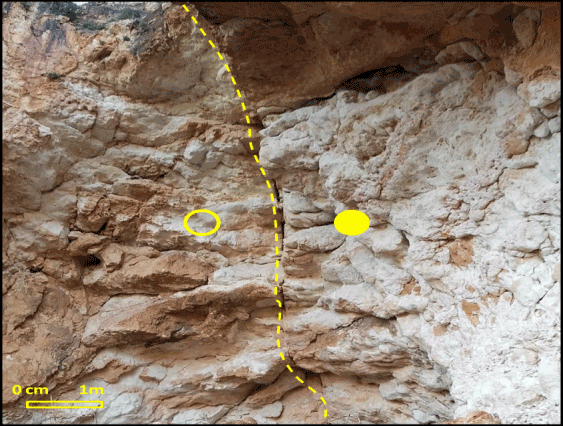
Faults in the study area were organized into two intersecting sets of opposite directions, known as conjugate faults. The study area’s conjugate system has two sets of oppositely dipping faults with lineations perpendicular to the fault intersection line (Figure 3). As we observed, the sense of slip on the two sets is complementary, and the angle between the two sets is constant and the slip direction is in the dip direction. Therefore, the maximum principal stress axis bisects the acute angel of conjugate faults, and the strain plane has been infirmed from the two conjugate faults. Moreover, Dextral Strike-Slip Fault has been found in the study area which is oriented East-West (Figure 4) and the fault zone is highly jointed. There are a lot of faults in the study area have striations that form a small angle to the fault’s strike, indicating that the slip has a dominant strike-slip portion.
Wadi Atyaruh from the valleys that run from the South to North and ends in Mediterranean Sea, with tributaries that run parallel to each other into the sea. Drainage pattern in this valley varies from dendritic (upstream) to sub-parallel (in the middle of the basin), suggesting that the region has been affected by strike-slip movement, joints and steep slopes.
Striations that found on shear fractures and form by physical abrasion of fault’s walls movement is plunging 28°-47°E along Wadi Atyaruh (Figure 5). It mainly denotes strike-slip movement, as well as dextral movement. The evidences of dextral movement along the fault zone are bending of the valley course as letter “S” shape and vertical position of faults. Therefore, the orientation of σ2 represents the point of their intersection and the acute and obtuse angles between the conjugated patterns are bisected by σ1 and σ3.
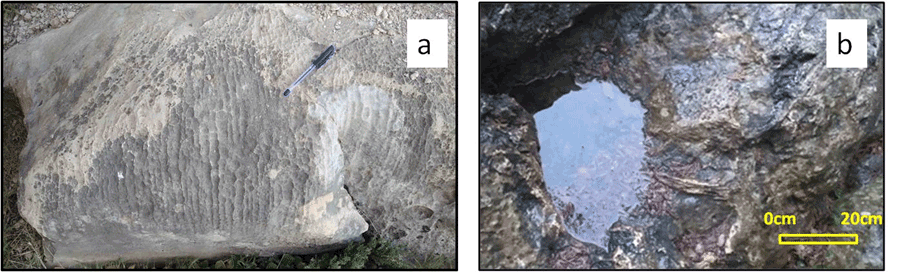
In the study area, there are many factors that responsible for karst features such as Rillen Karren, Solution Basin and Caves. These factors are high relief topography; most of the outcrop consists of pure massive limestone, the intensity of fractures such as faults and joints and their extension in depth, and climate with sufficient rainfall. Most of the valleys in Al Jabal Al Akhdar region, including study area, took their streams through the faults, which allowed the water to flow and eroded quickly and strongly to reach to the crossing of geological structures and heading towards its last station (Mediterranean Sea). The upstream area is dominated by dendritic drainage pattern but in the middle part, sub-parallel pattern is dominated due to jointing and faulting.
Rillen karren are grooves with rounded troughs small solution stream found upon sloping surfaces of limestone (Figure 6.a). They are perfectly developed on the rock surfaces where the water is most highly charged with CO2 and Rillen karren occur on slopes of 45°-75° (Ashahomi, 2008).
Solution basin forms where rocks are more or less horizontal, water collects in pools and basins, as a result of solution by stagnant water, such basins become enlarged, vary in size from few centimeters to two meters in diameter and few millimeters to 50 cm deep. They are usually rounded to oval in plain view and their sides tend to be vertical to gently inclined, while the bottom are smooth and flat. Solution basin is common in Darnah formation (Figure 6.b).
Cave is a natural aperture in the rock that allows human to pass through its. Lithology, joint patterns, cracks, faults, cave breakdown, and evaporate weathering all affect cave form (Lowe, 1992). Their distribution is well in Dernah formation because it is characterized by permeable and jointed limestone bed, and it overlies the low permeability Apollonia Formation.
4.2 Morphometric Characteristics
4.2.1 Contours
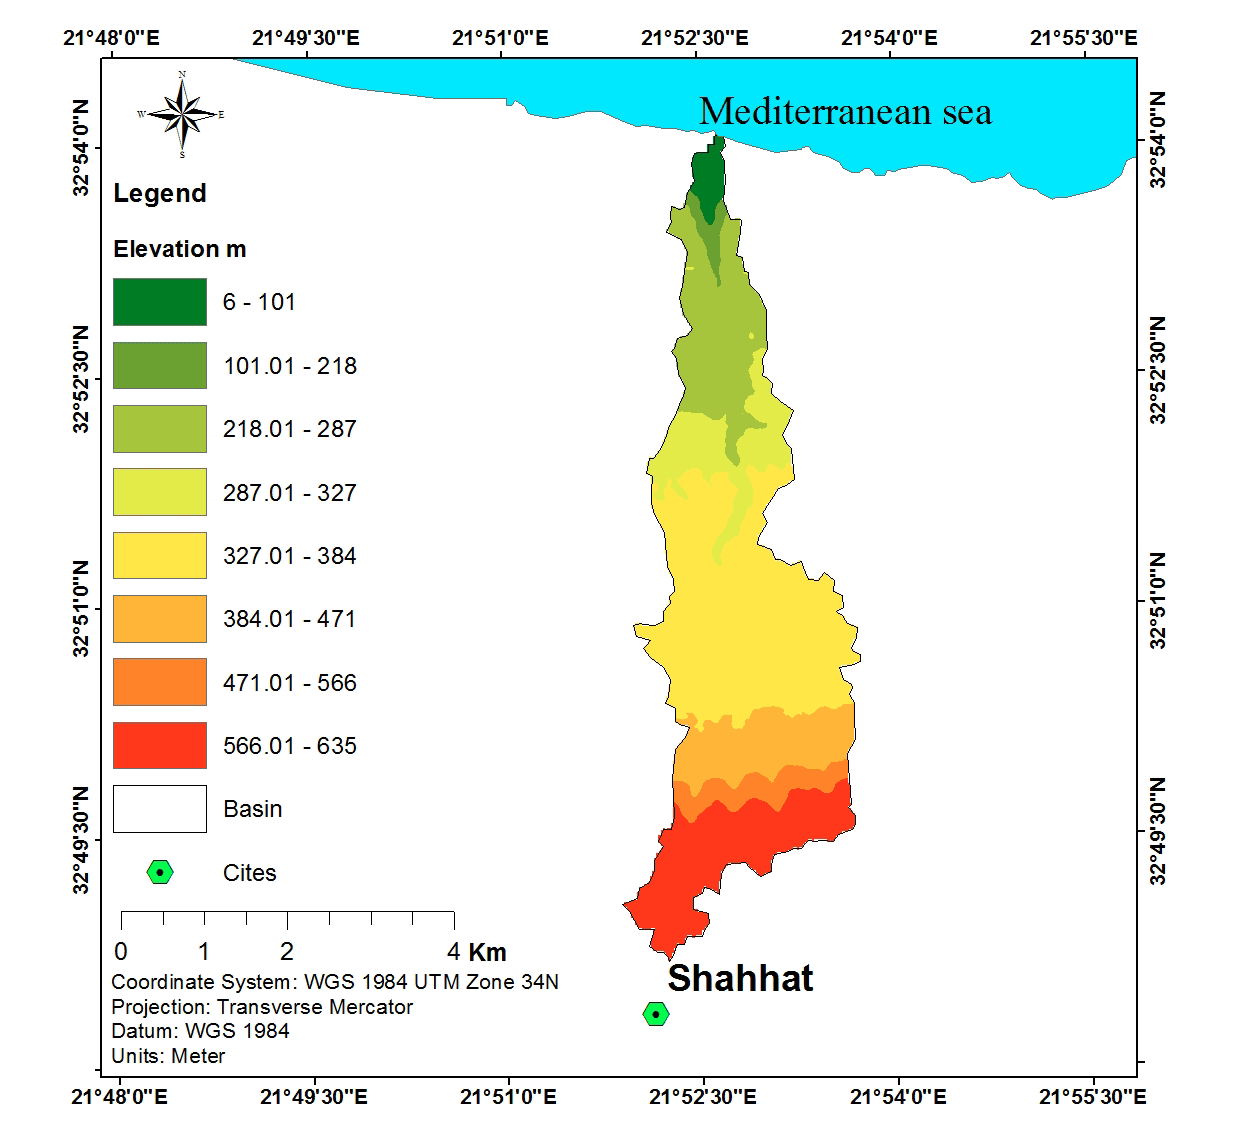
An imaginary line of constant elevation on the ground surface is known as a contour. Contours have been extracted from the DEM of the study area. The contour map highlights the elevation characteristic of the basin area. The lowest contour value is observed in the north side of the basin and highest value is on the south part of the basin. Contour value gradually rises from north side to the south part of the basin (Figure 7).
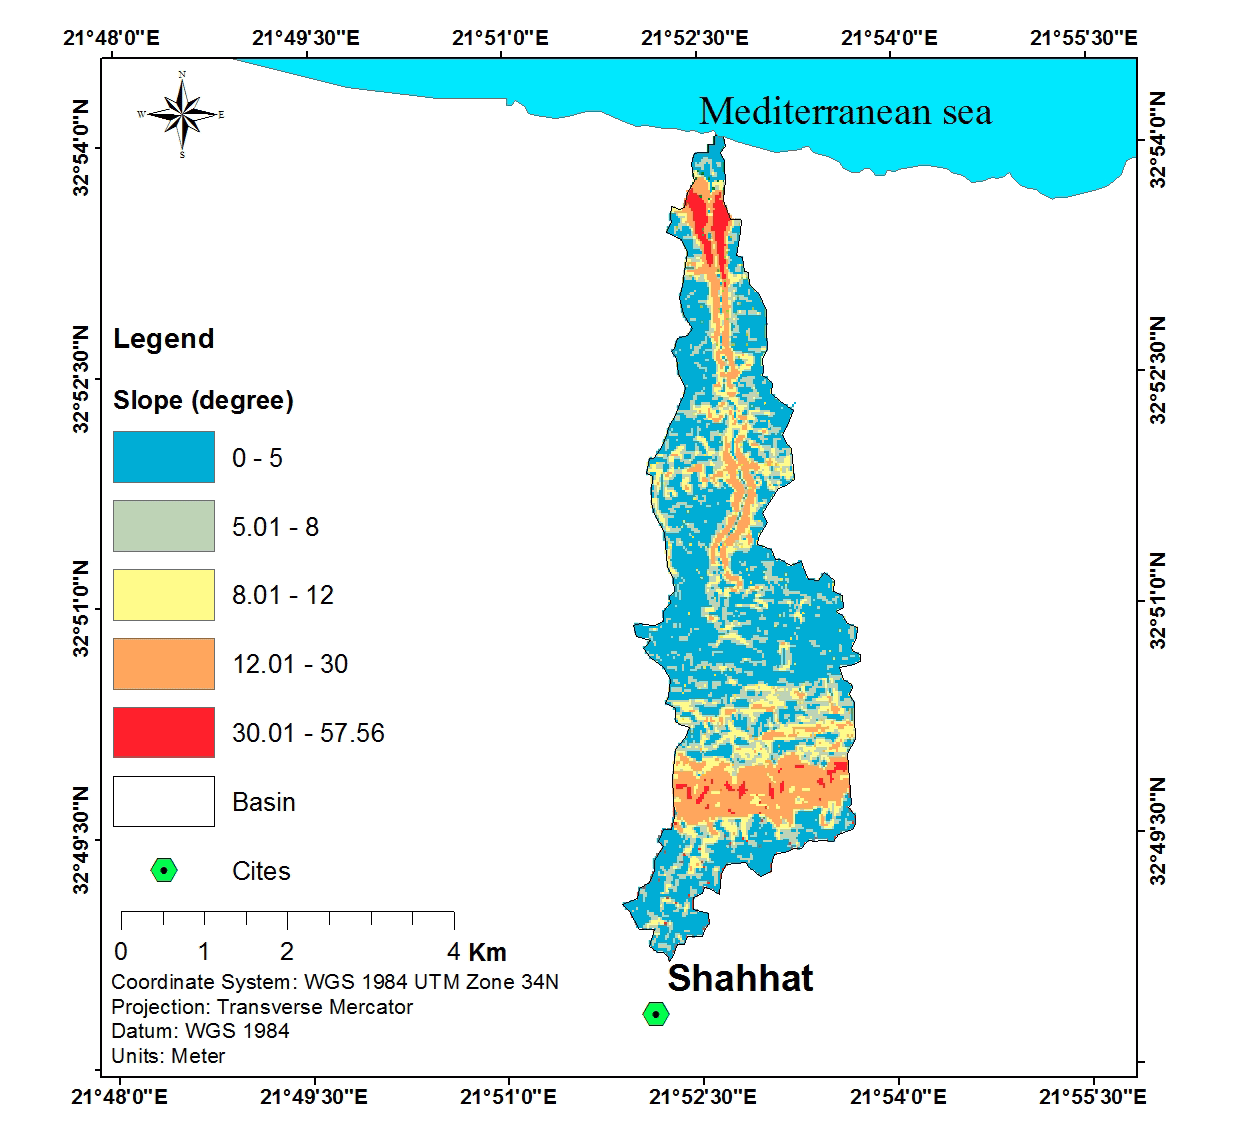
4.2.2 Slope
Slope is the measure of steepness or the angular inclinations of terrain relative to the horizontal plane. The slope map, developed with Arc GIS software with five classes varies from 0º to 57.56º (Figure 8). The calculation of the slope by degree gives more understanding, clearness and more accuracy. At the coastal plain and pediment zones, the bulk of the study area shows a gentle slope (0°-8°). Although moderate slope values (8°-12°) define the foot slopes of upland areas, steep slopes (>12°) are synonymous with the escarpment and hills.
The slope map is useful to explain and interpret the surface relief and classify into plains, mountains, and hills. Also, it helps to classify areas with steep slopes that could be vulnerable to hazards and erosion (mass wasting) and of low slopes, which are suitable for development.
4.2.3 Aspect
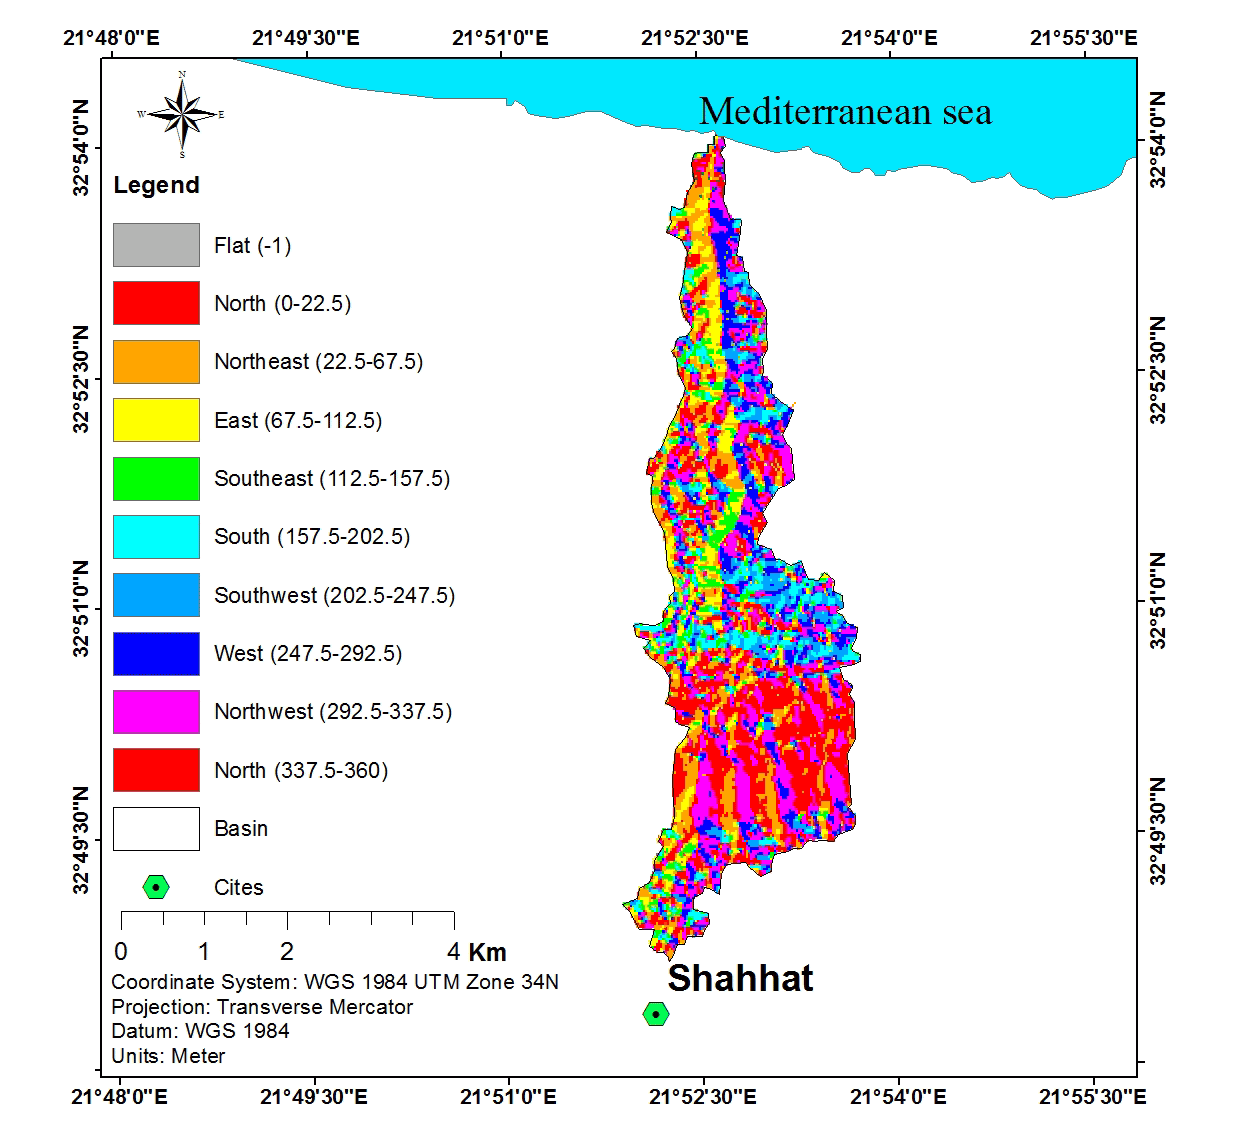
Aspect defined as the orientation of the line of steepest descent and is usually measured in degree clockwise from the North (0º), and again end in the North to complete the cycle (360º) for every cell available in the raster image, the specific slope which produce the aspect. The aspect can be useful in the knowledge of the area for small slope, which used in the different projects, forecasting for the landslide directions, which consider from the strong hazards in the rainy country for long duration. The aspect map is divided into ten classes (Figure 9).
4.2.4 Hill shade
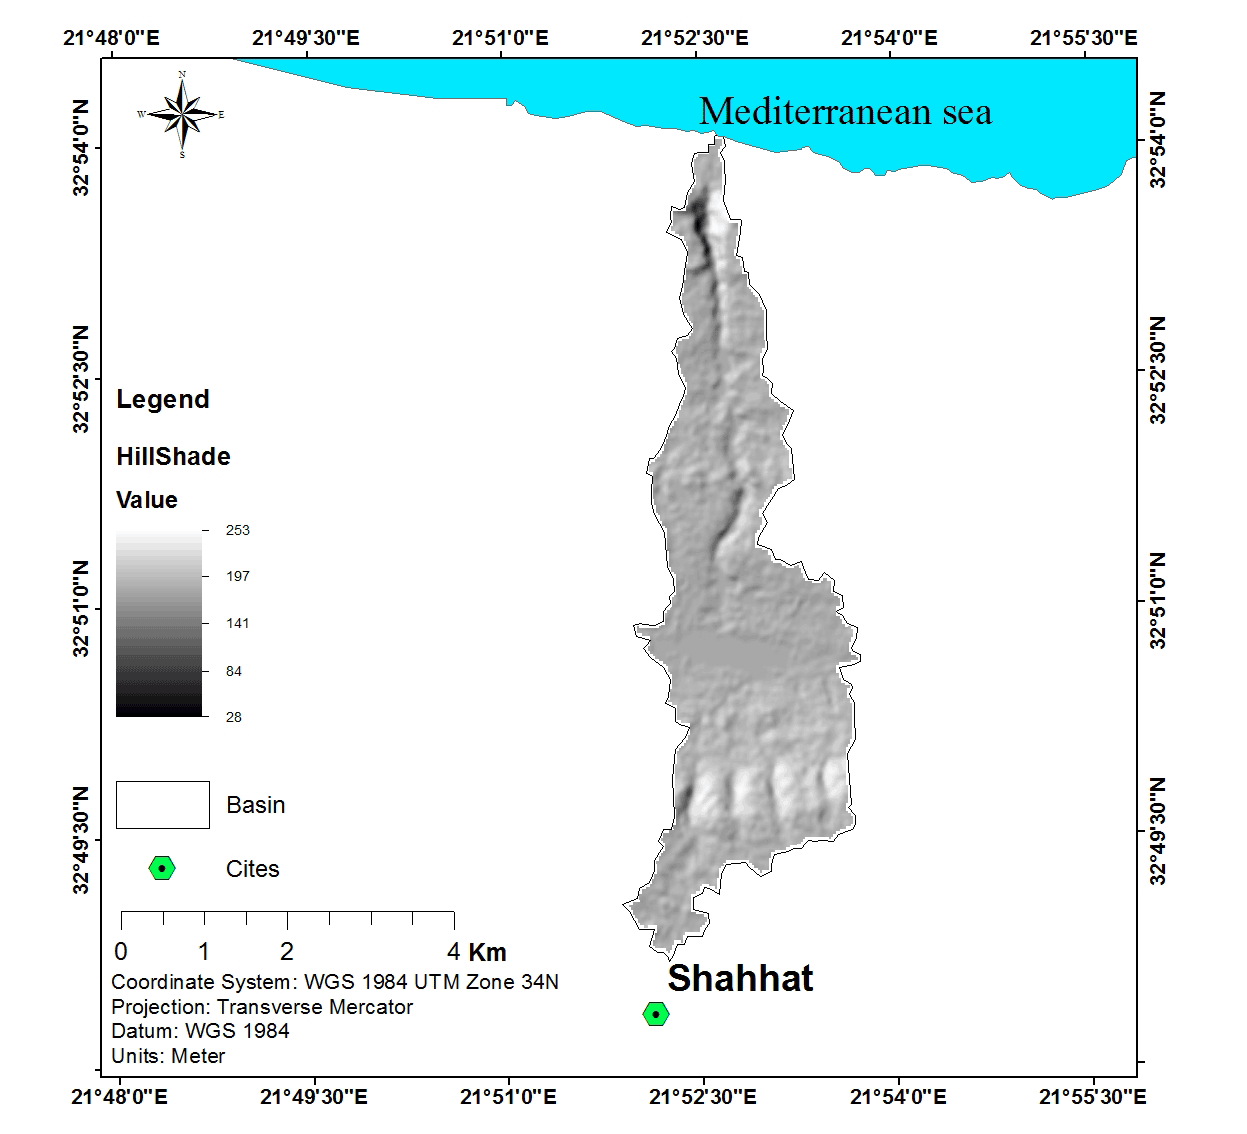
Hill shade features give illuminate supposition surface with determine the values or quantity of lighting for every cell from the raster analysis. Moreover, to complete the shades operation analysis from during the illumination concentration on every cell available in the raster and impact calculation of illuminate on the neighbor cells, using ArcGIS software. Hillshades are widely used to increase the visual qualities of an elevation grid and to assist in easily recognizing where hills and valleys are located. The hill shade map is formed as a grid cell in shaded of gray with values ranging from 28 to 253 rising from black to white (Figure 10). Other morphometric parameters were calculated manually.
4.3 Linear Aspects
Various linear aspects of the basin were determined in this analysis including stream number, stream order, stream length, mean stream length, bifurcation ratio and stream length ratio.
4.3.1 Perimeter (P) and Area (A)
The drainage area (A) is the most important watershed characteristic for hydrologic design because it represents the amount of water that can be produced from rainfall. The current result indicates that the basin covers an area of approximately 13.557 km2 with the basin perimeter (P) specified as the length of the line that defines the basin’s surface divide. The watershed perimeter is roughly 27.39 kilometers.
Table 2. Morphometric analysis
|
Linear aspects
|
|
|
P
|
L
|
W
|
No. of Streams in each order
|
Nu
|
Lu
|
Rb
|
Is
|
|
|
N1
|
N2
|
N3
|
N4
|
|
27.39
|
9.95
|
1.4
|
105
|
21
|
5
|
1
|
132
|
61.6
|
5
|
1.1
|
|
|
Areal aspects
|
Relief aspect
|
|
|
A
|
Fu
|
Dd
|
C
|
Rt
|
Rc
|
Re
|
Ff
|
H
|
Rg
|
RR
|
Rr
|
|
13.557
|
9.722
|
4.537
|
0.221
|
4.8
|
0.227
|
0.417
|
0.137
|
635
|
2.883
|
0.231
|
0.638
|
4.3.2 Length of basin
The distance measured along the main channel from the watershed outlet to the basin divide is generally referred to as basin length. Since the channel does not stretch to the basin-divide a line must be drawn from the channel’s end to the basin-divide, taking the direction where the most water would flow. As a consequence, the length is determined along the main flow direction. The length is calculated by following the main flow direction. The basic input parameter for counting the major shape parameters is basin length. The length of the basin is 9.95 kilometers.
4.3.3 Basin width (W)
It is measured by multiplying the basin area (A) by the basin length (L) and the width (W) of the basin is 1.36 km.
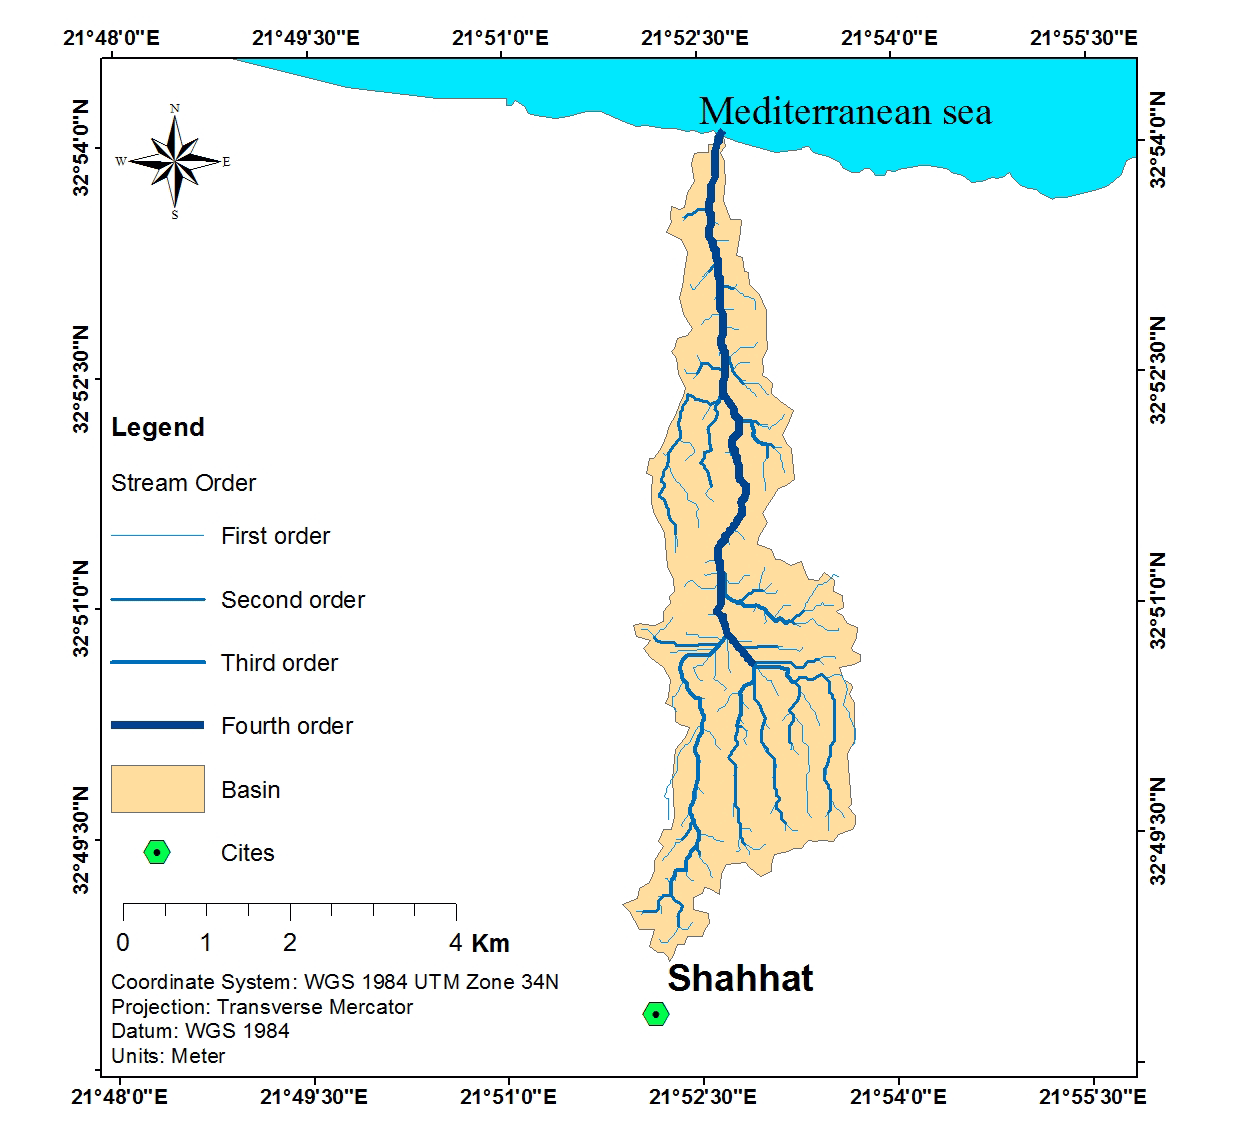
4.3.4 Stream order (U) and stream number (Nu)
By Strahler’s system, it is found that Wadi tyarah basins are of 4th order. In all 132 streams were identified of which 105 are first order, 21 are second order, 5 in third order and 1 in fourth order It is observed that the number of stream decreases as the order of stream increases.
4.3.5 Stream length (Lu)
It has been computed from both drainage density and basin area after Melton 1958. The length of a stream is one of the most important hydrological features of the basin because it shows the characteristics of surface runoff. The stream with a shorter length is typical of areas with steeper slopes and finer textures. The length of the first stream is 30.50 kilometers; the length of the second stream is 16.50 kilometers, and the length of the third stream is 16.50 kilometers. While the length of 3rd stream is 7.60km and the length of 4th stream are 7.08 km. The cumulative lengths of streams is 61.60 km.
4.3.6 Bifurcation ratio (Rb)
The number of stream segments of a given order divided by the number of segments of the next higher order is known as the bifurcation ratio (Rb). The bifurcation ratio is a dissection and relief index. Lower Rb values suggest that the basin has undergone less structural disruption. Higher Rb values suggest that the drainage pattern is under good structural regulation. The average bifurcation ratio is five which fall under normal basin category and less dangerous for flood.
4.3.7 Sinuosity index (Si)
The sinuosity index (Si) is the ratio of main channel lengths to shorter valley lengths or the shorter distance between the mouth and the source of the stream; the sinuosity index value is 1.124, meaning that it is sinuous.
4.3.8 Drainage pattern
The extracted drainage network is characterized generally by dendritic drainage pattern reflecting the homogeneity of the underlying lithology (Figure 11).
4.4 Areal Aspects
The drainage density, stream frequency, drainage strength, drainage texture, infiltration number, texture ratio, elongation ratio, circulatory ratio, shape factor, length of overland flow, and channel maintenance factor of the watershed were calculated as shown in Table 1.
4.4.1 Stream Frequency (Fs(
The number of streams segments per unit area is referred to as stream frequency, and it is related to the value of ground water recharge characteristics in a basin. It’s determined by dividing the total number of streams by the drainage basin’s total area. The values of stream frequency are 9.722 km2 which indicate by permeable rock and low relief of the basin.
4.4.2 Drainage density (Dd)
Drainage density (Dd) was introduced by Horton (1932) as an important measure of the linear scale of land type elements in the stream eroded topography. It’s the ratio of total channel segment length to canal area for all orders within a basin. The drainage density shows how closely channels are spaced offering a numerical estimate of the average length of stream channel for the entire basin. Drainage density measurements taken through a wide range of geologic and climatic forms have shown that low drainage density is more likely to occur in regions with highly resistant highly permeable subsoil content under dense vegetative cover and where relief is low, according to drainage density measurements taken over a wide range of geologic and climatic forms.
The drainage density (Dd) is 4.537 km/km2, suggesting medium drainage densities. The basin’s medium drainage density means that the subsoil and vegetative cover are highly permeable.
4.4.3 Constant channel maintenance (C)
The inverse of drainage density was called constant of stream maintenance C as suggested by Schumm (1956). This constant, expressed in A/Elu, has a length dimension and thus increases in magnitude as the size of the land-form unit increases.
The constant C specific tells us how many square feet of watershed surface are required to support one linear foot of the stream; the value C of the basin is 0.221.
4.4.4 Length of overland flow (Lo)
It is the distance that water passes across the ground surface until it is concentrated into a stream channel (Horton, 1945). Lo is one of the most important independent variables influencing drainage basin hydrologic and physiographic growth. The inverse of drainage density divided by half equals the length of overland flow.
This factor is inversely proportional to the average channel slope and is to a large extent, synonymous with the length of sheet flow. The (Lo) value of the study area is 0.110.
4.4.5 Drainage texture
It denotes how closely the channels are spaced (Horton, 1932) According to Smith (1950), drainage texture is determined by a variety of natural factors including climate, rainfall, infiltration capacity, rock and soil type, relief, vegetation and development stage.
Drainage texture values of 0-4 mean coarse, 4-10 indicate moderate, 10-15 mean fine, and>15 mean very fine, according to the classification. Since the drainage structure value is 4.82 n/km, the study area has a moderate drainage texture structure
4.4.6 Circulation ratio
Circularity Ratio is defined as the ratio of the basin area (A) and the area of circle with the same perimeter as that of the basin (Miller, 1953). The length and frequency of streams, geological structures, land use/land cover, climate and watershed slope all affect it. Rc value is 0.227 reflecting that the basin is elongated with moderate to low relief and tends to be less affected by structural disturbances.
4.4.7 Elongation ratio (Re(
Elongation ratio (Re) was defined by Schumm (1956), as the ratio between the diameters of a circle of the same area as the basin to the maximum basin length. Re varies from 0.6 to 1.0, Values near to 1.0 are typical of regions of very low relief indicated nearly circular, whereas values in the range 0.6 to 0.8 are generally associated with strong relief and steep slopes indicated the elongation of the basin (Strahler, 1964).
The Re value is 0.412 indicating moderate to slightly steep ground slope and area when collaborated with Strahler’s range seem to suggest elongated shape.
4.4.8 Form factor (Ff)
Form factor (Rf) is the ratio between the basin area (A) to the basin length (L) and is computed with Horton’s formula (1932), the value is nearer to 0 indicates a highly elongated shape and the value that is closer to one indicates circular shape. The Rf is 0.137 which indicating the basin is elongated with lower peak flows of longer duration than the average.
4.4.9 Lemniscate’s factor (k)
Chorley et al. (1957) use the lemniscate ratio, and they defined it as the ratio of the square of the basin length (L) to the basin area (A),
K = L2/4A
where (A) is the basin area (km2) and (L) is the basin length (km)
In the study area the Lemniscate value is 1.823 this value represent elongated of the basin with nearly pear shaped.
4.5 Relief Aspects
Relief aspects of a drainage basin replicate the topographical gradient characteristics of the basin and give a bird’s eye view of the whole area (Pophare and Balpande, 2014). The relief aspects of watershed such as total relief, relief ratio, relative relief and ruggedness number were computed using the methods as described in Table 2.
4.5.1 Basin relief (H)
An area is of low relief if the relief would be less than 0.3 km and the high relief area if higher than 0.3 km. High relief suggests high water flow gravity and land infiltration and high runoff conditions. According to Patil et al., (2015) in the present study, the basin relief is calculated to be 635 m which shows the basin as high relief region (Figure 12).
4.5.2 Relief ratio (Rr)
The relief ratio (Rr) enables us to measure steepness of a drainage basin and is an indication of the strength of an erosion in at the slope of the basin. The basin relief ratio is 0.638 which suggests a mild relief and a steep to the medium slope.
4.5.3 Relative relief (RR)
Relative relief (RR) is defined as the ratio in between Basin relief (the maximum elevation difference within the catchment area) and the perimeter of the basin. The value of RR is 0.231 m/km within the studied region.
4.5.4 Ruggedness number (Rg)
Its product of the maximum basin relief (H) and drainage density (Dd) divided by 1000, where both parameters are in the same unit and known as the ruggedness number. The value of the ruggedness number in the study basin is 2.83.
4.5.5 Hypsometric analysis
Analysis of hypsometric is being used to distinguish between land erosion forms at varying stages during their evolution (Strahler, 1952 and Schumm, 1956). Hypsometric integral (Hi) is the area below the curve that relates the percentage of total relief to the accumulated percent of the area.
Hypsometric integral (Hi) = (basin area (A)) / (basin relief (H)) (km/m)
Strahler (1952) stated that the hypsometric integration value of 0.3 and less indicates the monadnock process and so the watershed is stabilized and no further erosion is anticipated. Where (Hi) values between 0.3 and 0.6 represent a stable or mature stage of a basin, (Hi) ≥ 0.6 corresponds to a balanced or young stage indicating the vulnerability of the watershed to erosion, the study basin value is 0.0213. The hypsometrical integral is the value that indicates the percentage of rock that still awaits removal.


 ,
MacTar Mohamed 1
,
MacTar Mohamed 1
 ,
Alzubair Abousaif 2
,
Alzubair Abousaif 2