1 . INTRODUCTION
Morphometric analysis of a drainage basin is a quantitative definition of a basin and an essential part of understanding the basin’s character (Strahler, 1964). By using this technique, the structure, shape, and dimensions of landforms on the Earth’s surface are determined and mathematically analyzed (Asfaw and Workineh, 2019). Morphometric analysis is significant for investigating and managing the watershed (Sahu et al., 2017) to determine the drainage characteristics (Sujatha et al., 2015). Understanding the connections between morphometric features and hydrological parameters is critical (Goyal and Munoth, 2019). The morphometric analysis is essential to evaluate and determine the drainage pattern and characteristics (Chavare and Shinde, 2013).
Stream order, bifurcation ratio, and stream-length ratio can all be used to determine a drainage basin’s stream structure (Horton, 1945). Several factors, such as geology, structural elements, geomorphology, land use\land cover types, available water supplies, soil and plant life of a region which it passes through, affect the creation of a drainage system over space and time (Pande and Moharir, 2017). Therefore, valuable resources for hydrological studies and river basin management plans are provided by quantitative assessments of drainage basins (Saha and Singh, 2017).
By analyzing various linear and areal parameters of the watershed, a morphometric analysis may be used to prioritize micro watersheds (Biswas et al., 1999). In the field of natural resource management, prioritization of watersheds has become increasingly important, particularly when it comes to watersheds management. Watershed management prioritization has historically focused on land use and morphometric analysis (Mohd Iqbal, 2014). The use of morphometric drainage parameters to analyze a watershed is important for watershed planning. The finest scheme for evaluating the relationship between different factors in a watershed is to use morphometric analysis (Sukristiyanti et al., 2018). The most advanced watershed development, management and analysis methods for prioritizing micro-watersheds for development are RS and GIS (Nooka Ratnam et al., 2005).
In order to consider its role in the effective planning of water harvesting, groundwater recharge projects, and soil erosion, individual morphometric typical is treated as a single parameter, with weighting dependent on knowledge (Wandre et al., 2013), and it is a prerequisite to any hydrological study (Rai et al., 2017). The river basin’s drainage network study was attained to help offer a quantitative overview of what is already there in drainage networks’ behavior and their interrelation with each other (Wandre et al., 2013). Any hydrological research has a major impact in groundwater assessment, watershed planning, and environmental conservation are only a few examples (Rai et al., 2017; Singh et al., 2019). RS and GIS methods have recently been used effectively as instruments to determine and define the basin morphometry numerically (Biswas et al., 1999). DEM data, RS and GIS systems have proven to be effective tools in drainage extraction. A good database for water resource management is a GIS-based study of morphometric factor extraction at the basin level. The results of various linear, aerial, and linear aspects of the basin showed that groundwater management activities in the basin have good prospects and potential (Saha and Singh, 2017). Using satellite remote sensing data will substantiate a feasible form of hydrological response characterization behavior of the watershed. Drainage extraction is important for scrutiny and gauging different morphometric parameters of linear aspect, aerial aspect, and relief aspect (Kannan et al., 2018; Rai et al., 2017). This analysis has primary objective to explain, appraise and provide reckonable figures on the drainage system’s morphometric characteristics and hydrologic activity to consider the possibility of erosion risks of soils for soil and water conservation of the Megech and Dirma rivers of the Abbay basin, Northwest Ethiopia.
2 . MATERIALS AND METHODS
Morphological parameters have been frequently used to measure a watershed’s hydrological response due to a strong reciprocal association between runoff characteristics and watershed terrain features (Khurana et al., 2020). The remotely sensed data and a GIS-based approach are more appropriate than conventional methods for evaluating morphometric drainage parameters and their effect on landforms, soils and eroded land characteristics at the river basin level. The interpretation of multispectral satellite sensor data is instrumental in the study of the delineation of distinct geological and landform units, as well as degraded lands, are all dependent on drainage parameters (Reddy et al., 2004). The linear, areal and relief aspects were determined using drainage structural analyses of Megech-Dirma sub-basins of the Blue Nile. It is more appropriate, reliable, and economical to use remotely sensed data (ASTER GDEM) with GIS techniques software such as ArcMAP 10.3 and others to organize and synthesize spatial information than traditional methods to derive drainage network and morphometric parameters of river basins (Barman and Goswami, 2015). However, as a limitation, other statistical methods are not employed to compare the impact strength of each morphometric parameter on the drainage attributes.
2.1 The Study Watersheds
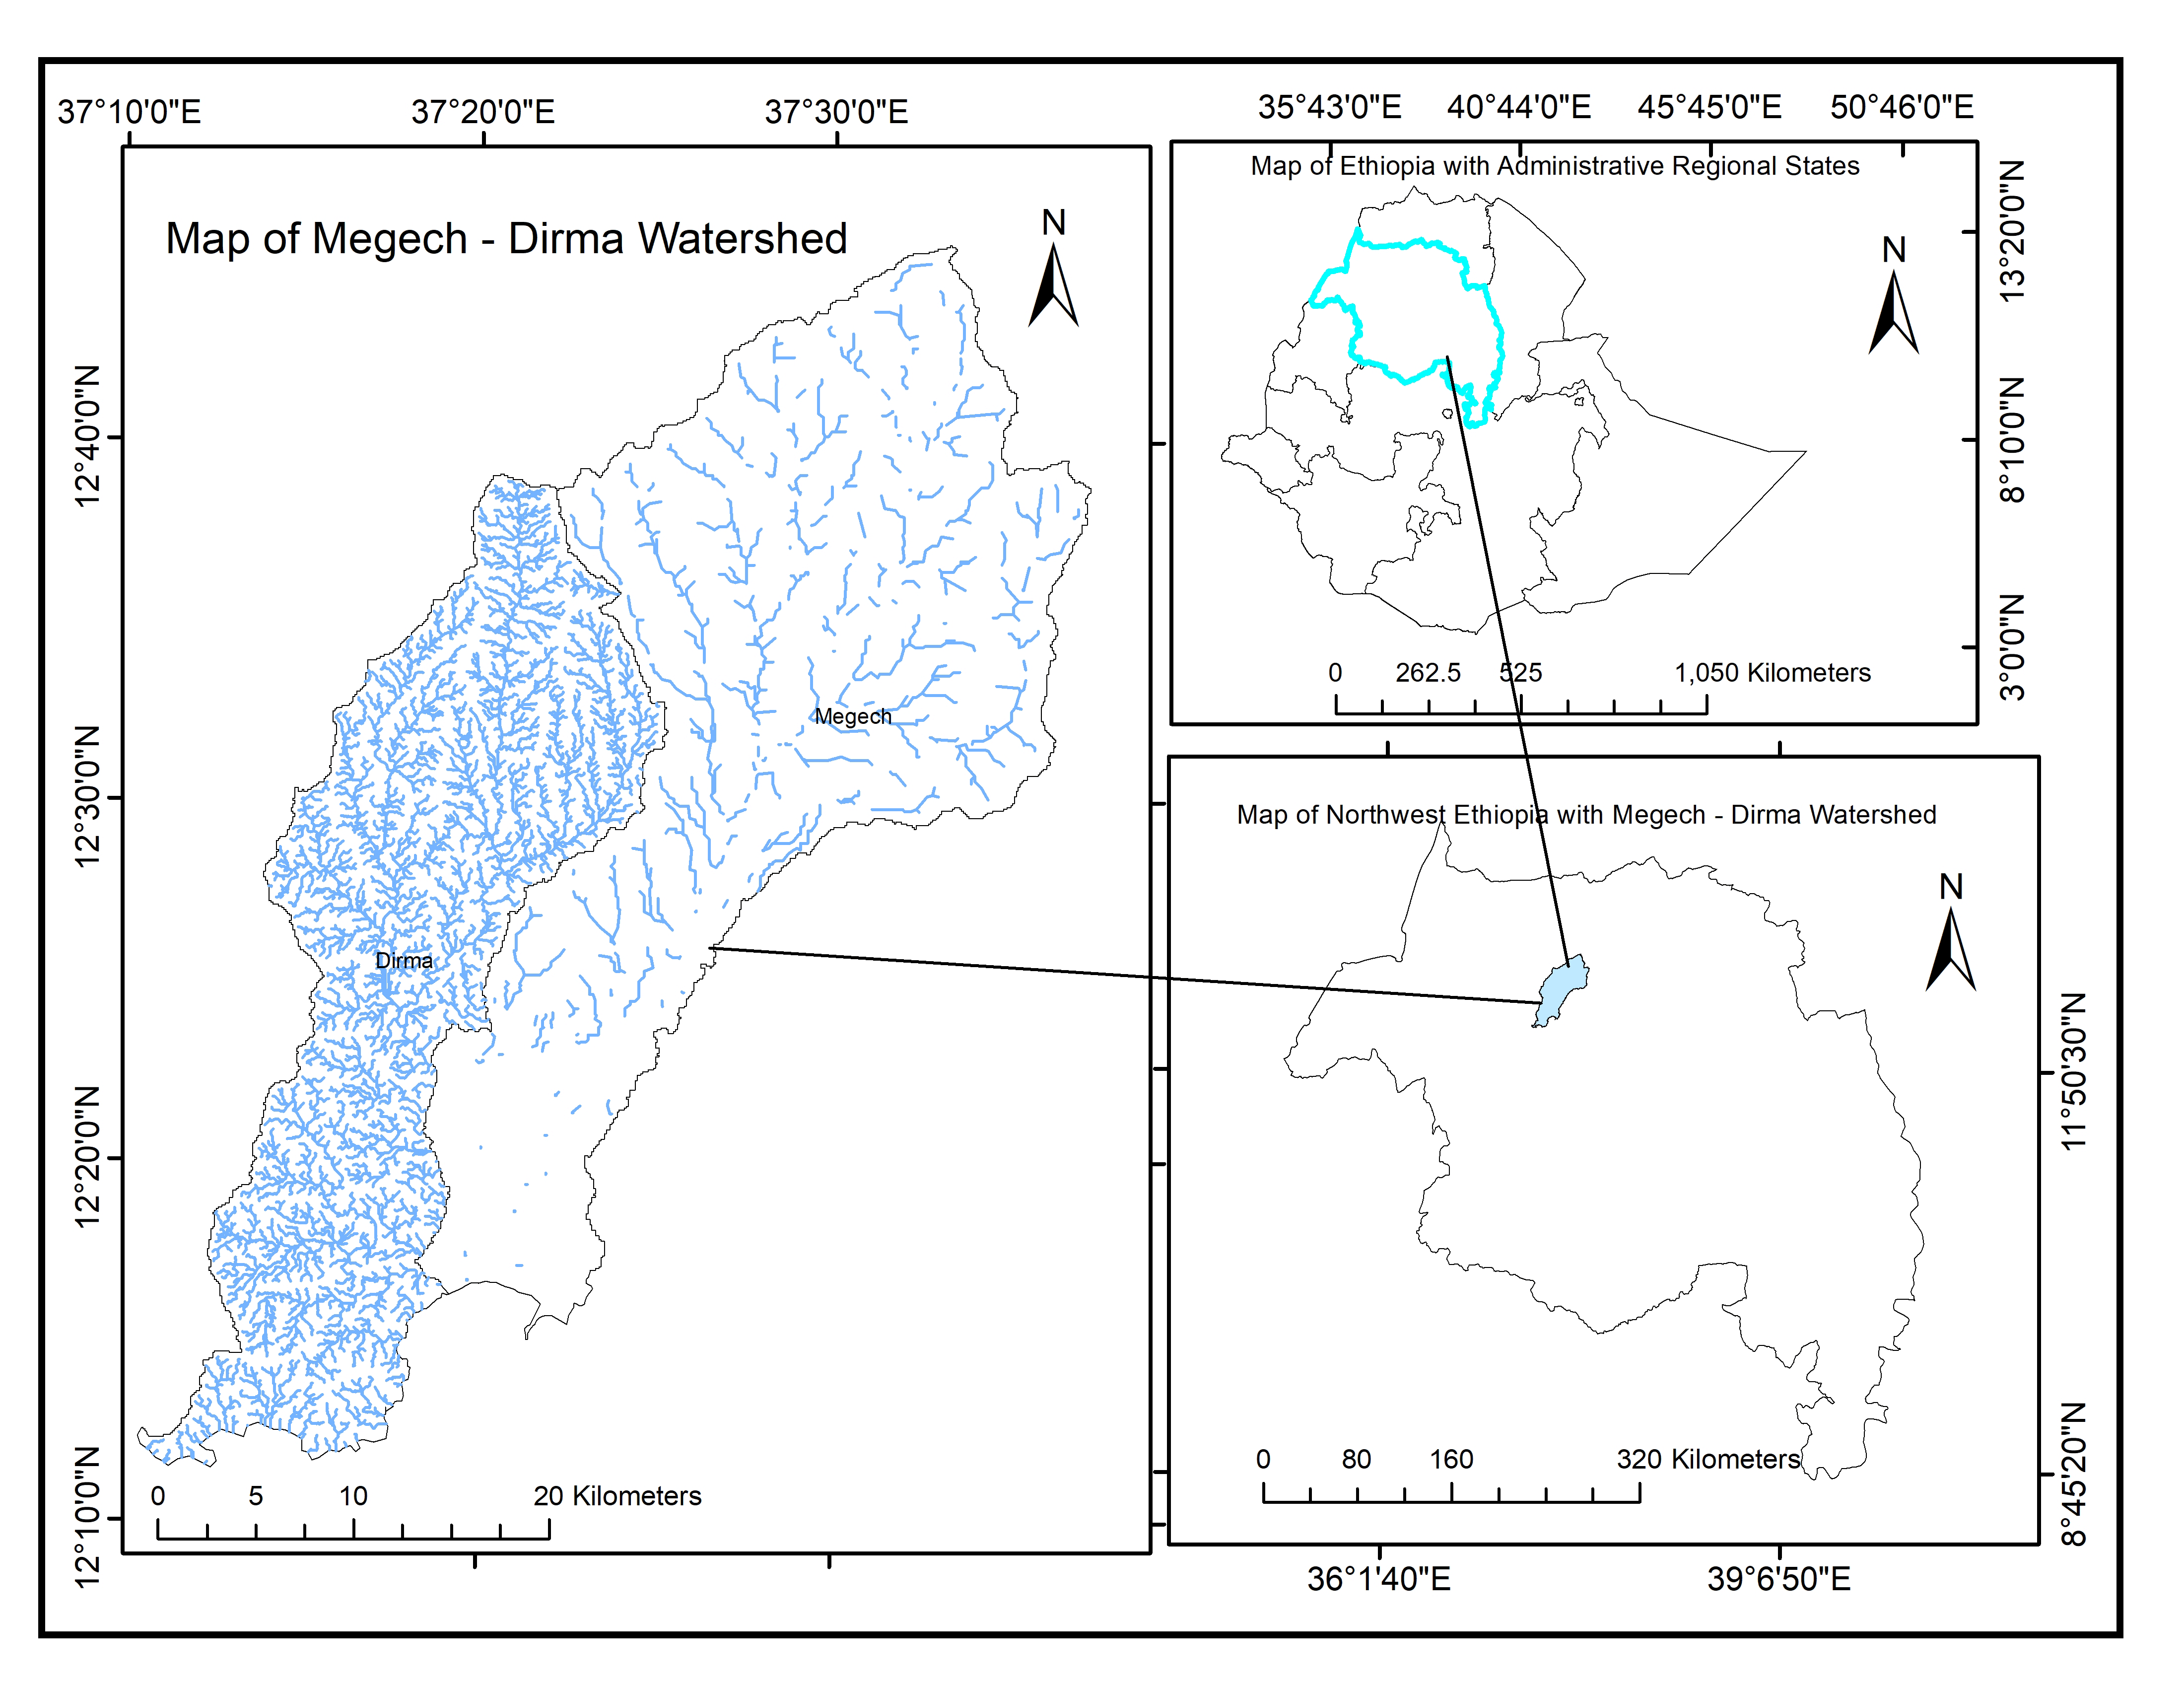
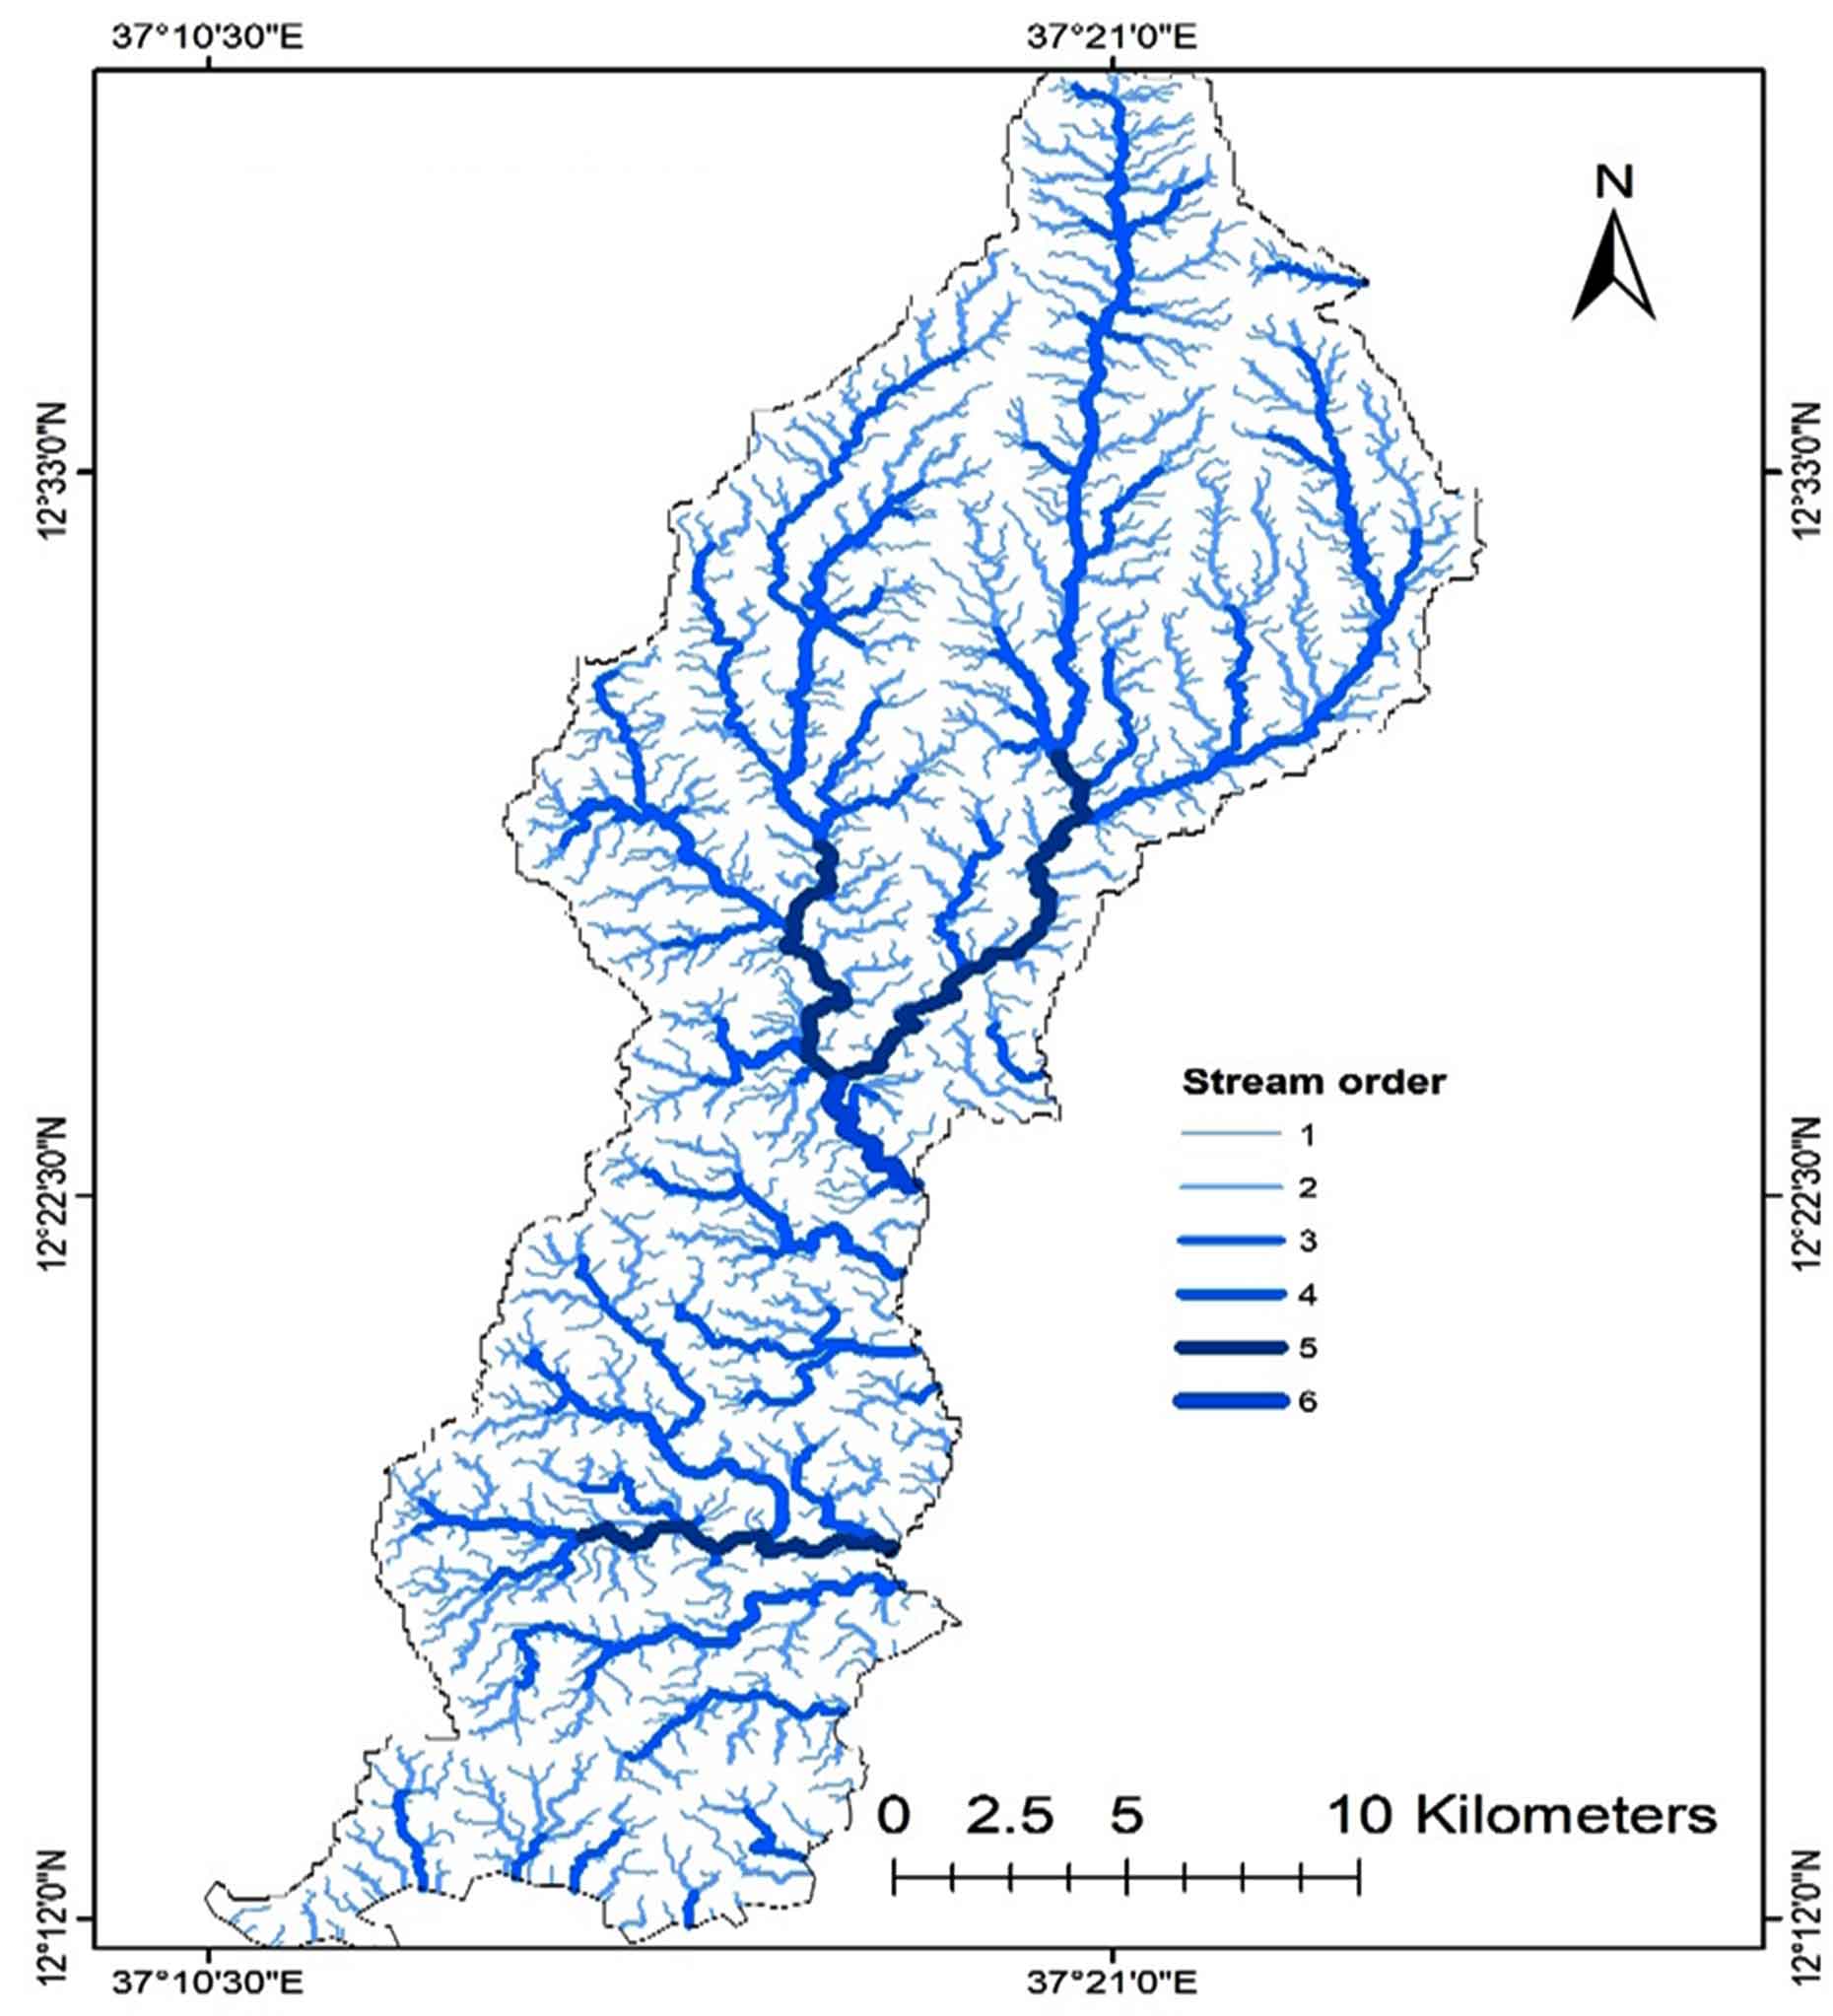
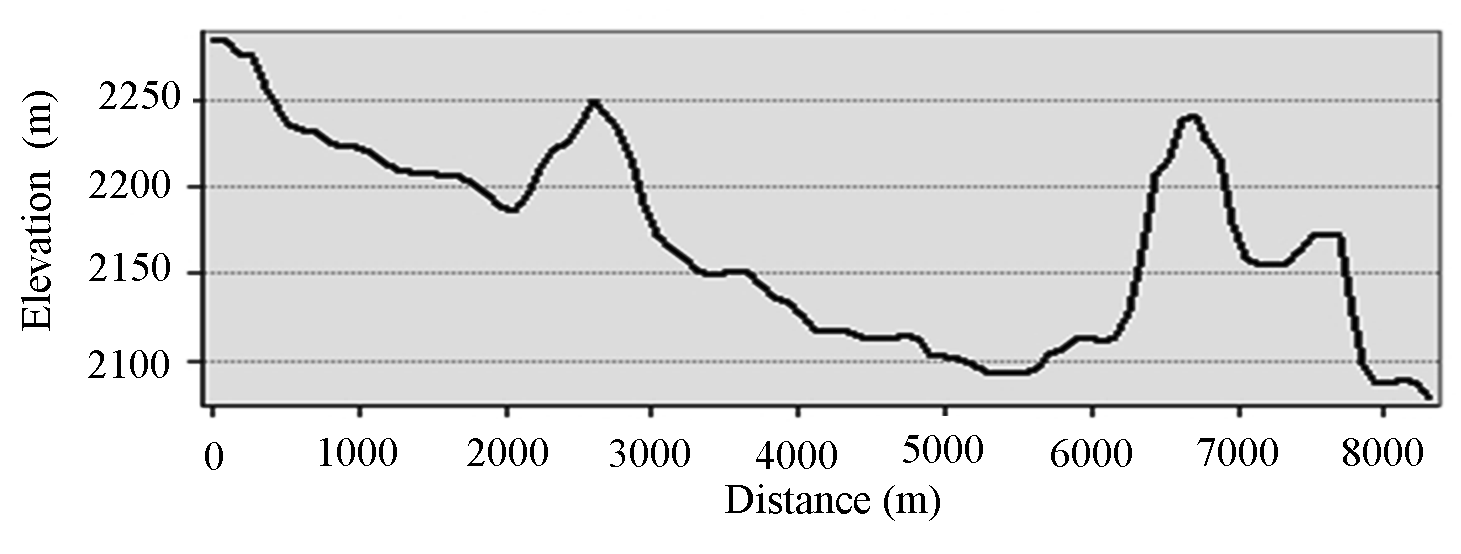
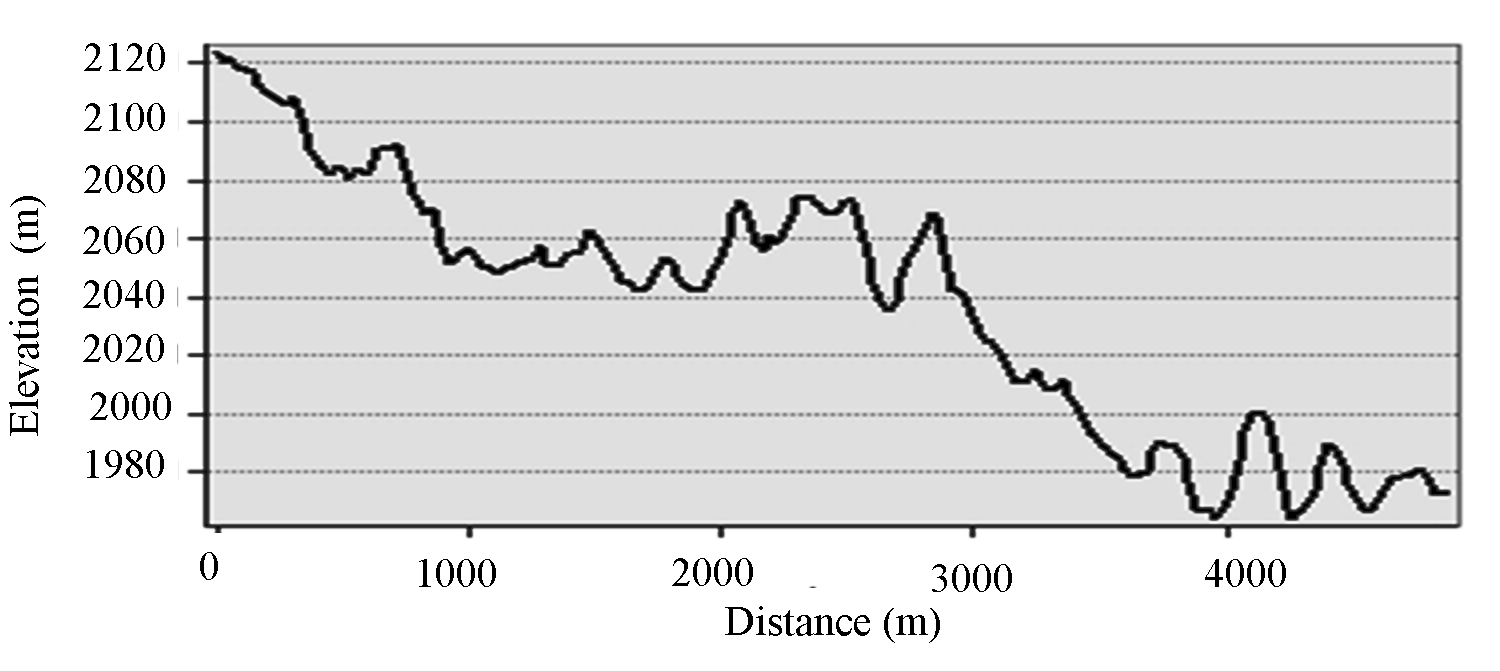
Megech and Dirma River sub-basins are from major sub-basins of Lake Tana in Upper Blue Nile basin, Ethiopia (Asitatikie and Gebeyehu, 2020). They rise just from the highlands of Lay Armachiho and Gondar City area and have a catchment area of approximately 1309.56 km2. The catchment elevation is ranging between 1755-2985 m above sea level. Megech-Dirma rivers found between 12°20′ 39″ N to 12°40′ 39″ N latitudes and 37°10′ 30″ E to 37°31′30″ E longitudes (Figure 1). Megech and Dirma rivers are initiating from the Layarmachiho and Wogera highlands flow southward crossing the Gondar Zuria and Dembia floodplain into Lake Tana. The watershed area according to the Central Statistics Authority, 2004, the area is densely populated. This has a variety of effects on resource bases, such as deforestation, residential development, and agricultural property (Abdi et al., 2016). The farmers use the catchment for traditional irrigation agriculture for long years. The upstream of the watershed is characterized as steep mountainous (Figure 2).
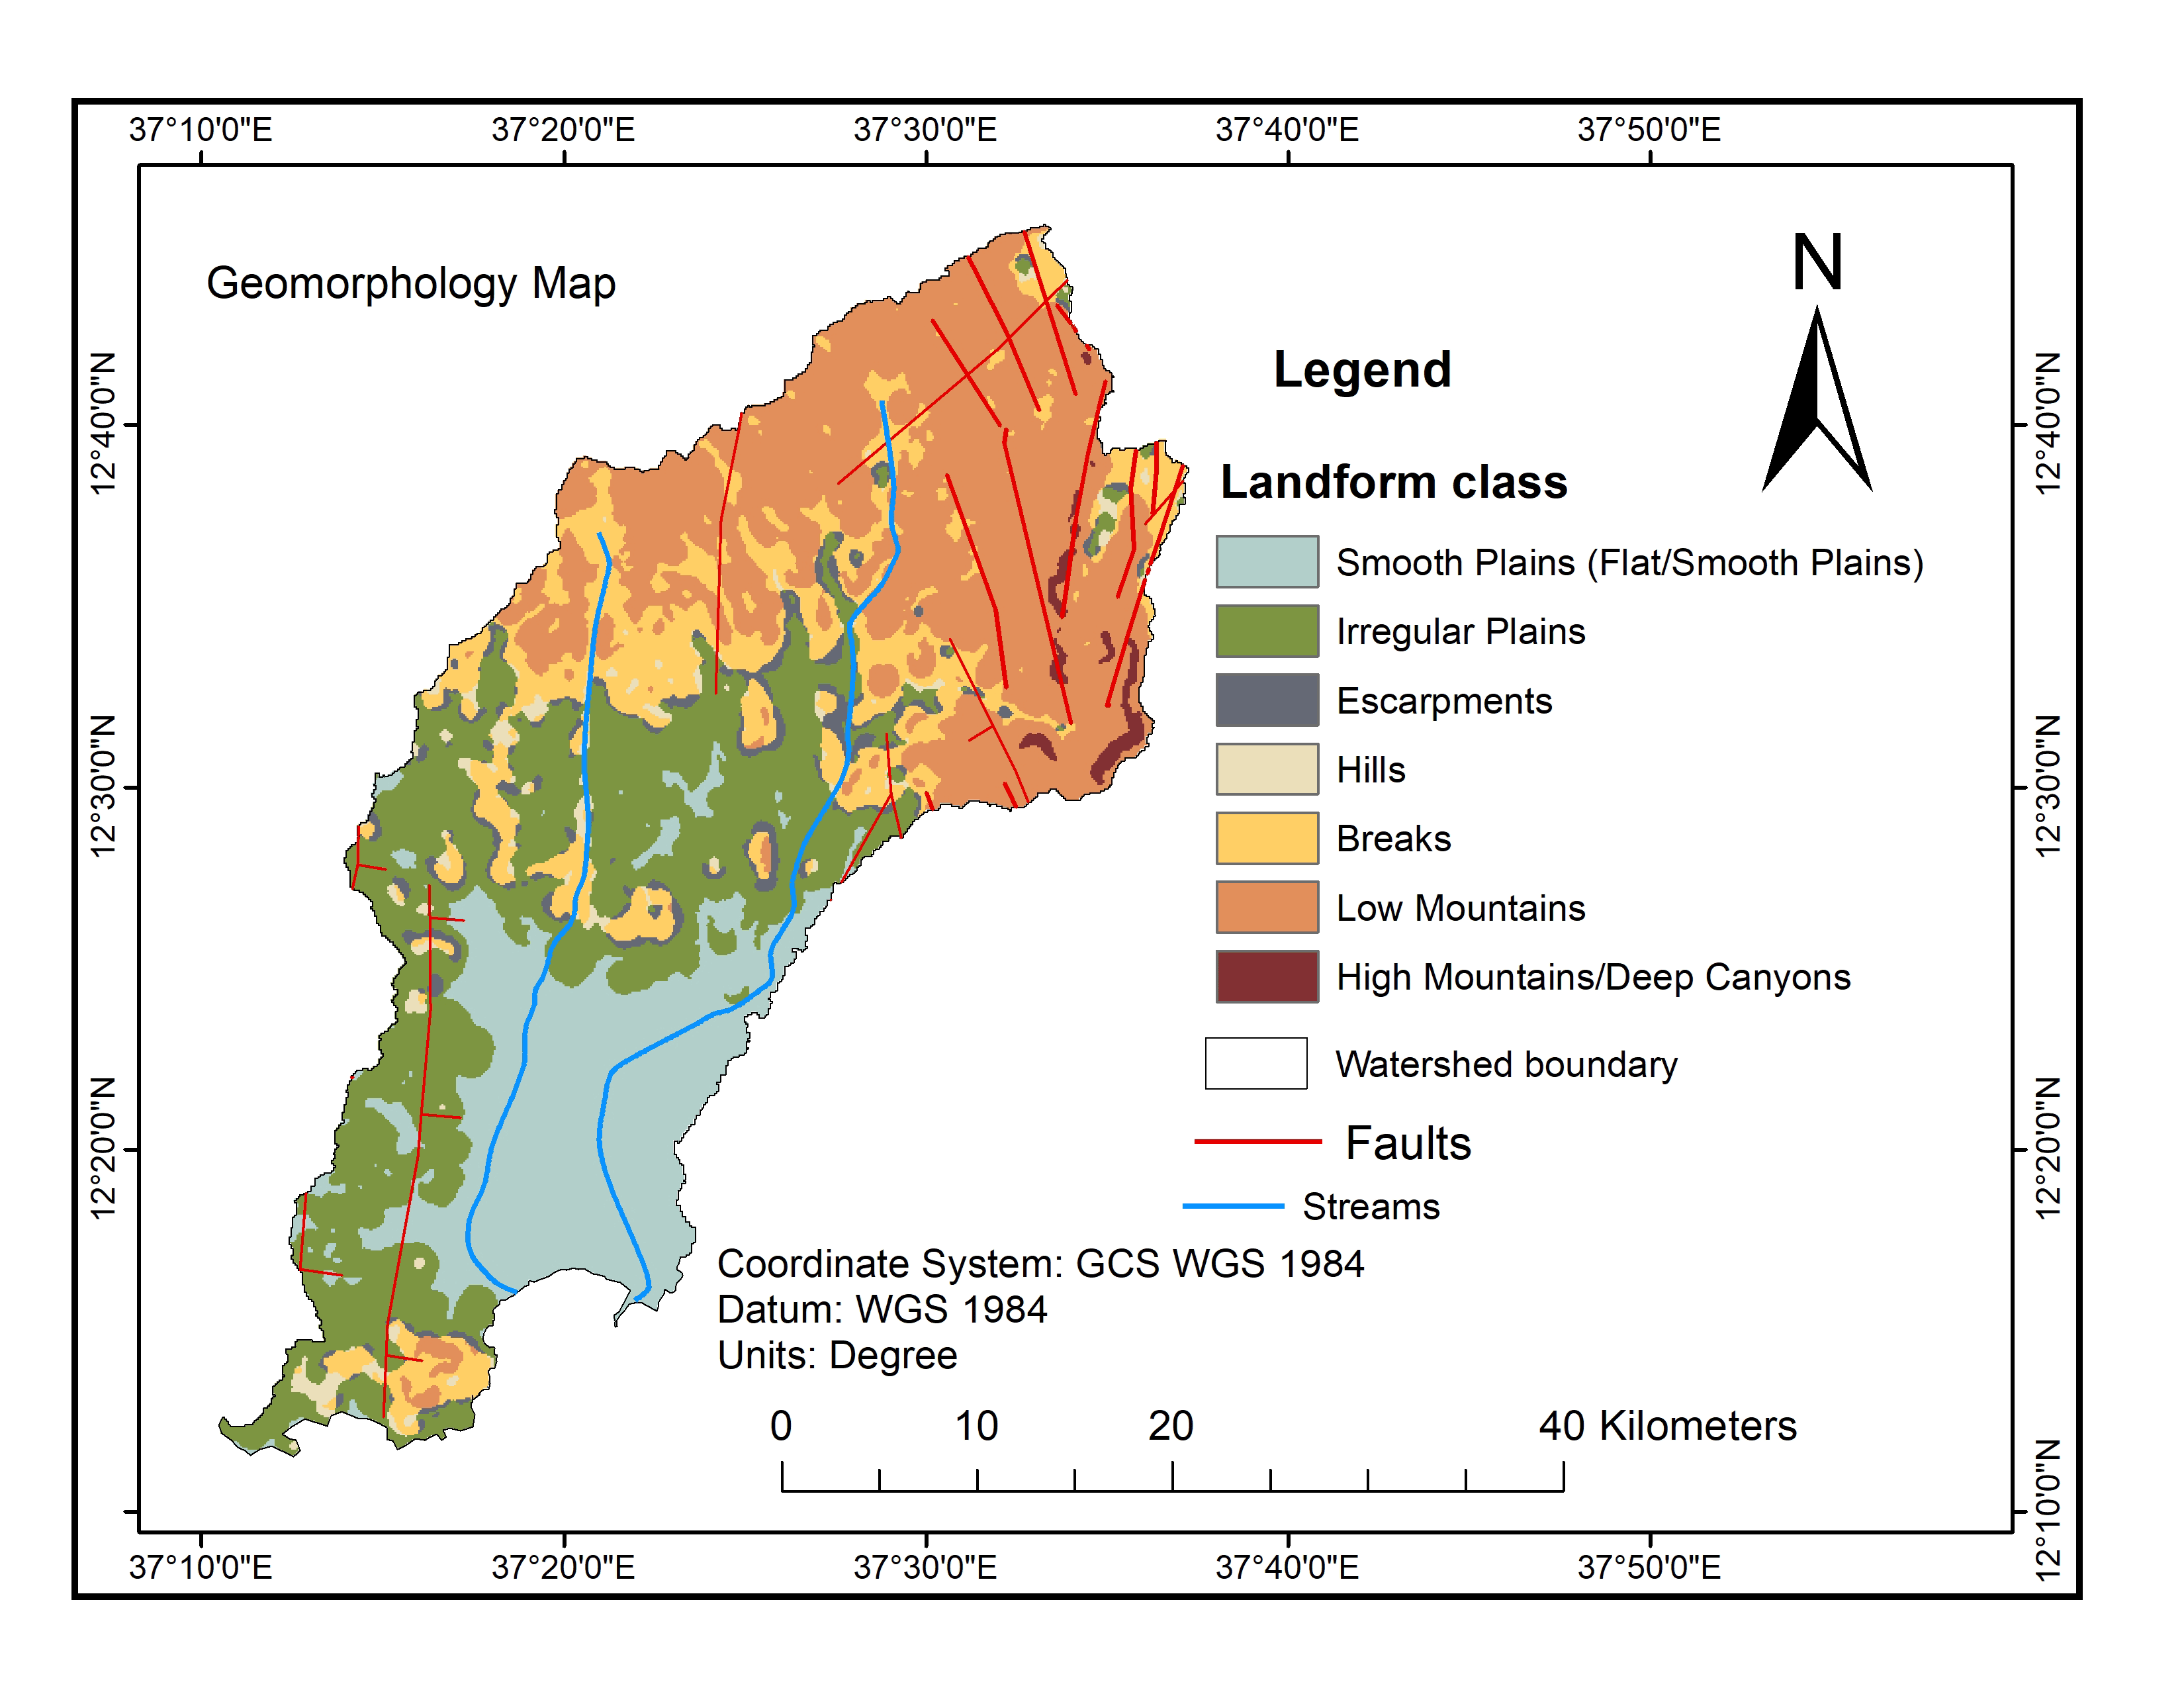
The Megech and Dirma rivers flow at a high rate throughout the rainy season and the sediments transported by the floods are primarily boulders, gravel, sand and silt (Abdi et al., 2016), which is characteristic of a mountainous stream. In the northeastern share of the watershed, the highest elevation is 2,985 meters above mean sea level. The mean annual precipitation is about 1,050 mm with 1,100 mm in the upper part and about 1,000 mm in the lower part. The annual precipitation averages around 1,050 mm, with 1,100 mm in the upper portion and 1,000 mm in the lower. The temperature ranges from 11.5 to 30 °C. Minimum temperatures range from 11.5°C in January to 15.6°C in April and May, with high temperatures ranging from 23°C in July to 30°C in March. Humidity levels range from 39% in March to 79 percent in August. The wind speed is poor, resulting in evapotranspiration values ranging from 101 mm/month in July to 149 mm/month in March (WWDSE, 2008). The main landform characteristics of the watershed are flat, undulating plains, rolling plains, hilly plains, mountainous, wedge-shaped, and steep-sloped, all of which are important to landform class (FAO, 2002).
2.2 Data Source and Analysis
The geospatial technology approach to guesstimat the morphometric parameters makes testing morphometric faces and detecting provincial scale dissimilarities calmer, more truthful and reckonable (Al-Saady et al., 2016). The USGS databases of the SRTM (Shuttle Radar Topography Mission) website (http://earthexplorer.usgs.gov/) were used to acquire DEM grid resolution raster data of (30x30m). From extracted DEM artificial sinks were uninvolved by satisfying maneuver and it was used to demarcate the watershed and engender morphometric parameters that were done by ArcGIS10.4. version. Using basic attributes computed from spatial data, excel format employed to estimate some morphometric parameters based on the three aspects such as linear, areal and relief appearances (Table 1).
Table 1. Morphometric aspects
3 . RESULTS AND DISCUSSIONS
3.1 Linear aspects
The linear features are just one-breadth components and deal with length parameters and it deals the river as counted as a linear function, tally the number and length of drainages. It has to do with a drainage system that stretches from source to mouth and includes a big river and its tributaries (Julius et al., 2017). It comprises stream order, stream length, bifurcation ratio, channel length, channel index, Rho coefficient and fitness ratio.
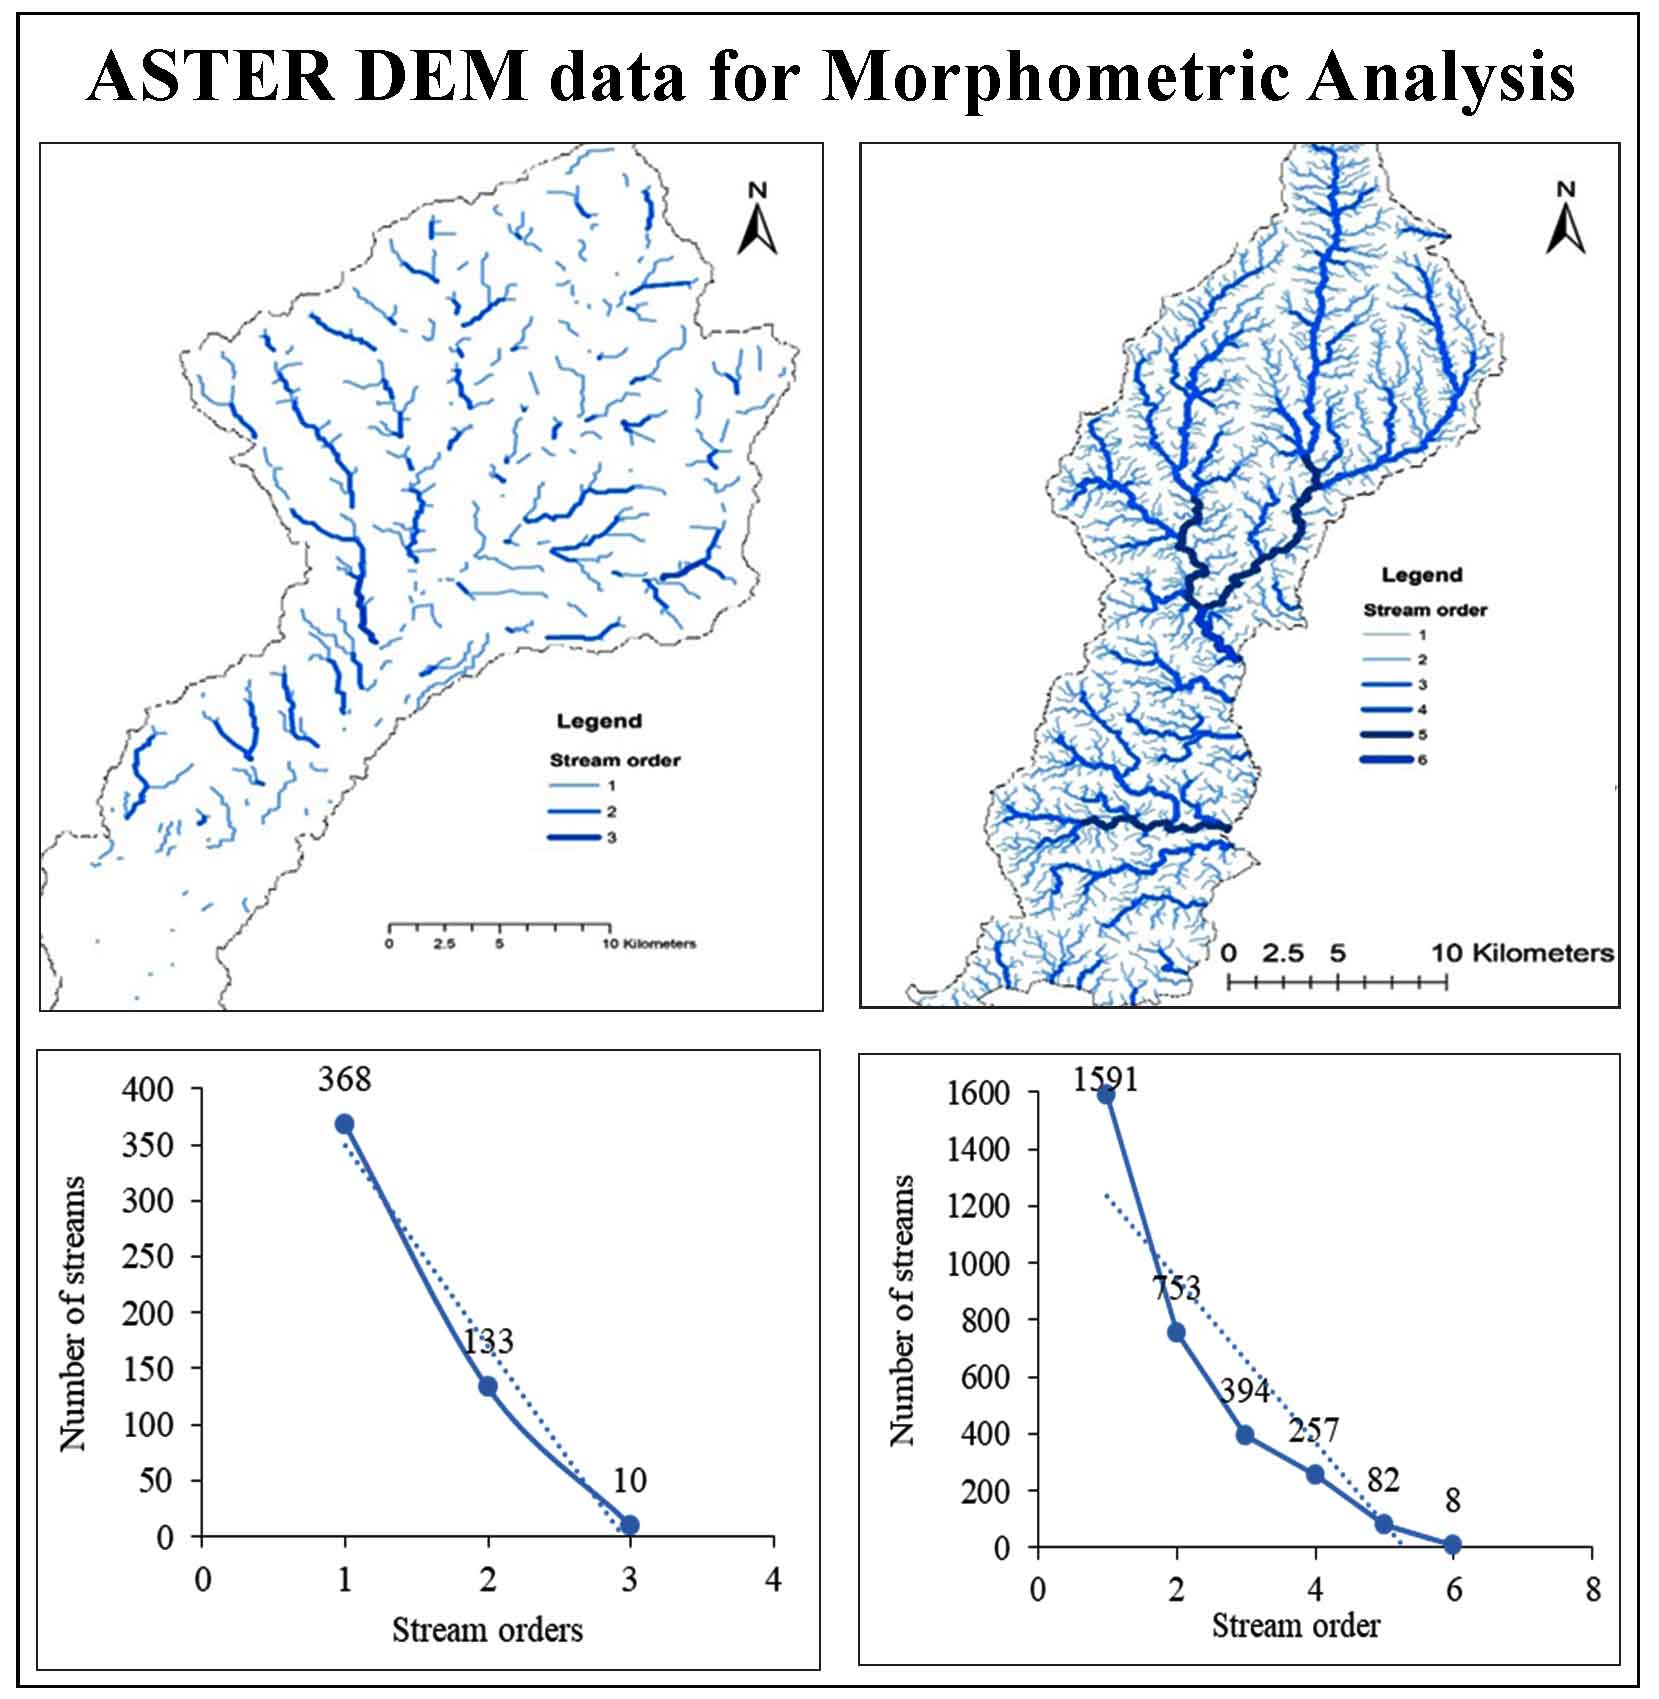
3.1.1 Stream order (Su) and stream number (Nu)
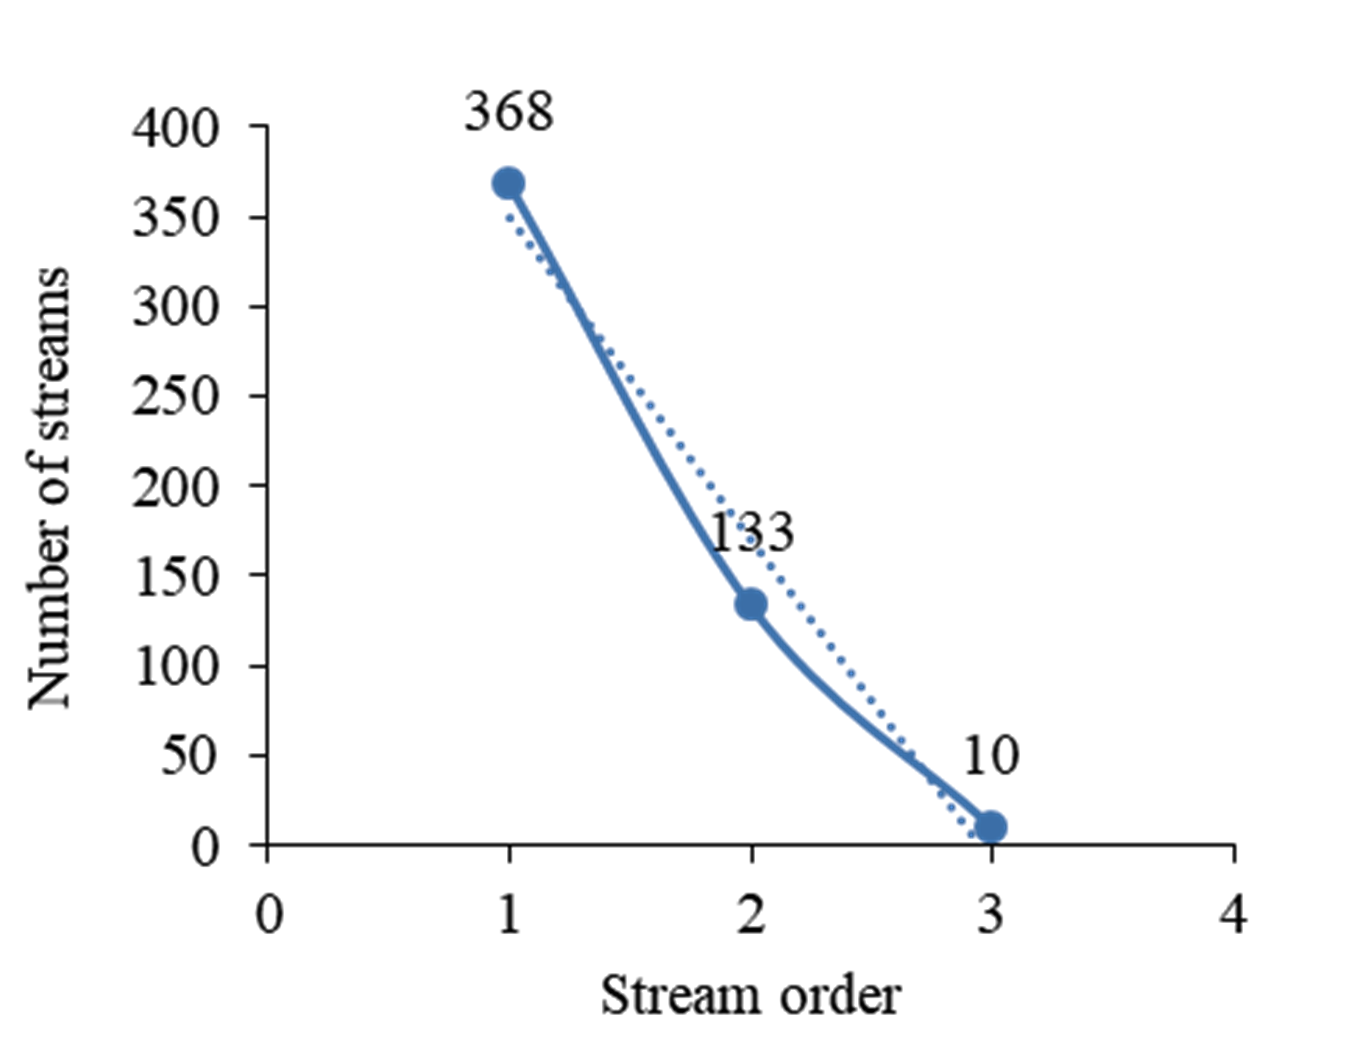
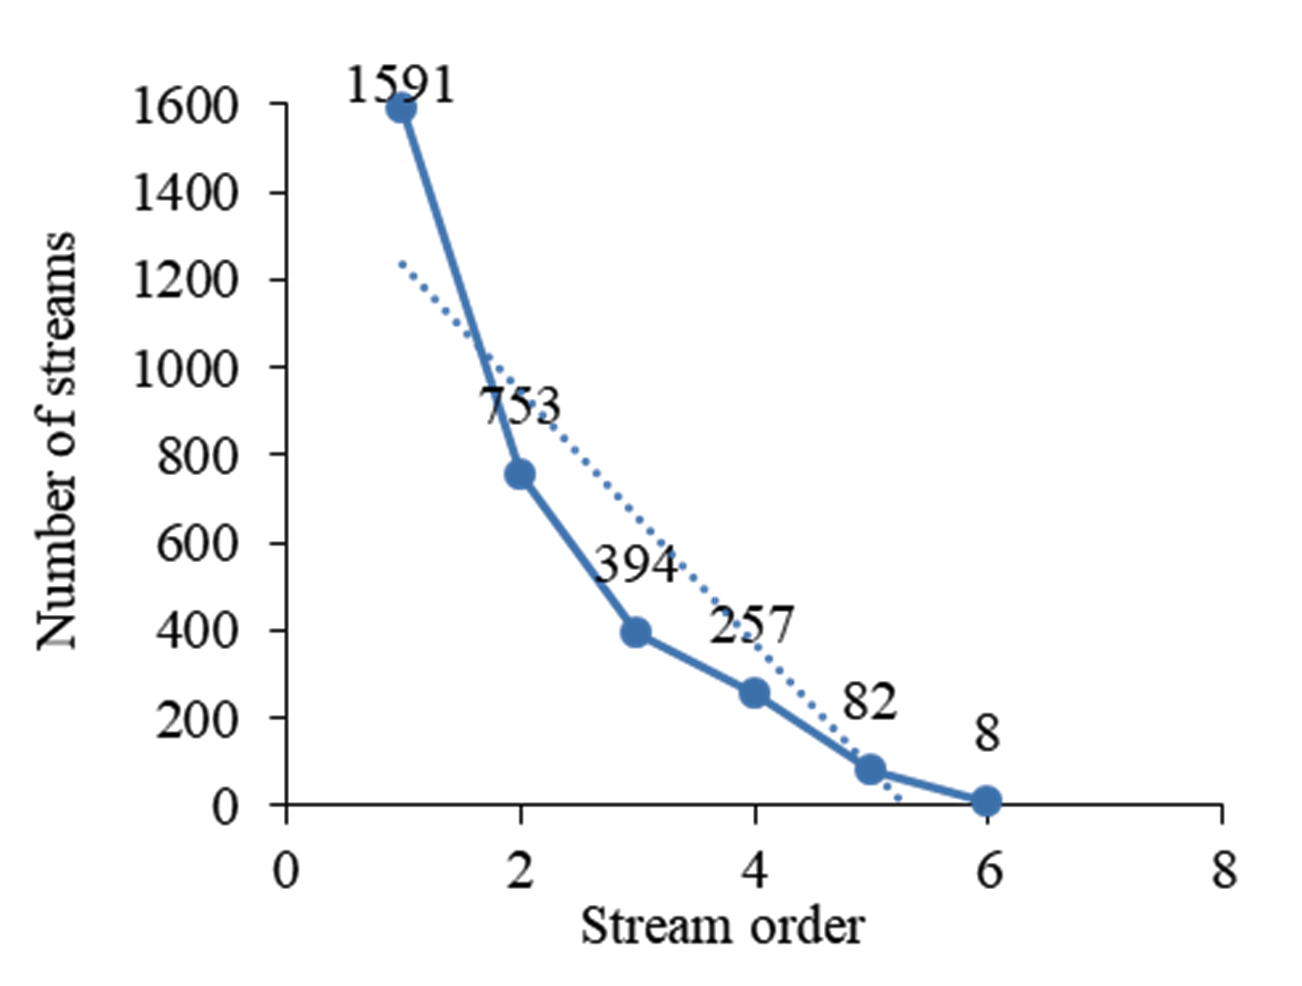
Stream order is a size-based ranking method for various streams (Horton, 1945). Because of its simplicity, Strahler’s method of ordering streams, which is slightly changed from Horton’s system, has been used (Lama and Maiti, 2019). According to his scheme, the smallest, unbranched fingertip streams are designated as 1st order, confluence of two 1st order channels results in 2nd order channel segments, two 2nd order streams combine to create a 3rd order segment. The higher-order is retained when two channels of different order join. Using Strahler’s (1952) method, the Megech river is the 3rd and Dirma river is 6th order stream. For the Megech river, altogether 511 streams were identified, out of which 368 are 1st order, 133 are 2nd order, ten are of 3rd order. Whereas for Dirma river entirely, 3085 were placed out of which 1591 are 1st order, 753 streams 2nd order, 394 streams 3rd order, 257 streams 4th order, 82 streams 5th order, and eight streams of 6th order. It implies that in both rivers high value of first-order streams is found, which indicate that there is a risk of an unexpected flash flood in the downstream areas after heavy rain (Chitra et al., 2011).
3.1.2 Stream length
The watershed’s stream length (Lu) was calculated using Horton’s law (1945). The length of a stream defines the features of a basin’s surface runoff (Najar and Pandey, 2018). The average length of stream parts in both sub-basins is greater in first-order streams and decreases as order increases, according to the findings in (Table 2). The overall stream length of the basin is proportional to the stream order, with the lower stream order having a longer length (262.78 km) for the Megech basin and (709.19 km) for the Dirma basin with a greater quantity of streams (368), and the higher-order having ten streams with (6.64 km) length for the Megech basin and eight streams with (4.24 km) length for the Dirma basin with a greater quantity of streams (368). This finding confirms that the region is supported by uniform lithology, with no likelihood of basin uplift, and it also demonstrates that water movement in the area is solely dependent on drainage characteristics (Altaf et al., 2013).
Table 2. Calculated linear features of Megech - Dirma watersheds
|
Watersheds
|
Stream orders
|
Number of streams
|
Stream length (km)
|
Mean stream length (km)
|
Stream length ratio
|
Bifurcation ration
|
Mean bifurcation ratio
|
Main channel length (km)
|
Length of overland flow (Lg)
|
Minimum aerial distance km
|
Channel index
|
Rho coefficient
|
Fitness ratio (Rf)
|
|
Megech
|
1
|
368
|
262.78
|
0.74
|
-
|
-
|
8.04
|
53.08
|
1.06
|
4.24
|
12.52
|
1.09
|
0.18
|
|
2
|
133
|
98.64
|
0.74
|
2.66
|
2.77
|
|
3
|
10
|
6.64
|
0.66
|
14.68
|
13.3
|
|
Dirma
|
1
|
1591
|
709.19
|
0.45
|
-
|
-
|
3.79
|
41.24
|
0.203
|
6.64
|
6.21
|
1.21
|
0.21
|
|
2
|
753
|
318.92
|
0.42
|
2.22
|
2.11
|
|
3
|
394
|
152.07
|
0.32
|
2.09
|
1.91
|
|
4
|
257
|
88.91
|
0.35
|
1.71
|
1.53
|
|
5
|
82
|
31.42
|
0.38
|
2.83
|
3.13
|
|
6
|
8
|
4.24
|
0.53
|
7.41
|
10.25
|
3.1.3 Bifurcation ratio (Rb)
The bifurcation ratio (Rb), which compares the counts of stream branches in one order versus the next, is known as the bifurcation ratio (Pidwirny, 2006). In the Megech sub-basin, the bifurcation ratio for Streams was 2.77 and 13.3 for streams with orders of 1 and 2, respectively, as shown in (Table 3).The Dirma sub-basin streams were found 2.11, 1.91, 1.53, 3.13, 10.25 for stream orders of 1, 2, and 3, 4 and 5, correspondingly.
Table 3. Calculated areal parameters of Megech and Dirma watersheds
|
Watersheds
|
Drainage
perimeter (km)
|
Drainage
area (km2)
|
Drainage density
|
Drainage texture
|
Stream frequency
|
Elongation ratio
|
Circularity ratio
|
Form factor (Ff)
|
Constant of channel maintenance
|
Drainage intensity
|
Infiltration number
|
HI
|
|
Megech
|
299.6
|
778.3
|
0.47
|
0.31
|
0.66
|
1.35
|
0.11
|
0.0057
|
2.13
|
1.40
|
0.31
|
0.60
|
|
Dirma
|
194.4
|
531.3
|
2.46
|
14.29
|
5.81
|
0.26
|
0.18
|
0.00031
|
0.41
|
2.36
|
14.29
|
0.64
|
Megech sub-mean basin’s Bifurcation Ratio is 8.04, which is higher than Dirma sub-3.79 basin’s (Table 2). According to Kale and Gupta (2001), a bifurcation ratio of 3 to 5 suggests a natural drainage mechanism within a homogeneous rock. Lesser bifurcation share results designate sturdy structural control over catchment patterns and well-dichotomized drainage basins, while advanced bifurcation ratio values indicate strong structural control over drainage patterns and well-dismembered drainage basins (Horton, 1945). Flooding is less likely when the bifurcation ratio is higher (Gabale and Pawar, 2015). Low Rmb also means that groundwater storage potentials are greater (Everest and zcan, 2018). In general, the bifurcation ratio of the Megech and Dirma sub-basins is 2.77 and 2.11, respectively, which is less than 3.0, the geological composition of the catchment is flat and homogeneous, and the catchment is higher than 5.0, which varies from 13.3 for Megech to 10.25 for Dirma. The lithology and geological composition of the sub-watershed formed a portion of the stream network, subsequently consistent with the results of the report by (Asfaw and Workineh, 2019).
3.1.4 Length of the main channel, channel index, rho coefficient, and fitness ratio
This is the range from the point of outflow of the selected sun-watershed to the full degree practicable of the watershed boundary along the longest watercourse. It was computed by using ArcGIS-10.4 software, which is 53.08 and 41.24 km for Megech and Dirma sub-basins, respectively shown in (Table 2). Rho coefficient relates to the drainage density and physiographic development of the basin, allowing the evaluation of the storage capacity of the drainage network (Horton, 1945). It is found that 1.09 and 1.21 for Megech and Dirma sub-basins, respectively.
Changes in this parameter are defined by climatic, geologic, biologic, geomorphologic, and anthropogenic influences, according to the literature. Both sub-basins Rho coefficients are exceptionally high. Rho values imply greater hydrological accumulation during flooding and weakening of erosion effects during elevated discharge (Pareta and Pareta, 2012). A watershed fitness ratio compares the length of the main channel to the perimeter length of the watershed, which is a metric for topographic fitness (Melton, 1958). The fitness ratio for Megech and Dirma sub-watersheds is 0.18 and 0.21, respectively.
3.1.5 Length of overland flow (Lg)
The length of overland flow is the distance that water travels over the ground surface before condensing into a particular stream channel (Horton, 1945). This element is contrary wise proportionate to the channel’s average slope and is quite synonymous with sheet flow length to a large degree (Waikar and Nilawar, 2014). The length of overland flow values is 1.06 for Megech and 0.20 for Dirma sub-basins. The length of overland flow higher (1.06) for Megech indicates low relief, whereas the values of length of overland flow, which are low (0.20) for Dirma indicates high relief (Paul, 2012).
3.2 Areal aspects
Areal morphometry (areal aspects) is relative to important features of the drainage catchment area such as geological structure, climatic conditions, and catchment denudation history (Radwan et al., 2017). This analysis helps evaluate the relationship between the discharge of the stream and the basin location (Veeranna et al., 2017). Area, perimeter, drainage density, stream frequency, texture ration, shape factors, circulatory ratio, duration of overland flow, and constant channel maintenance are all included in this parameter.
3.2.1 Area and perimeter
By converting the basin map to a polygon shape, the area and perimeter of the sub-basins were determined. Megech sub-basins have an overall area of 778.29 km2 and a perimeter of 299.61 km, while Dirma sub-basins have a total area of 531.27 km2 and a perimeter of 194.43 km (Table 3).
3.2.2 Drainage density and texture
Drainage density is a tool to characterize the degree of drainage development within the basin and expresses the closeness of channel spacing, offering a quantitative indicator of the basin’s middling level of stream channel (Horton, 1932 and Strahler, 1964). The drainage density and texture for Megech are 0.47 and 0.31 (Table 3), respectively and whereas 2.46 and 14.29 for Dirma sub-catchment. A coarse drainage texture is created by a low drainage density, while a fine drainage texture is produced by a high drainage density (Strahler, 1964). In this case, the drainage density of Megech (0.47) and Dirma (2.46) drainage density is very coarse and coarse, respectively (Table 3), according to Smith (1950) classes of drainage density. Low Dd values indicate that groundwater storage potentials are higher (Everest and Özcan, 2018).
3.2.3 Stream frequency
According to Horton, 1932 and 1945), stream frequency describes the total of segmented streams per unit area. Hence the stream frequency of Megech and Dirma are 0.66 and 5.81 (Table 3), which means low frequency for Megech and moderate for Dirma catchment according to the classes of (Somashekar et al., 2011).
3.2.4 Elongation and circularity ratios
The elongation ratio is a circle’s diameter with the same area as the basin separated by the supreme basin length (Aparna et al., 2015). The elongation ratio worth for Megech and Dirma sub-basins are 1.35 and 0.26. The roundaboutness proportion is the ratio of a watershed’s area to the area of a sphere with the same boundary as the watershed, as determined by general physical characteristics of rocks of the watershed (Iqbal et al., 2013). The circularity ratio varies from 0 to 1.0 were higher than the ratio, reveals a more circular profile of the basin (Miller, 1953). The circularity ratio for Megech and Dirma is 0.11 and 0.18, respectively, which indicates that the sub-basins fall under the elongated category respectively. As the basin’s form reaches a circle, the elongation ratio approaches 1, and it ranges from 0.6 to 1.0 over a broad range of climatic and geologic regimes (Patil et al., 2015).
3.2.5 Form factor (Rf)
The form factor is defined as a dimensionless proportion of basin area to basin length squared. Basins with higher form factor values have higher peak flows for a shorter period, while elongated basins with low form factor values have lower peak flows for a longer duration (Anees et al., 2015). The Megech and Dirma sub-basins have type factors of 0.57 and 0.31, respectively, suggesting a lower peak flow for a longer period.
3.2.6 Constant of channel maintenance
Constants of channel maintenance for Megech and Dirma sub-watersheds are 2.13 and 0.41. The low constant channel maintenance values indicate structural complexity and higher dissection of the terrain (Thomas et al., 2011), which are associated with the weakest or very low-resistance soils, sparse vegetation, and mountainous terrain (Mokarram, 2015).
3.2.7 Drainage intensity
Drainage intensity is explained as the ratio of stream frequency and drainage density (Faniran, 1968). The outcome of drainage strength for Megech and Dirma sub-basins 1.40 and 2.36, respectively suggests that drainage density and stream frequency have very little influence on the degree to which denudation agents have reduced the surface and since surface runoff is difficult to remove from the basin, making it vulnerable to flooding and gully erosion (Bassey Eze and Effiong, 2010).
3.2.8 Infiltration number
A watershed’s infiltration number is demarcated as the product of drainage density and stream frequency (Pareta and Pareta, 2012). The infiltration numbers for Megech and Dirma sub-basins are 0.31 and 14.29, high infiltration number (14.29) for the Dirma river shows the high runoff potential in this sub-basin (Table 3).
3.3 Relief aspects
The overall vertical distance between the lowest and highest points of a basin is the relief (Sreedevi et al., 2009). The landscape aspects of the watershed are connected to three-dimensional features such as location, volume, and height of land features (Sahu et al., 2017).
The height difference between the maximum and minimum points in a basin is known as basin relief is the lowest point of the basin (Ikbal et al., 2017). Basin relief is an important element in understanding the drainage’s denudational characteristics (Sreedevi et al., 2009). It governs the gradient of the water, thus impacting the amount of sediment movement and flood patterns (Hadely and Schumm, 1961). It helps to understand the characteristics of denudation in the basin.
Basin relief is determined by the underlying geology, geomorphology, and drainage features of the area. It is the most reliable predictor of a river basin’s erosional phases (Mahala, 2020). The relief of Megech and Dirma sub-watersheds is 1198 and 1013 m, respectively, which have high relief due to the mountainous physiographic structure of the upstream and plain part of the downstream part of the watershed region. This high basin relief value shows the gravity of the study area’s water flow, low infiltration, and high runoff conditions.
3.3.1 Relief ratio
The relief ratio or angle of the watershed is explained as the proportion of basin relief to the longest basin dimension parallel to the main drainage line, which is the distance of the catchment (Schumm, 1956). It shows the strength by measuring the drainage basin’s total steepness, erosion processes that operating on the slope can be established. According to Schumm (1956), the sediments lose per unit area are closely correlated with relief ratios. Megech and Dirma sub-watersheds relief ratios in this study area are 3.25 and 0.77, respectively. The high value of the relief ratio means that a steep slope with high relief is present. It’s a feature of hilly terrain connected to a lot of runoff and a lot of erosion (Bismark, 2018).
3.3.2 Ruggedness number
Ruggedness number is used to measure surface unevenness and flash flood potential (Selvan et al.’ 2011). Ruggedness numbers for Megech and Dirma sub-basins were 0.56 and 0.07, respectively, indicating moderate and long rugged topography for the Megech river which could be susceptible to soil erosion and flash floods (Pareta and Pareta, 2011).
3.3.3 Dissection index
According to Singh and Dubey (1994), the dissection index is a parameter that expresses the stages of terrain or landscape growth in any given physiographic area or river basin by implying the degree of dissection or vertical erosion. The dissection index is the ratio of basin relief and absolute relief. The dissection index ranges from 0 to 1, with 0 indicating total absence of vertical dissection / erosion and therefore dominance of flat surface, and 1 indicating high dissection and, in extreme cases, vertical cliffs (Zende et al., 2013). The dissection index values for Megech 0.40 and 0.36 for Dirma show river sub-basins are moderately dissected (Table 4).
Table 4. Calculated relief parameters of Megech and Dirma sub-watersheds
|
Watersheds
|
Height of basin mouth (meter)
|
Maximum height of the basin (meter)
|
Total basin relief (meter)
|
Basin relief (m)
|
Relief ratio
|
Absolute relief
(meter)
|
Ruggedness number (Rn)
|
Dissection index (Dis)
|
Hypsometric integration (Hi)
|
|
Megech
|
1771
|
2969
|
1198
|
1198
|
3.25
|
2969
|
0.56
|
0.40
|
0.60
|
|
Dirma
|
1767
|
2780
|
1013
|
1013
|
0.77
|
2780
|
0.07
|
0.36
|
0.64
|
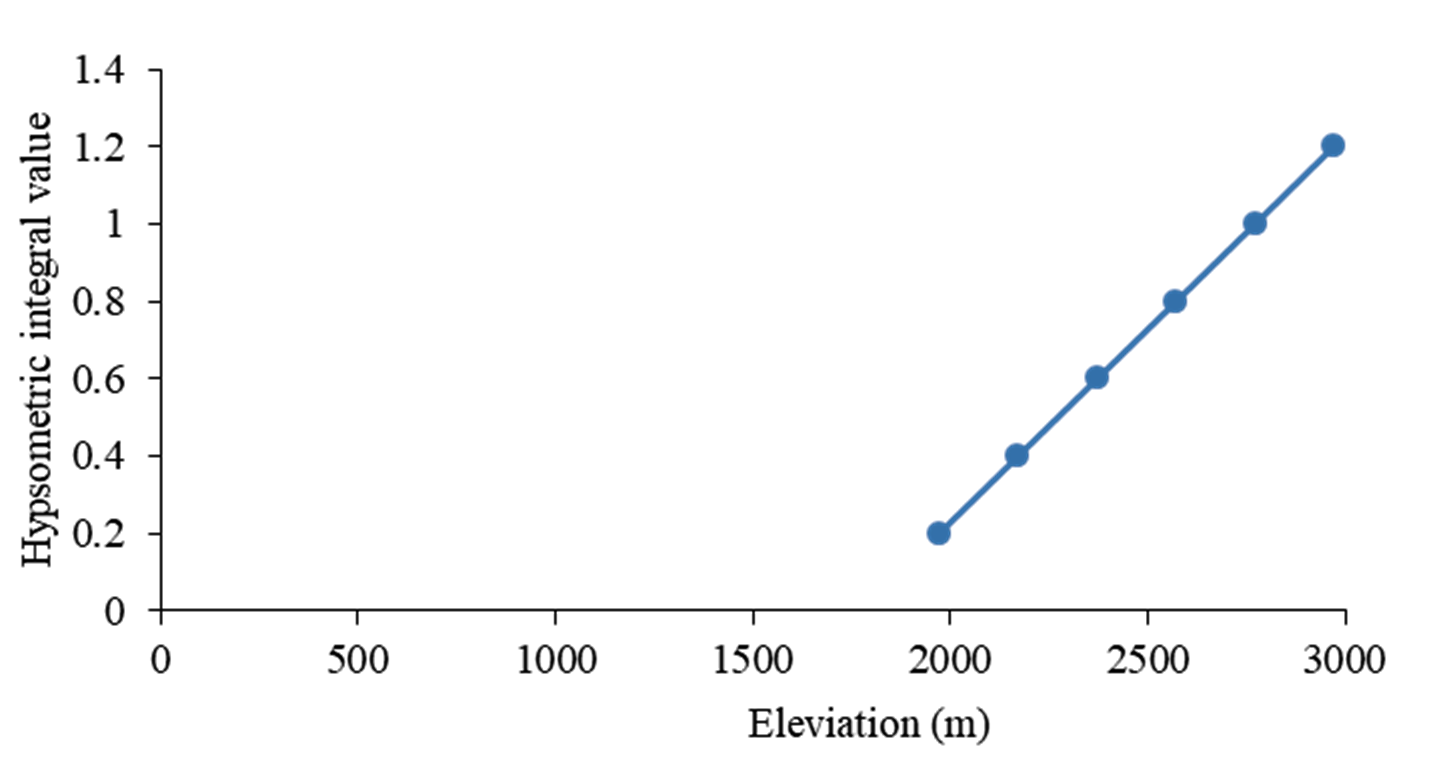
3.3.5 Hypsometric curve and integral
The study of the area-altitude relationship in general and hypsometric analysis, in particular, is more suitable for the identification of geomorphic stages and erosion surfaces of watersheds (Fenta et al., 2017). The hypsometric analysis is used to create a correlation between a watershed’s horizontal cross-sectional drainage area and its elevation or topographic structure (Fenta et al., 2017).
More specifically, the hypsometric curve’s graphical form is an indicator of the age of the watershed in landscape evolution. Therefore, at its youth stage, a basin with an upward convex hypsometric curve, an S-shaped curve shows the mature point, and upward concave curves display the peneplain or old age landscape creation process basin (Strahler, 1952). According to Strahler’s (1952) suggested threshold limits, HI 0.60 indicates a youthful stage, while 0.30 and 0.60 indicate a mature stage; and according to Fenta et al. (2017), HI ≤ 0.30 is indicative of undisturbed /old stage. Hence, hypsometric integral (HI) is a measure of the degree of fluvial landscape erosion (Markose and Jayappa, 2011; Strahler, 1952). HI of the sub-watersheds is 0.60 and 0.64 for Megech and Dirma, respectively, and this result means that half of the sub-original watershed’s volume is still present in the basins to erode (Sujatha et al., 2015).
3.4 Implications for Soil and Water Conservation
The rates of soil erosion and land degradation in Ethiopia are high, and runoff rates under natural rainfall conditions and traditional land management practices in the Ethiopian highlands are clearly influenced by population density, land-use change (Hurni et al., 2005). The primary criterion for the morphometric classification of drainage basins, which undoubtedly governs the runoff pattern, sediment yield, and other hydrological parameters of the drainage basin, is stream frequency and drainage density (Pande and Moharir, 2017). The drainage density for the Dirma sub-basin 2.46 is higher, which indicates that the sub-basin is impermeable subsoil and sparse vegetation cover and a high infiltration number (14.29) for the Dirma river shows the high runoff potential in this sub-basin. The dissection index values for Megech 0.40 and 0.36 for Dirma show river sub-basins are moderately dissected. Ruggedness numbers for Megech and Dirma sub-basins were 0.56 and 0.07, respectively, indicating moderate and long rugged topography for the Megech river, which could be susceptible to soil erosion and flash flood characteristics (Pareta and Pareta, 2011).


 ,
Jayappa K. S 1
,
Jayappa K. S 1