Darjeeling has the highest percentage of divorced and separated population in 2011.
The marriage probability among females aged 10-14 years is 5 times higher than the males that indicate the higher prevalence of child marriage among girls.
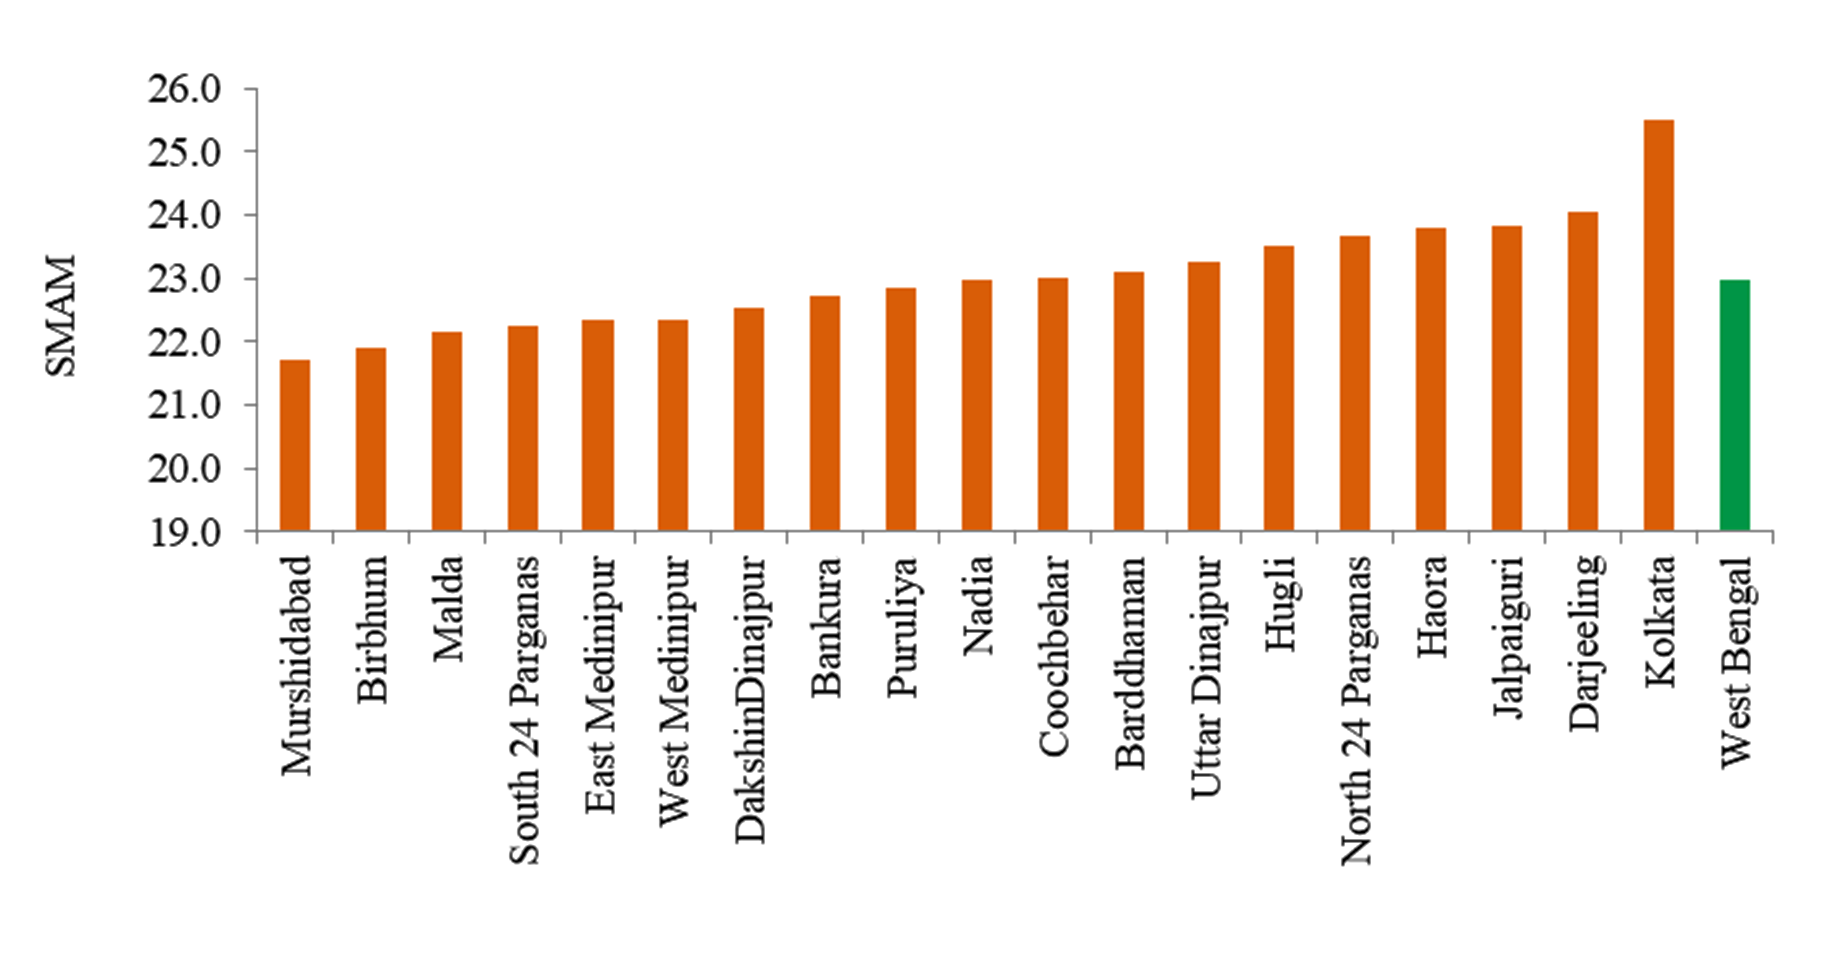
13 districts have below 20 years SMAM in West Bengal.
A range of policy and programmatic actions are needed by providing incentives among stakeholders to reduce the harmful practice of early marriage.
Abstract
The present study deals with nuptiality pattern, probability of marriage and age at first marriage in different districts of West Bengal (India). The crude marriage rate was higher in Hugli district, while East Mednipur occupied top position in different district of West Bengal with regarding to general marriage rate. Hajnal’s Singulated Mean Age at Marriage (SMAM) was used to find out the mean age at marriage and marriage probability was estimated by construction of nuptiality table based on the census data (2011). The study revealed that the SMAM is 23 years in the state, while Murshidabad constitutes lower SMAM (21.7 years). The study also found that the marriage probability was 5 times higher among females (10-14 years) as compared to males. Awareness should be increased to reduce the harmful effects of marriage at a lower age. Policy makers and government should pay special attention to rural and marginalized communities by providing them economic benefits.
Keywords
Women , Women Studies , West Bengal , Singulated mean age at marriage , Marriage rate , Marriage probability , Child Marriage
1 . INTRODUCTION
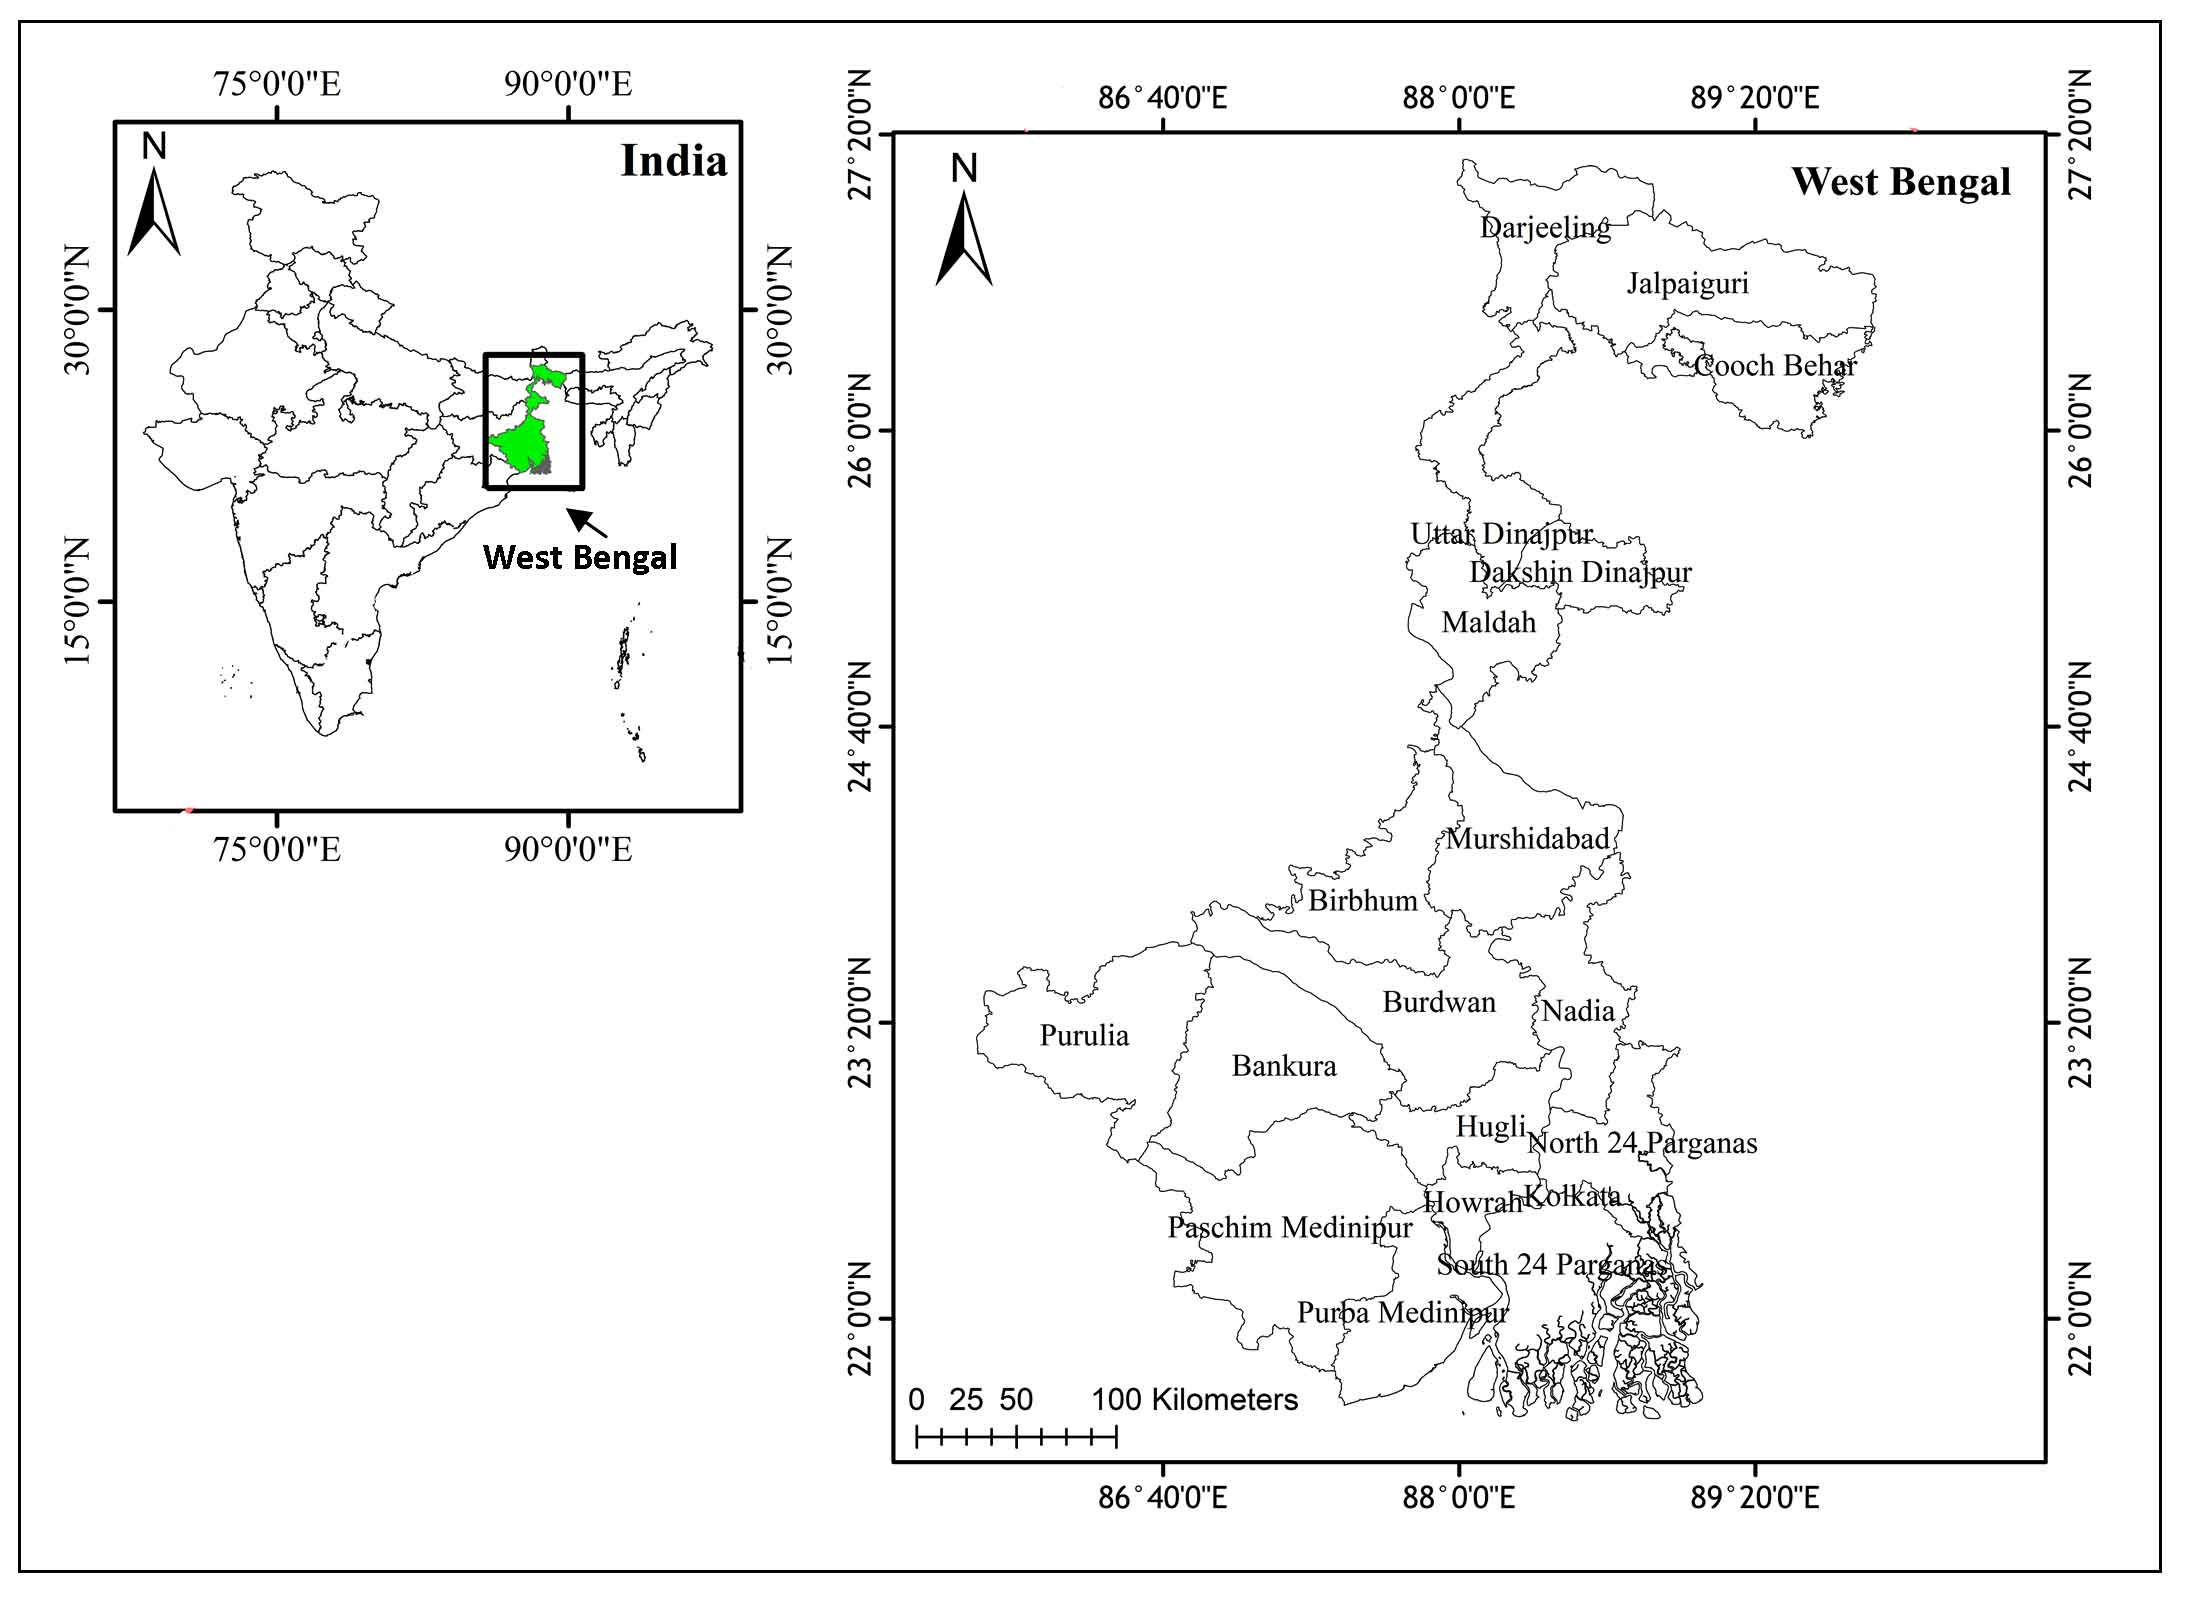
Marriage is a significant social event wherein a person starts his or her matrimonial life (Chouhan and Roy, 2018; Pandey, 1984; Singh, 1986). Marital behaviour is an important aspect of family life (Allendorf and Ghimire, 2013). In the 21st century, more than 60 million women are entering marriage as a child (UNICEF, 2005). In India, marriages are take place in an advance age (Pandey and Pandey, 1997). Though boys are also subjected to marriage at a lower age, girls are severely affected and form the majority of the victims of an early age marriage (Goli, 2016; Nisar and Dibley, 2014). This is originally due to the combination of beliefs and practices, like parents should marry off their daughters once they reach menarche, and also that they have to settle for more dowry if a girl is married late and so on (Pandey and Nath, 2016; Agarwal et al., 2006). Thereby, the prevalence of marriage at an early age prevalent all over India is very complicated in nature (Pandey, 1984; Chouhan and Roy, 2018). Early married women were faced a lot of complications associated with motherhood as well as reproductive health problems (Nour, 2006; Lassi et al., 2016) and suffers numerous socio-economic problems (Raj and Boehmer, 2013). Although, there are enactments to prevent the practice of early age marriages in India, a lot of marriages take place below the marriageable age (Chouhan and Roy, 2018; Pathak, 1980). The marriageable age mostly depends on their social class, level of education, employment, religion, ethnic group, family background, etc. (Chouhan and Roy, 2018; Pandey and Nath, 2016). The age at marriage of women mostly depends on education, as it is more prominent when they are illiterate or have lower levels of educational attainment that truly affects marital age (Thapa, 1996; Paul, 2019; Biswas et al., 2019). The literacy predominantly among the Scheduled Castes, Scheduled Tribes and Muslims is a major reason encouraging marriage at a lower age (Ghosh and Kar, 2010). Poverty, unemployment and expensive educational costs lead to a higher prevalence of marriage at a lower age (Mathur et al., 2003; Kamal et al., 2015; Islam et al., 2016; Wahhaj, 2018; Paul, 2019). States like Assam, West Bengal, Tamil Nadu, Kerala and Karnataka have a significantly higher mean age at marriage than the national average, whereas, states like Jammu and Kashmir, Punjab, Orissa, Gujarat, Maharashtra, have a mean age at marriage close to the national average (Chouhan and Roy, 2018). States like Madhya Pradesh, Bihar, Rajasthan and Uttar Pradesh have a substantially lower age at marriage (Pandey, 1984). In the last few decades India has also witnessed a number of demographic changes (Pandey, 2008) as a result of socio-economic improvement, and progress in education, changes in thoughts towards marriage, love-marriages, inter-caste marriages, divorce, separation (Kadi, 1987; Singh, 1992) and marriage dissolution (Kuppuswamy, 1957) have been observed. Rising literacy has opened the opportunity to be a part of new challenges for women in the recent era. According to the 4th round National Family Health Survey (2015-2016), the prevalence of child marriage was highest in West Bengal (41.6%) as compared to the other states of India. A number of factors have been found to be associated with the timing of age at marriage among both males and females, such as education, occupation, religion, caste. Therefore, there is need to investigate the differential marriage patterns among male-female and vice-versa in different districts of West Bengal. With this backdrop, the present study investigated the nuptiality status such as the marriage probability and singulated mean age at marriage of West Bengal (Figure 1).
Figure 1. Study area: West Bengal (India)
2 . DATA AND METHODS
In demographic studies, marital status is commonly categorized into five groups i.e. never-married, currently married, widowed, separated and divorced. The present study is based on data obtain from Census of India, 2011. We have accumulated data on marital status by age and sex from census data of India. The crude marriage rate is the total number of married persons among the population in an area during the year. Although the crude marriage rate is useful as a measure of the relative frequency of marriages in the same area over a relatively short period of time, it does not take account of the variation between areas in marriageable population which may be derived from the marital status and age distribution of the population. Therefore, general marriage rate has been used. It takes some account of the marital status and age parcelling of a population allow particular comparisons to be made between. The general marriage rate is the number of marriages per 1000 married persons aged 15 years and over (Faust, 2004).
Crude Marriage Rate = \({M \over P} \times 1000\)
M is total number of marriages among residents in an area during the year and P is average number of person living in the area during the year.
General Marriage Rate = \({M \over P^{15+}} \times 1000\)
Where, M is total number of marriage among residents in an area during the year. P15+ is total number of marriage in the year is again employed in the numerator whereas the population 15 years of age and older is now employed in the denominator.
Furthermore, the probability of marriage has been estimated by constructing of nuptiality table which delineate a fictive cohort that would have sustain at each age the nuptiality pattern observed for persons of this age at the time of the census. It is constructed either from the probabilities of nuptiality obtained after conversion of nuptiality rates.
The estimation of the nuptiality table is as follows:
\(5^{nx}= (s_x-s_x+5)/S_x\)
Here,\(5^{nx}\) is five year nuptiality rate, i.e., the probability that a single person at age x will marry during the next five years, \(S_x\)is number single at age x, and \(s_x\)is proportion of single at age x.
In this study, Hajnal’s method (Hajnal, 1965) has been used to find out the Singulated Mean Age at Marriage (SMAM). Due to prevalence of early age at marriage of 10 years for both male and female, it has been taken as the lower age for marriage (Chouhan and Roy, 2018) whereas in Hajnal’s (Hajnal, 1965), 15 years have been considered for SMAM.
\(SMAM=[∑^{50}_{i=5} nSx-Sk(k)]/1-SK\)
Where, \(nSx\) is proportion of singles in the age group x to x+n, K is the upper limit of the age under which marriage occurs (50 years) and \(Sk\) is proportion of singles at age k.
3 . RESULTS
3.1 Marital Status
More than half of the population (51%) was married in West Bengal (Table 1). The higher proportion of girls under married groups indicates that the prevailing social custom ritual which asserts marriage as a compulsory customs for a girl. About 44 % of unmarried females denote growing self-sufficiency among the women individual as a result of educational and occupational improvement. Besides, 5% and 0.5% population was widowed and divorced or separated, respectively in their matrimonial life. According to census 2011, highest married population was found in East Mednipur (53%) and followed by Kolkata district. Uttar Dinajpur occupied the lowest percentage of married population. Regarding the married population, out of 19 districts 7 districts have below 50% married couples. Additionally, the highest percentage of widowed was found in Bankura district and followed by Kolkata. While the corresponding figure of widowed was low in Uttar Dinajpur, Malda and Murshidabad district.
Moreover, in West Bengal 0.5% people was divorced or separated in their matrimonial life which is not a positive social and demographic indicator. This may be due to increasing intolerance and the spirit of self-sufficiency among the individuals failing to build up a healthy relationship. Among the all district of West Bengal, Darjeeling has highest percentage of divorced or separated population.
3.2 Crude Marriage Rate (CMR)
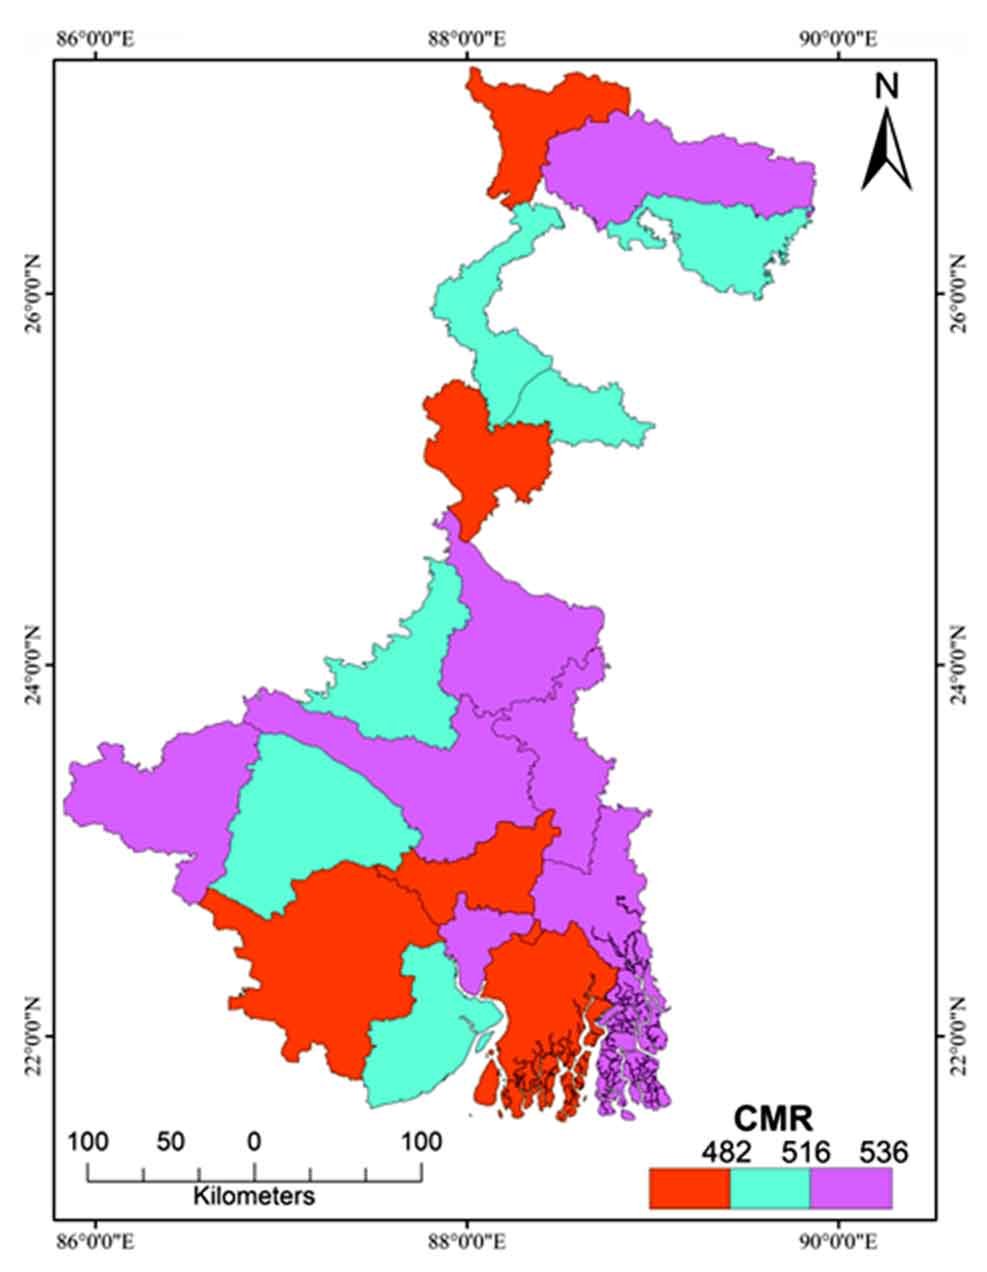
Crude marriage rate is effectively used for gross analysis. In West Bengal, out of 19 districts Hugli has experience higher rate of CMR which extremely followed by Nadia, North 24 Parganas district (Figure 2). The CMR was higher among 11 districts as compared to the state average (508). Whereas the lowest CMR was found in Malda district accounting 462.
Figure 2. Crude marriage rate
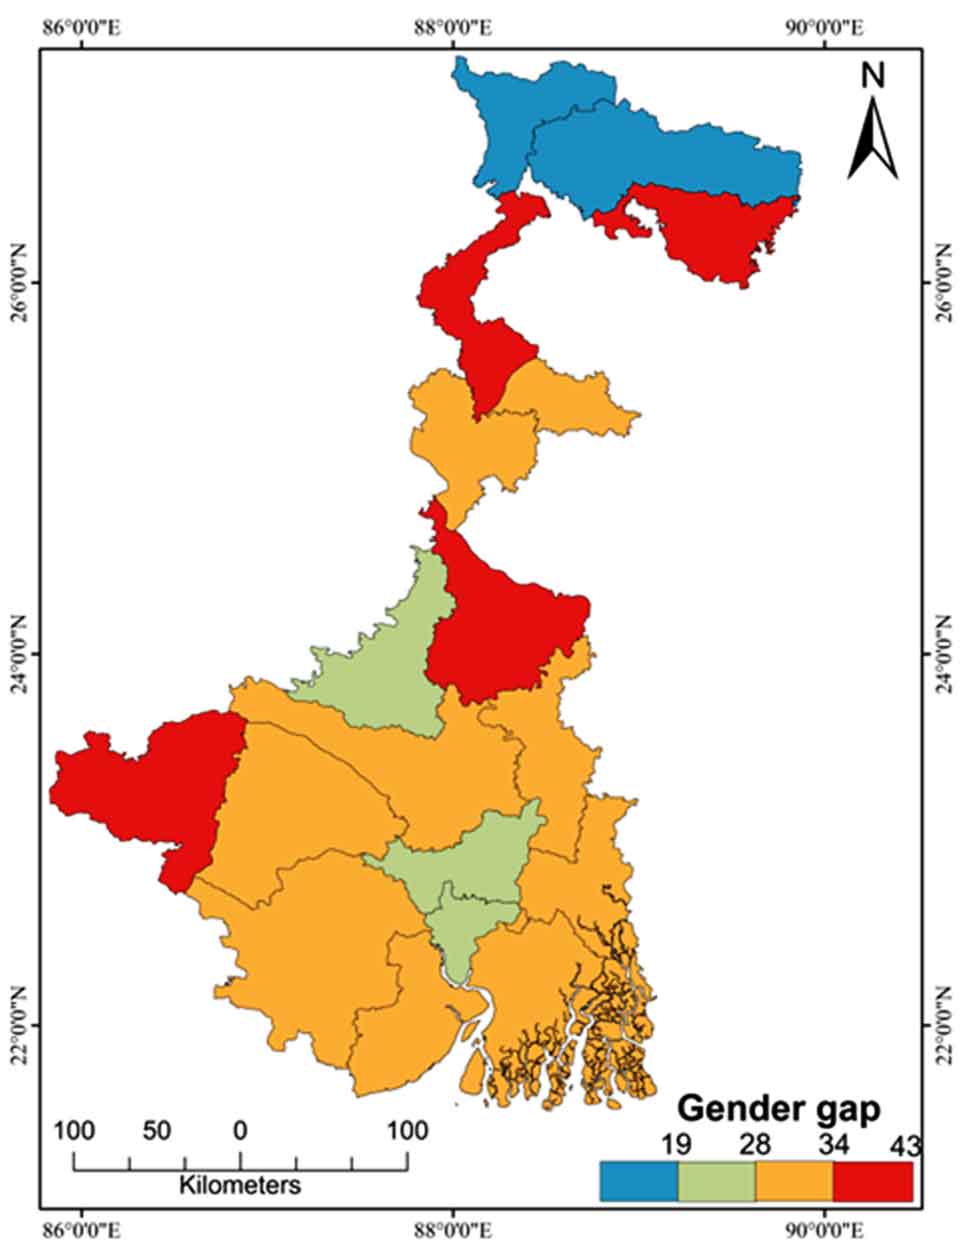
Gender gap always shows how far one gender to another gender in different aspects likes literacy level, income level and age at marriage and so on. In a particular region, higher gender gap expressed there has greatest dissimilarity among two sexes from various aspects. In West Bengal, gender gap of CMR is considerably higher (31). However, it has been mention that female CMR is almost high in all cases as compare to male CMR that strongly illustrates a clear gender gap scenario. East Mednipur had experienced the higher gender gap from the different districts of West Bengal followed by Cooch Behar and Nadia. Gender gap in CMR is comparatively lower in two hilly districts of North Bengal i.e. Darjeeling and Jalpaiguri. Therefore, in two districts, there females are not far away from males in respect to CMR.
Figure 3. Gender gap of CMR
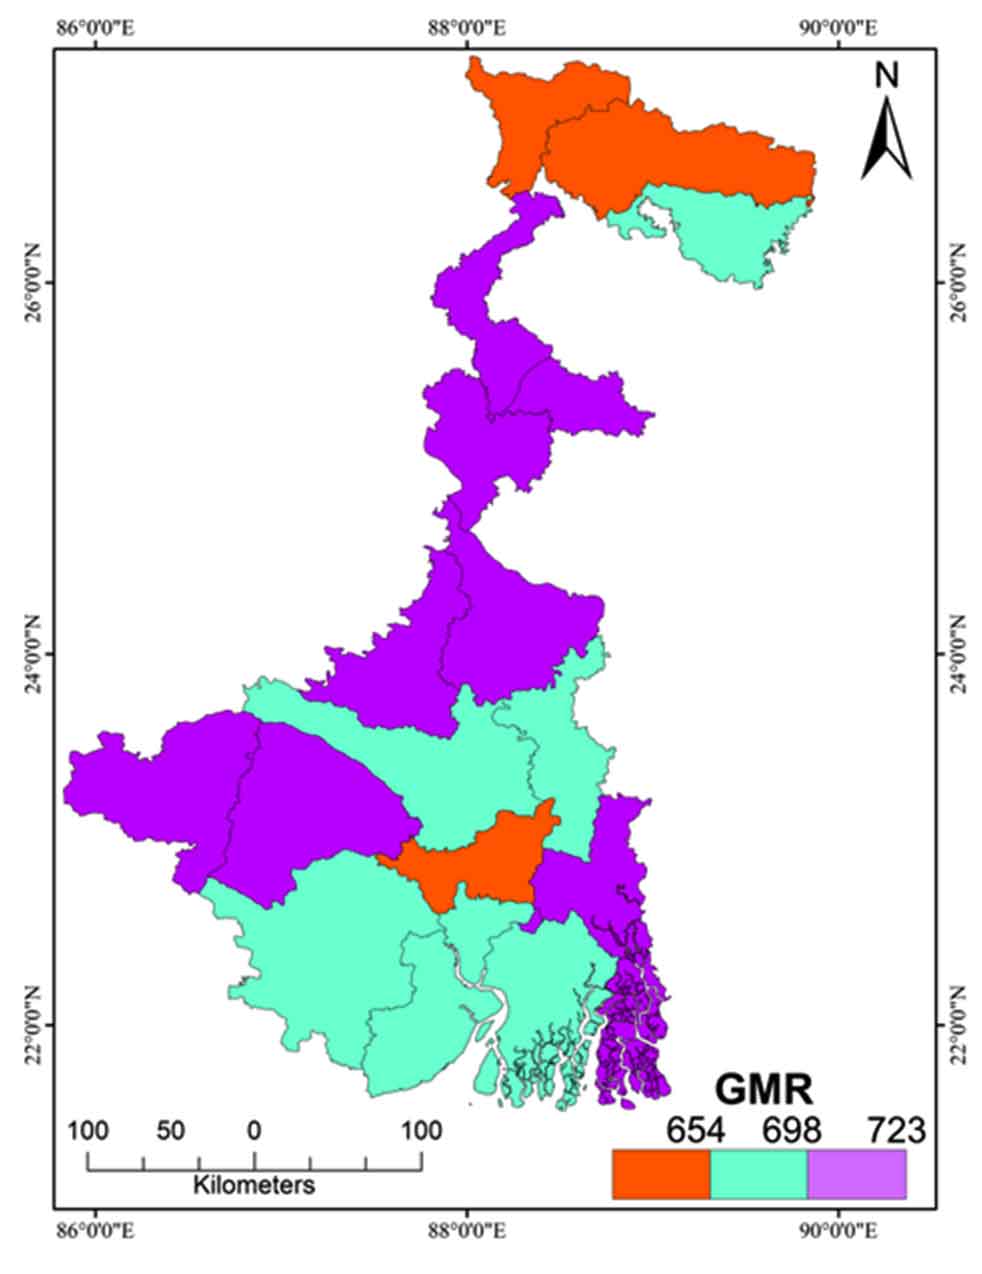
3.3 General Marriage Rate (GMR)
West Bengal has experience higher general marriage rate (697) compare to the national average (692). East Mednipur occupied top position in different district of West Bengal with regarding to general marriage rate (Figure 4). Besides, Darjeeling and Jalpaiguri have the lower GMR among all the district of West Bengal. Additionally, in the sense of gender consideration the GMR for male is higher in Birbhum (701) which is more than the state average (676). The GMR is significantly lower among males in Darjeeling Jalpaiguri, Uttar Dinajpur district. For female East Mednipur took place in higher GMR and followed by Birbhum, North 24 Parganas and Murshidabad district. In the case of Darjeeling district, the general marriage rate is lower for both male and female consideration that indirectly indicate the perfect age at marriage has been occurred among male and female groups.
Figure 4. General marriage rate
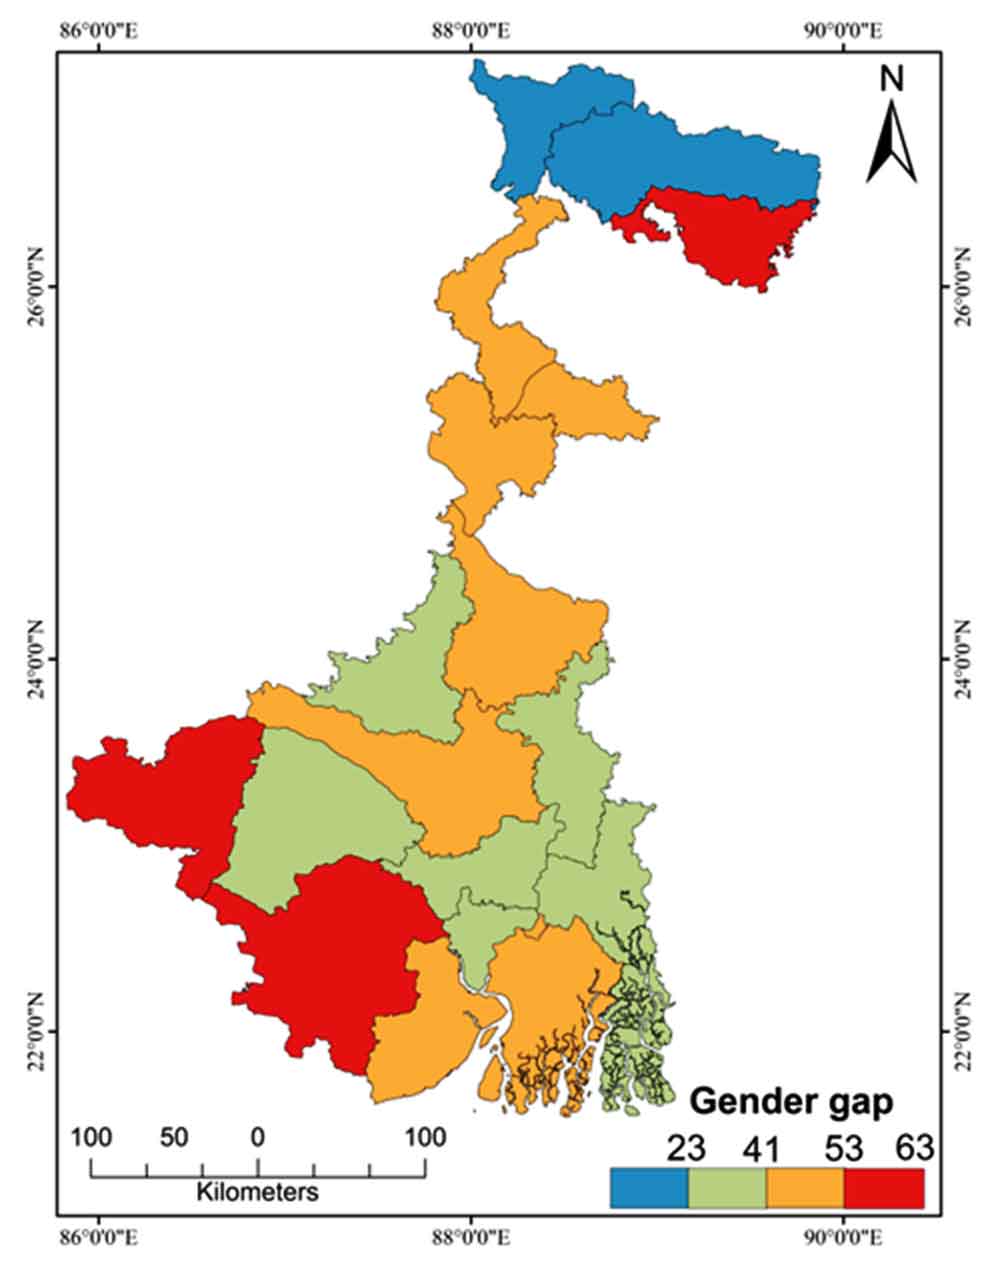
It is obvious that marriage rate is always higher for female groups than that of male in respect to CMR and GMR. In Darjeeling gender gap is less at a satisfactory level and it is lower than the state average. The literacy rate of Darjeeling is recorded 79.9% (male (85%) and female (73.7%)) among rest of the districts of North Bengal and their social background have improvised gender gap. The gender gap was extremely higher in Uttar Dinajpur and East Mednipur district of West Bengal (Figure 5).
Figure 5. Gender gap of GMR
3.4 Marriage Probability
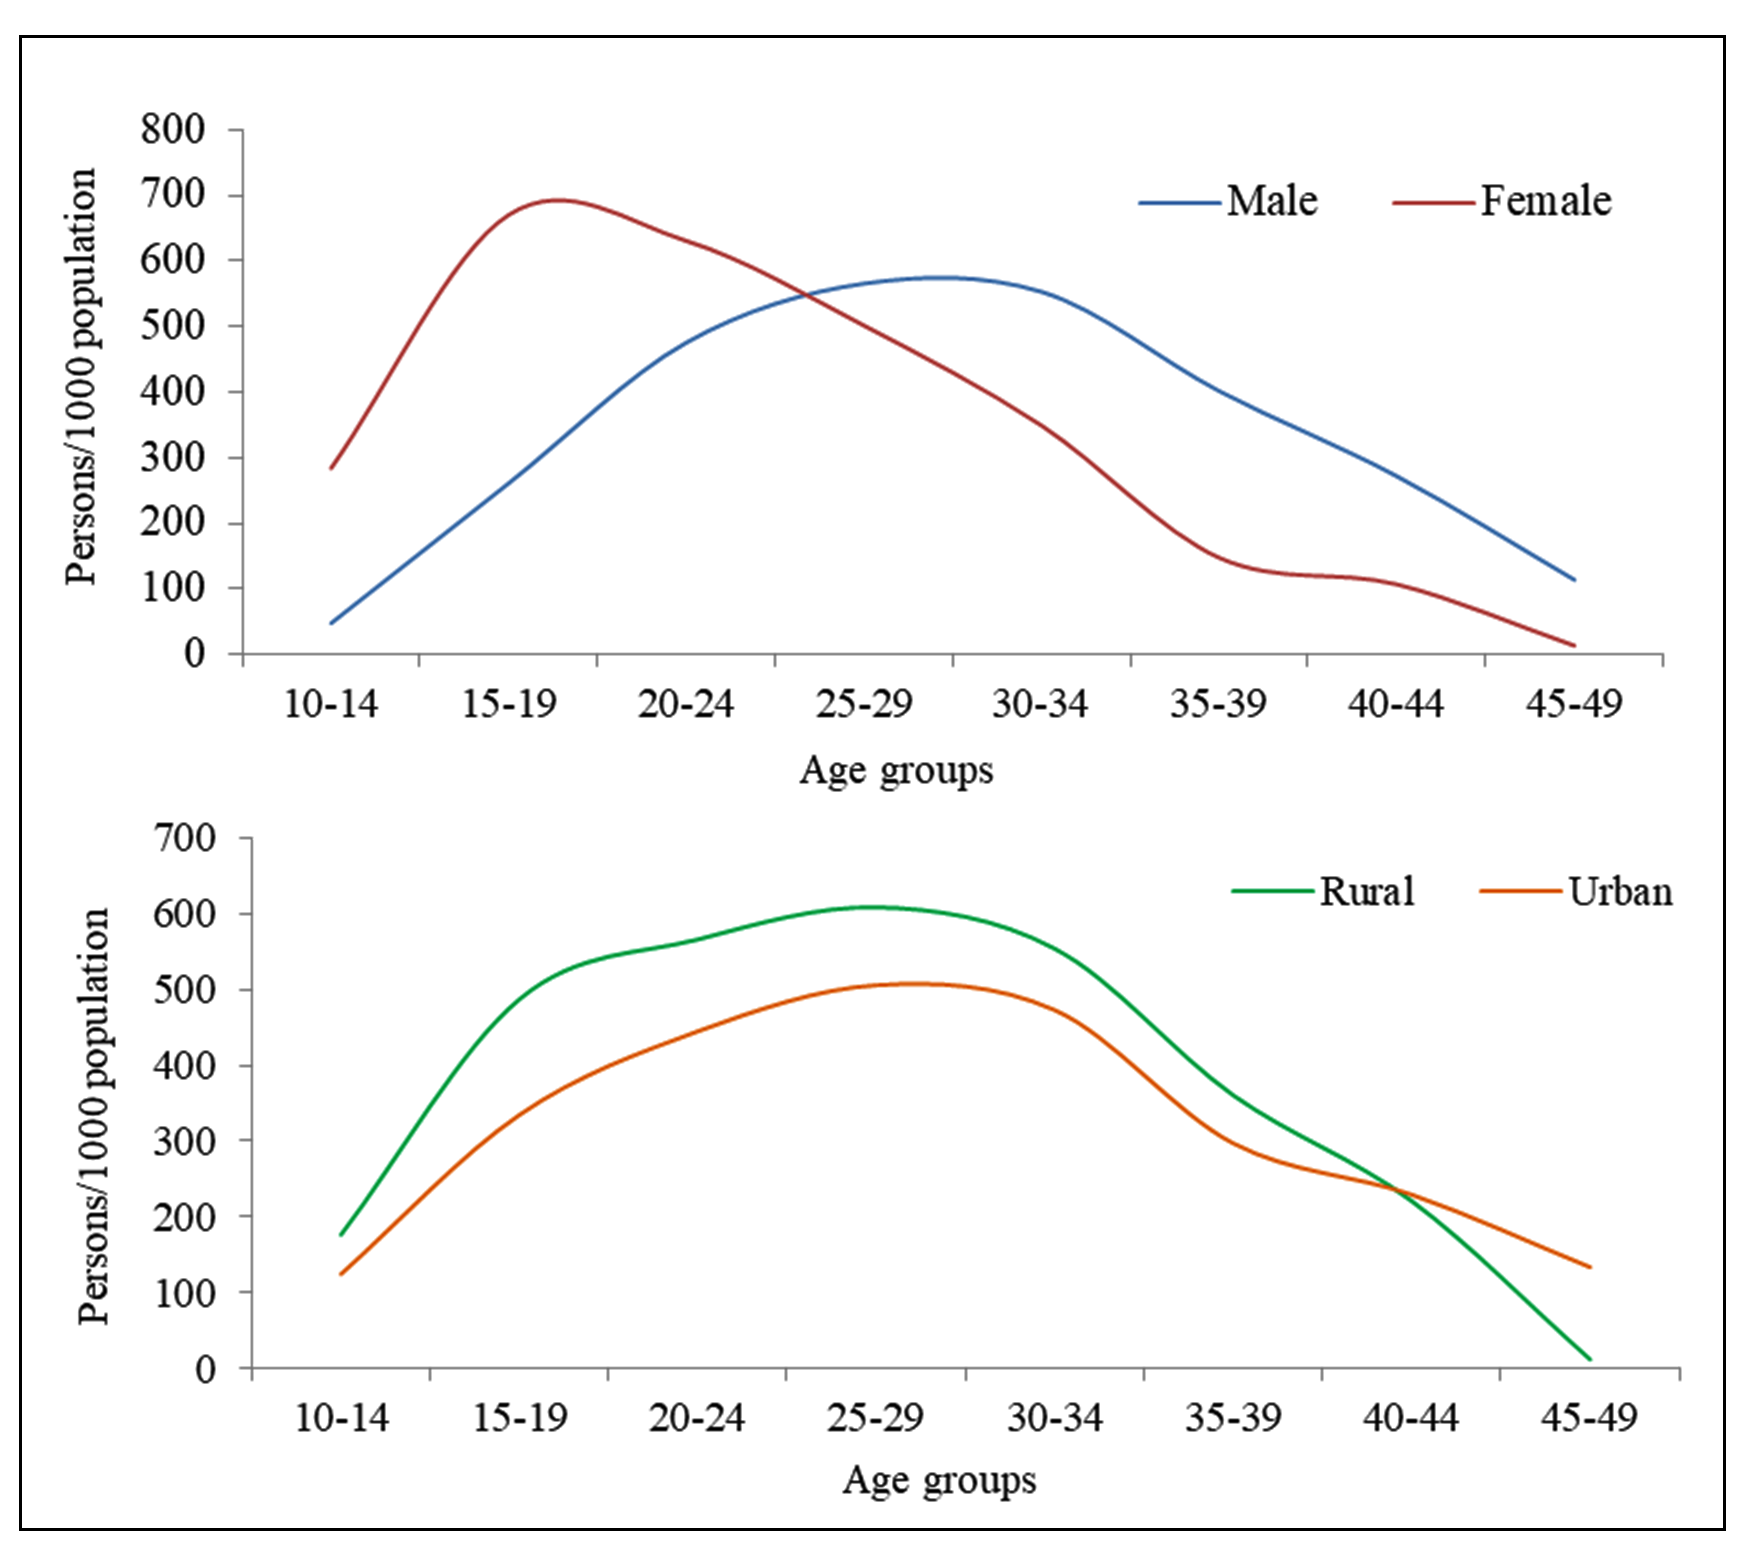
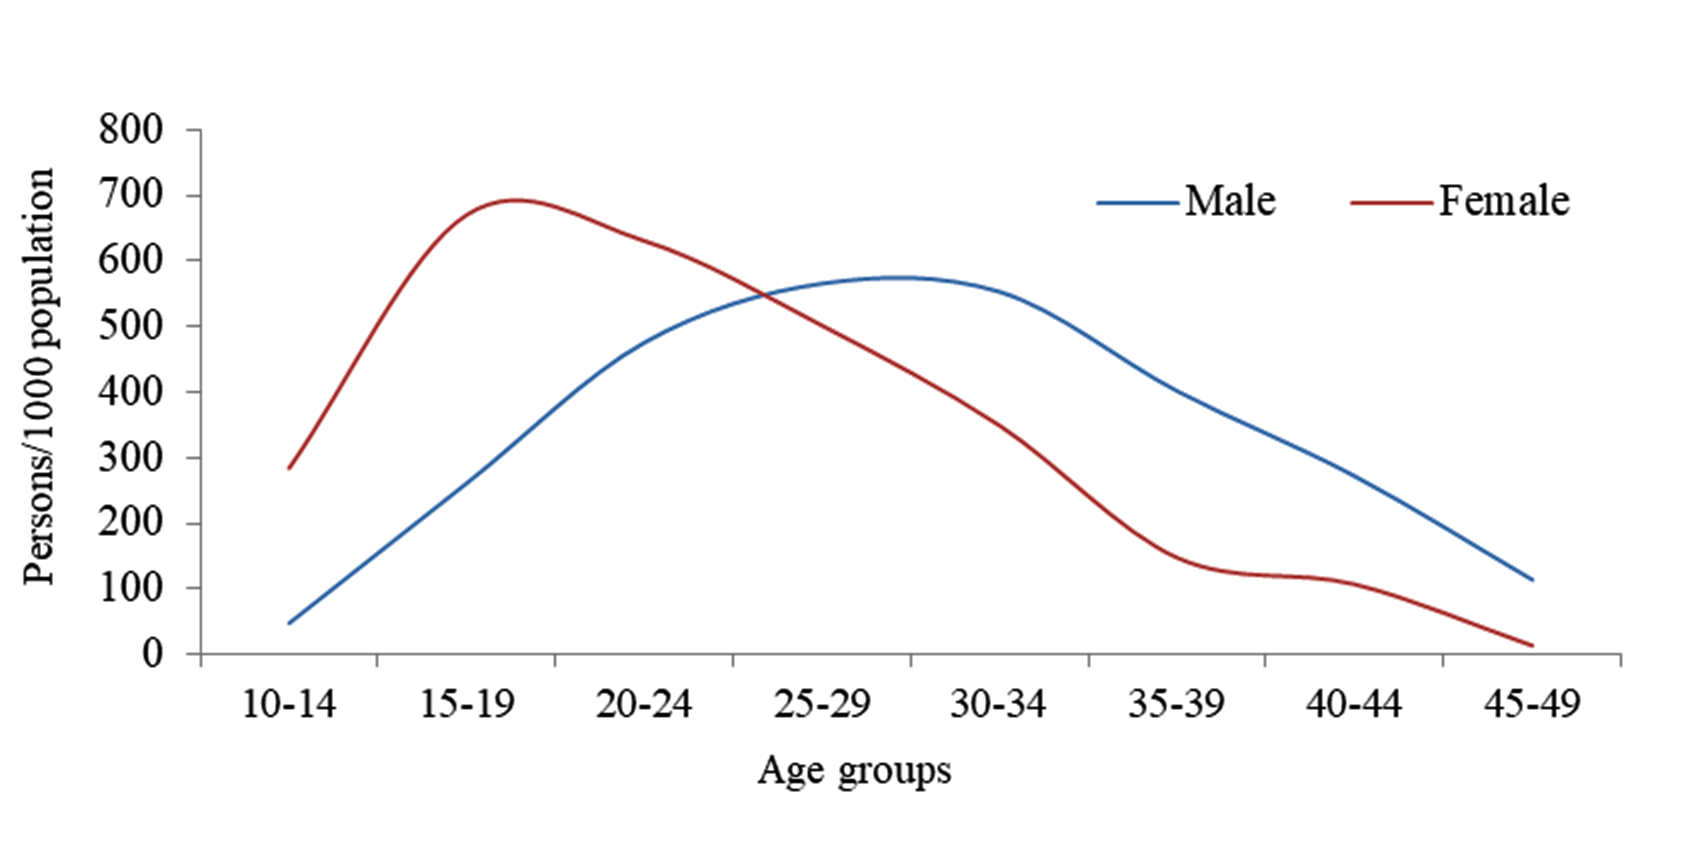
A chance of getting married is very high among females at very lower age rather than males (Figure 6). In the age group 10-14, 264 females are married per thousand females that strongly indicate the girls were married at very teenage. After 15-19 years age group female marriage has begun to rising substantially i.e. maximum probability of marriage lies within the sensitive age group when females are not mature enough both physically and mentally. This can be due to the practice of child marriage among the females. There is a common belief that late age at marriage reduced the fertility span of women. In contrast to marriage probability is still high within 30-34 age groups and after this age group percentage has dropped down continuously. In the age group of 25-29 years male and female marriage probability curve have coincided which denotes in this respective age group marriage probability is more or less same among both the males and females. So the result denotes females are married early than the males. This is the effect of low level of literacy especially female literacy, huge gender gap, social norms as well as low status granted to females have rendered to high probability of female marriage at very lower age in compare to males.
Figure 6. Marriage probability
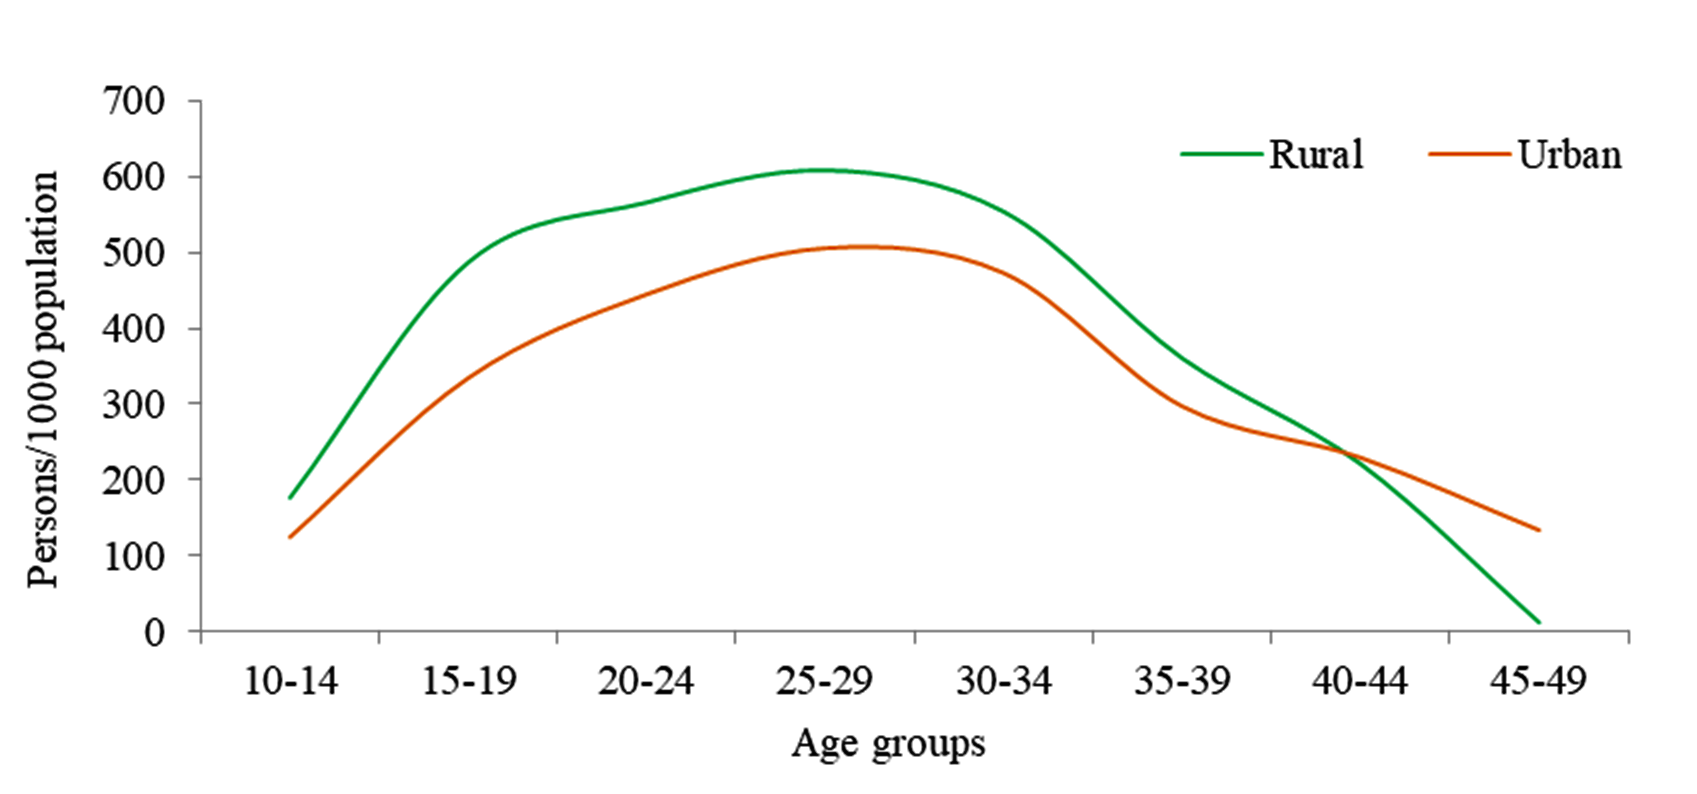
The rural residence was getting married as an early age (10-14 years) as compared to people who lived in urban areas (Figure 7). This rural-urban variation exists due to urban resident has a desire level of education, modern lifestyle, higher job opportunities and knowledge about their family planning which move towards late age at marriage. The chances of marriage remain high up to 40-44 years among rural residence. Besides, the probability of marriage was 11 times higher in the age group of 45-49 years among urban residence as compare to rural areas (134 vs. 12).
Figure 7. Age-wise marriage probability
3.5 Singulated Mean Age at Marriage (SMAM)
Situation is worst in Murshidabad and Birbhum districts of West Bengal in case of SMAM (Figure 9). On the other hand Kolkata and Darjeeling had experienced higher mean age at marriage. Out of 19 districts of West Bengal, only 8 districts have the higher mean age at marriage as compared to the state average. The SMAM considerably lower among the socio-economically backward districts of West Bengal.
Figure 8. Singulated mean age at marriage
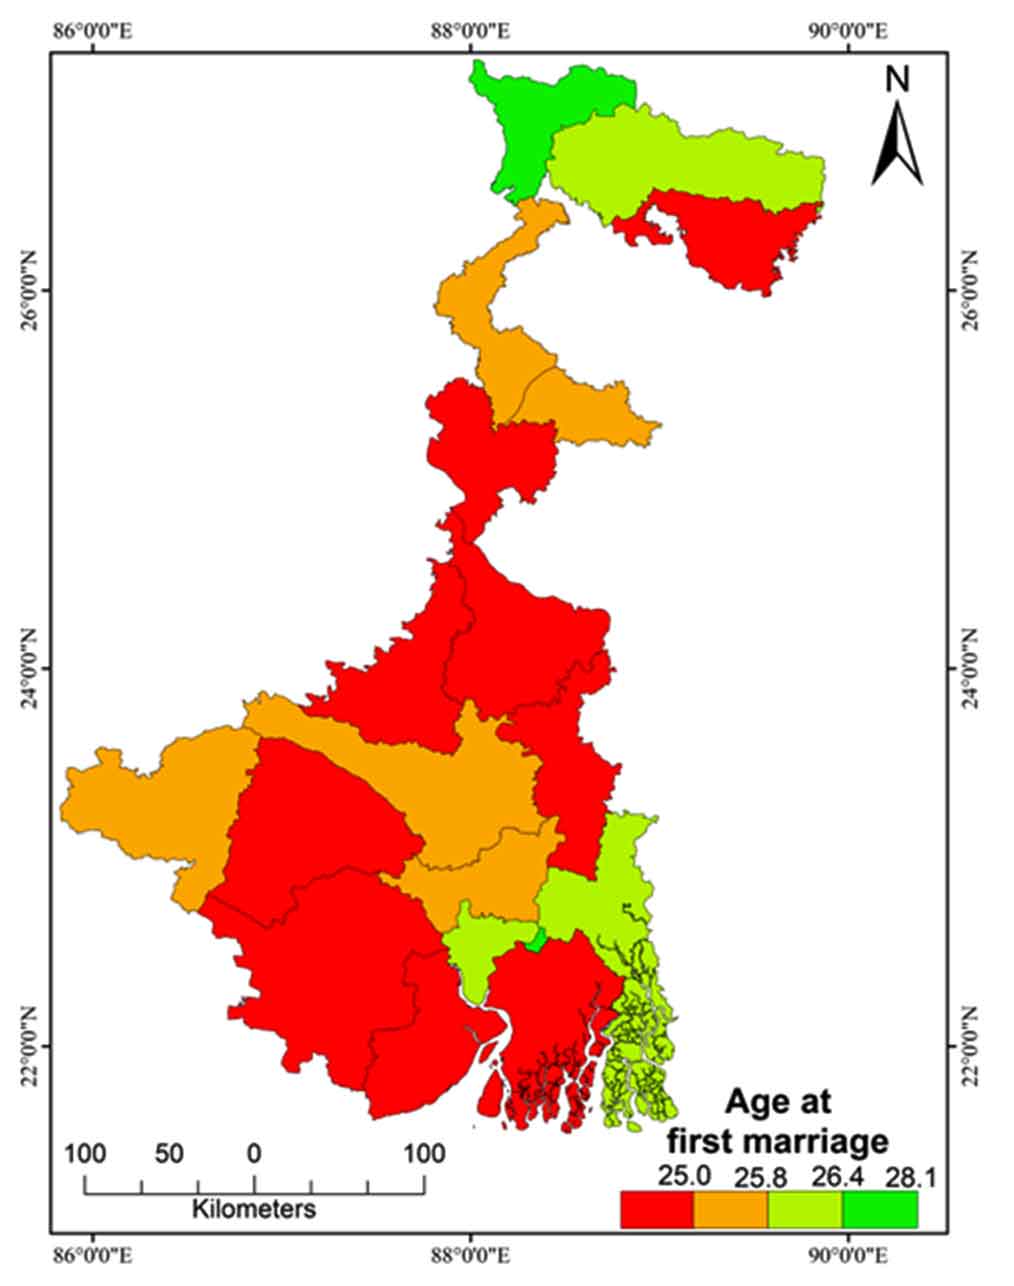
Figure 9. SMAM among males
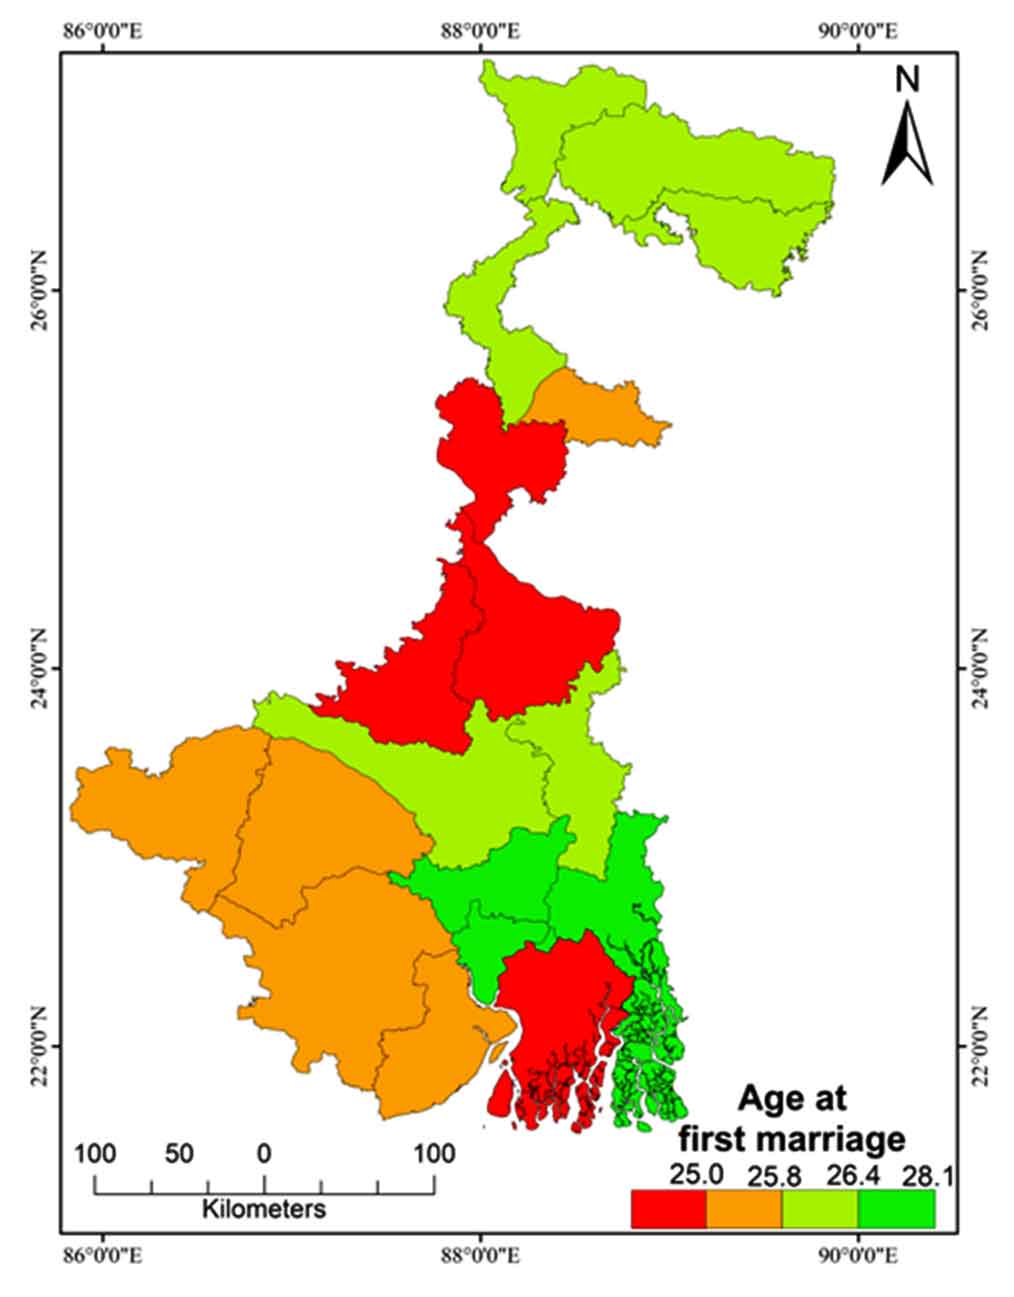
In case of SMAM gender gap is a serious issue of concern. Female were married early ages than the male. In West Bengal, marriage has taken place at early age compared to national level despite of government initiatives, schemes etc. Gender gap is higher in Nadia (6.7 years) and Hugli (6.6 years) district which exceeds the state average. 9 districts have the higher gender gap as compare to the state average. Besides, Darjeeling (4 years) has the lower gender gap among the districts of West Bengal. However, this gap between male and female is not a satisfactory bench mark over the districts of West Bengal. Regarding the SMAM among males (Figure 10), lower mean age at marriage was found in Malda, Birbhum, Murshidabad, and South 24 Parganas. While the corresponding figure of SMAM is considerably higher in Kolkata, Howrah, Hugli and North 24 Parganas. It has been observed that the higher mean age at marriage among male was higher in the surrounding districts of Kolkata. Kolkata is the capital of West Bengal and so that its surrounding districts are highly developed as compare to other districts of West Bengal. Concerning the SMAM among females, higher age at marriage was found in Kolkata and Darjeeling district. While 9 districts have the lower mean age at marriage as compared to state average (Figure 11).
Figure 10. SMAM among females
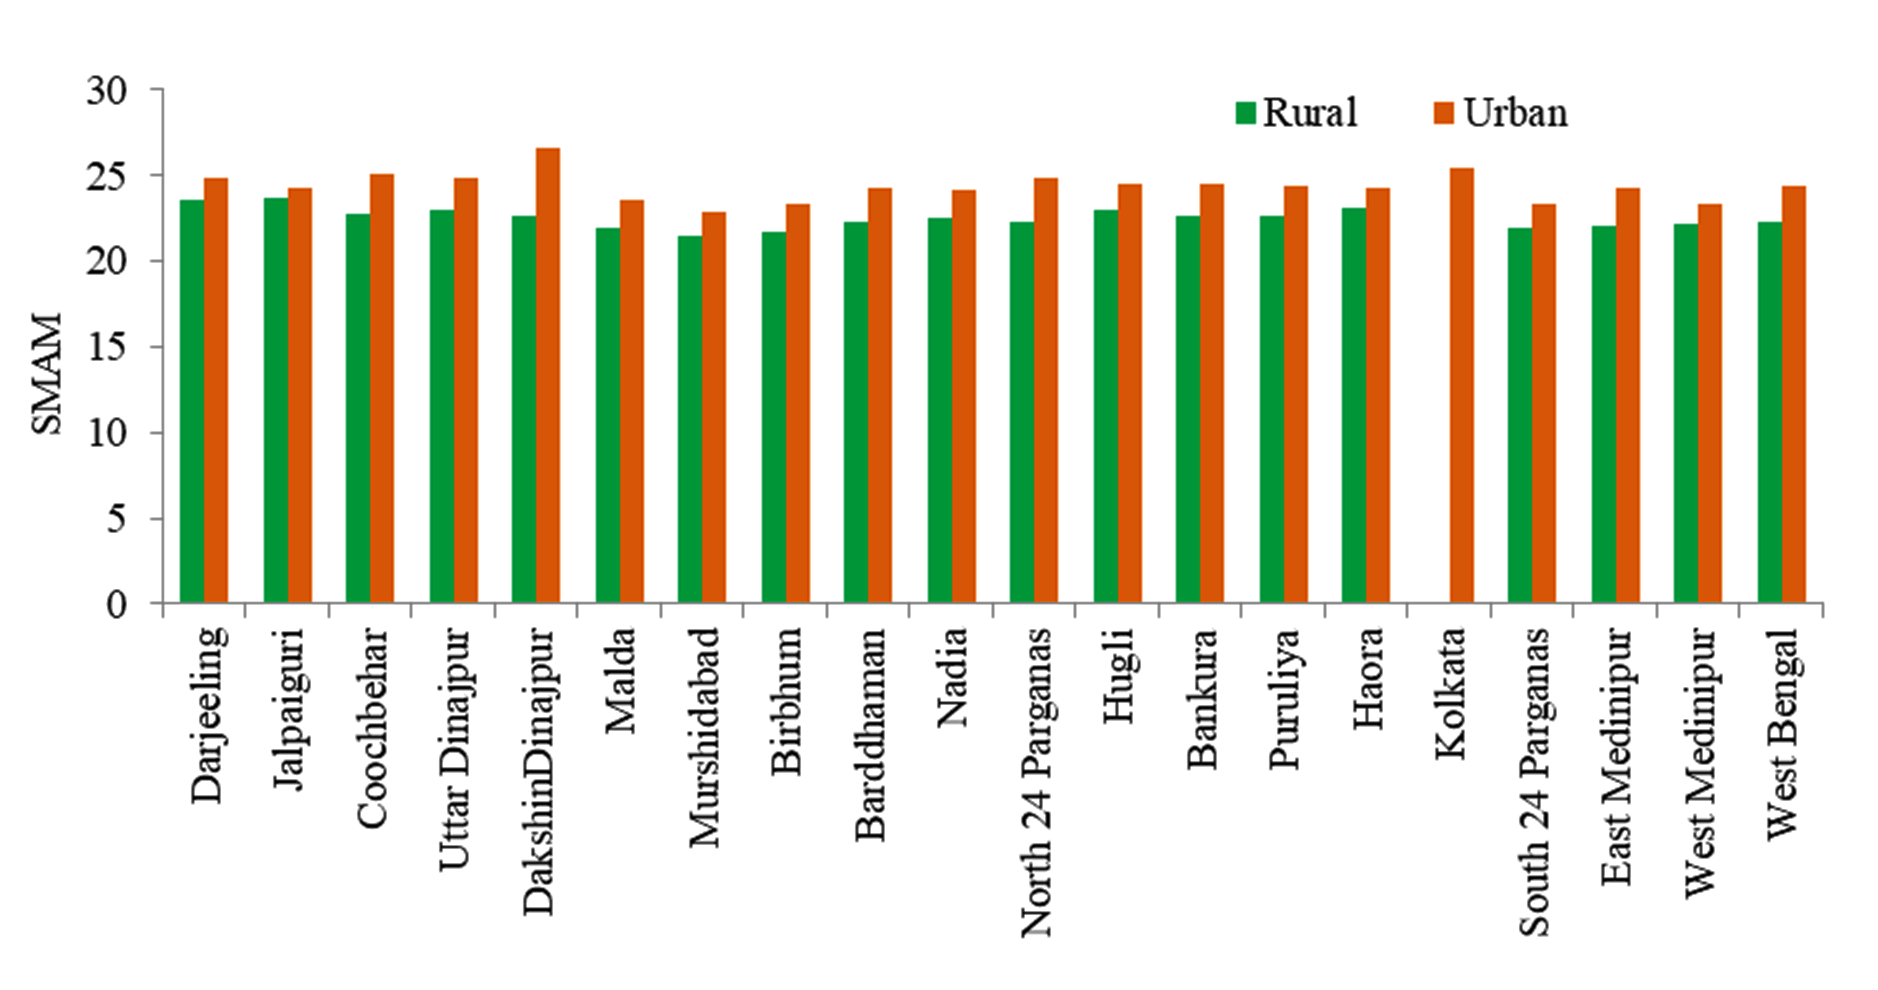
Singulated mean age at marriage is higher in urban areas as compared to rural areas in West Bengal (24.4 vs. 22.3 years). Concerning the rural areas, higher age at marriage was found in Jalpaiguri district (23.7 years) and followed by Darjeeling (23.5 years) while the corresponding figure was lower in Murshidabad (21.3 years) and followed by Birbhum (21.7 years) in 2011. Besides, higher SMAM was found in Dakshin Dinajpur among urban residence and lower in Murshidabad district (Figure 11). Most of the marginalized people resided in rural areas. They are socio-economically backward and social mobility is less among the rural resident as compared to urban. And parents do not want to educate their daughters more than necessary. They think girls are the burden of family. Girls would be a member of another family. So that parents married off their daughter at an early age. Therefore, mean age at marriage was found considerably lower in rural counterparts in West Bengal.
Figure 11. Rural-Urban variation in SMAM
4 . DISCUSSION
The present study deals with nuptiality patterns of West Bengal. The number of married persons in rural areas is comparatively high, which denotes that the male persons are engaged in marriage at an early age, same as females, which argue with the national level studies of India (Agarwal et al., 2006). The lower age at marriage is more prevalent in rural areas due to poverty, lack of awareness, low educational level of females, etc. (Wahhaj, 2018; Paul, 2019). In rural areas, the parents prefer to marry their sons after completion of their education and asked them to take the responsibilities of the household, which is very rare in urban areas (Chouhan and Roy, 2018). They thought that girl children would be a member of another family. Thus, they could not agree to give higher education for their girl children (Chouhan and Roy, 2018), and the economic backwardness is another important factor, which pushed them to get married at a lower age. In urban counterpart, parents are more educated and they emphasise more on education of son and daughter, which leads to legal age at marriage (Biswas et al., 2019). There is another factor due to which many women remain single in urban areas compared to the rural areas, and that is due to self-employment, better economic conditions and to achieve a higher education. The mean age at marriage is higher among urban residents than their rural counterparts. Urban people may be delayed their marriages because of awareness of family planning, higher expectations about their carrier and modern livelihood cost etc. (Ghosh and Kar, 2010).
5 . CONCLUSION
The study was focused on the analysis of marital status of West Bengal. The percentage of divorce and separation rate is low in all districts of West Bengal, as they consider marriage to be a union of souls and not merely of bodies. A large number of the population got married at an early age especially amongst females. The incidence of early age at marriage is still prevalent in West Bengal. A range of policy and programmatic actions are needed to reduce early marriage and its negative impacts. Actions to fulfil or restore the rights of those already married should go hand in hand with preventive actions aimed at wider society. The aim should be to aware parents and young people currently complicit in the practice of early marriage so that they are aware of its true bad impact and empower them to resist it. The role of government and civil society institutions is to develop and implement proper ways i.e. education for empowerment and intellectual development, support for physical well-being, support for psychological well-being and emergency assistance, support for improved economic status to prevent or discourage the practice.
Tables
Figures
Conflict of Interest
The authors declare that there is no conflict of interest.
Acknowledgements
The authors would like to thank anonymous reviewers for their critical input in the manuscript.
Abbreviations
CMR: Crude Marriage Rate; GMR: General Marriage Rate; SMAM: Singulated Mean Age at Marriage.
Census of India 2011. Social and cultural tables for India, C-series (C-2 Marital Status by Age and Sex) India, Ministry of Home Affairs, New Delhi.
5.
Chouhan, P. and Roy, A., 2018. Nuptiality status in North Eastern states of India: A comparative state level study. Research Journal of Social Science and Management, 7(11), 144-153.
6.
Faust, K. A., 2004. Marriage, divorce, and family groups. In J. S. Siegel and D. A. Swanson (Eds.), The methods and materials of demography (191-210). New York: Elsevier Academic.
7.
Ghosh, B. and Kar, A. M., 2010. Child marriage in rural West Bengal: Status and challenges. Indian Journal of Development Research and Social Action, 6(2), 1-23.
8.
Goli, S., 2016. Eliminating Child Marriages in India: Progress and Prospects. Child Rights Focus, Action-Aid, New Delhi, India.
9.
Hajnal, J., 1965. European marriage in perspective. In: DV Glass,DECEversley (Eds.): Population in History: Essays in Historical Demography.. London, Edward Arnold, 101-143.
Mathur, S., Greene, M. and Malhotra, A., 2003. Too Young to Wed: the Lives, Rights and Health of Young Married Girls.Washington, DC: International Center for Research on Women (ICRW).
Nour, N. M., 2006. Health consequences of child marriage in Africa. Emerging Infectious Diseases, 12(11), 1644-1649.
18.
Pandey, A. and Nath, D. C., 2016. Nuptiality patterns in Uttar Pradesh, India. Journal of Law and Social Sciences, 5(1), 51-58.
19.
Pandey, A. and Pandey, A., 1997. Analysing female nuptiality pattern at micro level: A case of Uttar Pradesh. IASSI Quarterly, 16(3-4), 1-16.
20.
Pandey, A., 1984. Determinants of age at marriage for females in India. Janasamkhya, 2(2), 105-115.
21.
Pandey, M. K., 2008. Association between marital status and health: Examining the role of age and gender. Munich Personal Repec Archive Paper No. 15923. Institute of Economic Growth, University of Delhi Enclave, Delhi, India.
22.
Pathak, K. B., 1980. Law and age at marriage for females in India. The Journal of Social Work, 49(4), 407-416.
Singh, C., 1986. peoples’ perception on age at marriage in Bihar, Madhya Pradesh, Rajasthan and Uttar Pradesh. Paper Presented at the Eleventh Annual Conference of IASP, 3-6, March, Varanasi, India.


 ,
PRADIP CHOUHAN 1
,
PRADIP CHOUHAN 1