1 . INTRODUCTION
One of the most valuable gifts with which humanity has been endowed by nature is water. For the sustenance and preservation of life, water is utterly necessary. As the population is rising and the demand for protection is growing, it is recognized that water and land supplies need to be created, used and handled in an interconnected and systematic way. Remote sensing data with a high spatial resolution coupled with techniques for processing topographical data provide an extremely effective approach for understanding and regulating natural resources. It provides real-time and exact information on a variety of geographical formations and landforms and assists in identifying drainage systems that have been changed by human pursuits. GIS is a very efficient tool for examining drainage, geology, landform characteristics, and other spatial and non-spatial elements to comprehend their connection. When urban planning and groundwater research are combined, the principle of enhanced remote sensing and GIS has shown to be a critical technique. In discerning groundwater potential areas, hydrogeomorphological studies coupled with structural features combination have proven to be a very successful in the arid and semi-arid regions of Anantapur district (Rajasekhar et al., 2019; Rajasekhar et al., 2018; Pinto et al., 2017). Many workers in various parts of the world have adopted various strategies for producing geology, hydrogeology thematic charts, combining the data to pick favorable groundwater recharge locations (Saranya and Saravanan, 2020).
Vast quantities of groundwater have been drained excessively in recent years to satisfy the population’s water demand. Therefore, it has become greatly important to delineate future groundwater zones. Several traditional sciences have been used to delimit the possible groundwater zones (GWPZs), such as geology, hydrogeology and remote sensing techniques. By integrating many various thematic maps such as slope, LULC, precipitation, LD, DD, soils and lithology as different mapping criteria, data access, collection, incorporation, analysis and interpretation have now facilitated the development of specific methods for groundwater exploration (Rajasekhar et al., 2019b; Kadam et al., 2012; Rajasekhar et al., 2020; Kumar et al., 2020; Saaty, 2004; Badapalli et al., 2021; Golla et al., 2021).
However, several experts have used geospatial methods to classify different ways to identify groundwater resources (Rajasekhar et al., 2019a and 2019b). In addition, these methods and techniques are extremely helpful where data collection is feasible, including in inaccessible environments (Agarwal et al., 2016; Badapalli et al., 2019; Kumar et al., 2019; Kumar et al., 2020) These researchers have used multilayered approaches in recent years by giving weightages to the chosen layers and the attributes of the groundwater capacity of the individual themes in an region. The primary goal of this project is to increase the effect of RS, GIS, and Analytic Hierarchy Process (AHP) methods for identifying GWPZs in Andhra Pradesh’s semi-arid areas and developing a prospective groundwater exploration and exploitation guide map to assure optimal and sustainable resource utilization. The findings will be useful for future decision-makers and groundwater resource management.
3 . METHODOLOGY
3.1 Thematic Mapping
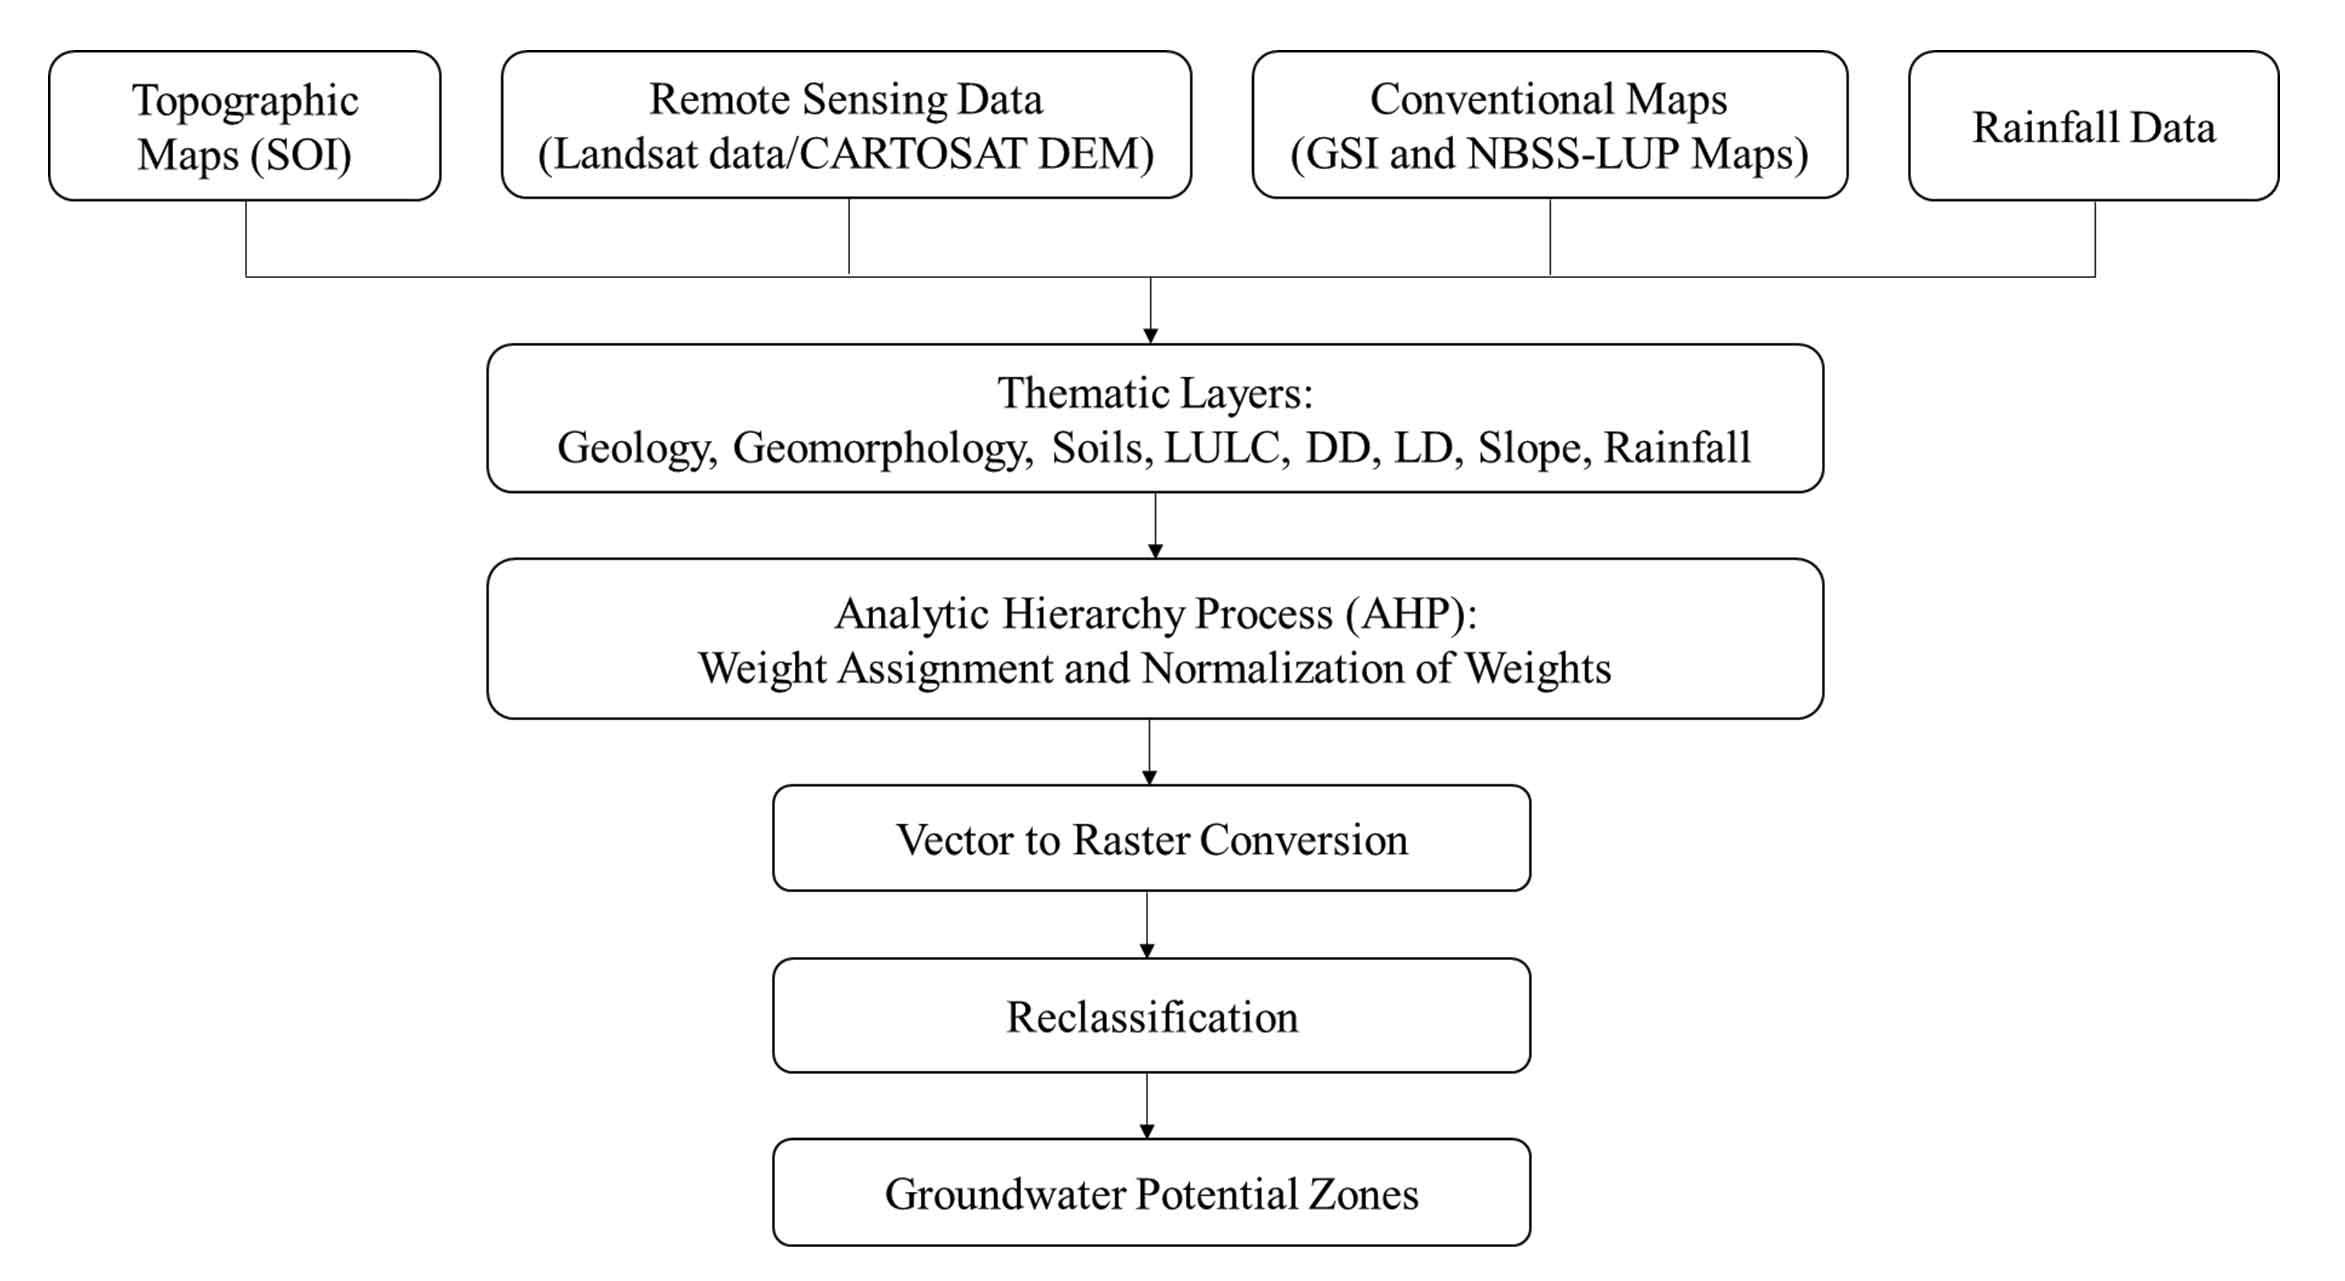
The analysis was attempted by considering that eight separate layers, such as geology, geomorphology, LD, DD, LULC, soil, slope, rainfall, were prepared by processing the satellite data, obtained from various sources, and analyzed to construct the database in the GIS setting. Weighting and ratings were allocated to each map and its groups in order to define potential groundwater zones. (Zolekar et al., 2015; Kadam et al., 2019 and 2020; Al-Djazouli et al., 2020).
- Geology and geomorphology maps were obtained from GSI 2002.
- Slope, DD layers were prepared using CARTOSAT I – 30 meters, extracted freely from USGS earth explorer website.
- LULC were created using Landsat-8 data freely collected from USGS earth explorer website.
- Lineaments and lineament density were prepared using NRSC BHUVAN website.
- The soil map is obtained from NBSS/LUP in 1:50,000 scale.
- The rainfall data was received from the district ground water agency in Anantapur.
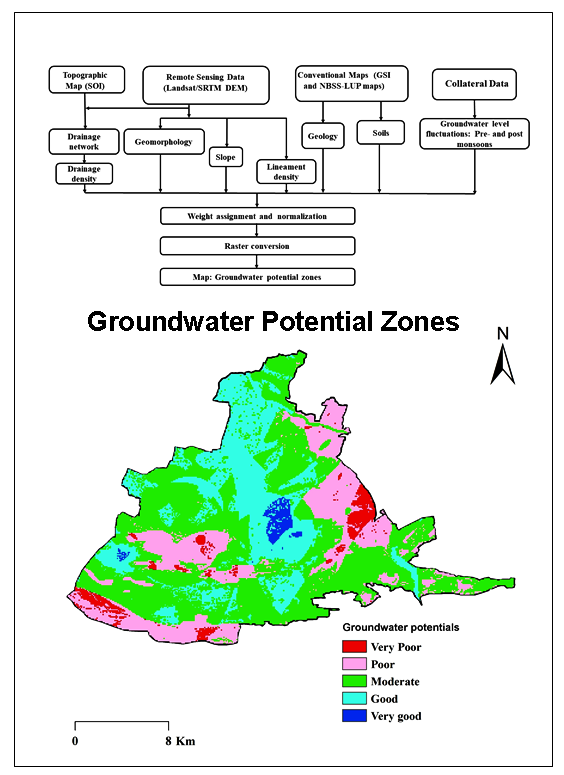
All the thematic layers were georectified and smooth handling of data in the ArcGIS. After the creation of the database for all eight layers, decision-making tool AHP is followed for weight assigned to every thematic layer (Figure 2).
3.2 Normalization of Weights
AHP for decision-making includes dissecting a problem into several criteria, putting them in a multi-leveled framework, deciding on the aggregate value of groups of components, and merging the findings (Saaty, 1990). Each thematic layer has various classes, implying that the connections between these related classes are considerably too complex. Thus, a connection has been formed between these eight thematic layers through the usage of AHP to represent the various groups (Rahmati, et al., 2015; Mundalik et al., 2018; Rajasekhar et al., 2019c and 2020). The approach for independently computing the weights for thematic maps and their viewing groups using AHP have been refined with the passage of time.
In this study, eight criterions including geology, geomorphology, soil, LULC, LD, DD, Slope and rainfall were selected to delineate the GWPZs of the study area. Different criterions show different influence on GWPZs; as a result, weights were assigned to each element based on their effect on the flow and storage of groundwater and as a reference. The weight value factor is proportional to its value in GWPZ, with a high weight value assigned to the dominating influence factor shown in Table 1. To illustrate, DD, LULC, soils, and rainfall plays a dynamic role with the highest score weight of 15 %, 15%, 15%, and 15% followed by geology, geomorphology, slope, and LD with score weight of 10 %, 10%, 10 %, and 10%, respectively.
Table 1. Criterion, Weights and Normalized Weights
|
Criterion
|
Weight
|
Normalized Weight
|
Class
|
Area (Km2)
|
|
Geology
|
10
|
0.13
|
Amphibolite (Hbl) Schist
|
10.5
|
|
Granite and Granodiorite
|
30.07
|
|
Hornblende – biotite gneiss
|
266.33
|
|
Lamprophyre
|
0.55
|
|
Meta basalt
|
2.89
|
|
Geomorphology
|
10
|
0.11
|
Pediment –Pedi plain complex
|
292.65
|
|
Anthropogenic Terrain
|
10.41
|
|
Waterbodies
|
13.37
|
|
LULC
|
15
|
0.17
|
Waterbodies
|
13.37
|
|
Forest
|
72.94
|
|
Fallow land
|
80.24
|
|
Built-up land
|
39.4
|
|
Vegetation
|
104.4
|
|
Soils
|
15
|
0.19
|
Fine loamy gravelly clayey soils
|
27.41
|
|
Gravelly clayey soils
|
99.71
|
|
Gravelly loamy soils
|
8.86
|
|
Loamy to clayey soils
|
62.96
|
|
Loamy to gravelly clayey soils
|
115.39
|
|
Lineament Density
|
10
|
0.09
|
0 - 0.15 Km/Km2
|
178
|
|
0.15 - 0.30 Km/Km2
|
45
|
|
030 - 0.45 Km/Km2
|
50
|
|
0.45 - 0.60 Km/Km2
|
18
|
|
>0.60 Km/Km2
|
19
|
|
Drainage Density
|
15
|
0.03
|
<1 Km/Km2
|
28.17
|
|
1 - 2 Km/Km2
|
47.73
|
|
2 - 3 Km/Km2
|
79.91
|
|
3 - 4 Km/Km2
|
96.24
|
|
>4
|
58.05
|
|
Slope (%)
|
10
|
0.09
|
0 - 20
|
68.82
|
|
2 - 50
|
52.61
|
|
5 - 200
|
58.66
|
|
20 - 350
|
70.82
|
|
>350
|
60.05
|
|
Rainfall
|
15
|
0.2
|
0 - 50 mm
|
-
|
|
50 - 100 mm
|
-
|
|
100 - 250 mm
|
-
|
|
250 - 400 mm
|
-
|
|
> 400 mm
|
-
|
3.3 Pairwise Comparison Matrix (PCM)
According to Saaty 1990, a diagonal matrix was prepared by placing the values in the upper triangle and their reciprocal values are used to fill the triangular matrix. Expert’s judgment was used for PCM. In addition, the relative weights were normalized. This fundamental eigenvalue is used to degree the consistency of ideas through an analysis of the consistency ratio (CR). A CR values lower than 0.1 can be considered as opinions with less uncertainty in weight determination. The Consistency Index (CI) is calculated using the equations (equation 1) and the comparison matrix to compare all parameters for calculating CR.
CI = (λ max – n) / n (1)
where, λ max is average number of consistency vector and n is number of criterions.
The CR has been computed using the equation 2
CR= CI/RCI (2)
where, RCI is random consistency index (Saaty, 2000).
The GWPZs were long established, based on readily available well yield data from the ground water department in Anantapur, Andhra Pradesh. To double-check the precision of the current work in the several GWPZs, the groundwater well data instructs is superimposed on the final GWPZs map.
3.4 Criterions
Agricultural production and operations are closely connected to physical components. The terms LULC, LD, soils, DD, geomorphology, geology, slope and rainfall, are frequently used to assess the land’s characteristics and suitability for GWPZs (Table 1). Depending on the geographical characteristics, these parameters have various degrees of impact and affluence. Consequently, WOA picked all of the requirements for GWPZs.
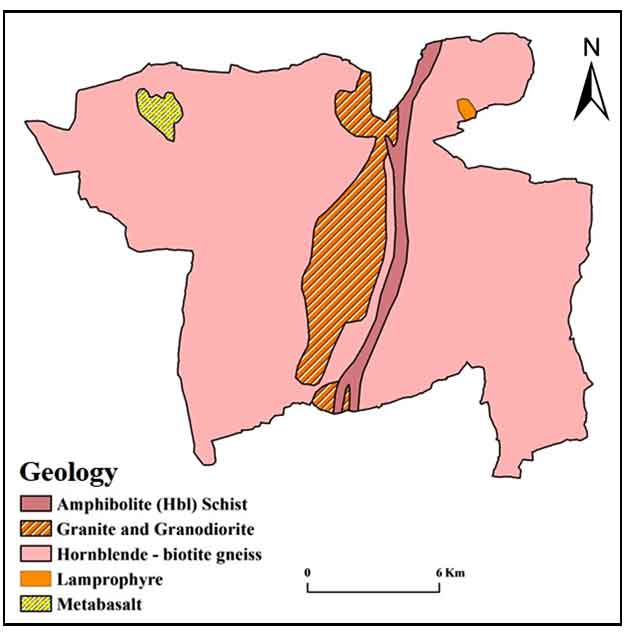
3.4.1 Geology
Lithological units were digitized, and geological map was prepared by using ArcGIS 10.4 software. Majority of the study region covered by the hornblende-biotite gneiss, granite and granodiorite were present in the center of the study region followed by the granite and granodiorite amphibolite schist is present as lithological unit. Meta-basalts are in the western part of the study region (GSI, 2002) (Figure 3). The importance of aquifer type to preserve groundwater was determined using a pairwise comparison matrix of geology maps. The research area was split into separate lithologies depending on the value of aquifer forms with less storage in the study area.
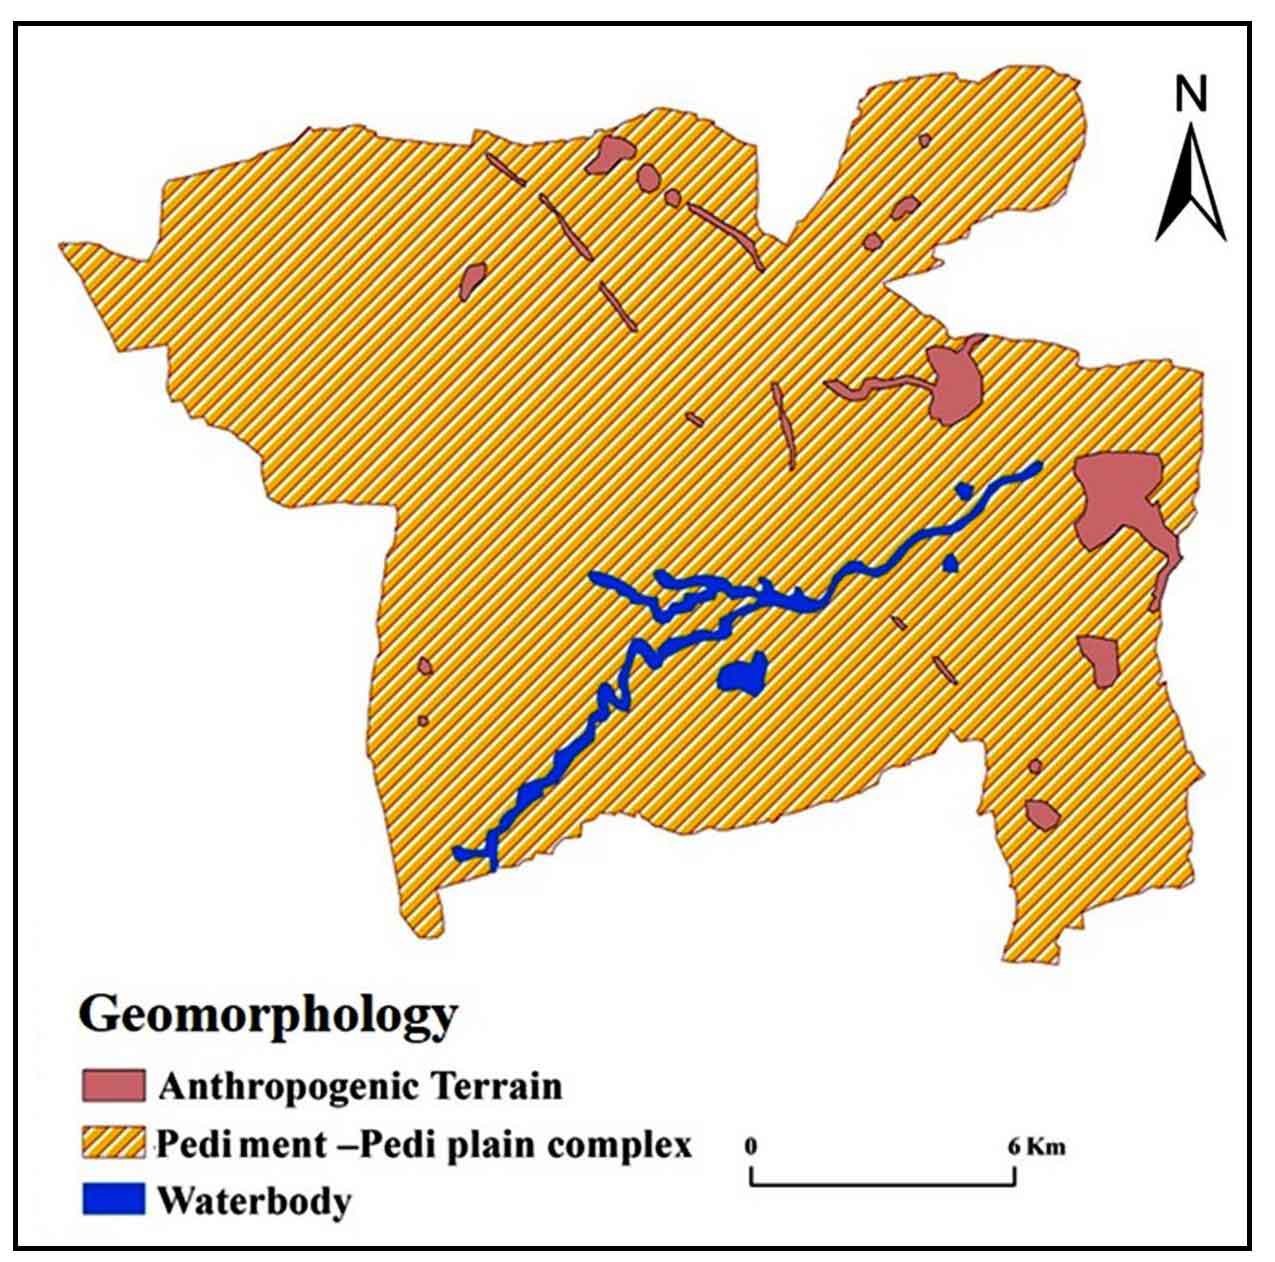
3.4.2 Geomorphology
Geomorphological layer illustrate key landforms aid in the knowledge of the methods, structures, and topographical controls used to delineate GW possibilities. Geomorphological mapping includes identifying and characterizing a variety of landforms and structural characteristics, as well as the movement of water and the freezing and thawing of ice. Numerous these characteristics are conducive to the formation of groundwater and categorized according to their groundwater potentiality. Satellite images were used to create geomorphological maps in the ArcGIS environment. Most of the present study is composed of pediment-pedi plain complex – and structural origins – low dissected hills and valleys (moderately percolated zone) - with pediment and Pedi plain regions receiving the highest priority and structural origins receiving the lowest priority in the study area (Figure 4).
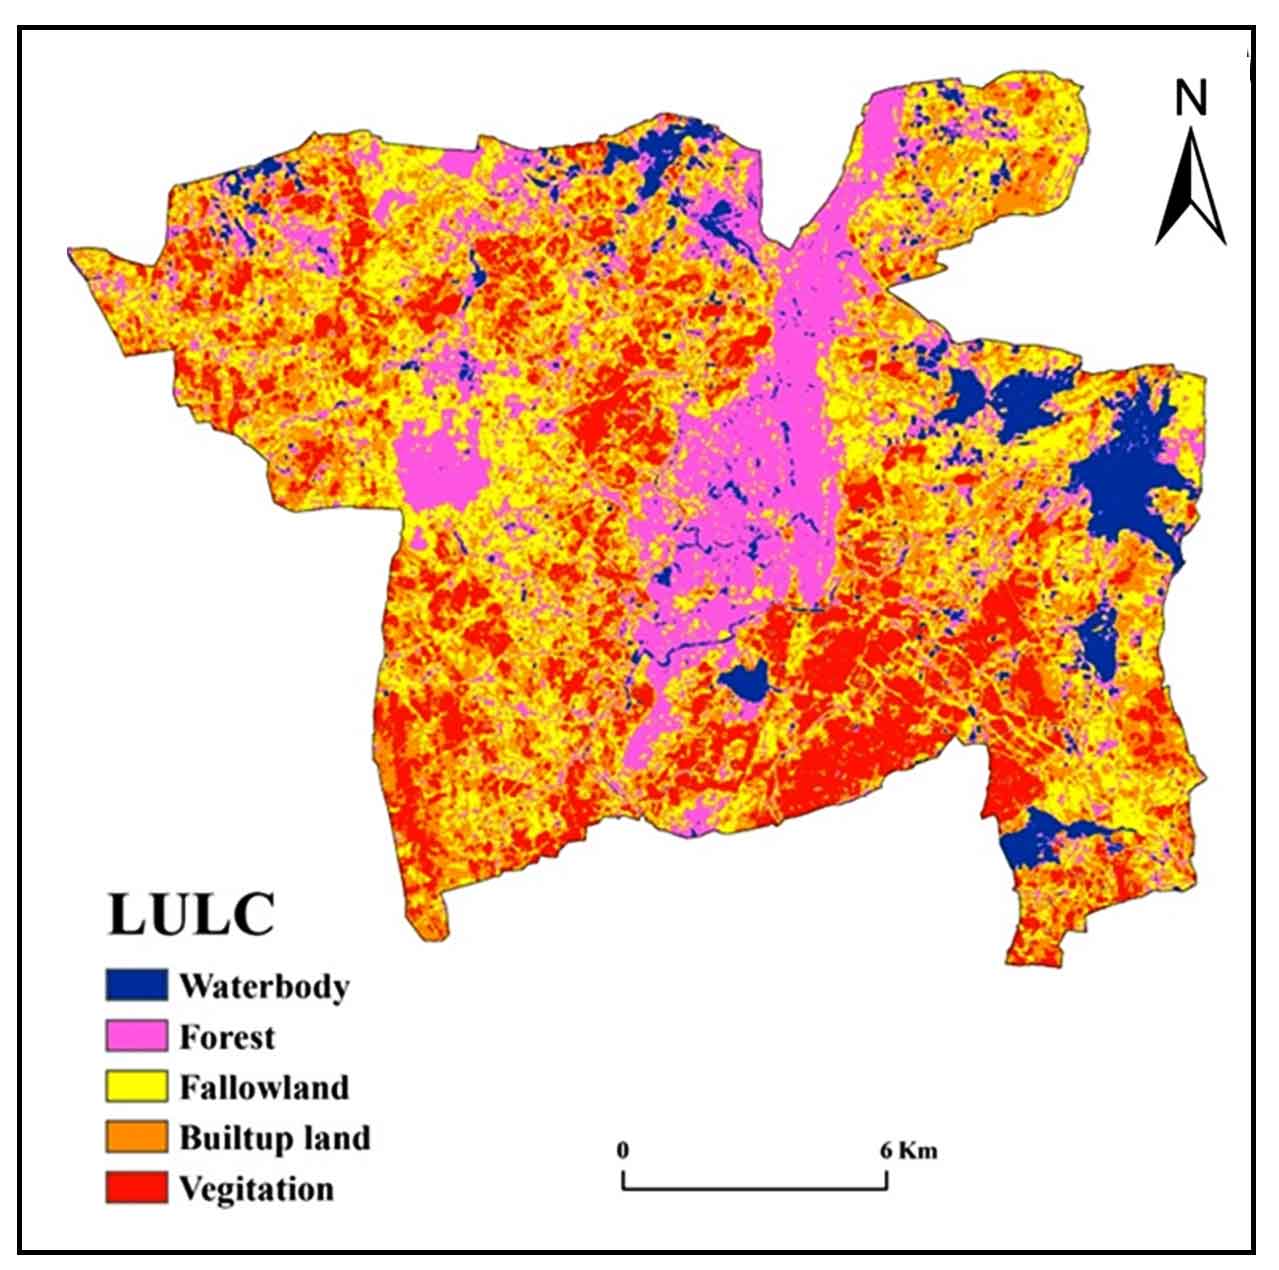
3.4.3 Land Use Land Cover (LULC)
LULC elements are involved in the planning and development of land and water resources. The LULC classification is evaluated using a supervised classification approach combined with a maximum likelihood algorithm that is implemented in the ERDAS Imagine program. Supervised classification techniques used to remote sensing data. This technique presupposes that a pixel belongs to a particular class. The fundamental theory presupposes that these possibilities are identical for all classes and that the input bands follow a normal distribution. The different land cover modifications happened more quickly and with more precision when geospatial technologies were used (Rajasekhar et al., 2018). Five major groups in the region comprising water bodies, forest land, fallow land, built-up land, and vegetation were defined in the LULC study (Figure 5). LULC has a significant impact on groundwater recharging. Built-up land decreases water infiltration, while healthy vegetation and water bodies improve the water infiltration into aquifers. LULC is expected to play an important part in groundwater recharge in this manner (Shailaja et al., 2019; Kumar et al., 2019; Rajasekhar et al., 2019).
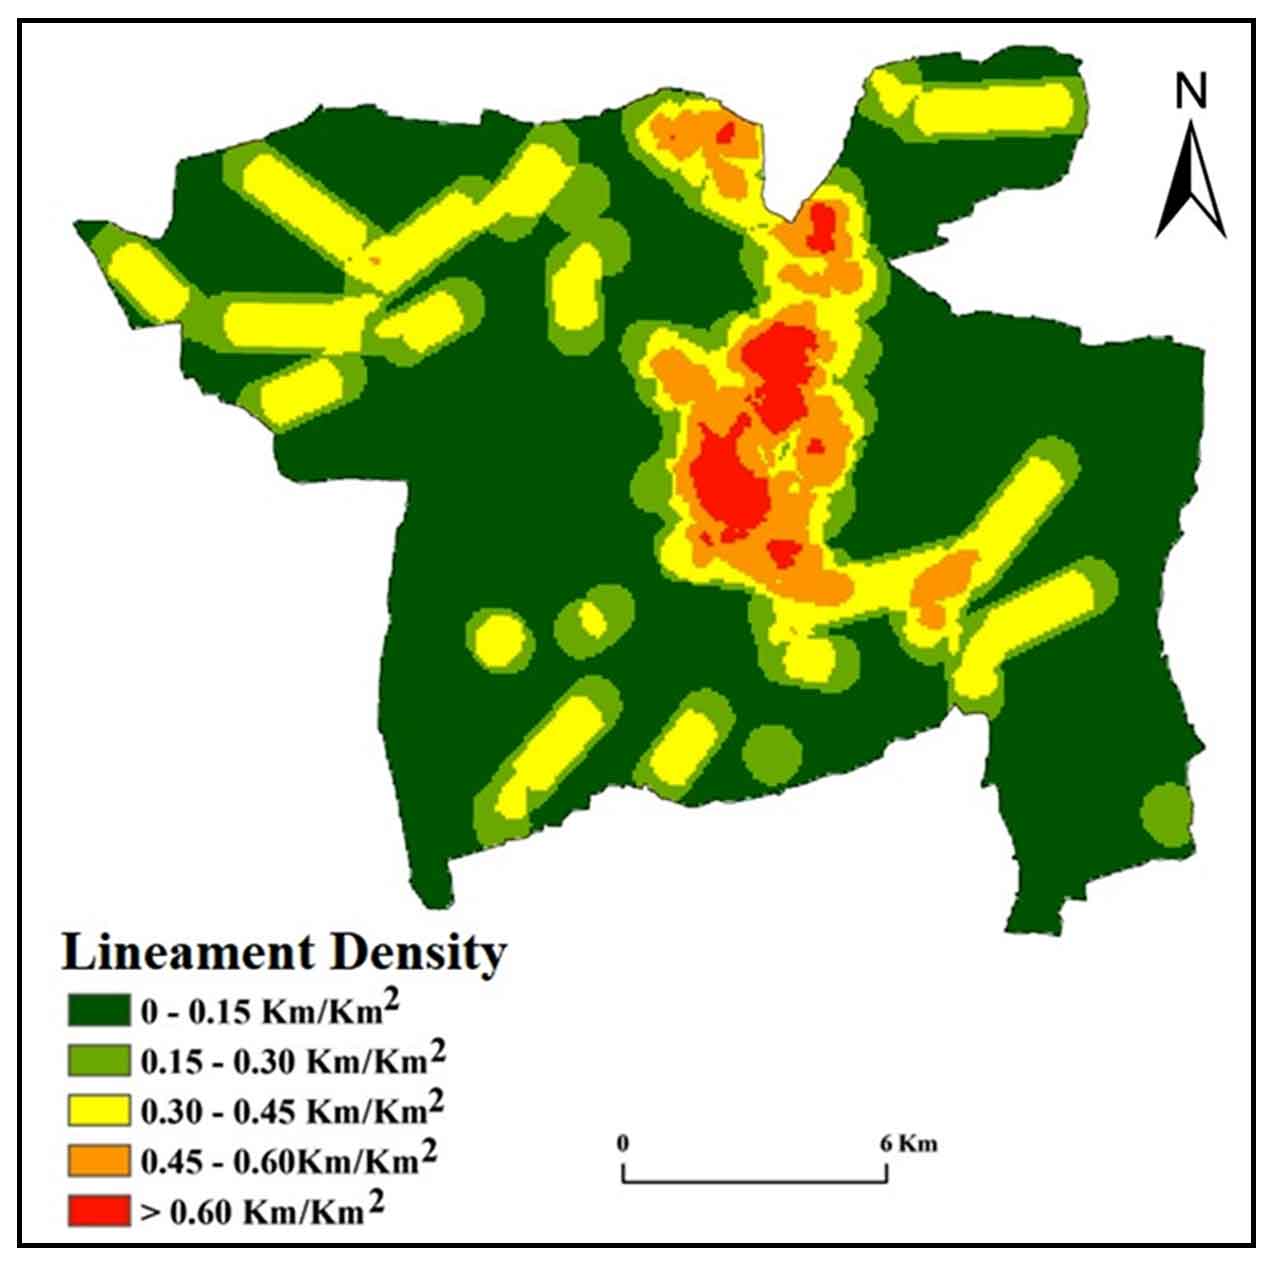
3.4.4 Lineament Density (LD):
The existence of lineaments generally indicates a porous zone, LD of the region immediately reveals its GWPZs. Lineaments are faults, joints, and fractures that direct percolated water and serve as an indirect indicator of the presence of a field. Lineaments are structurally defined linear structures with generally straight alignments that can be detected in satellite images (Zolekar et al., 2015; Rajasekhar et al., 2018; Pinto et al., 2017). The maximum density rating indicates both the maximum GW recharge capacity and the maximum GW recharge capacity (Figure 6). LD is classified from 0 - > 0.60 km/km2. LD is used to classify regions with increased line accumulation that may be related with a region of high permeability and potential groundwater zones.
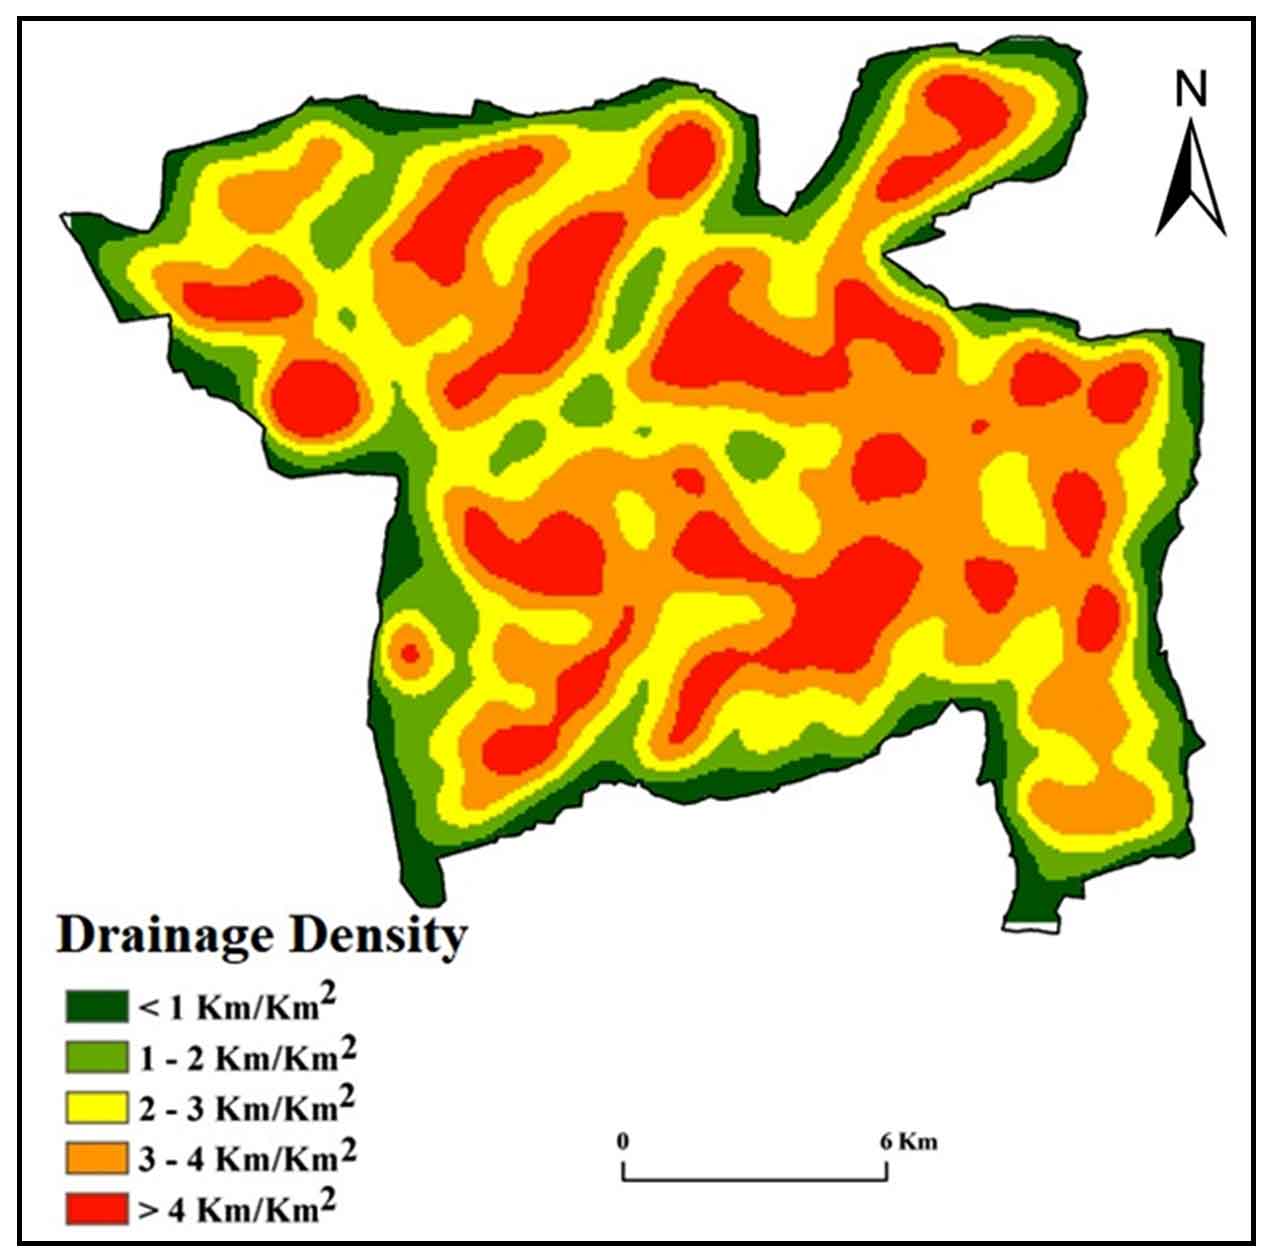
3.4.5 Drainage Density (DD)
According to Horton, DD is the ratio of the total length of the river channel to the entire length of the sample area under consideration at the time of the study (1932). DD associated elements include geology, erosion, drainage, ponds, forest cover, and the atmosphere. Thus, while estimating a particular area’s groundwater capacity, DD is a critical factor to consider (Naghibi et al., 2018; Al-Djazouli et al., 2019). Differential weathering of various formations has resulted in an increase in the closeness of channel spacing within the sample region, which is defined by the drainage growth (DD) factor. DD is classified from 0 - >4 km/km2 (Figure 7). A high DD number implies a greater likelihood of GW percolation, whereas a low DD value indicates a lesser likelihood of GW percolation.
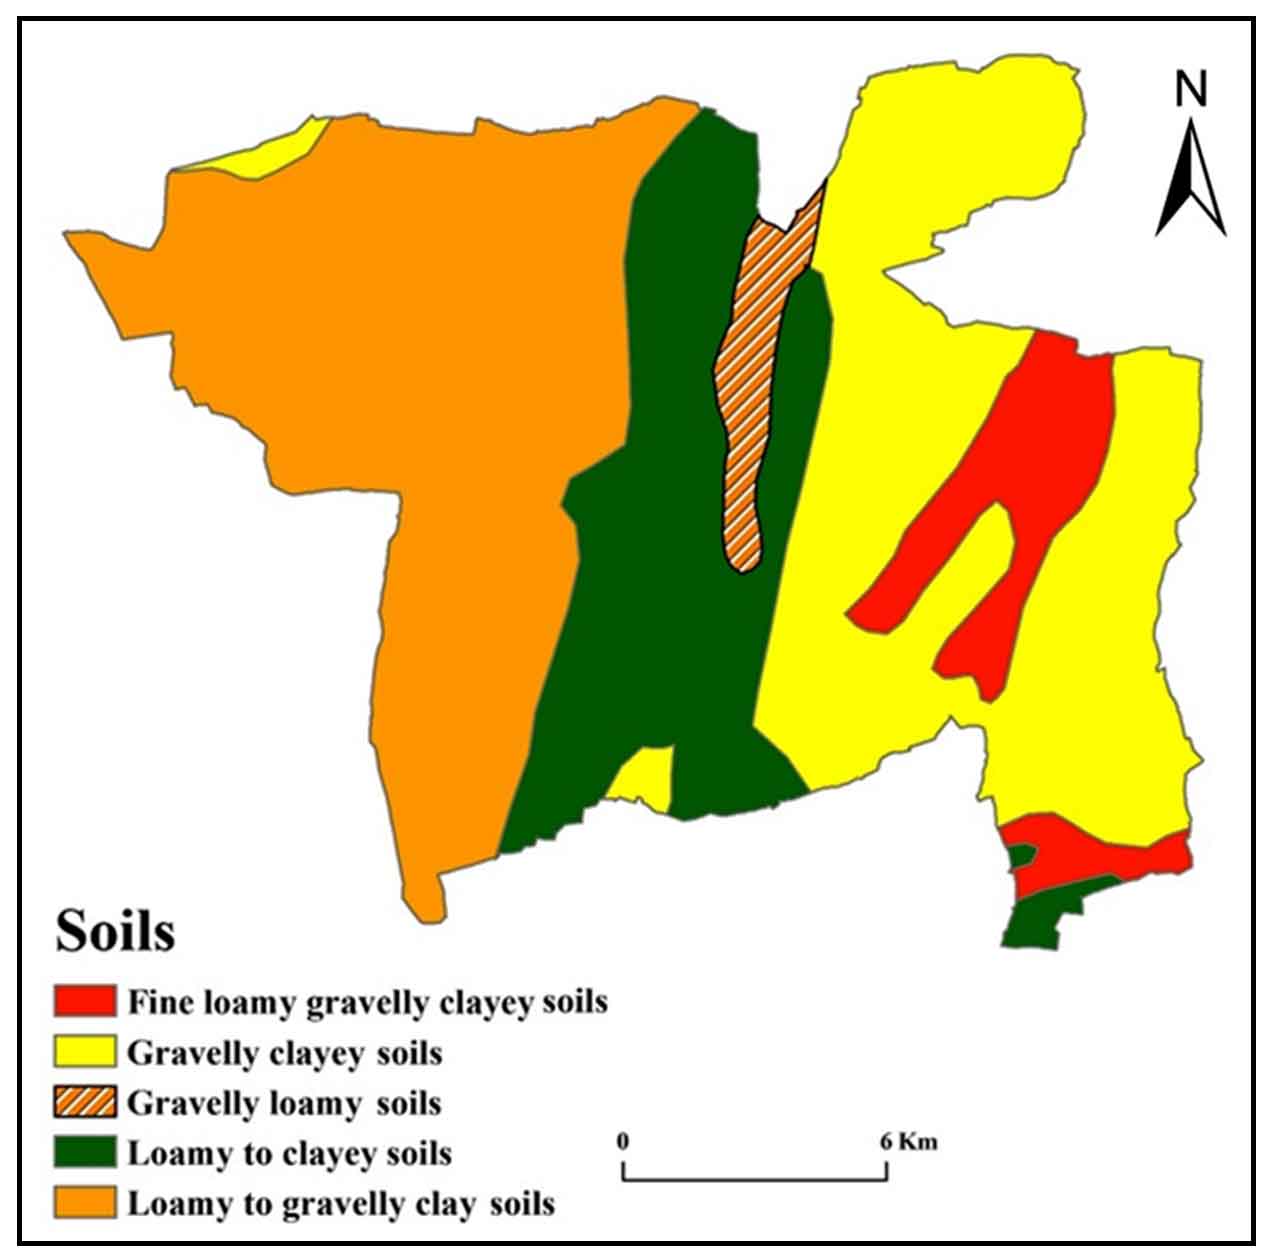
3.4.6 Soils
The district groundwater administration helped in the preparation of the soil map (Figure 8). In the western part of the research zone, loamy to gravelly clay and gravelly clayey relatively deep desert soils cover the remainder of the study area. The major part of the study area covered by the gravelly loamy soils. Ranks for soils have been consigned on the source of their infiltration rate. Loamy calcareous soil has high infiltration rate, consequently given higher significance, while the clayey soil has least infiltration rate thus allotted low significance. In the sample area, fine loamy gravelly clayey soils are present (least infiltration rate) (Al-Djazouli et al., 2019; Kadam et al., 2019).
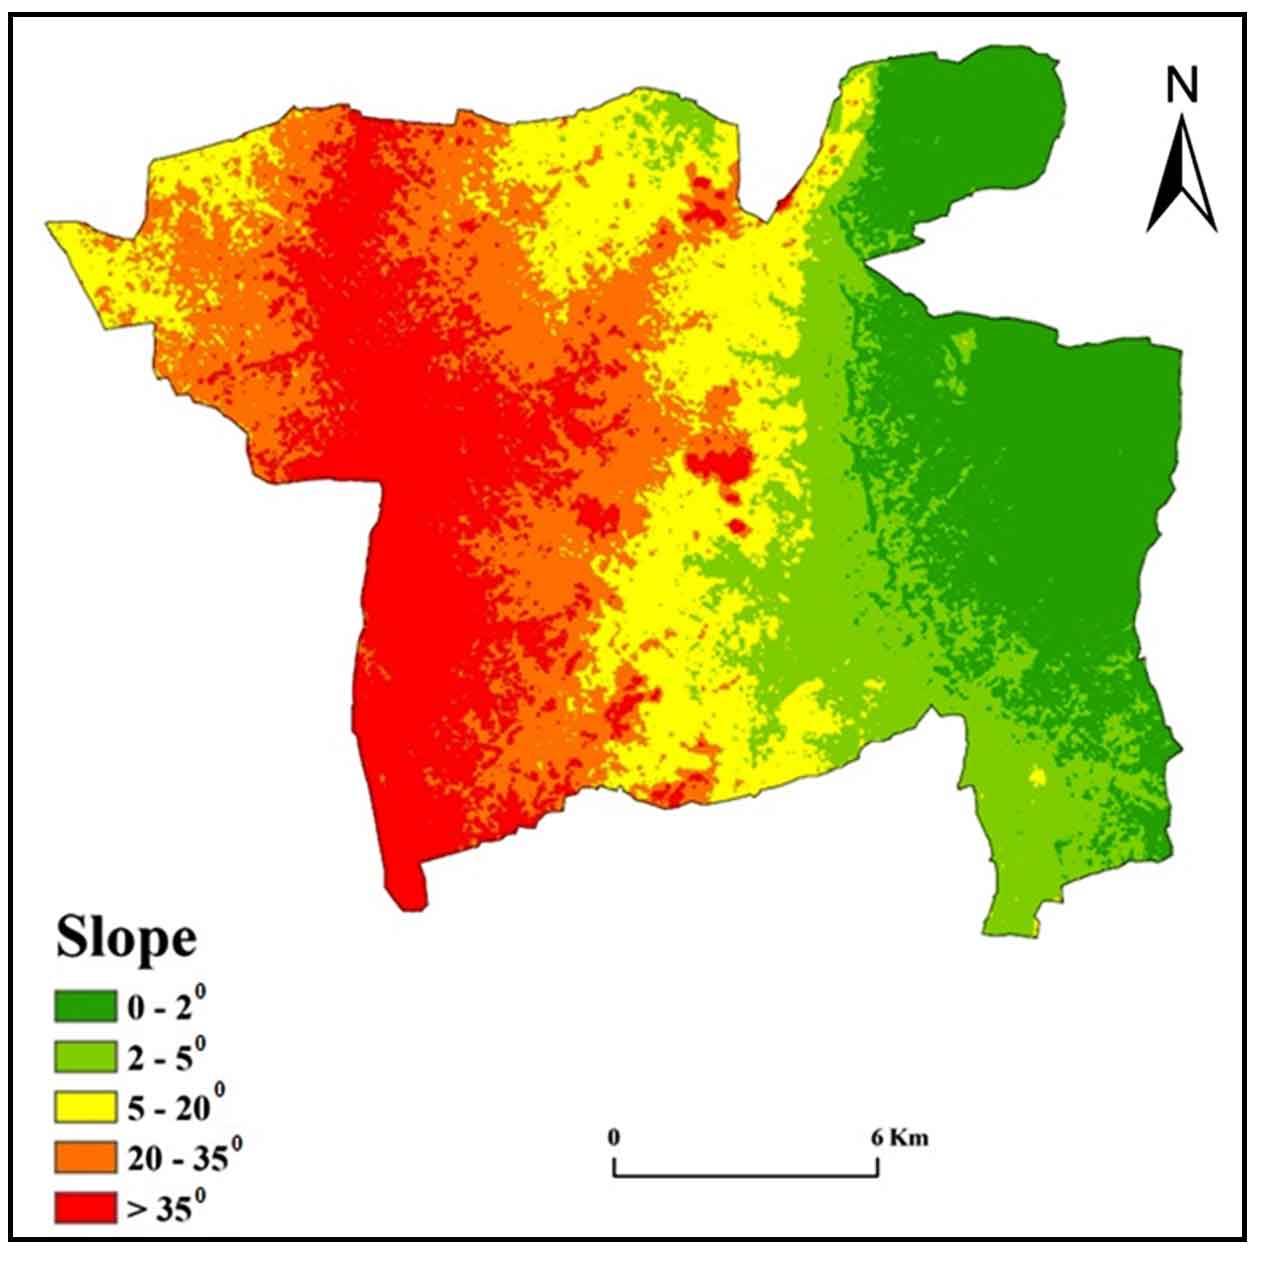
3.4.7 Slope
The slope of the research area is primarily between 0 and 35 degrees (Figure 9). Classes with less degree of slope are given a better ranking because the terrain is nearly level, whereas classes with a maximum degree of slope are given a lower ranking since the run-off and infiltration are both relatively high in these classes.
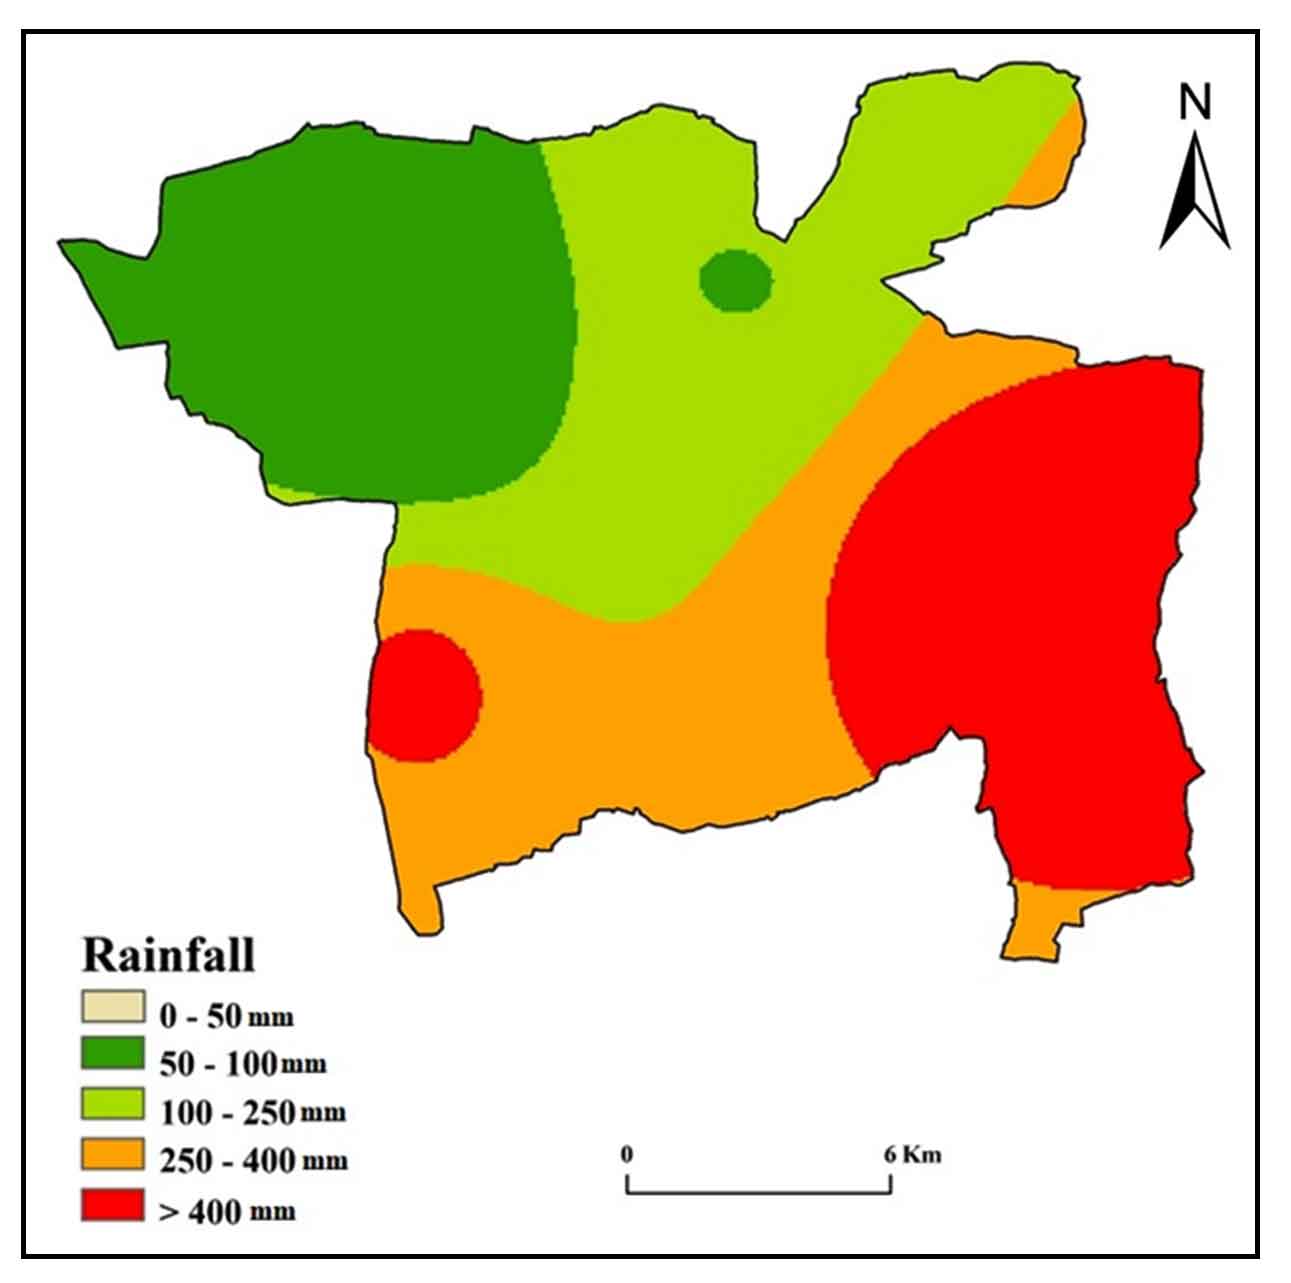
3.4.8 Rainfall
Rainfall has a critical role in hydrology and is the primary source of regeneration. It establishes the quantity of water that can permeate an area. We utilized this parameter in the mapping of groundwater potential due to its value. The area receives an average yearly rainfall of around 320 mm. Historically, annual rainfall has been classified as pre- and post-monsoon. The northwest monsoon provides a lot of precipitation to the study region (Figure 10). Upstream, precipitation dispersion along the southwestern region’s gradient increases the probability of a GWPZ forming in the northern portion due to increased infiltration (Kadam et al., 2017; Rajasekhar et al., 2019; Kumar et al., 2020).
4 . GROUNDWATER POTENTIAL ZONES (GWPZ)
Numerous characteristics, including geology, geomorphology, LD, DD, slope, soils, LULC, and rainfall must be thoroughly analyzed before a particular approach for groundwater evaluation of any region can be applied. Many thematic layers were produced to define GWPZs throughout the research region, utilizing RS information, topographic maps, and land maps, all of which were related to the collateral maps and field data. The specifics, including groundwater potential, of the thematic maps generated using satellite and field data.
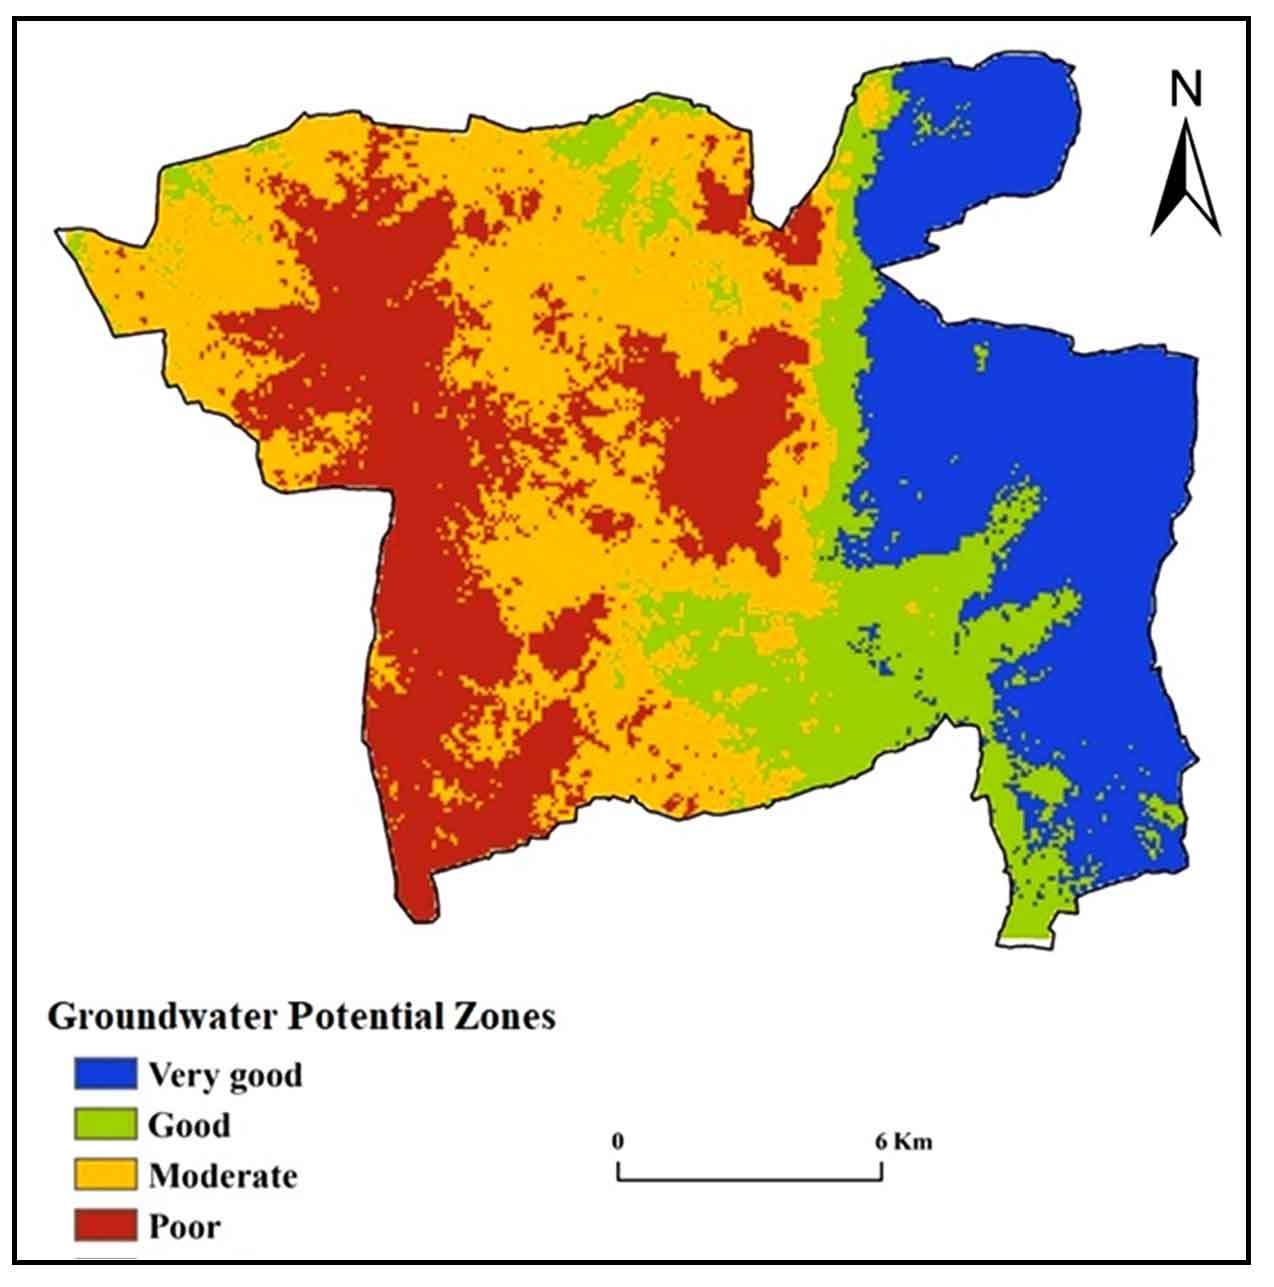
The GWPZ layer was prepared with the internal components of eight thematic layers were assigned based on observations for the creation of the groundwater potential map. To create the GWPZ map for the study area, all thematic layers overlaid to perform overlay analysis in ArcGIS 10.3 was utilized to reclassify the thematic maps. The GWPZ map was created by adding all the weighting factor of each thematic layer in a weighted index overly analysis. The high weighted importance region score was considered a prospective area for groundwater. Consequently, according to the rating system of equivalent intervals, the GWPZs map (Figure 11) was graded into four classifications of groundwater they are very good, good, moderate, and poor.
4.1 Very good
The region indicated that 77.37 km2 (24.93%) had very good GWPZs. This area is in the northeastern and southeastern portions of the present study (Figure 11). Slight to moderate slopes, deep loam soils that hold more water and maintain a higher soil moisture level. Very excellent GWPZs are typically confined to areas with heavy rainfall, which have a great potential for infiltration.
4.2 Good
In contrast, the groundwater potential in the central, southern, and northern-western sectors of the study region, which encompasses an area of about 79.31 km2 (25.56%), is good (Figure 11). Steep slopes, shallow loam soil, water retention capacity, soil wetness, and erosion resistance define these regions. These regions having moderate rainfall, low drainage density and gentle slope regions turn to good GWPZs.
4.3 Moderate
The northeastern and southeastern parts and some medium spots in the central and western parts of the present study plunge in moderate GWPZs, which comprises an area of 53.07 km2 (17.10%) (Table 2). Shallow soils with steep slopes, reduced water retention capacity, lower soil moisture and nutrients, and greater erosion rates than other types of fields are all characteristics of this class. When it comes to agricultural activities, moderately steep slopes are usually neglected. The moderate GWPZs appear mostly in the valleys and areas of high DD.
Table 2. Groundwater Potential Zones
|
Groundwater Potential Zones
|
Area
|
|
Km2
|
%
|
|
Very Good
|
77.37
|
24.93
|
|
Good
|
100.60
|
32.42
|
|
Moderate
|
53.07
|
17.10
|
|
Poor
|
79.31
|
25.56
|
4.4 Poor
The poor GWPZs cover an area of 79.31 km2 (25.56%), and are found on moderate and steep slopes, with deep to very deep-water levels and weathered zone thicknesses ranging from shallow to very shallow. Deep to very deep-water levels are found with weathered zone thicknesses ranging from shallow to very shallow. The zone with very limited groundwater potential, on the other hand, is located mostly in mountainous parts and densely populated areas across the research area.


 ,
Raghu Babu K 2
,
Raghu Babu K 2