Abstract
The present study is focused on analysis of rainfall in the Oued El-Abid watershed, which is characterized by an important potential in water supply of the Bin El Ouidane dam and the recharging groundwater of the plains downstream. The aim of the present research is to characterize the meteorological drought in the Oued El-Abid watershed, located in the Beni Mellal-Khenifra region (Central High Atlas, Morocco). The study focused on the analysis of the meteorological drought detection indices such as the deviation from the mean (DM), the rainfall index (RI) and the standardized precipitation index (SPI) based on annual precipitation for the three stations (Tilouguit, Ait Ouchen and Tizi N'Isli) generally experienced alternating periods of surplus and deficit. The results of these indices allowed us to determine the most remarkable and common drought years are: 1981, 1983, 1990, 1998, 2001, 2005, 2017 and 2019. This study is helpful for water resource managers to make decisions and develop tools for adaptation and mitigation of climate change impacts.
1 . INTRODUCTION
In recent years, the problems related to climate change have become major themes to deal with Morocco suffers significant rainfall deficits, resulting in severe drought (Sebbar et al., 2011). Drought is a transient climatological anomaly that affects the region socially, economically, and ecologically in which water availability is lower than that of a usual geographic area (Romanowicz et al., 2016; Van Lanen et al., 2017; Melese et al., 2018). In other words, a drought is a disaster associated with a long-term lack of rainfall resulting in a temporary loss or shortage of water (Vogt and Somma, 2000; Wilhite et al., 1985; IPCC, 2014). Furthermore, the available water resources are not sufficient to meet the average demand in the long term. Drought is a very complex phenomenon to define (OMM, 2012). Usually, it is characterized by a temporary water shortage over a time (Pereira et al., 2002). There are four different groups of droughts (meteorological, agriculture, hydrology and socio-economic) (Svoboda et al., 2002; Mishra and Singh, 2010; Spinoni et al., 2014). Drought assessments include estimates of their properties (intensity, duration, spatial extent, etc.). It is therefore an important factor in the design of hydroelectric projects and in the management and planning of water resources (Sarailidis, 2016).
Periods of drought are very common in all countries of the world, especially countries in arid and semi-arid regions. Morocco has experienced the longest dry spell in its contemporary history (DMN, 1995). In recent decades, the Oued Oum Er-Rabia watershed has experienced significant rainfall deficits resulting in very intense droughts (Jouilil, 2013). These droughts can be quantified and characterized using several indices of which the best known are presented in table 1.
The main objective of the study is to characterize the meteorological drought of three stations (Ait Ouchen, Tilouguit and Tizi N'Isli) using statistical methods (climatic indices).
2 . DATA AND METHODS
2.1 Study Area
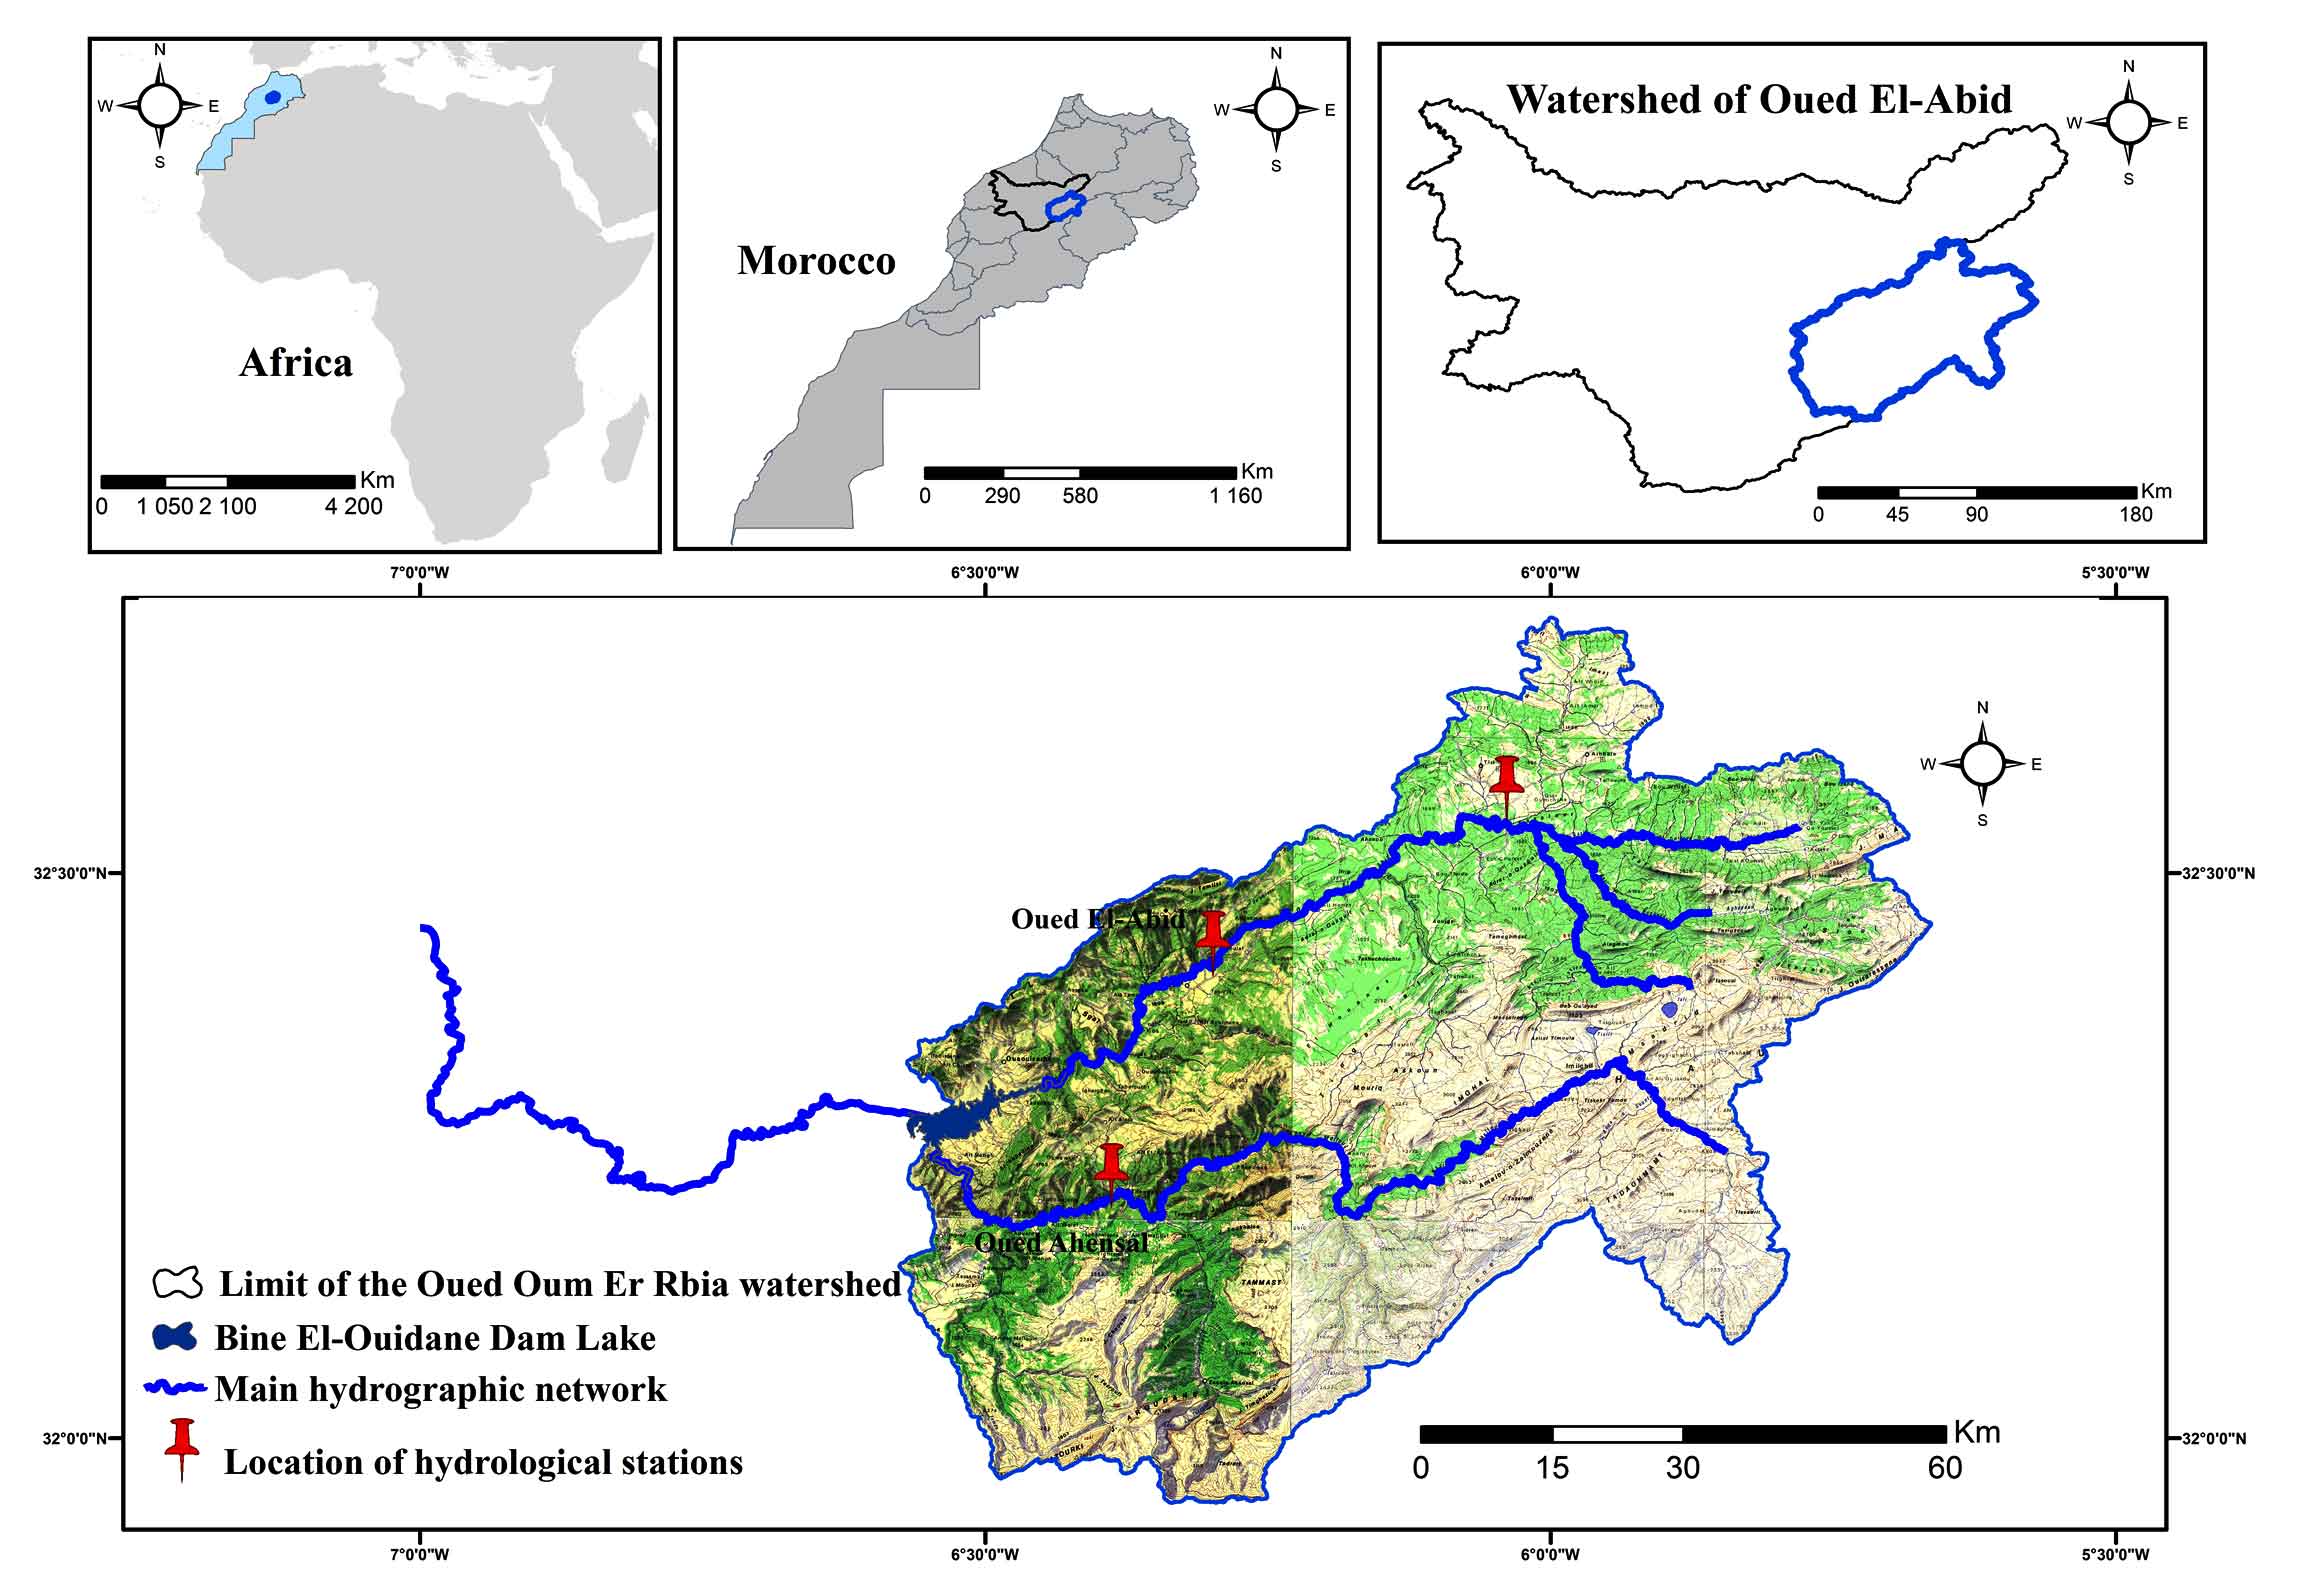
The Oued El-Abid watershed is located in the Beni Mellal-Khenifra region (Central High Calcareous Atlas, Morocco). It extends between (5° 13' 38'' and 6°38'35'' West) longitude and between (31°42'31'' and 32°37'22'' North) latitude. The surface area of the watershed is 6405 km2 at Bin-El-Ouidane lake. The climate is characterized by two contrasting seasons, 1) the hot and dry summer season with high temperatures around 41°C during July and August and the rainy and 2) colder winter season with temperatures around -6°C in January/February. The study area extends over several rural communes such as (Taguelft, Ouaouizeth, Tilouguit, Anergui, Zaouit Ahensal, Imilchil, Anefgou, Tizi Nisli, Aghbala, etc.) (Figure 1). The Oued El-Abid is originate in the jbel Masker (3277 m) and flows from East to West. The basin is elongated, extends in the heart of the High Atlas limestone, bounded on the East and South by a line of high ridges above 3000 m, the highest point of the basin is the jbel Azourki (3690 m) (Leveque, 1952). This basin is drained by two main rivers: Oued Ahensal and Oued El-Abid, the two principal sources of water that feed the dam of Bin El-Ouidane. The dam has a very important role in the irrigation of the agricultural perimeter of Beni Moussa and Tassawt Aval (Irrigation of more than 69500 ha of the plain of Tadla, perimeter of Beni Moussa, on the left bank of the wadi Oum Er Rbia), the supply of drinking water, the production of electricity (2/3 of the national production) and the recharging of aquifers of Tadla downstream (Figure 1), (Ahbari et al., 2017; Ouakhir and Elghachi, 2018). The basin upstream of the Bin El-Ouidane dam lake consists, essentially, of the Dogger and Lias terrains represented by limestone and marlstone formations, Cretaceous terrains represented by marlstone and sandstone formations (Dahani and Aounini, 2013).
2.2 Data
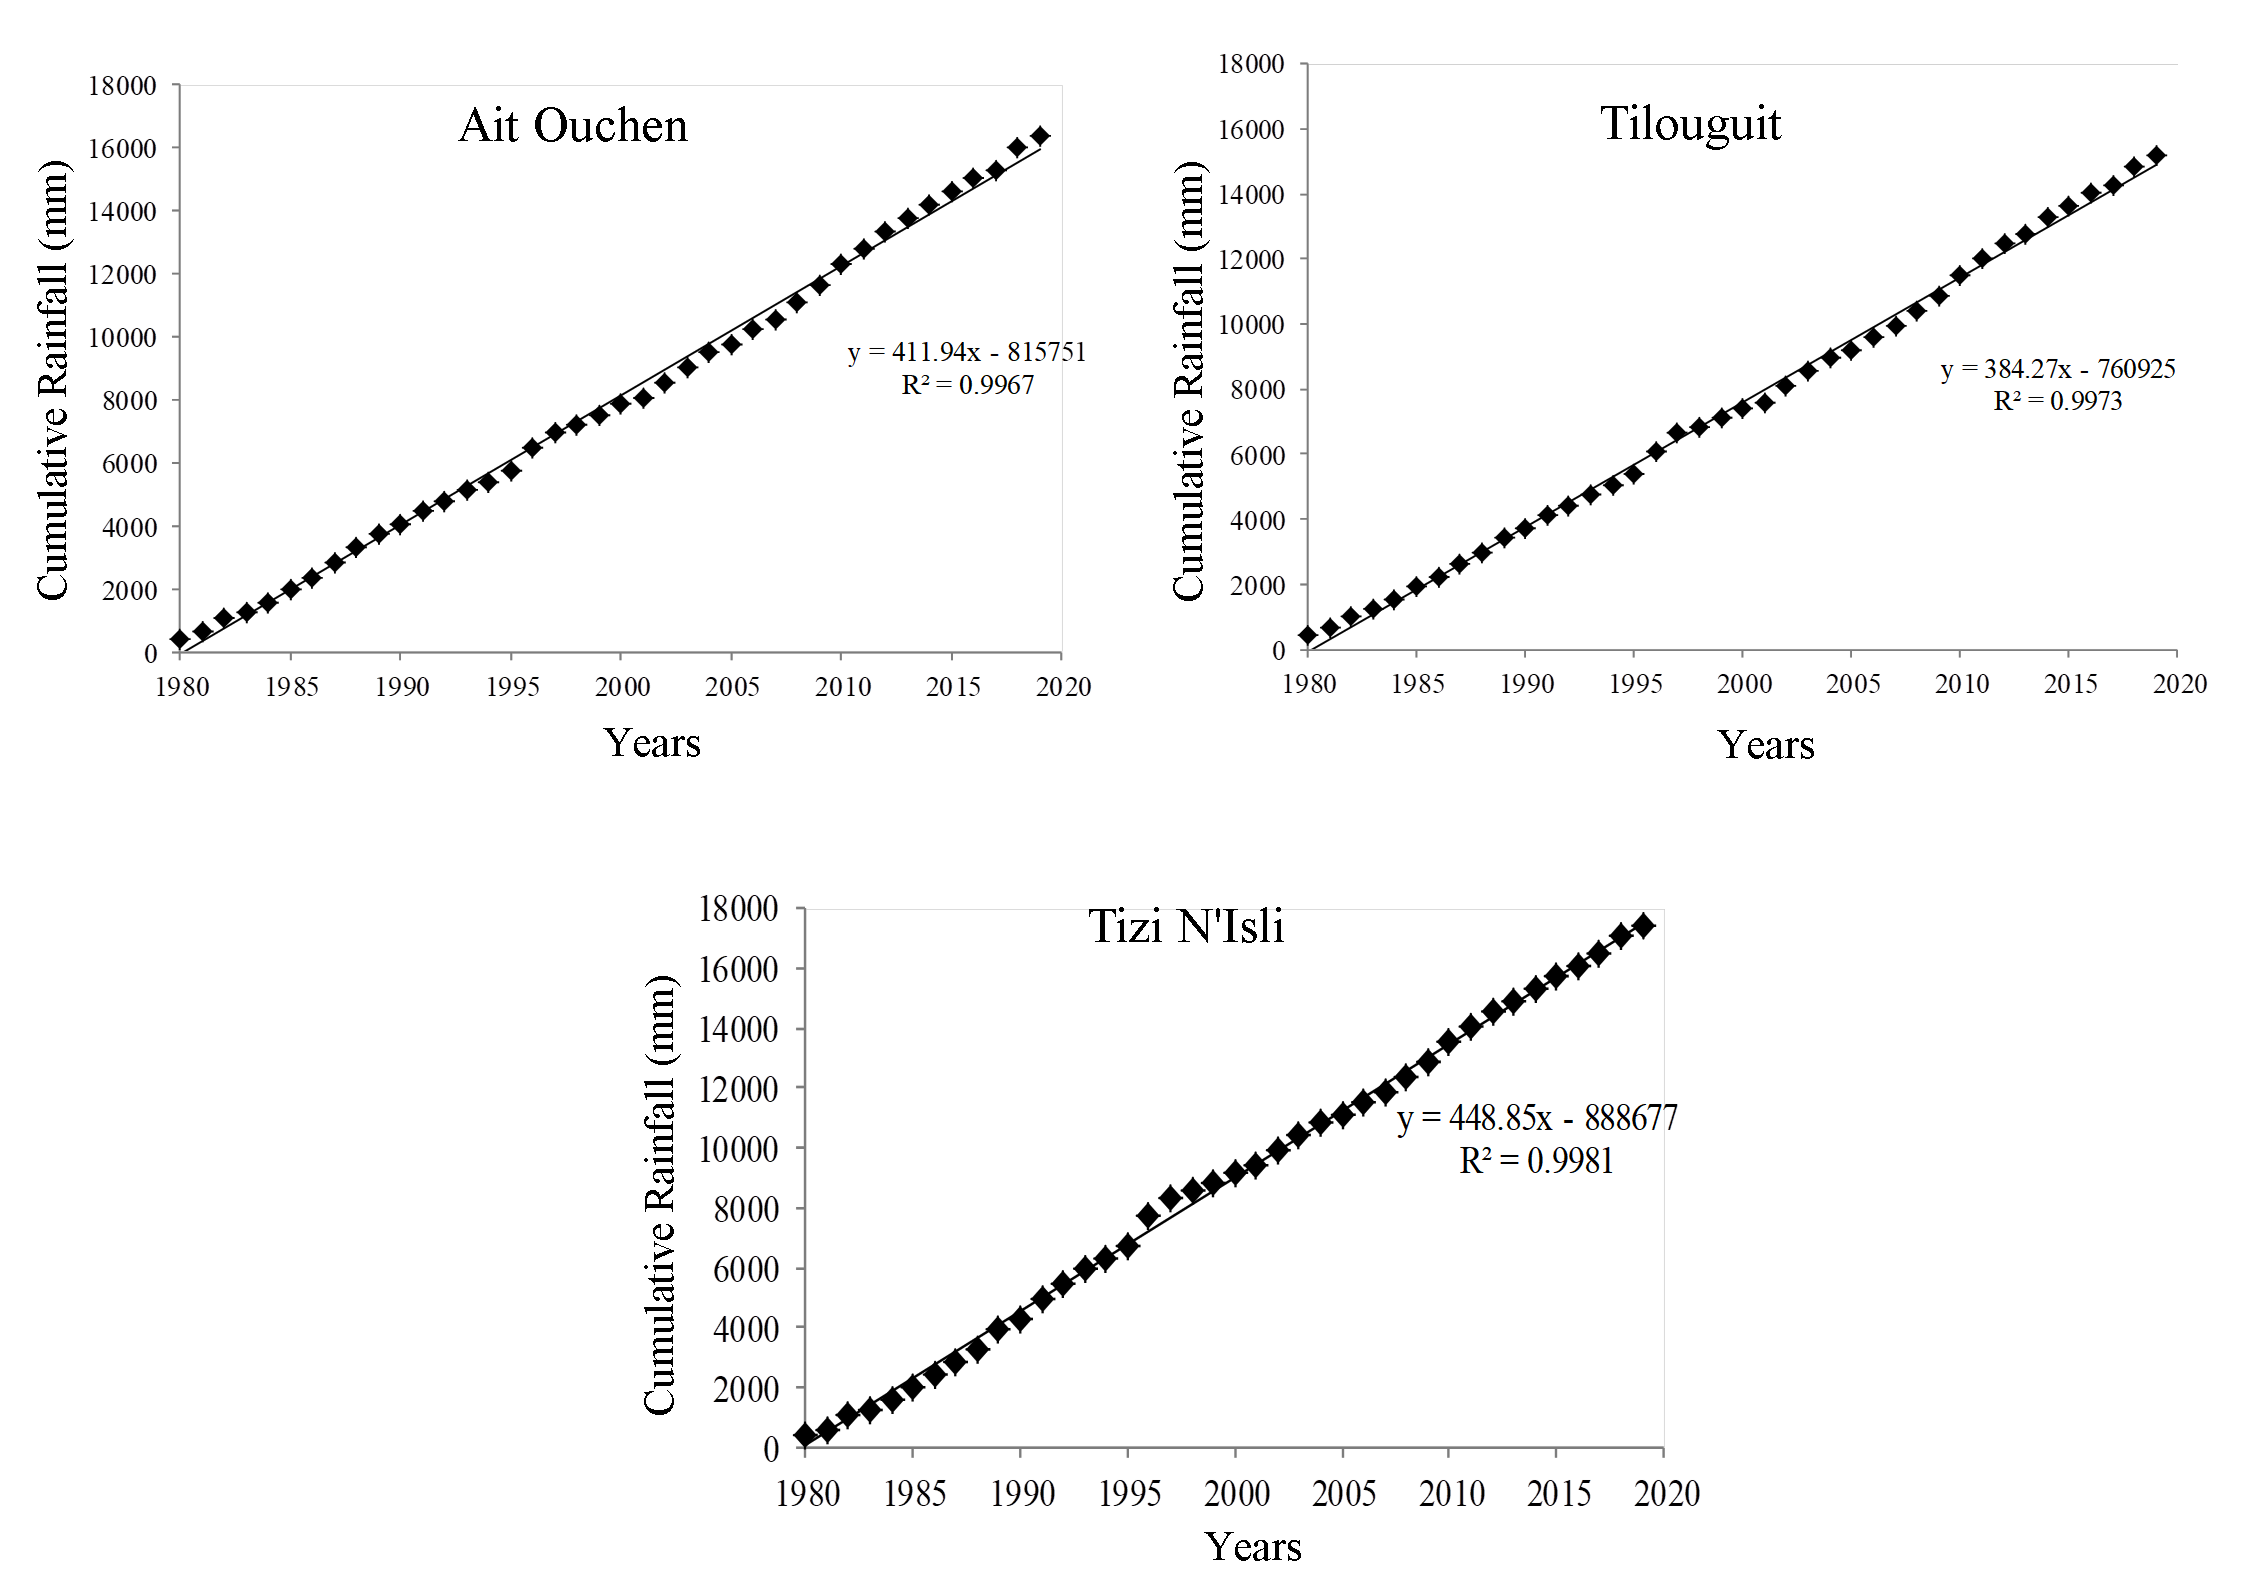
Rainfall data were collected from the Oum Er Rbia River Basin Agency (ABHOER). Tables 2, 3 and Figure 1 present the rainfall characteristics of the selected stations. The database consists of annual rainfall measurements from three rainfall gauging stations Tilouguit, Ait Ouchen and Tizi N'Isli. The choice of these stations is determined by the availability of climate data series. Collected data were used to characterize the meteorological drought in the Oued EL-Abid watershed for the period between 1980 and 2019 (Table 3). To have the quality of the data, the coefficient of determination of the correlation line R² was determined (Elghachi, 2007; Qadem, 2015). When we have an R² greater than 70%, the correlation is considered satisfactory, and an R² greater than 80% the correlation is considered good, then to check the homogeneity of rainfall data, the method of simple (Meylan et al., 2008) and double accumulations were used (Musy and Higy, 2003; Meylan et al., 2008). All stations have an R² exceeding 80% with acceptable significance (Figure 2 and Table 4).
Table1. Summary of key drought indicators and indices
Table 2. Rainfall characteristics
|
Stations
|
Lambert coordinates
|
|
Chronicle
|
|
|
X
|
Y
|
Z
|
|
|
Tilouguit
|
422 670
|
158 500
|
1100
|
1980-2019
|
|
Ait Ouchen
|
434 147
|
185 125
|
939
|
1976-2019
|
|
Tizi N’Isli
|
432 300
|
139 600
|
1350
|
1976-2019
|
Table 3. Chronogram of rainfall data

Table 4. Double accumulation test for rainfall stations (1980-2019)
|
Rain-gauge stations (x)
|
The correlated stations (y)
|
R2
|
|
Tilouguit
|
Tizi N'Isly
|
99.65
|
|
Tizi N'Isly
|
Ait Ouchen
|
99.56
|
|
Ait Ouchen
|
Tizi N'Isly
|
99.56
|
2.3 Calculation of Climate Index
The calculation of drought monitoring indicators from meteorological data is based on the calculation of statistical climate indices: Deviation from the mean (DM), Rainfall Index (RI) and Standardized Precipitation Index (SPI):
2.3.1 Deviation from the Mean (DM)
This is widely used index for estimating the rainfall deficit on a yearly basis. It is defined as the difference between the annual precipitation height (Ph) and the average annual precipitation height (Pa) (Equation 1) (Yacoubi and Hanchane, 1997; Elbouqdaoui, et al., 2006; Daki et al., 2015).
\(DM=(Ph-Pa) \) (1)
The year is wet when the DM is positive, in contrast to the DM is dry, i.e. a deficit (dry) year when the rainfall is below average and a surplus (wet) year when the average is exceeded. This index has been used by agro-meteorologists to visualize and determine the number of deficit years and their succession.
2.3.2 Rainfall Index (RI)
The rainfall index (RI) is the ratio (Equation 2) of the annual precipitation height (Ph) to the average rainfall (Pa).
\(RI = {Ph \over Pa}\) (2)
A year is classified as dry if the RI is less than 1 (Rognon, 1997).
2.3.3 Standardized Precipitation Index (SPI)
The standardized precipitation index (SPI) is a very simple index created by McKee et al. (1993; 1995) to characterize precipitation deficits for a given period (Stour, 2009). This formula (Equation 3) has been implemented in many hydro-climatic research conducted for some regions of the world (Bergaoui et al., 2001; Wu et al., 2006; Khan et al., 2008; Naresh et al., 2009; Ghenim et al., 2011; Jouilil et al., 2013; Soro et al., 2014; Boudad et al., 2015; Nouaceur et al., 2015; Svoboda and Fuchs, 2016, Parvaze et al., 2018; Cheikh et al., 2019; Hadria et al., 2019; El Orfi et al., 2020).
\(SPI = {(Pi-Pa) \over S}\) (3)
where, Pi is precipitation of year i (mm); Pa is average precipitation (mm) and S is standard deviation.
The National Drought Mitigation Center (NDMC) in the United States has been classified as drought based the precipitation deficiency (Łabędzi, 2004). The ranges of SPI values for identifying precipitation anomalies are given in table 5.
Table 5: Classification of drought sequences according to SPI
|
SPI classes
|
Characteristics
|
|
> 2.0
|
Extremely wet
|
|
1.5 to 1.99
|
Very wet
|
|
1.0 to 1.49
|
Moderately wet
|
|
-0.99 to 0.99
|
Normal
|
|
-1 to -1.49
|
Moderately dry
|
|
-1.5 to -1.99
|
Very dry
|
|
-2.0 <
|
Extremely dry
|
3 . RESULTS AND DISCUSSION
To identify and characterize the meteorological drought in the Oued El-Abid watershed, three indices (DM, RI and SPI) were calculated.
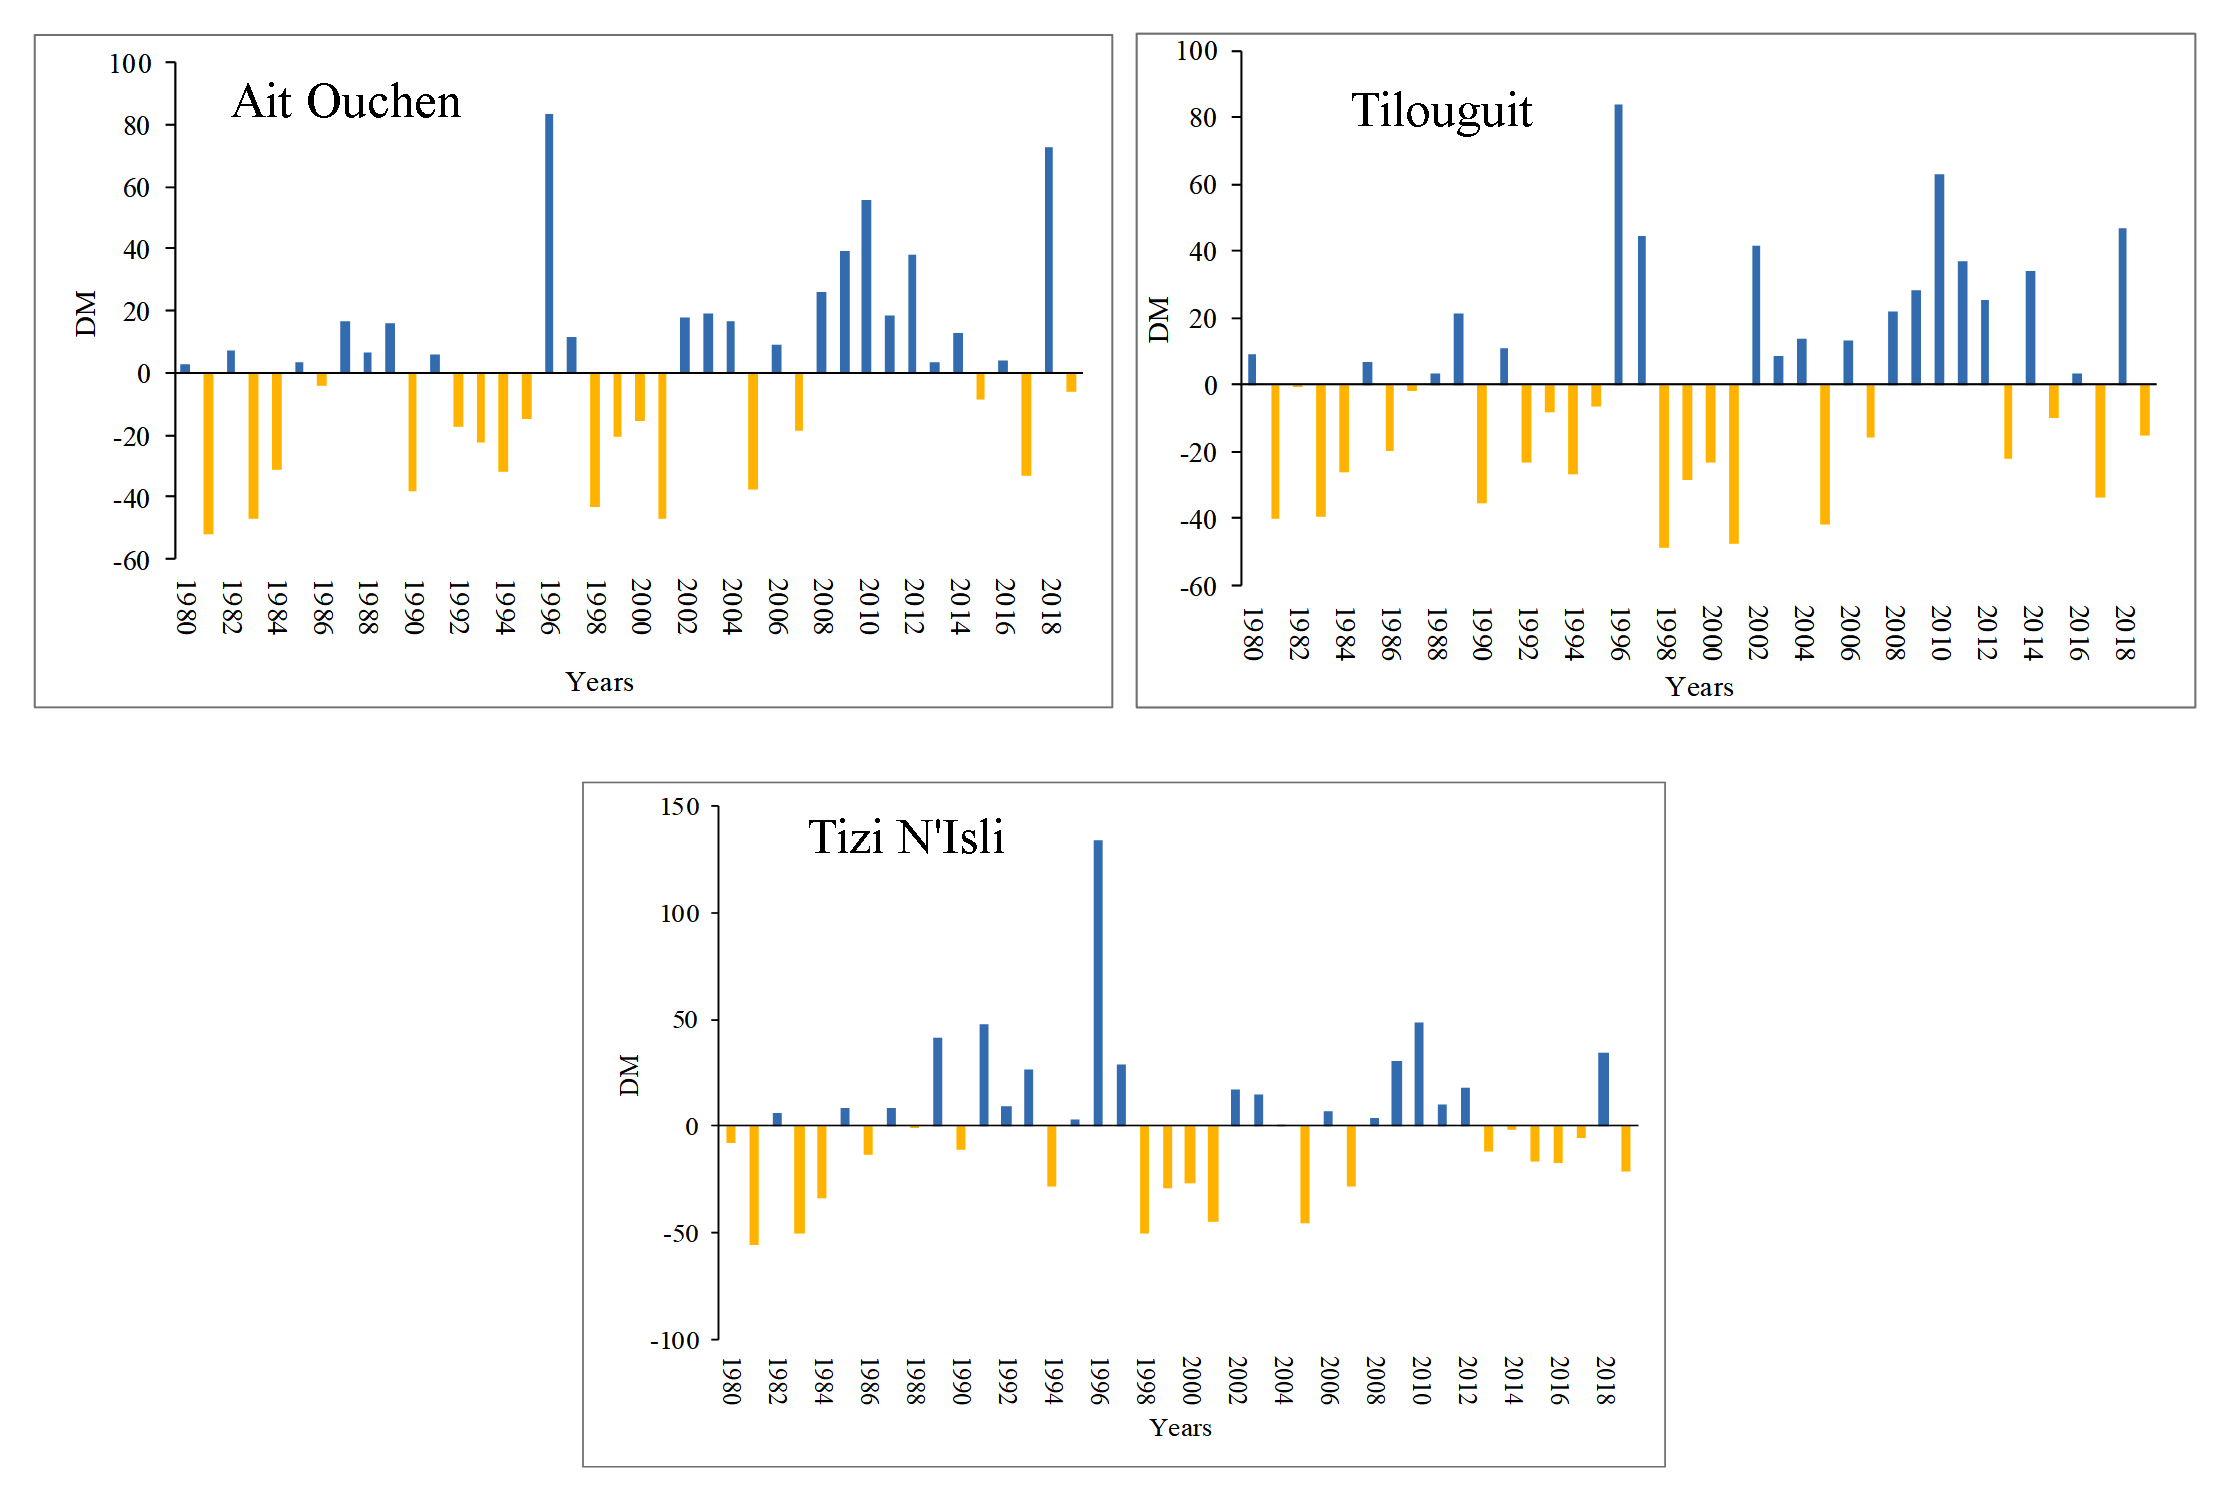
3.1 Deviation from the Mean (DM)
From the graphical representation of the deviation from the annual average, we notice that the Oued El-Abid watershed shows fluctuations in wet and dry periods (Figure 3).
The results show the succession between deficit and surplus years. The longest period of drought which affect the majority of the Oued El-Abid watershed from 1980-81 to 2000-2001, with some intercalations of wet phases of durations ranging from 1 to 4 years.
The rainfall series of the three stations in study area is given in table 6.
Table 6. Dry and wet period characteristics (1980-2019)
|
Stations
|
Ait Ouchen
|
Tilouguit
|
Tizi N'Isli
|
Average
|
|
Number of dry sequences
|
11
|
11
|
11
|
11
|
|
Duration (years)
|
18
|
21
|
20
|
19
|
|
Cumulative deficit (mm)
|
5806.5
|
6006.4
|
6532.2
|
6115.03
|
|
Average intensity (mm)
|
293.96
|
286.02
|
326.61
|
302.2
|
|
Frequency of dry years in %.
|
45
|
52.5
|
50
|
49,17
|
|
Number of wet sequences
|
11
|
11
|
10
|
10,67
|
|
Duration (years)
|
22
|
19
|
20
|
20
|
|
Cumulative surplus (mm)
|
10589.6
|
9160.2
|
10892.3
|
10214.03
|
|
Average intensity (mm)
|
501.05
|
485.89
|
544.6
|
510.51
|
|
Frequency of wet years (%)
|
55
|
47,5
|
50
|
50,83
|
- The calculation of the deviation from the average at the basin level (Table 6) showed the major rainfall trends that are characterized by periods with a dry trend and periods with a wet trend. Then the most surplus (wet) years common correspond to the years 1996 and 2010 and the most deficient (dry) years compared to the average which are 1981, 1983, 1984,1986, 1990,1994, 1998,1999, 2000, 2001,2005, 2007, 2015, 2017 and 2019.
- The average intensity of precipitation at scale of the basin shows an average deficit of the series studied of 302.20 mm for the dry period and an average surplus of 510.51 mm for the wet period.
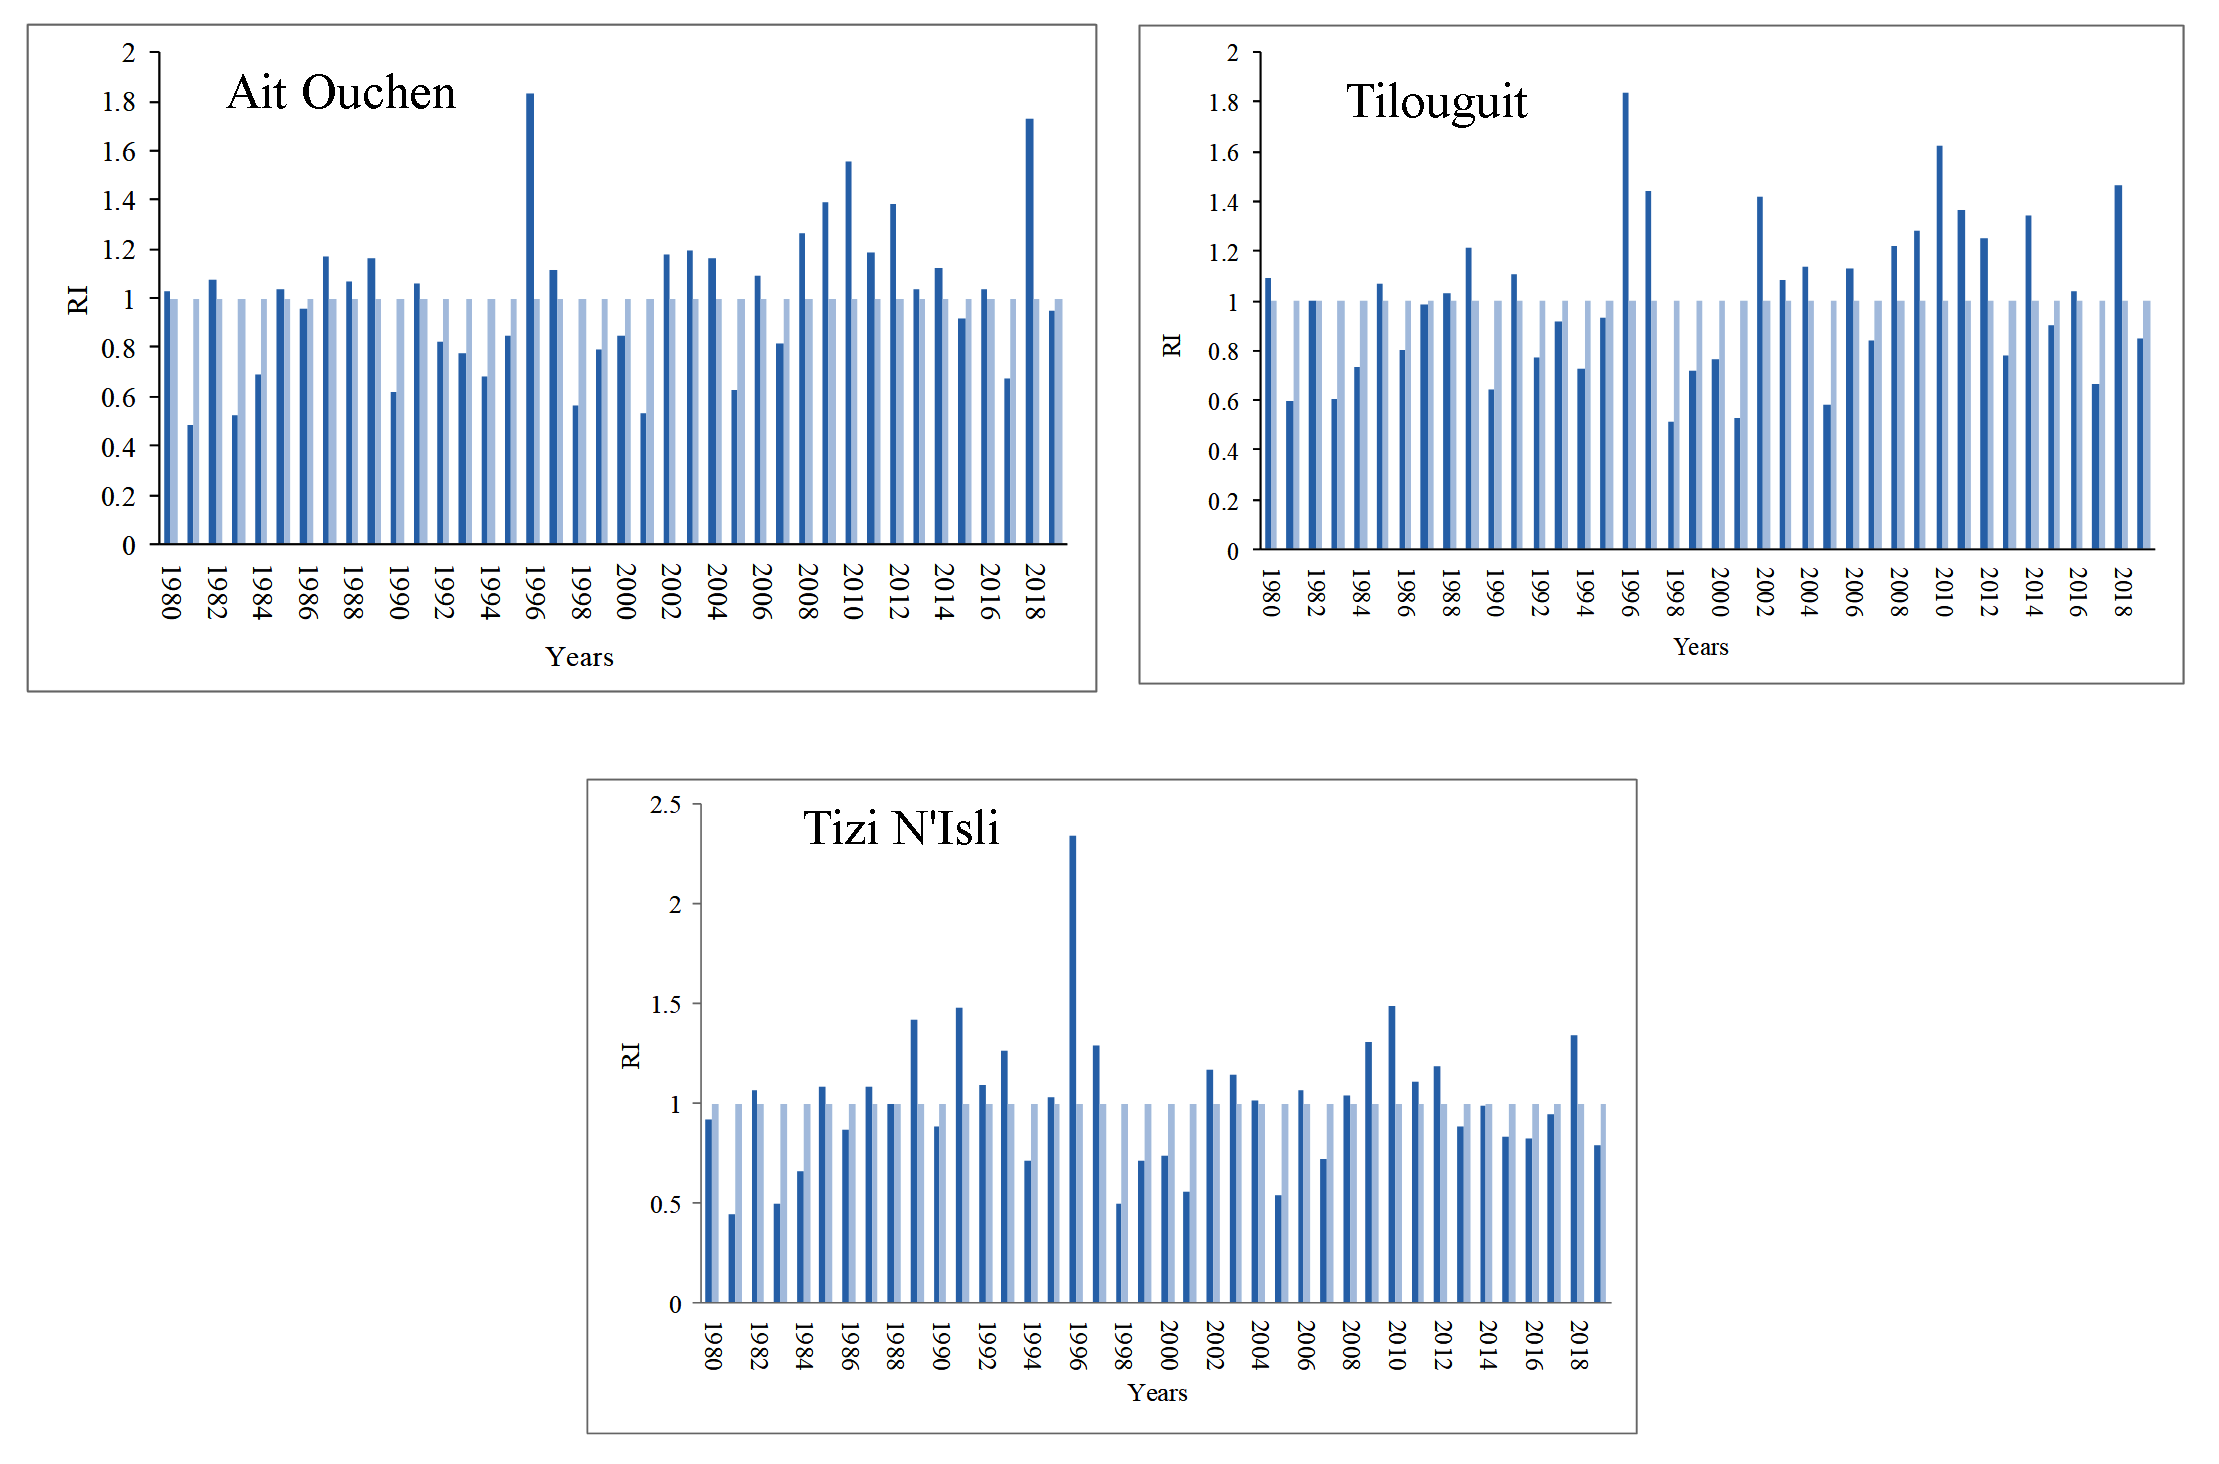
3.2 Rainfall Index (RI)
In order to analyze the precipitation in the watershed, calculating of RI index three studied stations were carried out. The results similar to those obtained by the index of deviation from the mean (DM) are shown (Figure 4).
Table 7 shows a succession of surplus and deficit periods during the 39-years in the Oued El-Abid watershed.
- The common drought years of three stations are: 1981, 1983, 1984, 1986, 1990, 1994, 1998, 1999, 2000, 2001, 2005, 2007, 2015, 2017 and 2019.
- The surplus years are: 1985, 1989, 1991, 1996, 1997, 2002, 2003, 2004, 2006, 2008, 2009, 2010, 2011, 2012 and 2018.
- The wettest year was 1996 in addition to the period between 2008 and 2012.
Table 7. Dry and wet years by rainfall index (1980-2019)
|
Years
|
Ait Ouchen
|
Tilouguit
|
Tizi N'Isli
|
|
1980
|
W
|
W
|
D
|
|
1981
|
D
|
D
|
D
|
|
1982
|
W
|
D
|
W
|
|
1983
|
D
|
D
|
D
|
|
1984
|
D
|
D
|
D
|
|
1985
|
W
|
W
|
W
|
|
1986
|
D
|
D
|
D
|
|
1987
|
W
|
S
|
W
|
|
1988
|
W
|
W
|
S
|
|
1989
|
W
|
W
|
W
|
|
1990
|
D
|
D
|
D
|
|
1991
|
W
|
W
|
W
|
|
1992
|
D
|
D
|
W
|
|
1993
|
D
|
D
|
W
|
|
1994
|
D
|
D
|
D
|
|
1995
|
D
|
D
|
W
|
|
1996
|
W
|
W
|
W
|
|
1997
|
W
|
W
|
W
|
|
1998
|
D
|
D
|
D
|
|
1999
|
D
|
D
|
D
|
|
2000
|
D
|
D
|
D
|
|
2001
|
D
|
D
|
D
|
|
2002
|
W
|
W
|
W
|
|
2003
|
W
|
W
|
W
|
|
2004
|
W
|
W
|
W
|
|
2005
|
D
|
D
|
D
|
|
2006
|
W
|
W
|
W
|
|
2007
|
D
|
D
|
D
|
|
2008
|
W
|
W
|
W
|
|
2009
|
W
|
W
|
W
|
|
2010
|
W
|
W
|
W
|
|
2011
|
W
|
W
|
W
|
|
2012
|
W
|
W
|
W
|
|
2013
|
W
|
D
|
D
|
|
2014
|
W
|
W
|
D
|
|
2015
|
D
|
D
|
D
|
|
2016
|
W
|
W
|
D
|
|
2017
|
D
|
D
|
D
|
|
2018
|
W
|
W
|
W
|
|
2019
|
D
|
D
|
D
|
|
W : Wet; D : Dry
|
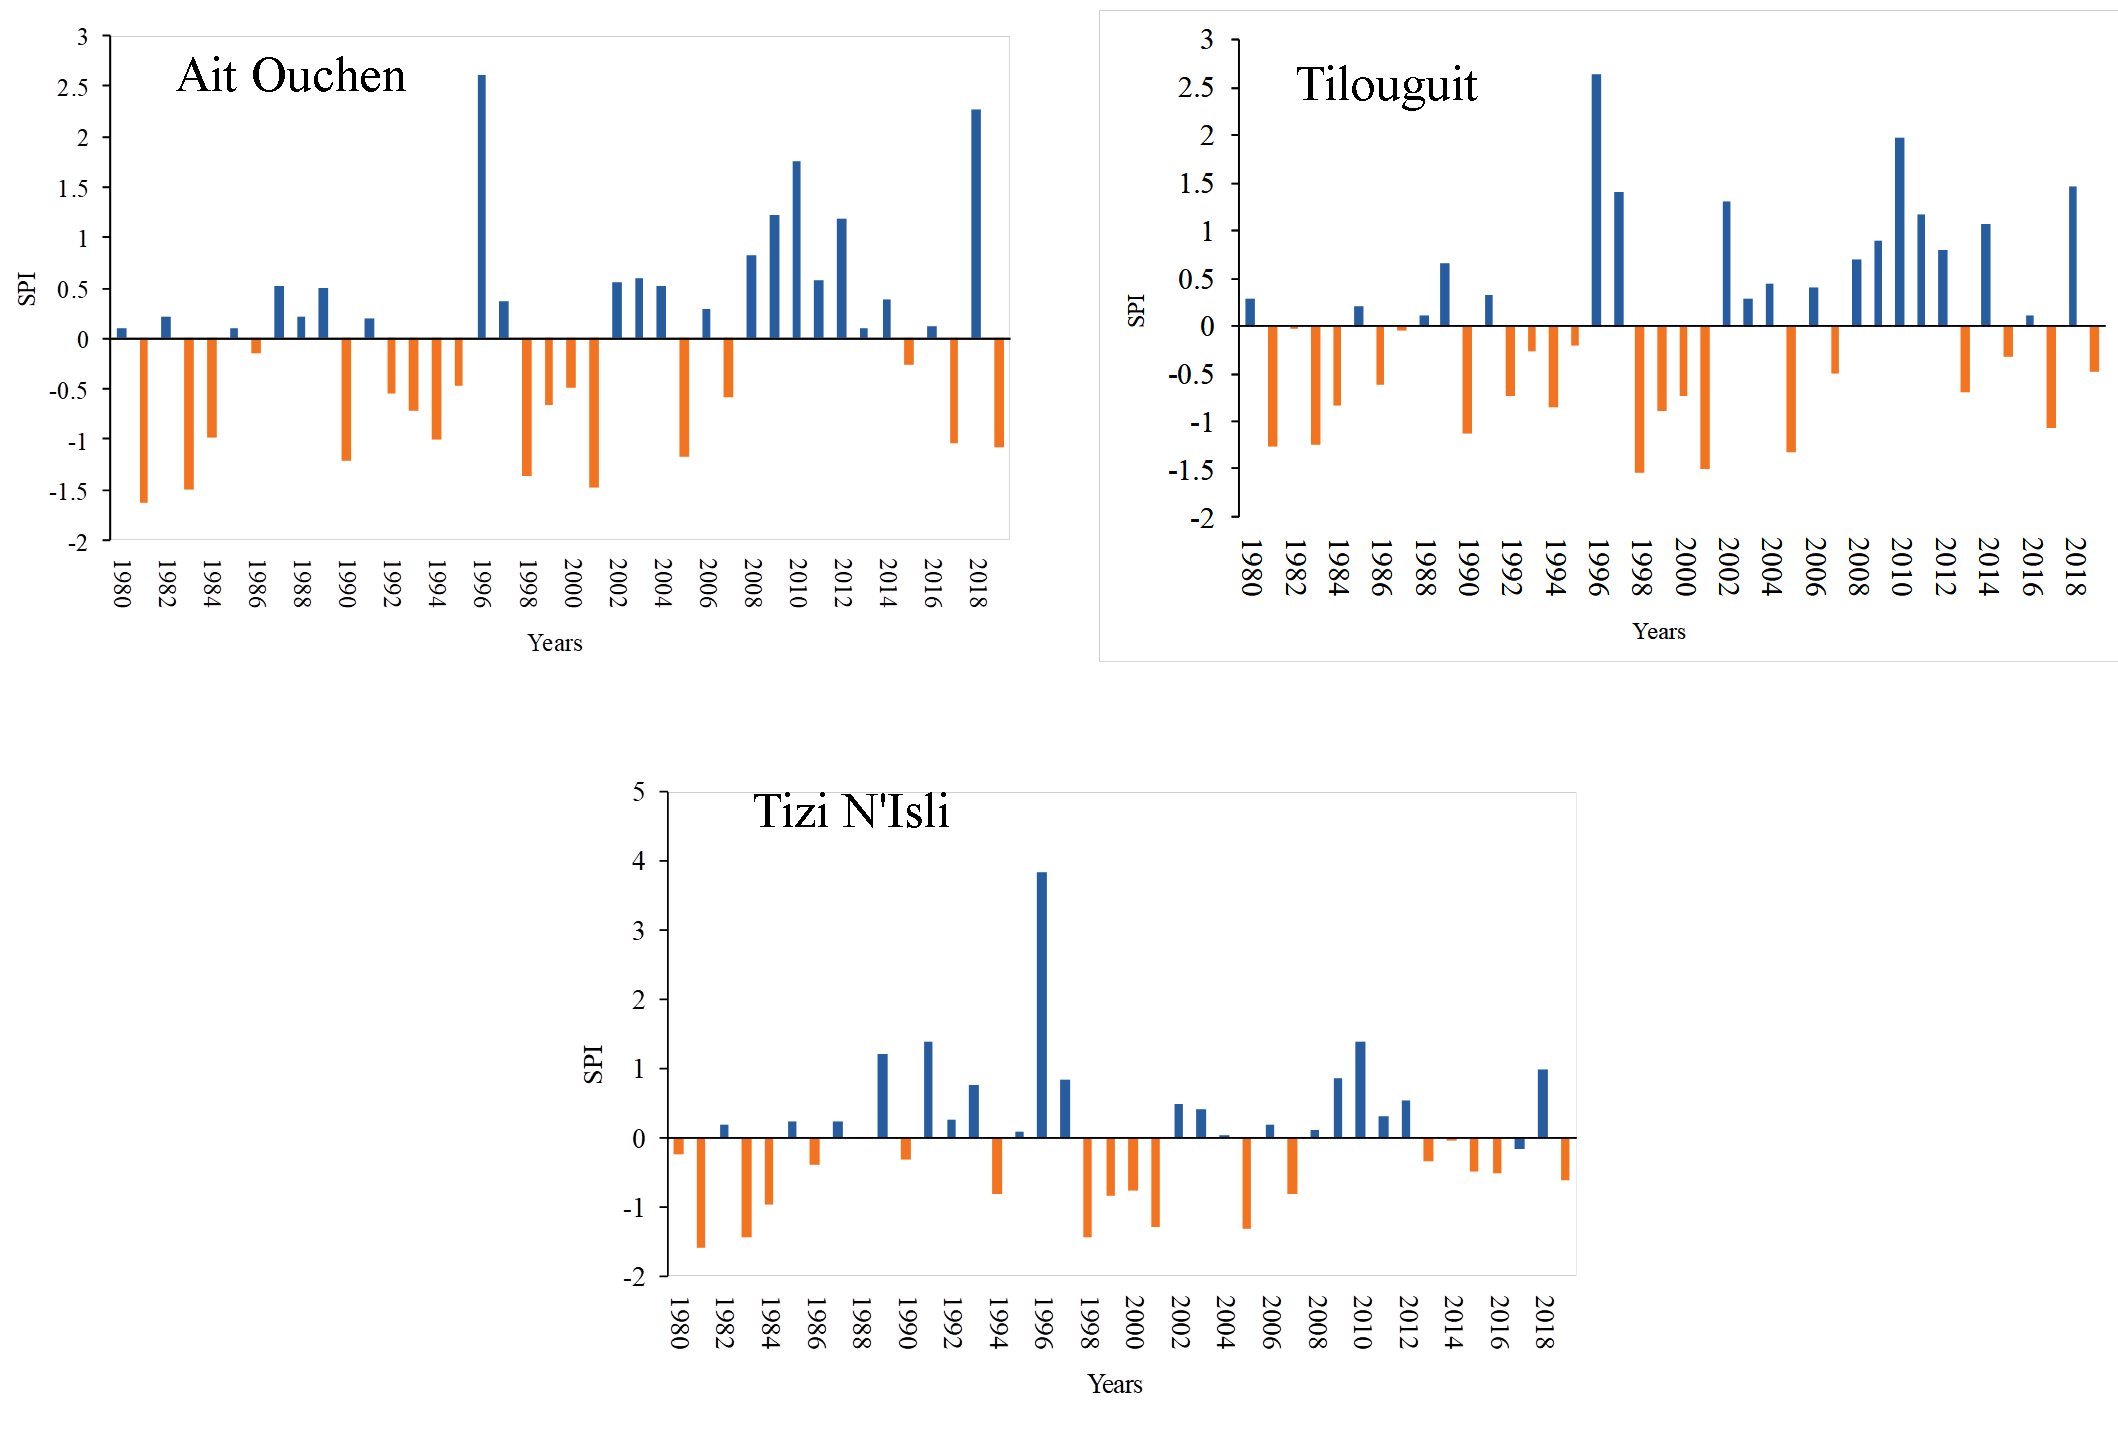
3.3 Standardized Precipitation Index (SPI)
The characterization of the drought by the SPI, confirms the recurrent character of the phenomenon determined by the drought indices DM and RI. The standard precipitation drought index allows us to very precisely define the duration and intensity of a drought (Pita, 2000). The analysis of the results of this index at the level of three stations (Figure 5) allowed us to confirm that the observation period (1980-2019) is characterized by an alternation of dry and wet years.
- The calculation of the SPI shows the existence of remarkable dry years of 1981, 1983, 1990, 1994, 1998, 2001, 2005, 2017 and 2019 (Figure 5). This translates into the existence of 7 drought sequences with a peak of about -1.59, -1.63 and -1.54, respectively in the stations Tizi N'Isli, Ait Ouchen and Tilouguit during the year 1981.
- Periods with a wet trend affecting the entire basin: 1996 and 2010.
By following the evolution of the SPI index during the period of study, we found that in terms of frequency this method indicates an average of 70% of normal years, 13% of wet years and 17% of dry years (Table 8), the deficit periods are more persistent in space-time than surplus periods.
Table 8. Frequency (%) of the drought index
|
Rain- gauge stations
|
Wet period
|
Normal period
|
Dry period
|
|
Extremely wet (>2.0)
|
Very wet (1.5 to 1.99)
|
Moderately wet
(1 to 1.49)
|
Total frequency (%)
|
Normal (-0.99 to +0.99)
|
Moderately dry (-1 to -1.49)
|
Very dry (-1.5 to -1.99)
|
Extremely dry (< -2)
|
Total frequency (%)
|
|
Ait Ouchen
|
5
|
2.5
|
5
|
12.5
|
67.5
|
17.5
|
2.5
|
0
|
20
|
|
Tilouguit
|
2.5
|
2.5
|
12.5
|
17.5
|
65
|
12.5
|
5
|
0
|
17.5
|
|
Tizi N'Isli
|
2.5
|
0
|
7.5
|
10
|
77.5
|
10
|
2.5
|
0
|
12.5
|


 ,
Abdellah Ouigmane 1
,
Abdellah Ouigmane 1