Proper utilization of MHC services is very important to reduce maternal mortality in India.
Utilization of maternal health care services is strongly determined by different socio-demographic factors.
The percentage of women received all the MHC services are increasing with the increase media exposure in India.
Full exposure (listening radio, watching television and reading news-papers) women are more likely to receive MHC services.
Abstract
Maternal Health Care (MHC) is very essential for improvement in the health status of the mother and children. The present study attempts to show the role of mass media on the utilization of MHC services in India. The entire study depends on secondary data collected from the National Family Health Survey (NFHS-4, 2015-16). Initially, the data has been analyzed by some descriptive statistics and for the proper depiction of the result, binary logistic regression has been conducted.The unadjusted odds ratio (UOR) has shown media exposure positively and significantly associated with the utilization of the majority of MHC services. The adjusted odds ratio has a less effective association with the MHC services compare to the unadjusted odds ratio. Other controlling variables including maternal age, age at marriage, birth order, education, caste, religion, wealth index, place of residence, and the region has also affect the health care services.
Keywords
Postnatal Care , NFHS , media exposure , India , Delivery Care , Antenatal Care
1 . INTRODUCTION
Maternal Health Care (MHC) is now a vital global phenomenon that needs more attention for all countries which working towards achieving Millennium Development Goals (MDG) started in 2015 (Singh et al., 2012). The proper treatment-seeking behaviour during pregnancy reduces not merely maternal mortality but in addition newborn health as well as neonatal mortality (Islam et al., 2018; Yadav et. al., 2020). In India, it is found that maternal mortality (167/100000 live births) and infant mortality (37/1000 live births) due to maternity causes at the time of delivery is high compare to developed nations (Mishra and Ramanathan, 2002; Ahankari et al., 2008; Thind et al., 2008). Media which is also known as the fourth state of a country has a crucial role in highlighting and creating proper awareness’s and perceptions and policy implications on maternal health care issues (Nwagbara, 2017; Zamawe et al., 2015). A journalist, as well as health journalist, can easily hold the public perceptions on the governmental role for maternal health care, realistic picture of caretaking by mothers, different barriers like lack of care center, transportation and the condition of care, nutrition and hygiene of an area (Acharya et al., 2015; Gugsa et al., 2016). Media exposure is the strong communicative channel which increase the awareness and proper utilization of required maternal health care services as well as public health issues with the proper use of television, radio, and newspapers (Odesanya et al., 2015; Zamawe et al., 2015). All countries have been initiated different awareness programs and policies to reduce the maternal as well as neonatal mortality. India also adopted the various policies and programs for the progress of not only maternal health and child health but also public health; as a result, there was a tremendous growth on the care of health-seeking behaviour among women aged 15-49 years (NFHS-4 report). WHO recommended that every woman has to receive at least 4 ANC visits during pregnancy; it can reduce the various complications. In India, the share of women received at least 4 or more ANC visits was 77% in NFHS-3 (2005-06) which now at 84% in NFHS-4 (2015-16), and 79% women received antenatal care from a skilled health provider in NFHS-4; 59% of women received their first ANC visit during the first trimester of pregnancy. Another important treatment-seeking behaviour is to take all the ANC components i.e. weight measure, blood pressure check-up, urine sample test and abdominal examine. In this case the scenario of India quite satisfactory i.e. pregnant women are more likely to have their weight measured (91%), their blood pressure measured (89%), and a blood sample was taken (87%), urine sample was taken for 88 per cent of women and 89 per cent of women had their abdomen examined whereas there also some unsatisfactory aspect i.e. to take iron and folic acid (IFA) tablets for at least 100 days (30%) or to take an intestinal parasite drug (18%) (NFHS-4, 2015-16). The present study attempted to show the role of mass media exposure on the utilization of MHC services among Indian women aged 15-49 years who had at least one live birth preceding 5 years of the survey.
2 . METHODOLOGY
2.1 Data
The present work has been complete with the assist of secondary data composed from National Family Health Survey-4 in India which has been conducted in 2015-16 over 601509 households, 699686 women aged 15-49 years with a response rate of 97%, and 112122 men aged 15-54 years with a response rate of 92% (Paul and Chouhan, 2019; Barman et al., 2020). The present study extracted relevant data from the Demographic Health Surveys (DHS) program into STATA version 12.1. The data was processed using the weights of each sample (Paul, 2020). The variables with multiple categories were recoded into different groups. In this study, we have used the data on 190898 ever-married women aged 15-49 years who had at least one live birth in the last 5 years preceding the survey (Paul, 2020; Barman et al., 2020).
2.2 Outcome Variables
In the present work, the utilization of MHC services has been discussed in three phases’ i.e. antenatal care (ANC), delivery care and postnatal care (PNC) wherein antenatal care five outcome variables have been selected i.e. received ANC, at least 4 ANC visit as per the recommendation of World Health Organization, proper timing of first ANC visit which has been considered as the timing of first ANC within the first trimester (Barman et al., 2020; WHO, 2016), skilled health personnel for ANC where skilled health personnel has been considered as antenatal care by doctor/nurse/auxiliary nurse midwife and taking at least 2 or more tetanus toxoid injection as per WHOs recommendation (Barman et al., 2020). In delivery care, place of delivery i.e. either institution or home and the presence of skilled birth attendant during delivery is very important for the safe delivery for newborn baby and also for the maternal mortality due to maternity cause. Skilled birth attendant may reduce the risk of delivery complications. According to NFHS skilled birth attendant are called as doctor and nurse. Final phase i.e. postnatal care also important aspect of MHC services which is not only helpful for mother but also both mother and newborn baby. In postnatal care variable, PNC within 42 days of delivery has been taken for consideration. For the multivariate analysis (binary logistic regression), all the outcome variables has been coded as ‘1’ if ‘yes’ and ‘0’ if ‘no’ for the proper depiction of the results.
2.3 Explanatory Variable
Media exposure of the women has been considered as the index of three main variables i.e. listening to the radio (yes or no), watching television (yes or no) and reading newspaper (yes or no) from the NFHS-4 which was conducted in 2015-16 in India (NFHS, 2015-16). After compositing all the three variables, media exposure variable has been created which was categorized into three categories i.e. no exposure (those women who were not involved with these three media exposure variables), partial exposure (those women who were involved with any two of these three media exposure variables) and full exposure (those women who were strongly involved with radio, television and newspaper) (Barman et al., 2020).
2.4 Study Covariates
Different socio-demographic and economic variables have been considered as covariates in the present study to show the determining effect on the utilization of maternal health care services except for media exposure i.e. age of the respondents which has been categorized into three categories i.e. 15-24 years, 25-34 years and 35-49 years, age at marriage (< 18years and 18 or > 18 years), birth order (1, 2, 3 and 4 or 4 +), caste (SC, ST, OBC and Others), religion (Hindu, Muslim, Christian and Others), women’s education (illiterate, primary, secondary and higher), place of residence (urban and rural), wealth index (poorest, poorer, middle, richer and richest), and region (north, central, east, north-east, west and south) has been considered to show the adjusted odds ratio (controlled for maternal age, age at marriage, birth order, caste, religion, education, wealth index, place of residence and region) between media exposure and utilization of maternal health care services (Barman et al., 2018; Barman et al., 2020).
2.5 Statistical Analyses
For the proper depiction of the results, we have used Chi-square as bivariate analysis and binary (1, 0) logistic regression as multivariate analysis to show the exact association between media exposure and different treatment-seeking behaviour during pregnancy and child birth. Binary logistic (0, 1) regression also has done where dependent variables (MHC indicators) has been coded ‘0’ (No) and ‘1’ (Yes) to find the unadjusted odds ratio (UOR) which tell us the role of a particular independent variable on the particular dependent variable and adjusted odds ratio (AOR) (where other independent variables were controlled) which tell us the combined effect of all the independent variables (explanatory variables and study covariates) on the particular dependent variable (outcome variables) (Barman et al., 2018).
3 . RESULTS
Table 1 shows the respondent’s individuals (maternal age, age at marriage, birth order) and socio-cultural characteristics (education, caste, religion, wealth index, place of residence, region) in India where most (46.9%) of the respondent’s education were secondary level and 27.6% were illiterate, 55.9% respondents have belonged from the age group 25-34 years and 37.6% were being married at <18 years old (Barman et al., 2018). Most of the respondents (45.3%) were from the other backward classes (OBC) group and about 45% of respondents belonged from a poor family who is inhabited rural areas (70.2%) (Barman et al., 2018). This table (Table 1) emphasizes on the weighted distribution of the respondents by their nature of exposure to mass media. Only 9 to 20% of respondents were listening to the radio whereas up to 75% respondents by their different backgrounds read the newspaper but in the case of watching television, the proportion was high compare to radio and newspaper. Education and poverty play a vital role for the associated with mass media (Table 1); with the increase of education and wealth, the percentage of women also increased who have engaged with any mode of mass media (radio, television and newspaper) mass media (Table 1).
Table 1. Individual and socio-cultural characteristics of ever-married women aged (15-49) years who had at least one live birth in the last 5 years (2015-2016)
Independent variables
Media exposure
Weighted % (n)
Listening radio
Watching television
Reading news paper
Mass media exposure
No exposure
24.6 (49374)
Partial exposure
67.7 (126910)
Full exposure
7.7 (14614)
Maternal age
15-24 years
13.1 (8489)
73.7 (44340)
33.5 (19924)
34.7 (62082)
25-34 years
14.3 (16370)
72.6 (76866)
37.3 (38140)
55.9 (107500)
35-49 years
13.6 (3443)
55.7 (12381)
25.2 (5599)
9.4 (21316)
Age at marriage
<18 years
12.0 (8543)
61.8 (41586)
22.3 (14639)
37.3 (66425)
18 or 18+ years
15.1(19341)
77.9 (89688)
43.7 (48446)
62.7 (121205)
Birth order
1
15.2 (10212)
80.2 (48602)
45.3 (26958)
33.6 (61807)
2
14.5 (9526)
77.8 (47471)
39.8 (23824)
34.5 (62484)
3
12.5 (4561)
64.6 (21352)
25.0 (8383)
16.6 (33064)
4 <
10.6 (4003)
44.9 (16162)
11.8 (4498)
15.3 (33543)
Women's education
Illiterate
9.4 (5679)
41.9 (23131)
0.7 (382)
27.6 (55165)
Primary
11.3 (3205)
66.3 (17438)
12.9 (3714)
13.5 (26712)
Secondary
14.7 (14778)
84.2 (73954)
48.9 (42935)
46.9 (88871)
Higher
23.2 (4640)
94.7 (19064)
83.1 (16632)
12 (20150)
Caste
SC
12.9 (4442)
69.6 (24069)
27.9 (9372)
21.99 (35170)
ST
12.3 (5582)
59.3 (24132)
20.9 (10283)
10.7 (37889)
OBC
13.7 (9834)
70.7 (51556)
35.8 (24856)
45.3 (74060)
Others
14.7 (6251)
80.3 (28548)
47.1 (16903)
22 (35888)
Religion
Hindu
14.1 (19165)
72.5 (97849)
35.4 (45866)
79.4 (138343)
Muslim
12.6 (5263)
62.1 (17585)
28.2 (7829)
16.2 (29309)
Christian
15.2 (2630)
81.1 (11642)
49.9 (6643)
2.1 (15202)
Others
10.8 (722)
92.3 (5114)
53.3 (2614)
2.3 (5650)
Wealth Index
Poorest
10.2 (4704)
29.4 (13981)
7.7 (3457)
23.4 (46782)
Poorer
12.1 (6242)
63.9 (27700)
19.2 (8457)
21.2 (43739)
Middle
13.6 (6353)
85.1 (32596)
34.2 (13327)
19.9 (38393)
Richer
15.4 (5617)
94.1 (31231)
51.4 (17083)
19 (33312)
Richest
19.6 (5386)
97.5 (28079)
75.1 (21339)
16.6 (28772)
Place of residence
Urban
16.6 (7881)
90.3 (43017)
53.3 (25435)
29.72 (47833)
Rural
12.6 (20421)
63.4 (90570)
27.1 (38228)
70.2 (143065)
Region
North
13.6 (6116)
81.2 (28783)
40.1 (14313)
13.2 (36079)
Central
13.2 (6756)
61.5 (33731)
26.9 (14255)
25.7 (52952)
East
12.7 (4676)
54.3 (20047)
23.0 (9021)
25.4 (39243)
North-East
13.4 (5725)
64.8 (21143)
26.4 (10357)
3.9 (28825)
West
13.8 (1581)
83.8 (11308)
45.3 (5609)
13.1 (13892)
South
16.5 (3448)
94.0 (18575)
52.6 (10108)
18.7 (19907)
Table 2 depicts the different individuals and socio-cultural characteristics of the respondents by their utilization of maternal health care services (MHC indicators) in India (Barman et al., 2018) which undoubtedly assured that the full exposure respondents were more advanced in terms of taking different maternal health care services i.e. received antenatal care (89.4%) [χ2=1.3e+04 and p=0.000], at least 4 ANC (63.8%) [χ2=1.6e+04 and p=0.000], ANC visit within first trimester (67.4%) [χ2=1.5e+04 and p=0.000], skilled health personnel for ANC (88.6%) [χ2=1.6e+04 and p=0.000], taking 100 or more IFA tablets (42.35%) [χ2=3.3e+03 and p=0.000], taking 2 or more TT injections (81.7%) [χ2=1.8e+03 and p=0.000], institutional delivery (92.9%) [χ2=1.2e+04 and p=0.000], skilled birth attendance for delivery (93.3%) [χ2=1.2e+04 and p=0.000] and PNC within 42 days of delivery (77.4%) [χ2=7.9e+03 and p=0.000] than the no exposure women. The women who were married at 18 or above age, higher educated women were more superior in the consumption of all MHC services in India. It was found that in case of religious view, the Muslim women were far behind in terms of utilization of MHC services compare to the Hindu women; similarly the lower utilization of MHC services was found among rural women compare to urban women. Economic condition plays a significant role for the utilization of required MHC services. It was found that the poorest women were very far from the proper utilization of all the MHC services than the richer and richest women (Table 2) (Barman et al., 2018).
Table 2. Percentage (weighted) distribution of individuals and socio-cultural characteristics of women (15-49 years) by the different maternal health care indicators of India (2015-16)
Independent variables
Received ANC
At least 4 ANC visit
ANC visit within 1st trimester
Received ANC from SHP
Taking 100 IFA tablets
Maternal age
15-24 years
85.7
53.3
60.4
82.1
29.73
25-34 years
82.8
52
59.4
79.6
31.63
35-49 years
71.1
39.1
47.2
66.9
24.61
Chi-square; p-value
1.6e+03; 0.000
590.59; 0.000
1.7e+03; 0.000
1.4e+03; 0.000
141.56; 0.000
Age at marriage
<18 years
77.3
41.9
50.8
72.5
22.54
18 or 18+ years
86.5
57.5
64
84
35.48
Chi-square; p-value
3.8e+03; 0.000
5.8e+03; 0.000
4.6e+03; 0.000
4.4e+03; 0.000
1.9e+03; 0.000
Birth order
1
89.2
61.6
66.5
87
35.97
2
86.2
56.6
62.6
83.3
34.51
3
78.5
42.8
52.6
73.8
24.71
4 or 4+
65.2
25.5
38.9
59.3
14.53
Chi-square; p-value
8.2e+03; 0.000
9.8e+03; 0.000
9.6e+03; 0.000
8.8e+03; 0.000
2.1e+03; 0.000
Women's education
Illiterate
67
28
41.2
60.6
15.68
Primary
82
45.4
53.8
77.3
23.72
Secondary
89.3
61
65.7
87.1
35.77
Higher
93.7
72.9
76.4
93.8
50.06
Chi-square; p-value
1.2e+04; 0.000
1.7e+04; 0.000
1.5e+04; 0.000
1.5e+04; 0.000
5.1e+03; 0.000
Caste
SC
81.6
48.7
55.1
77.5
28.6
ST
79
45.6
53.5
72.9
26.81
OBC
81.5
48.2
58.5
78.2
30.24
Others
87.2
60.6
65.2
85.5
34.4
Chi-square; p-value
1.9e+03; 0.000
2.9e+03; 0.000
2.3e+03; 0.000
2.3e+03; 0.000
396.87; 0.000
Religion
Hindu
82.8
50.8
58.6
79.3
30.76
Muslim
79.9
48.8
56.5
77
24.66
Christian
85.9
62.1
65
84.2
46.74
Others
94.9
69.9
73.2
92.8
43.06
Chi-square; p-value
1.2e+03; 0.000
837.10; 0.000
1.4e+03; 0.000
842.68;0.000
621.18; 0.000
Wealth Index
Poorest
64.7
25
37.7
57.1
14.43
Poorer
81.2
44.4
52.5
76.2
23.17
Middle
88
57.2
63.2
85.6
32.77
Richer
91.1
65.8
69.9
90.4
39.57
Richest
93.9
73.1
77.4
94.1
48.23
Chi-square; p-value
1.4e+04; 0.000
2.1e+04; 0.000
1.8e+04; 0.000
1.9e+04; 0.000
6.2e+03; 0.000
Place of residence
Urban
89.7
66.4
69.1
89.1
40.84
Rural
79.7
44.8
54.2
75.1
25.86
Chi-square; p-value
2.6e+03; 0.000
5.9e+03; 0.000
3.8e+03; 0.000
3.9e+03; 0.000
1.8e+03; 0.000
Region
North
87
50.2
65.4
84.7
29.44
Central
77.9
31.8
50.1
73.2
17.25
East
73.7
41.6
46.9
67.9
19.64
North-East
85.5
48.3
56
81.8
30.55
West
89.6
71.7
69.8
87.4
39.49
South
93
77.8
74.2
93
56.82
Chi-square; p-value
5.5e+03; 0.000
1.8e+04; 0.000
7.4e+03; 0.000
7.5e+03; 0.000
9.2e+03; 0.000
Mass media exposure
No exposure
64.7
24.4
38.1
57.6
14.26
Partial exposure
88.5
59.5
65.1
86.1
34.79
Full exposure
89.4
63.8
67.4
88.6
42.35
Chi-square; p-value
1.3e+04;0.000
1.6e+04;0.000
1.5e+04;0.000
1.6e+04; 0.000
3.3e+03; 0.000
Independent variables
Taking 2 or more tetanus toxoid injection
Institutional delivery
Skilled birth attendant
PNC within 42 days of delivery
Women’s education
Illiterate
77.6
63.4
66.7
54.8
Primary
82.8
75.3
78.0
64.9
Secondary
85.0
89.2
89.9
75.1
Higher
87.4
96.9
96.5
82.9
Chi-square; p-value
2.3e+03; 0.000
1.6e+04; 0.000
1.5e+04; 0.000
7.8e+03; 0.000
Maternal age
15-24 years
83.9
84.3
85.6
70.4
25-34 years
83.2
81.3
82.8
69.6
35-49 years
78.1
68.6
71.3
60.8
Chi-square; p-value
627.98; 0.000
2.3e+03; 0.000
2.0e+03; 0.000
640.30; 0.000
Age at marriage
<18 years
81.8
74.1
76.6
62.9
18 or 18+ years
84.0
86.0
86.9
73.6
Chi-square; p-value
1.5e+03; 0.000
4.0e+03; 0.000
3.7e+03; 0.000
3.3e+03; 0.000
Birth order
1
86.6
91.0
91.1
75.5
2
83.1
84.6
86.0
72.1
3
81.8
73.9
76.9
63.7
4 or 4+
75.9
59.5
63.2
53.7
Chi-square; p-value
2.8e+03; 0.000
1.4e+04; 0.000
1.2e+04; 0.000
5.0e+03; 0.000
Caste
SC
82.4
80.3
81.8
68.7
ST
79.0
70.0
72.4
63.7
OBC
82.8
82.2
83.5
68.8
Others
85.4
85.5
87.1
73.2
Chi-square; p-value
1.6e+03; 0.000
5.3e+03; 0.000
4.5e+03; 0.000
1.8e+03; 0.000
Religion
Hindu
83.1
82.9
84.0
69.7
Muslim
82.1
71.9
75.2
63.1
Christian
79.6
81.1
82.6
74.5
Others
86.5
92.6
94.2
84.7
Chi-square; p-value
1.9e+03; 0.000
4.9e+03; 0.000
3.7e+03; 0.000
1.8e+03; 0.000
Wealth Index
Poorest
78.2
61.1
64.4
52.2
Poorer
82.3
76.8
79.1
64.5
Middle
83.7
86.6
87.7
73.8
Richer
84.6
91.7
92.4
78.5
Richest
87.6
96.1
96.0
82.1
Chi-square; p-value
2.1e+03; 0.000
1.8e+04; 0.000
1.7e+04; 0.000
1.0e+04; 0.000
Place of residence
Urban
84.4
90.3
91.1
76.4
Rural
82.4
77.3
79.2
65.9
Chi-square; p-value
473.73; 0.000
4.2e+03; 0.000
4.0e+03; 0.000
1.9e+03; 0.000
Region
North
83.5
85.4
87.7
72.2
Central
82.7
73.4
74.2
62.3
East
86.1
72.2
76.6
60.6
North-East
81.5
71.2
73.6
61.8
West
81.5
91.1
90.5
78.3
South
78.0
95.9
95.5
82.5
Chi-square; p-value
1.8e+03; 0.000
9.4e+03; 0.000
7.9e+03; 0.000
5.1e+03; 0.000
Mass media exposure
No exposure
77.8
62.5
65.8
51.6
Partial exposure
85.0
86.6
87.6
74.5
Full exposure
81.7
92.9
93.3
77.4
Chi-square; p-value
1.8e+03; 0.000
1.2e+04; 0.000
1.2e+04; 0.000
7.9e+03; 0.000
The state-wise media exposure of women of 15-49 years is given in table 3. Here it indicates that the national average of three media coverage’s like no exposure, partial exposure and full exposure were 24.62%, 67.22%, and 7.66%, respectively. In the case of state-wise comparison Bihar (57.08 %) has a maximum number of women with no media exposure followed by Jharkhand (44.71 %) and Uttar Pradesh (39.48 %). Other hands in case of partial and full media exposure have recorded from Andhra Pradesh (93.24 %) and Manipur (44.62 %) (Table 3).
Table 3. Women age 15-49 years who had a live birth in the five years (2015-16)
States/Union Territories
Media exposure
No exposure
Partial exposure
Full exposure
Andaman and Nicobar Island
5.89
89.41
4.71
Andhra Pradesh
3.67
93.24
3.08
Arunachal Pradesh
23.52
72.86
3.62
Assam
37.67
57.3
5.04
Bihar
57.08
36.71
6.20
Chandigarh
4.63
84.3
11.07
Chhattisgarh
15.86
77.97
6.17
Dadra and Nagar Havel
26.27
71.58
2.15
Daman and Diu
12.41
86.18
1.41
Goa
2.7
83.75
13.54
Gujarat
15.85
79.56
4.59
Haryana
10.6
82.06
7.33
Himachal Pradesh
5.26
80.12
14.62
Jammu and Kashmir
17.58
66.55
15.87
Jharkhand
44.71
50.91
4.37
Karnataka
7.26
78.63
14.11
Kerala
2.03
83.45
14.52
Lakshadweep
6.74
87.07
6.20
Madhya Pradesh
26.64
64.39
8.98
Maharashtra
11.46
76.1
12.44
Manipur
7.89
47.48
44.62
Meghalaya
19.89
69.84
10.27
Mizoram
4.37
84.06
11.57
Nagaland
33.43
63.21
3.36
Delhi
5.03
74.6
20.38
Odisha
22.09
74.36
3.54
Puducherry
1.97
72.41
25.62
Punjab
4.1
92.03
3.87
Rajasthan
26.57
68.8
4.63
Sikkim
6.87
80.61
12.52
Tamil Nadu
1.85
81.4
16.75
Tripura
12.87
85.13
2.00
Uttar Pradesh
39.48
55.89
4.62
Uttarakhand
9.88
82.8
7.32
West Bengal
19.91
75.76
4.33
Telangana
6.99
84.85
8.16
India
24.62
67.72
7.66
Table 4 depicts state-wise various maternal health care practices of women between the age group of 15-49 years. Here three variables under maternal health care are taken like full ANC (Antenatal Care), institutional delivery, PNC within 42 days of delivery etc. (Barman et al., 2018). In the case of national level antenatal care, the performance was overall poor only 19.49% women received full antenatal care. Among the UT’s Lakshadweep performed best with 63.74 % and among the states, Kerala stood first with 59.74 %. Here in institutional delivery national average was 81.12 %. The most important thing is except Nagaland (35.67 %) majority of the states and UT’s recorded got institutional delivery. In the case of Postnatal Care (PNC), national average was 69.04 %. Among the states and UT’s Goa (92.58 %) and Pondicherry (92.94 %) performed the best (Table 4).
Table 4. Women of 15-49 years who had a live birth in the five years preceding the survey by the different maternal health care indicators in India (2015-16)
States/Union Territories
Full ANC
Institutional delivery
PNC within 42 days of delivery
Andaman and Nicobar Island
50.46
96.37
77.76
Andhra Pradesh
42.83
92.53
85.46
Arunachal Pradesh
3.34
55.46
35.29
Assam
17.7
73.15
62.43
Bihar
3.08
66.18
48.56
Chandigarh
33.97
92.66
91.15
Chhattisgarh
20.54
72.78
74.13
Dadra and Nagar Havel
30.93
89.43
78.81
Daman and Diu
26.38
91.54
65.55
Goa
59.13
98.29
92.58
Gujarat
28.36
89.91
70.7
Haryana
18.66
83.53
73.42
Himachal Pradesh
29.74
78.24
80.37
Jammu and Kashmir
24.71
87.06
78.35
Jharkhand
7.69
64.06
52.35
Karnataka
29.74
94.59
67.75
Kerala
59.74
99.89
89.33
Lakshadweep
63.74
99.15
92.68
Madhya Pradesh
10.75
82.32
59.42
Maharashtra
29.29
91.56
82.09
Manipur
32.25
72.77
69.15
Meghalaya
18.98
54.78
66.96
Mizoram
32.93
81.67
68.75
Nagaland
2.19
35.76
25.16
Delhi
35.58
87.04
67.62
Odisha
21.99
86.59
82.3
Puducherry
51.13
99.87
92.94
Punjab
29.22
92.1
90.9
Rajasthan
9.05
85.76
66.55
Sikkim
38.35
95.01
80.36
Tamil Nadu
39.65
99.16
87.09
Tripura
7.27
82.57
65.34
Uttar Pradesh
5.72
69.93
61.64
Uttarakhand
10.92
71.98
61.79
West Bengal
20.39
77.56
71.35
Telangana
39.45
92.37
86.31
India
19.49
81.12
69.04
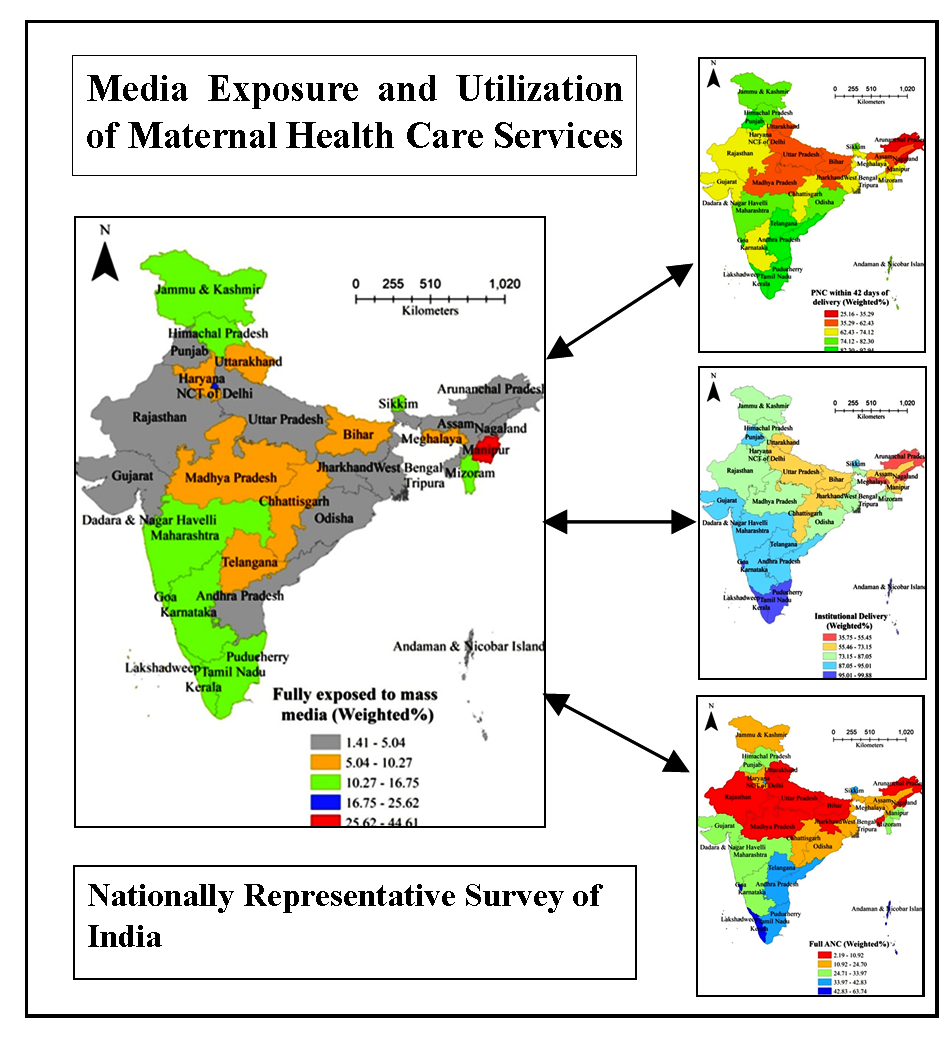
Based on figure 1 and table 5 has prepared to show the status of 15-49 years of women’s media exposure status and other maternal health care outcomes. Here the percentage outcomes have divided into five categories based on their percentage value. So based on their value total of five categories have been extracted, low, low to medium, medium, medium to high, and high. In the case of the media exposure, maximum concentration of states has found in the low and low to medium category. Only a few concentrations have got from the medium to high category or high (Manipur) (Table 5, Figure 1).
Figure 1. Women’s (15-49 years) fully media exposure
Table 5. State wise distribution of 15-49 years women’s fully media exposure and maternal health care outcomes in India (2015-16)
Status of women’s media exposure and maternal health care
Low
Low to medium
Medium
Medium to high
High
Exposure of Mass Media
Punjab, Rajasthan, Gujarat, Uttar Pradesh, Jharkhand, West Bengal. Odisha, Andhra Pradesh, Arunachal Pradesh, Assam, Nagaland, Tripura, Andaman and Nicobar
Jammu and Kashmir, Himachal Pradesh Dadra and Nagar Haveli, Odisha, Sikkim, Maharashtra, Andaman & Nicobar
Kerala, Goa, Lakshadweep, Pondicherry, Tamil Nadu, Andhra Pradesh, Telangana, Punjab,
Just like the women’s exposure to media, women’s maternal health care practices like ANC, institutional delivery, and PNC are in five categories like low, low to medium, medium, medium to high, and high. In the case of the ANC care also very few states have placed in the medium to high and high category (Telangana, Andhra Pradesh, Puducherry, Tamil Nadu, Sikkim, Goa, Kerala, Lakshadweep, Andaman and Nicobar). Even in the other two care practices also the only few states like, Kerala, Goa, Lakshadweep, Puducherry, Tamil Nadu, Andhra Prdesh, Telangana, Punjab show better outcomes. But the most unfortunate matter is maximum of the states like Assam, Jharkhand, Bihar, Uttar Pradesh, Madhya Pradesh, Uttarakhand, Nagaland, Arunachal Pradesh etc. show very poor outcomes in terms of maternal health care outcomes (Table 5, Figure 2, 3 and 4).
Table 6 shows the result of binary logistic regression model (unadjusted odds ratio or UOR) and found the effects of media exposure on the utilization of MHC services. There were high likelihood (Unadjusted odds ratio) of taking all the maternal health care services i.e. ANC [UOR: 5.240; 95% CI: 4.939 - 5.561 and p<0.01], at least 4 ANC visit [UOR: 5.965; 95% CI: 5.731 - 6.208 and p<0.01], ANC within 1st trimester [UOR: 2.176; 95% CI: 2.078 - 2.278 and p<0.01], two or more TT injection [UOR: 1.645; 95% CI: 1.566 - 1.728 and p<0.01], ANC from SHP [UOR: 5.789; 95% CI: 5.484 – 6.112 and p<0.01], taking 100 or more IFA tablets [UOR: 2.976; 95% CI: 2.846-3.111 and p<0.01], institutional delivery [UOR: 6.048; 95% CI: 5.710 – 6.406 and p<0.01], SBA for delivery [UOR: 6.273; 95% CI: 5.904–6.666 and p<0.01] and PNC within 42 days of delivery [UOR: 3.278; 95% CI: 3.142 – 3.420 and p<0.01] among the women who were full exposed with mass media than the women who were not exposed with any kind of mass media communication (Saikia and Singh, 2009). Adjusted odds ratio (AOR) (Table 7) were less i.e. ANC [AOR: 1.535; 95% CI: 1.432 - 1.644 and p<0.01], at least 4 ANC visit [AOR: 1.756; 95% CI: 1.672 - 1.845 and p<0.01], ANC within 1st trimester [AOR: 1.194; 95% CI: 1.131 - 1.260 and p<0.01], two or more TT injection [AOR: 1.056; 95% CI: 0.995 - 1.121 and p<0.01], ANC from SHP [AOR: 1.536; 95% CI: 1.442 - 1.636 and p<0.01], taking 100 or more IFA tablets [AOR: 1.263; 95% CI: 1.196-1.335 and p<0.01], institutional delivery [AOR: 1.485; 95% CI: 1.386 - 1.591 and p<0.01], SBA for delivery [AOR: 1.562; 95% CI: 1.455 - 1.677 and p<0.01] and PNC within 42 days of delivery [AOR: 1.481; 95% CI: 1.409 - 1.558 and p<0.01] compare to unadjusted odds ratio because in adjusted odds ratio show the combining effect of other determining factors (maternal age, age at marriage, birth order, women’s education, caste, religion, wealth index, place of residence and region) including mass media which tell us that not only mass media but also there were other determining factors which also affect the proper utilization of treatment-seeking behaviour during pregnancy and child birth among the Indian mothers of 15-49 years.
Table 6. Result of binary logistic regression model (Unadjusted odds ratio) for the association between mass media exposure and the utilization of maternal health care services among the 15-49 years women in India (2015-16)
Independent variables
Received ANC
At least 4 ANC
ANC within 1st trimester
2 or more TT injection
100 or more IFA tablets
Media exposure
No exposure
1.00
1.00
1.00
1.00
1.00
Partial exposure
3.840***
3.880***
1.788***
1.739***
2.169***
(3.744 - 3.937)
(3.789 - 3.973)
(1.743 - 1.835)
(1.694 - 1.784)
(2.105-2.234)
Full exposure
5.240***
5.965***
2.176***
1.645***
2.976***
(4.939 - 5.561)
(5.731 - 6.208)
(2.078 - 2.278)
(1.566 - 1.728)
(2.846-3.111)
Log-likelihood
-82603.199
-122685.68
-94354.46
-87112.492
-92013.747
Chi-square
11846.09
16152.1
2164.25
1734.07
3440.89
Pseudo R2
0.0669
0.0618
0.0113
0.0099
0.0184
Observation
189044
189044
156755
189566
142036
Independent variables
SHP at ANC
Institutional delivery
SBA at delivery
PNC within 42 days of delivery
Media exposure
No exposure
1.00
1.00
1.00
1.00
Partial exposure
3.945***
3.245***
3.224***
2.466***
(3.853 – 4.038)
(3.170 – 3.322)
(3.148 – 3.302)
(2.413 – 2.519)
Full exposure
5.789***
6.048***
6.273***
3.278***
(5.484 – 6.112)
(5.710 – 6.406)
(5.904 – 6.666)
(3.142 – 3.420)
Log-Likelihood
-94078.492
-94974.448
-91440.993
-118009.58
Chi-square
14510.84
11332.26
10832.25
7631.21
Pseudo R2
0.0716
0.0563
0.0559
0.0313
Observation
190898
190337
190898
190898
ANC= Antenatal care, TT= Tetanus toxoid, SHP= Skilled health provider, PNC= Postnatal care, SBA= Skilled birth attendant, 95% Confidence interval in parentheses; *** p<0.01, ** p<0.05, * p<0.1= Reference category,
Table 7. Result of binary logistic regression model (Adjusted odds ratio) for the association between mass media exposure and the utilization of maternal health care services among the 15-49 years women in India (2015-16)
Independent variables
Received ANC
At least 4 ANC
ANC within 1st trimester
2 or more TT injection
100 or more IFA tablets
Media exposure
No exposure
1
1
1
1
1
Partial exposure
1.755***
1.698***
1.189***
1.355***
1.163***
(1.699 - 1.813)
(1.647 - 1.751)
(1.151 - 1.228)
(1.309 - 1.402)
(1.120-1.208)
Full exposure
1.535***
1.756***
1.194***
1.056**
1.263***
(1.432 - 1.644)
(1.672 - 1.845)
(1.131 - 1.260)
(0.995 - 1.121)
(1.196-1.335)
Log-likelihood
-72570.075
-104099.53
-86893.576
-78382.037
-80525
Chi-square
20523.3
37385.54
5867.59
6905.92
13994.07
Pseudo R2
0.1239
0.1522
0.0327
0.0422
0.0799
Observation
177646
177646
147491
178156
132311
Independent variables
SHP at ANC
Institutional delivery
SBA at delivery
PNC within 42 days of delivery
Media exposure
No exposure
1
1
1
1
Partial exposure
1.681***
1.286***
1.306***
1.427***
(1.632 - 1.732)
(1.247 - 1.327)
(1.266 - 1.347)
(1.388 - 1.467)
Full exposure
1.536***
1.485***
1.562***
1.481***
(1.442 - 1.636)
(1.386 - 1.591)
(1.455 - 1.677)
(1.409 - 1.558)
Log-likelihood
-81736.489
-77725.97
-76017.546
-104608.41
Chi-square
26234.22
32187.05
28356.21
15200.81
Pseudo R2
0.1383
0.1715
0.1572
0.0677
Observation
179288
178773
179288
177079
ANC= Antenatal care, TT= Tetanus toxoid, SHP= Skilled health provider, PNC= Postnatal care, SBA= Skilled Birth Attendant, 95% Confidence interval in parentheses; *** p<0.01, ** p<0.05, * p<0.1 = Reference category
Adjusted model controlled for maternal age, age at marriage, birth order, women’s education, caste, religion, wealth index, place of residence and region.
4 . DISCUSSION
The present study shows the impact of media exposure (listening to the radio, watching television and reading newspaper) (Fatema and Lariscy, 2020) on the utilization of maternal health care services (received ANC, frequent use of ANC, the timing of 1st ANC visit, SHP for ANC, two or more TT injection, 100 or more IFA tablets, institutional delivery, delivered by SBA and PNC within 42 days of delivery) among the Indian women of 15-49 years. There were significant variations in the likelihood of taking all the MHC services. Though mass media was an important determining factor with some other factors (age, age at marriage, birth order, women’s education, caste, religion, place of residence, wealth index and region) (Chandhiok et al., 2006; Yadav et al., 2016) important to control the utilization of MHC services. They are more understood with the help of table 3 (unadjusted odds ratio) and 4 (adjusted odds ratio) (Adogu et al., 2014; Duong et al., 2004; Navaneetham and Dharmalingam, 2002; Vidler et al., 2016). There was a significant association between media exposure and the utilization of MHC services in India which also found in different countries over the world i.e. Kenya, Malawi (Zamawe et al., 2015), Nigeria (Nwagbara, 2017), Uganda (Asp et al., 2014), Nepal (Acharya et al., 2015), Bangladesh (Gugsa et al., 2016) and so on. In India, the women who were fully exposed to all the media device (listening to the radio, watching television and reading newspapers) were more likely to receive all the MHC services than the partial or no exposure women (Bhatia and Cleland, 1995). This may be probably due to fully exposed women were more aware and conscious about the treatment-seeking behaviour with the help of news, programs and advertisement from radio, television and newspaper compare to the women who were not associated with any kind of this news, programs and advertisement and also any information regarding their treatment-seeking behaviour at the time of pregnancy (Acharya et al., 2015; Odesanya et al., 2015). Many previous studies found that the women who were not exposed with mass media or partially exposed with mass media, they were mostly illiterate or low educated, belongs to rural areas with poor economic background, having no decision making power about her family as well as her life. They were not aware of the modern treatment-seeking behaviour and how to utilize the maternal health care services (Abor et al., 2011; Adogu et al., 2014; Furuta and Salway, 2006; Joshi et al., 2014; Mehari and Wencheko, 2013; Somefun and Ibisomi, 2016). From this point of view not only mass media but also there were many other factors like education, birth order, age at marriage, economic condition, place of residence and decision-making power also control the utilization of maternal health care services among Indian women (Bloom et al., 2001; Saha et al., 2013; Shariff, 2002; Vidler et al., 2016). This study gives the message that the improper utilization or poor utilization of MHC services among reproductive women leads to the increase of maternal as well as neonatal mortality which is one of the most crucial demographic problems in India (Bhatia and Cleland, 1995). So not only government but also different NGOs and educated people and health workers like ASHA (Accredited Social Health Activist) have to take the responsibility to increase the awareness about the availability, accessibility and importance of utilization of MHC services among the mothers mainly rural mothers whose are resided in very remote areas which may reduce the risk of mothers and newborn life.
5 . CONCLUSION
Our results show the significant role of media exposure i.e. listening to the radio, watching television and reading newspapers on the enhancement of taking treatment during pregnancy and childbirth, increase the preparedness of childbirth and as well as reduce maternal mortality and newborn death. In India, the availability and accessibility of MHC services are not bad (Irene, 2015; Barman et al., 2020) but they’re also found huge differences in the likelihood of taking all the necessary care due to their differences in education, awareness, religious custom, economic constrain as well as the degree of media exposure which play a significant role to aware about the different treatment-seeking behaviour among the women as well as human beings by different program and campaign. In mainly rural India, a some households having television, read the newspaper which is very essential now a day’s not for only health issues but also different aspects of mankind. Therefore, Indian government should make policies and programs to increase the awareness and activeness about their different health-seeking behaviour through increasing the rate of education and mass media exposure and also govern the different news channels to initiate some daily programs on the health issues which may reduce not only maternal as well as newborn mortality, the incidence of diseases also.
Tables
Figures
Conflict of Interest
The authors declare that there is no conflict of interest.
Acknowledgements
The author would like to thank Prof. Ranjan Roy for his encouragement and Mr. Pintu Paul for his critical review of an earlier version of the manuscript.
Abbreviations
ANC: Antenatal Care; MHC: Maternal Health Care; NFHS: National Family Health Survey; PNC: Postnatal Care; TT: Tetanus Toxoid.
Adogu, P. O., Egenti, B. N., Ubajaka, C., Onwasigwe, C. and Nnebue, C., 2014. Utilization of maternal health services in urban and rural communities of Anambra State, Nigeria. Nigerian journal of medicine, 23.
Shariff, A., 2002. Determinants of maternal health care utilisation in india : evidence from a recent household survey. National Council of Applied Economic Research.


 ,
RAHUL MALLICK 2
,
RAHUL MALLICK 2