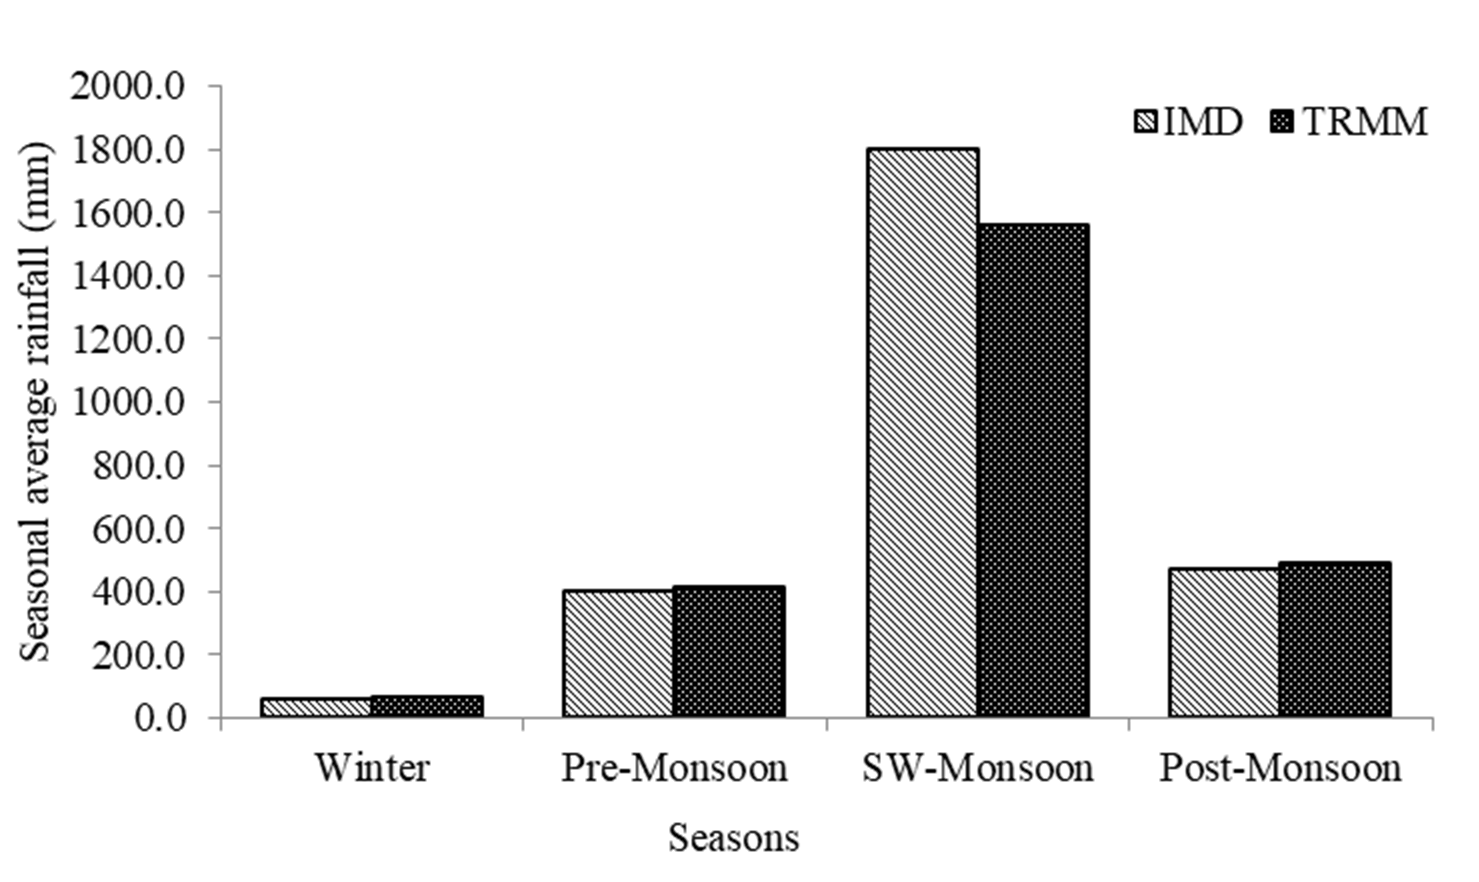
Another comparison made between TRMM 3B42 V-7 rainfall products and observatory data based on seasonal classification. The comparison of the two datasets for Kerala’s four different seasonal average rainfall levels shown in figure 5. The TRMM data for winter, pre-monsoon, southwest monsoon and post-monsoon is more consistent with the observatory data, with correlation coefficients of 0.855, 0.963, 0.899, and 0.834 with RMSE values of 19.57, 50.42, 286.85, and 85.11 mm, respectively. The presence of a high R-value suggests that TRMM can follow the trend, whereas the RMSE shows the presence of under-or over-estimation. TRMM consistently underestimates observatory rainfall data during the southwest monsoon, with an average bias of -0.13.
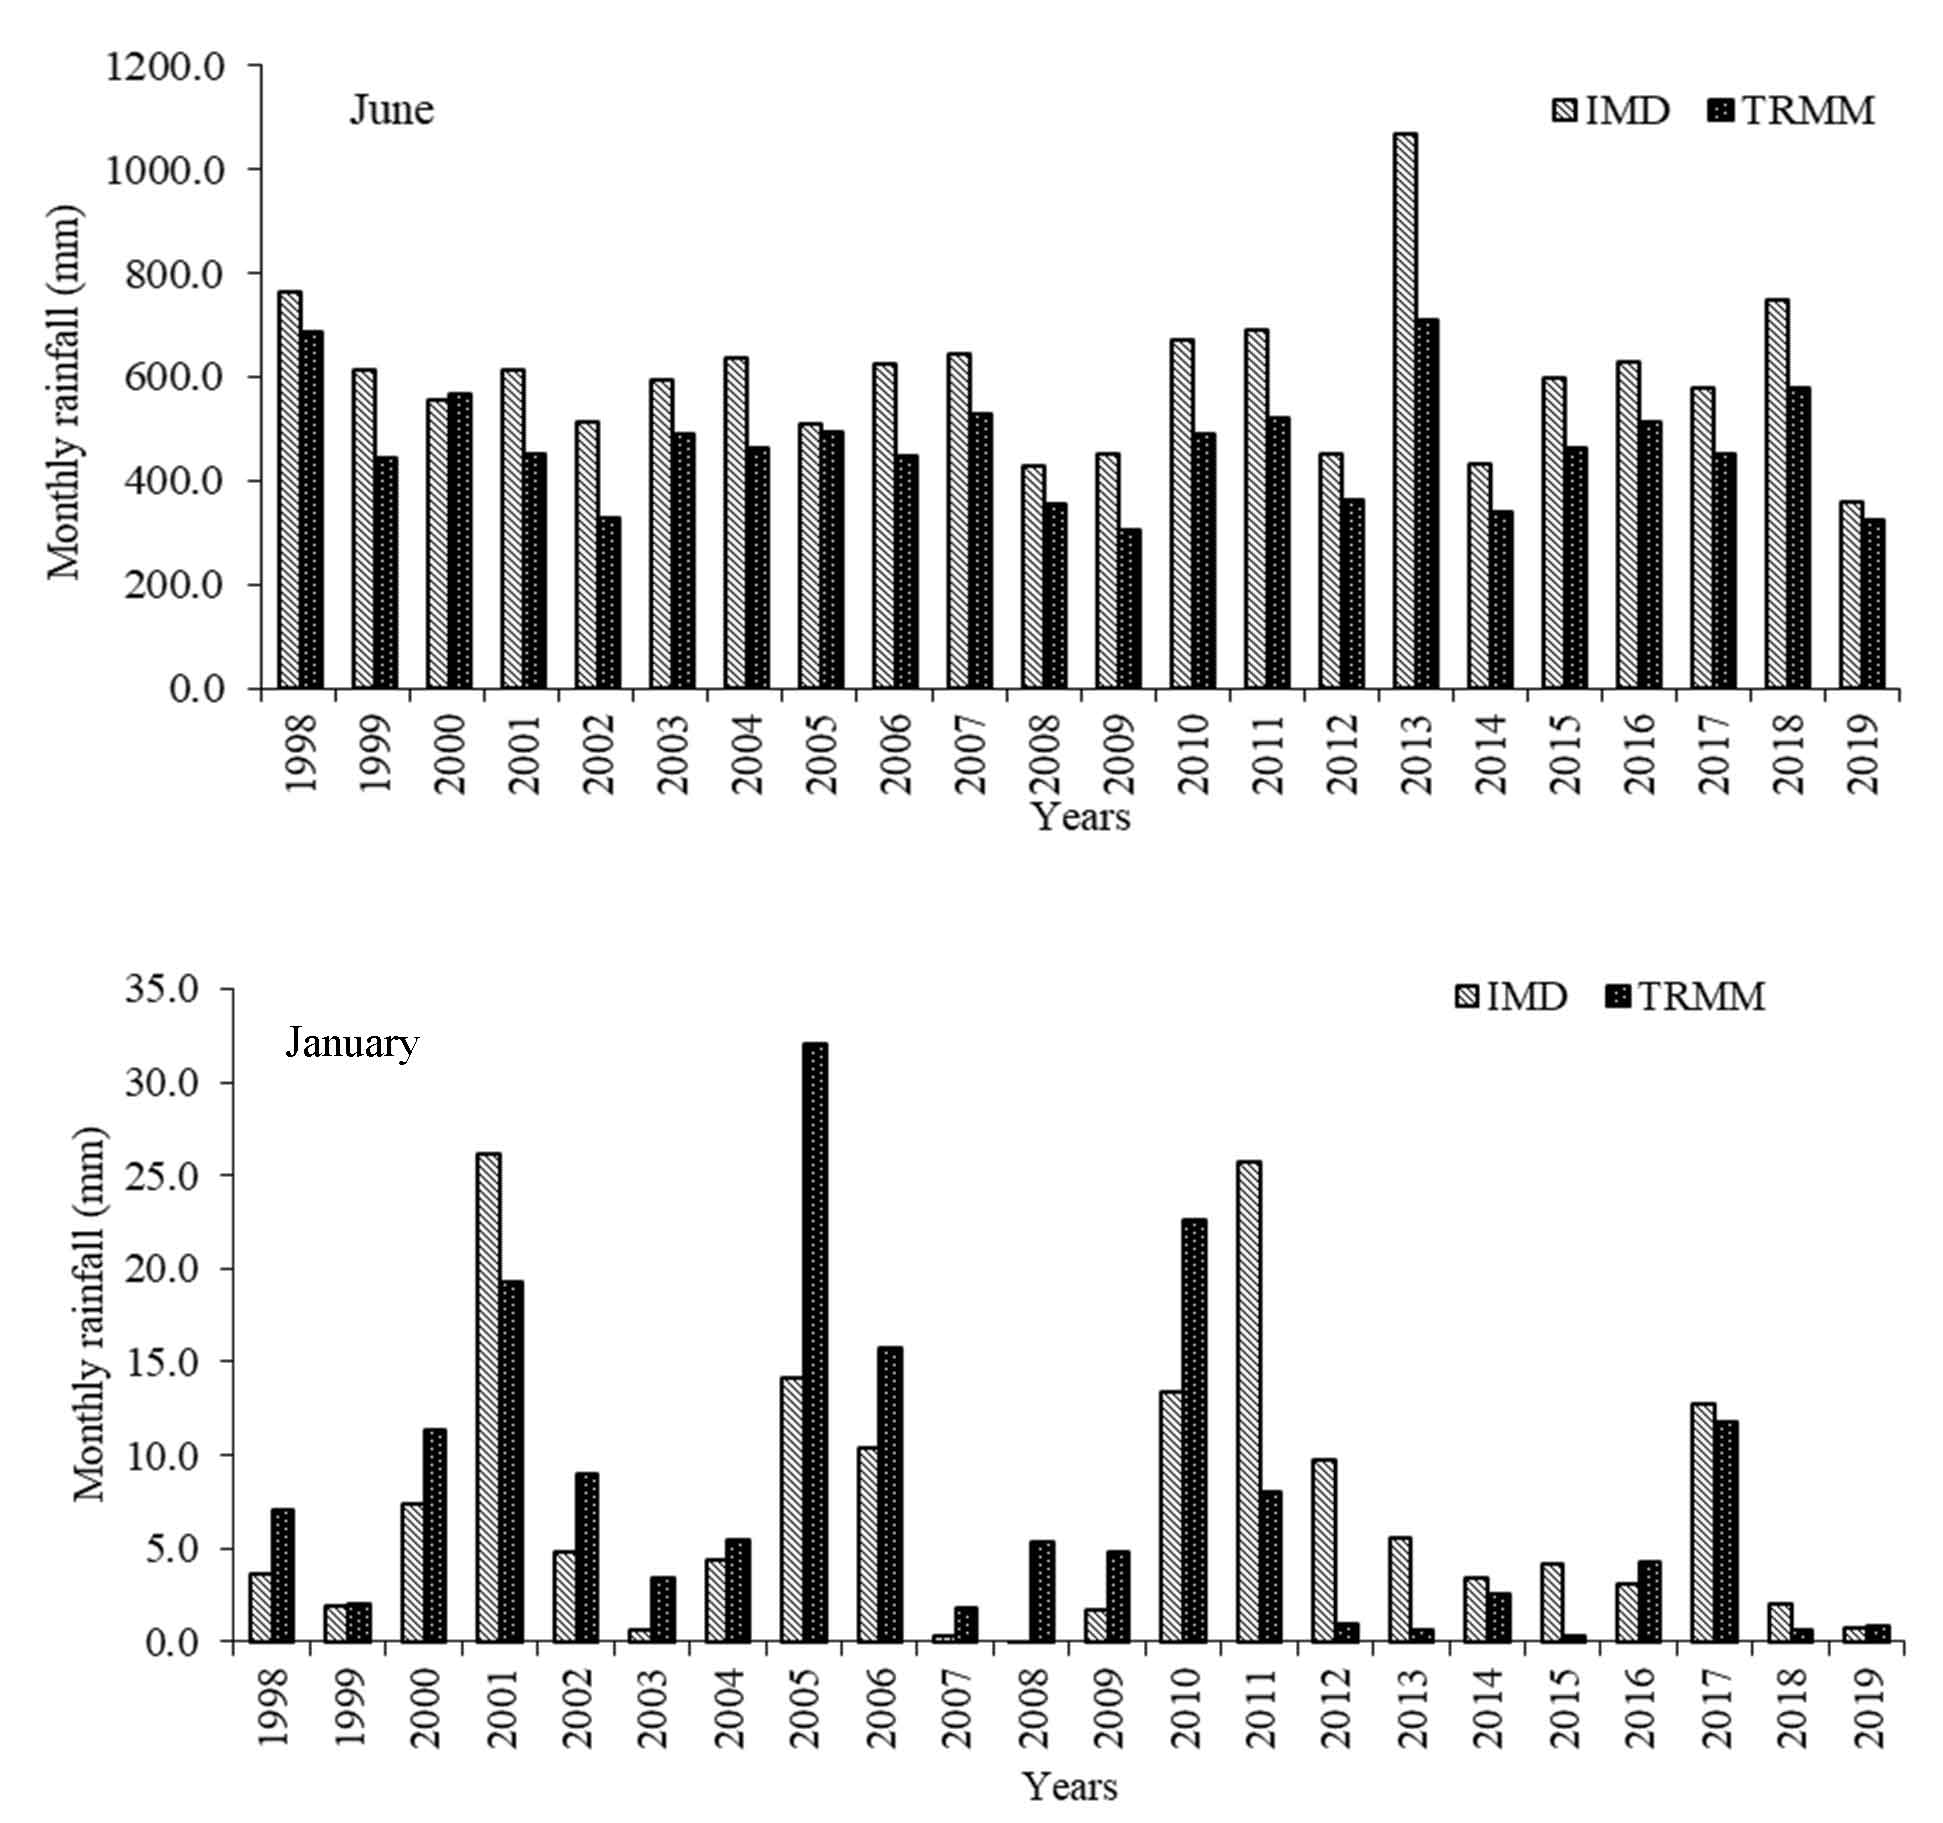
Moreover, the TRMM 3B42 V-7 total monthly rainfall data compared to observatory data for the study period’s peak and lowest rainfall months (Figure 6). June is the wettest month, while January is the driest. Thus, TRMM underestimates total rainfall in June and overestimating in January months. The TRMM data for the month with the highest and lowest rainfall values agrees better with the observatory data, with R values of 0.871 and 0.618 with RMSE values of 149.3 and 6.78 mm, respectively. The TRMM delivers more reliable estimated estimations during the month with the highest rainfall than during the month with the lowest rainfall.
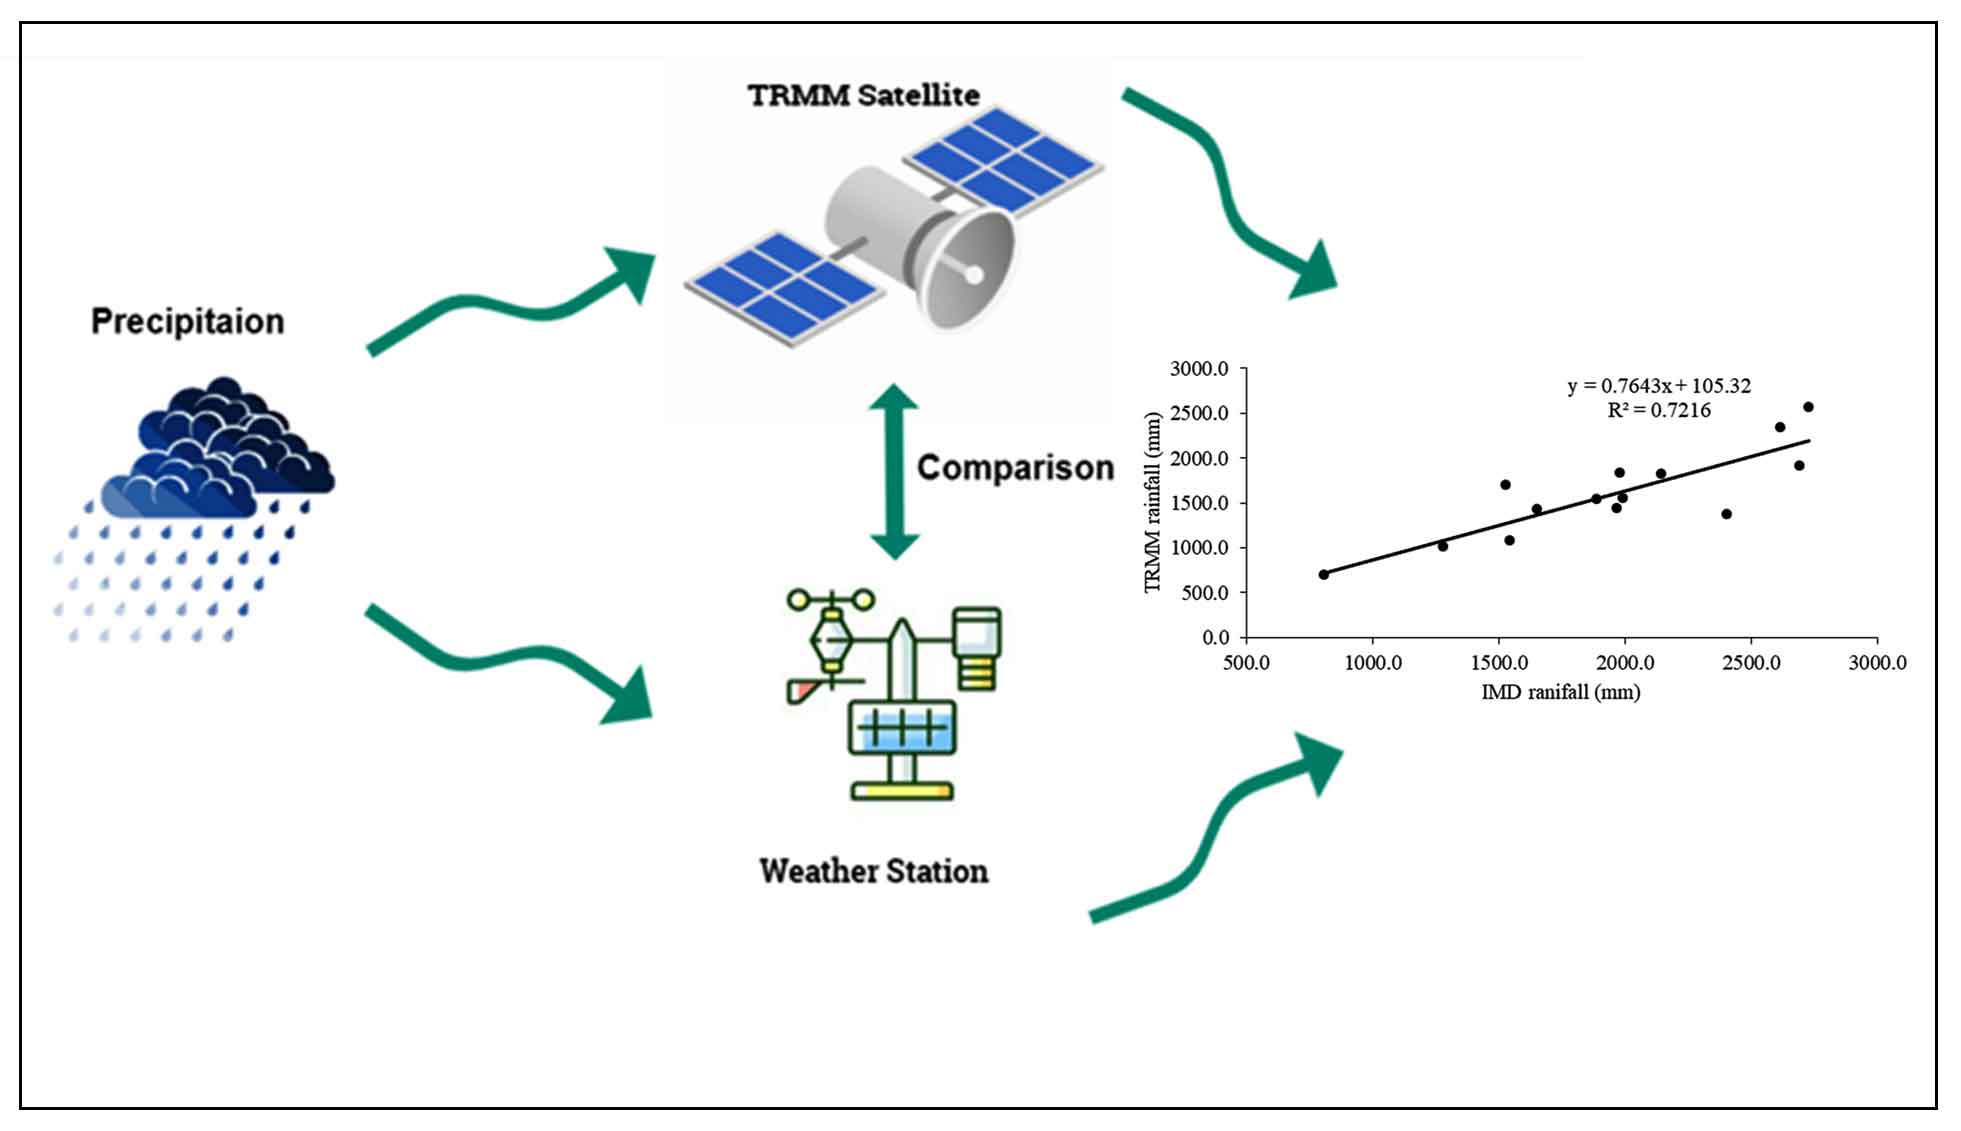
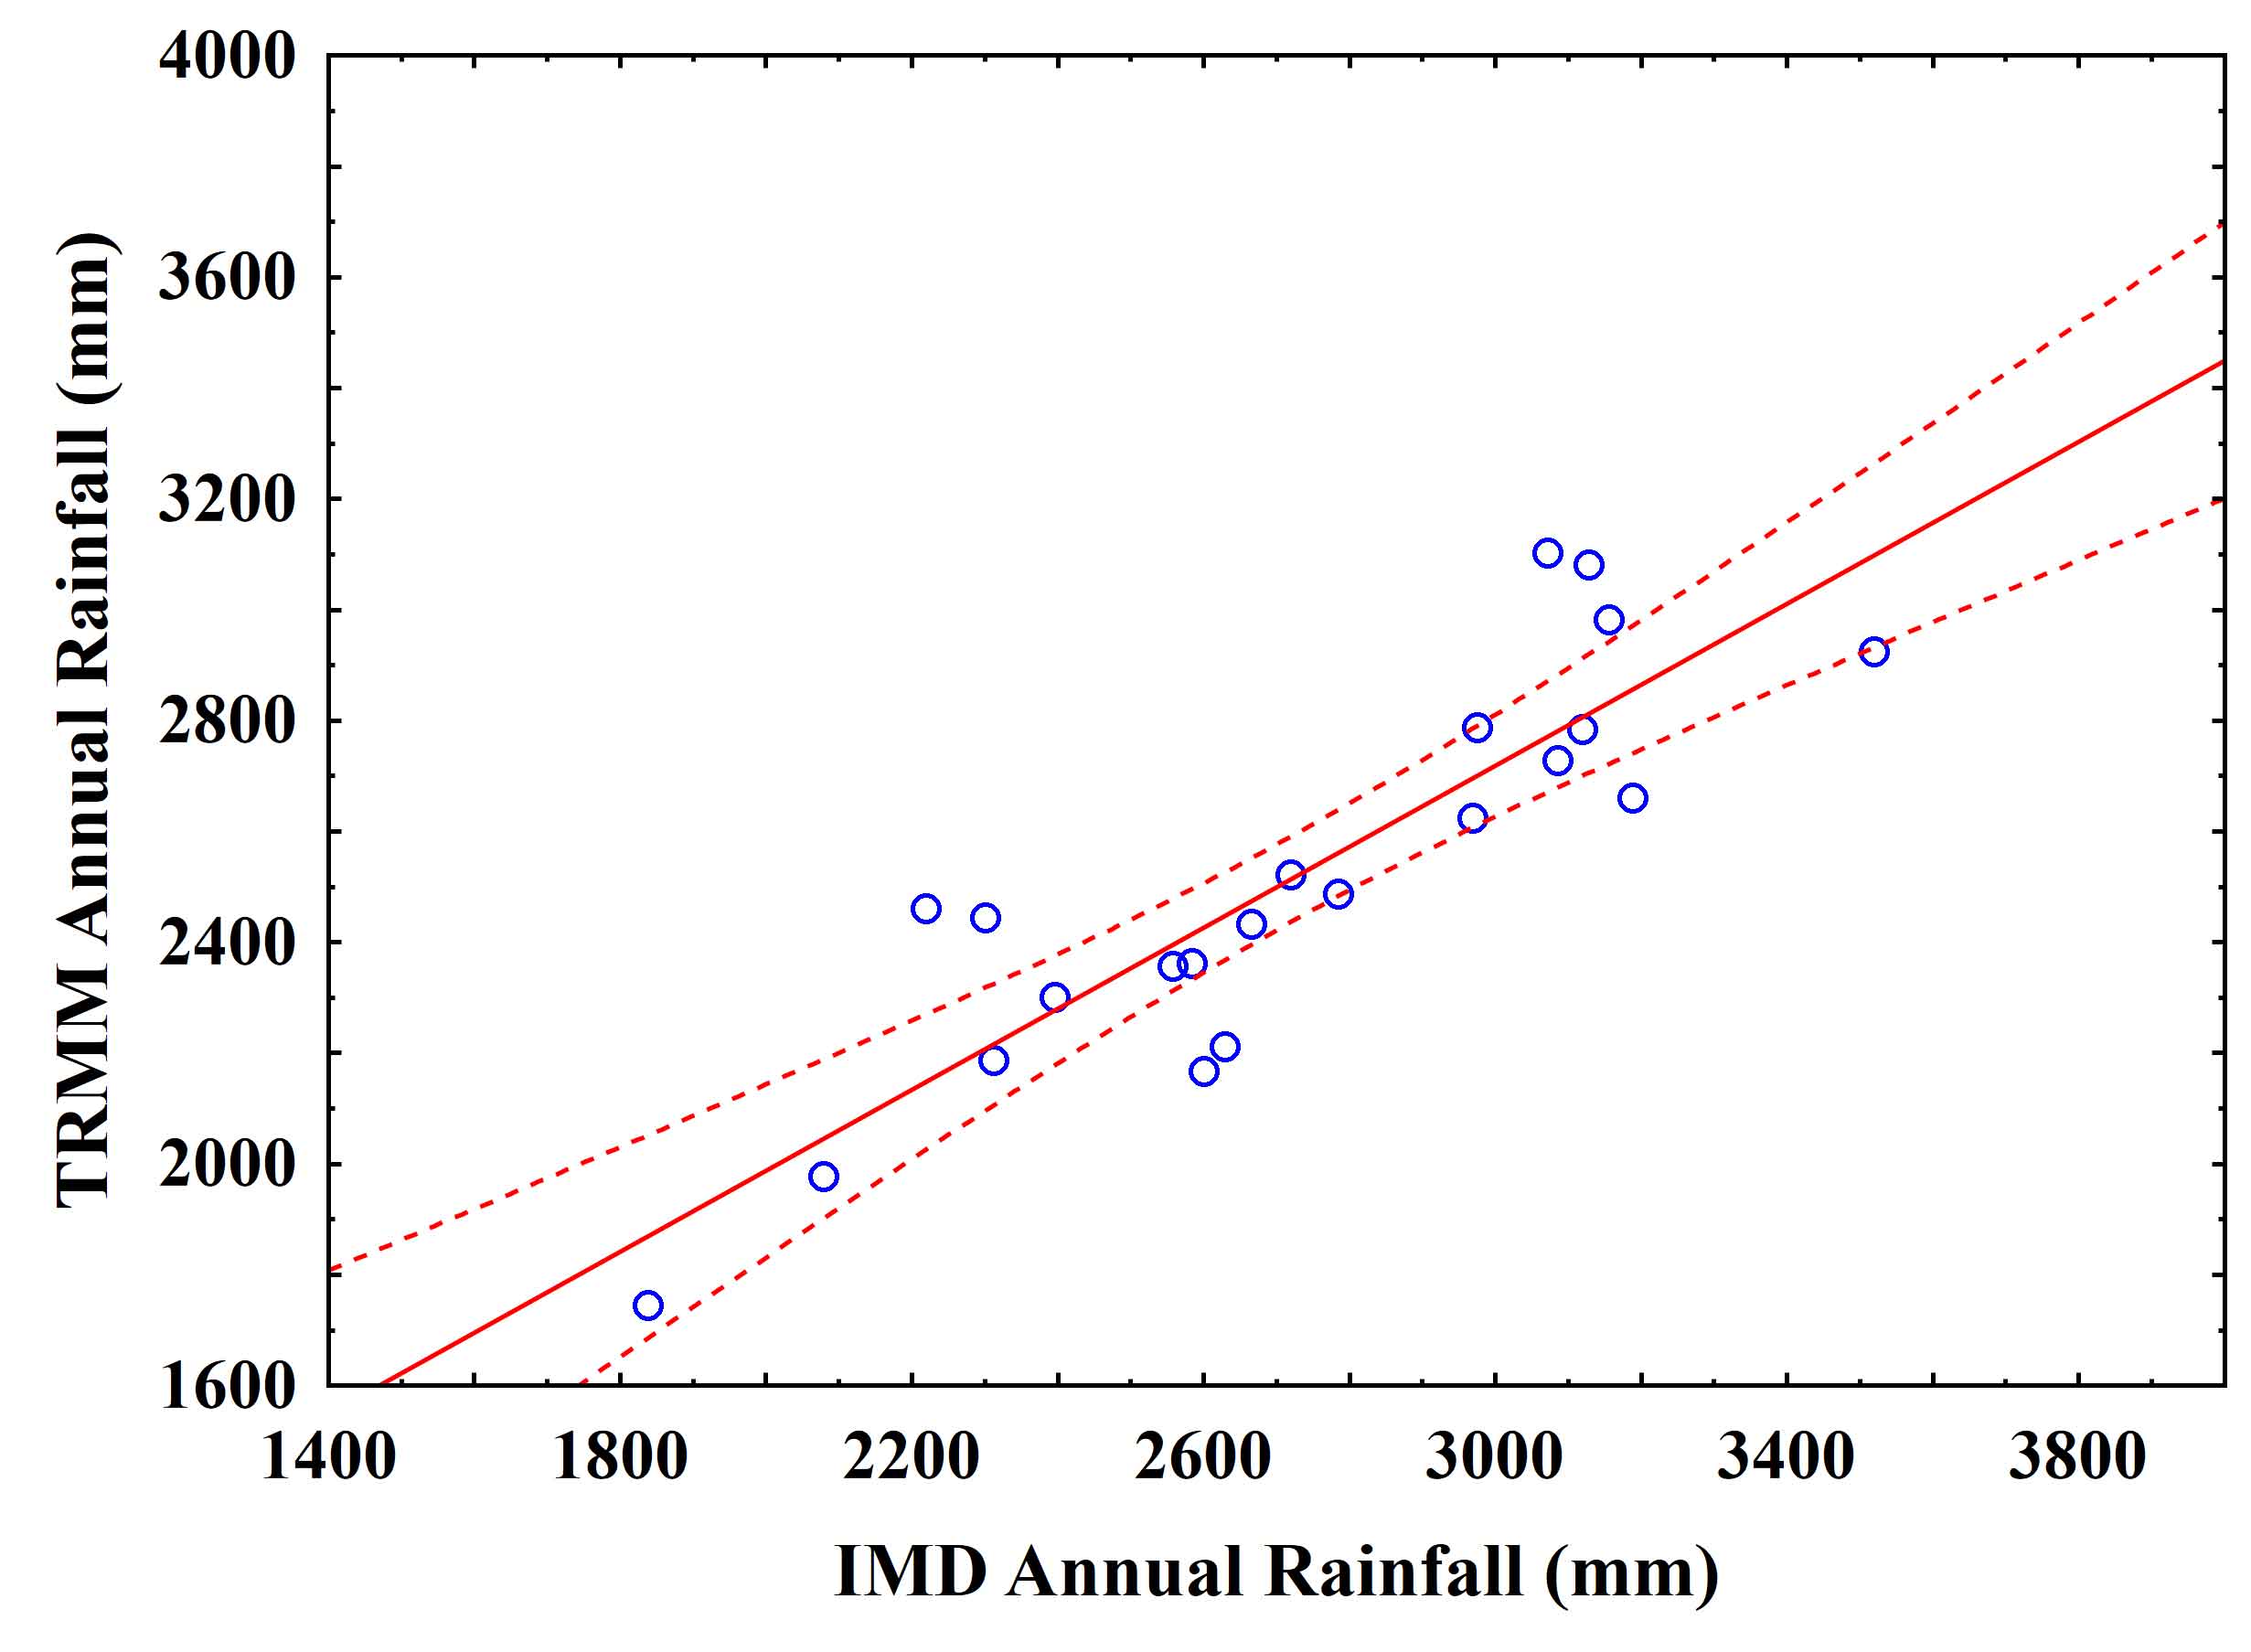
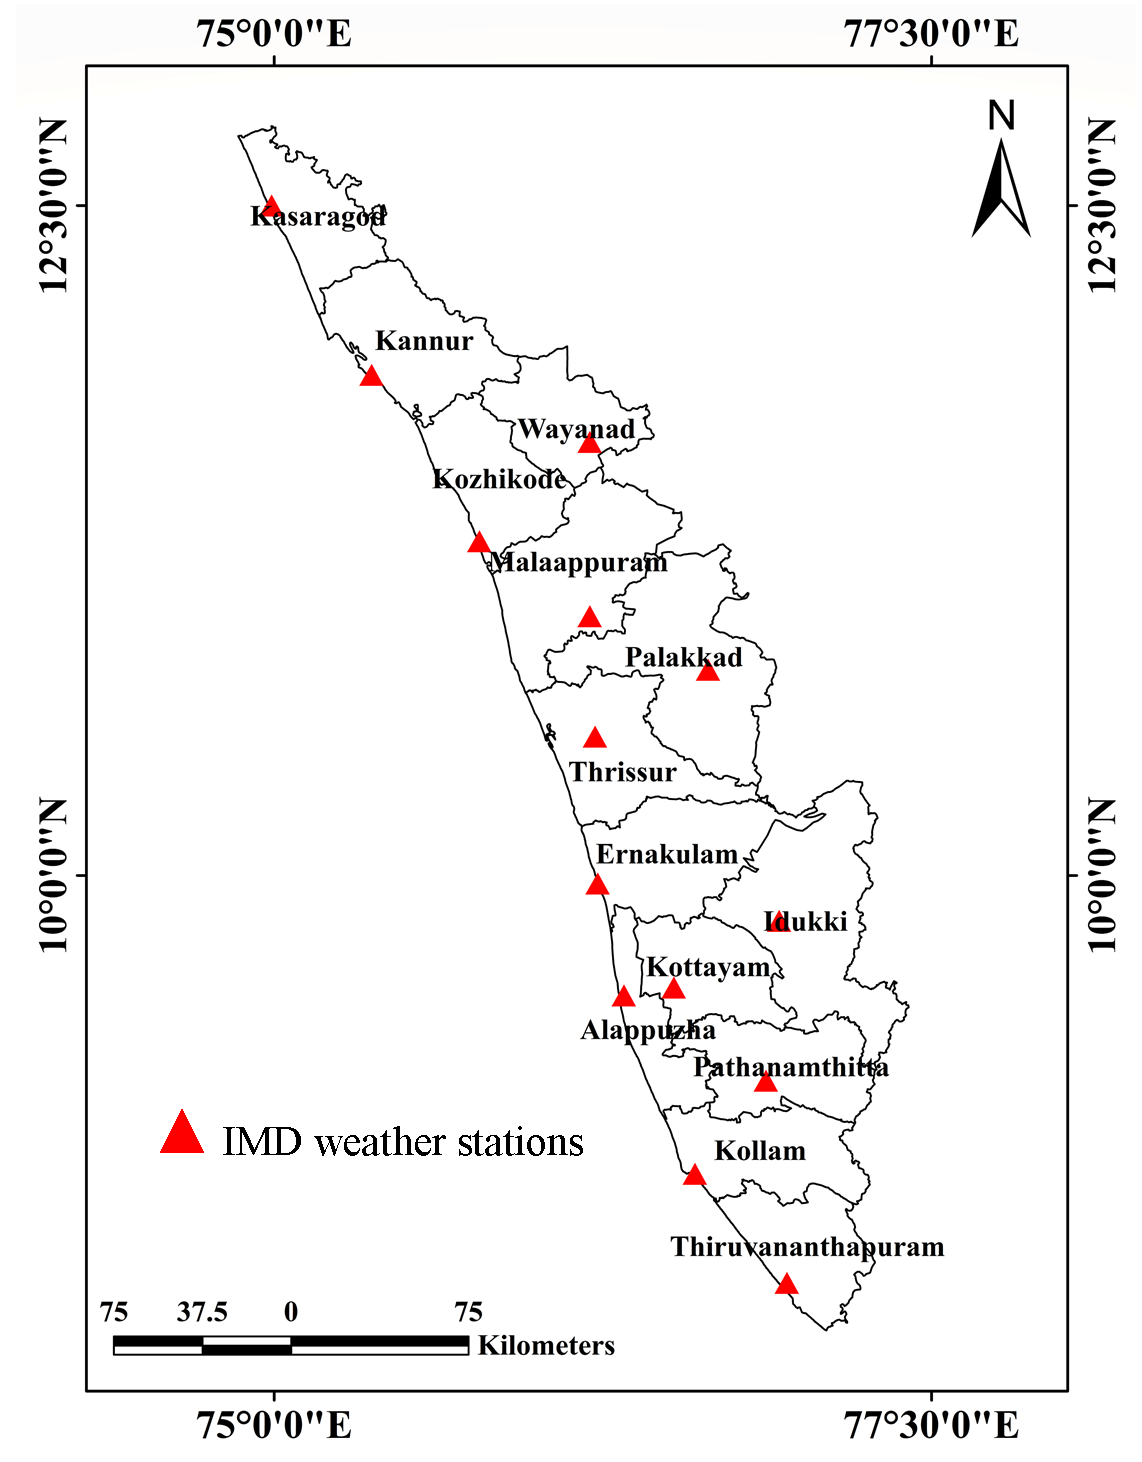
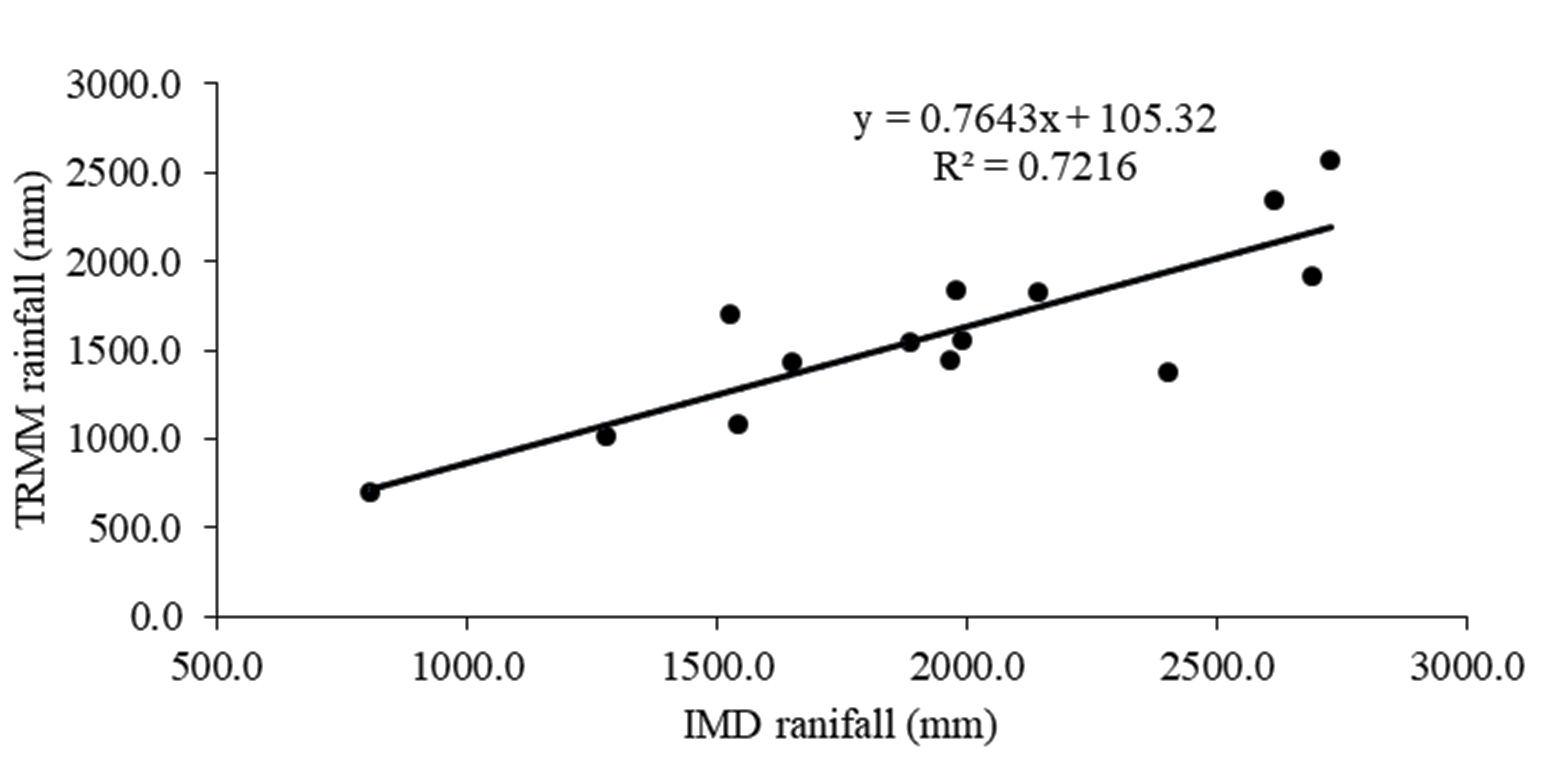
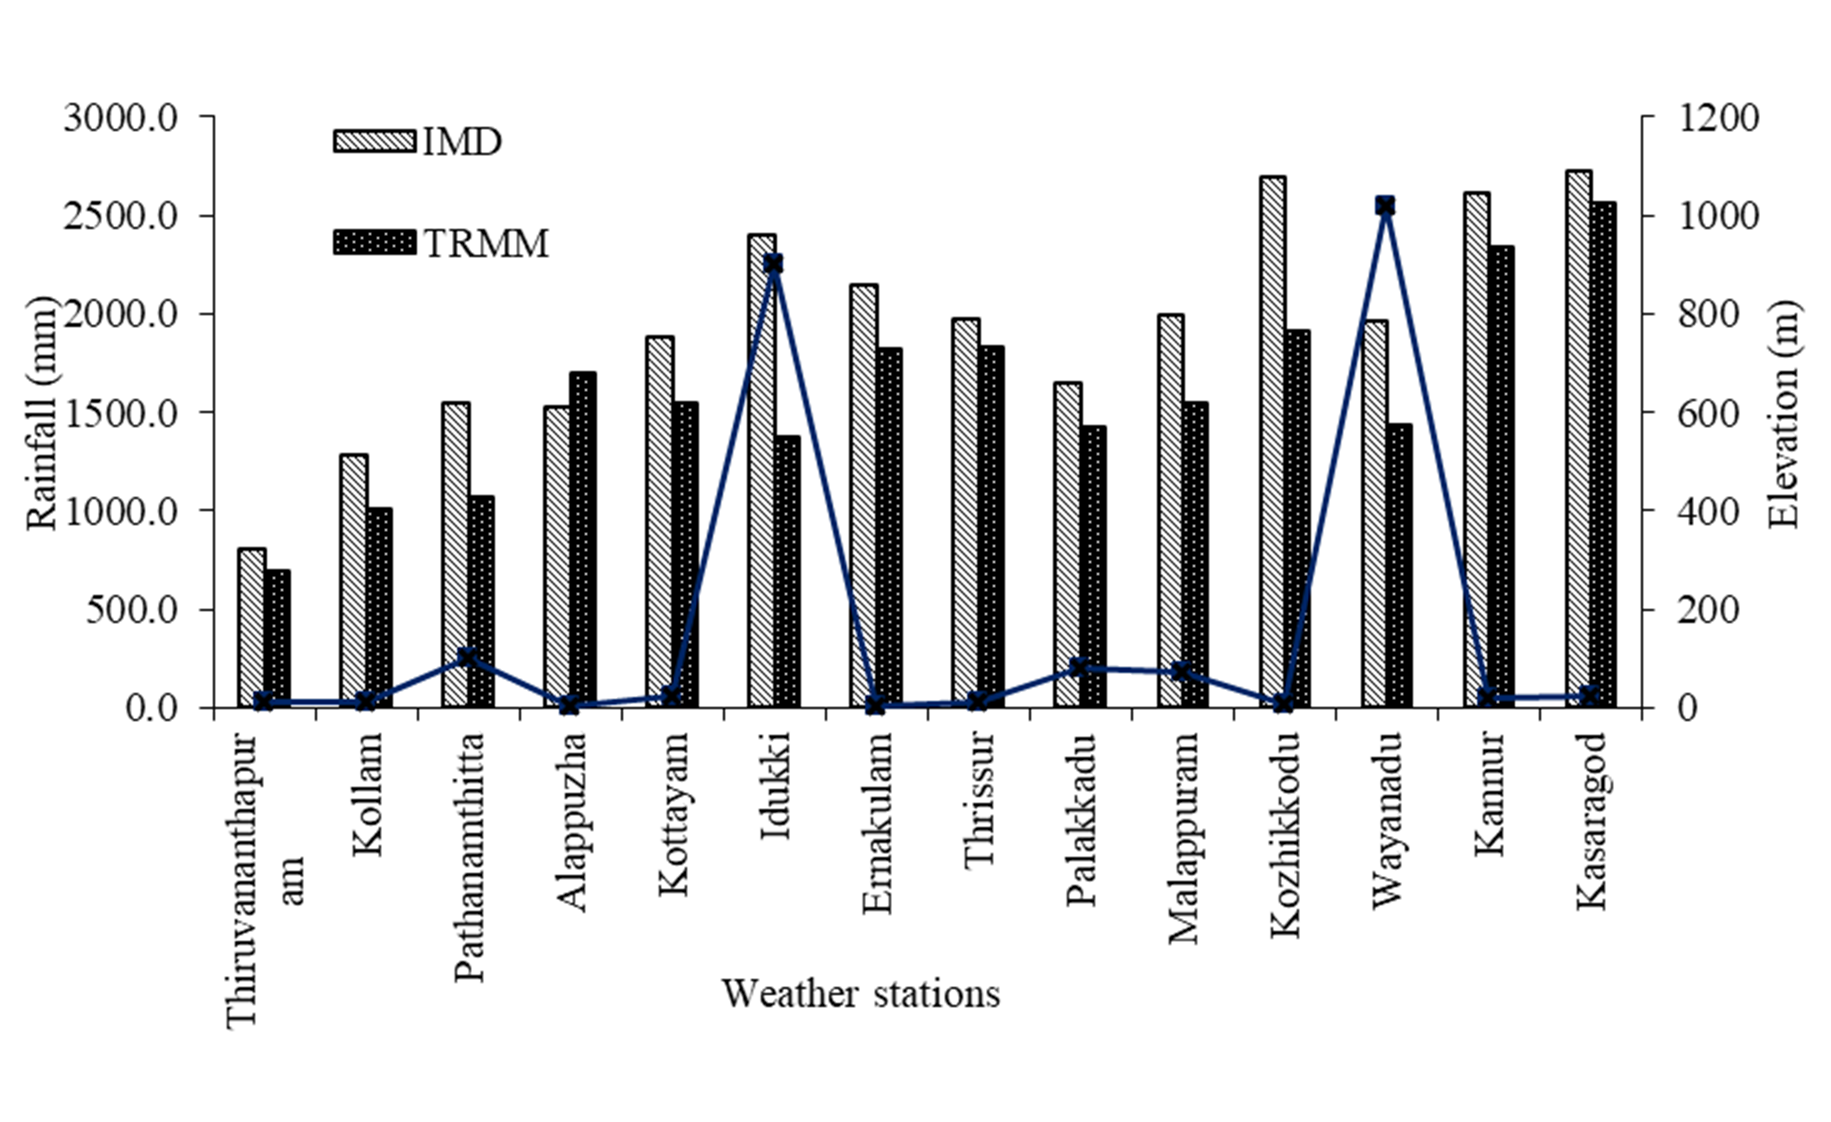
Kerala is a complex terrain with significant topographical changes, especially from the West (Arabian Sea) to East (Western Ghat) directions with an average width of approximately 70 km. In this short distance, we can observe seashore, plains and hills. Some regions are below sea level (Kuttanadu region) to 2695 m (Anamudi peak) above sea level. To compare station wise monsoon season rainfall, we selected 14 major IMD stations (Figure 7), representing each district for the last ten years (2009-2019; the year 2011 has no district wise rainfall station data available). Rainfall readings are frequently sensitive to location and altitude. It is decided to explore the TRMM rainfall features in relation to the terrain topography and elevation. The seasonal distribution (South-West Monsoon) and performance evaluated for 14 different topographical gauge locations. District wise prominent station names and their corresponding IMD, TRMM, bias value and elevation from mean sea level described in table 2. While analyzing the spatial pattern, it identified that the amount of monsoonal rainfall increases from South (Thiruvananthapuram -807 mm) to North (Kasaragod -2725 mm) gradually. It indicates that the Northern part of Kerala receives more rainfall than the Southern part. Similarly, Simon and Mohankumar (2004) reported that the North region receives more rainfall than the South region and stated that apart from the hilly region, the coastal region also receives abundant rainfall. The station data and TRMM data comparison obtained reasonable similarity with a correlation coefficient of 0.85, coefficient of determination of 0.72 (Figure 8) and RMSE of 453.02 mm. The bias value indicates that in most cases, TRMM underestimates the station data. A higher bias value was obtained primarily for higher elevation stations of Pathanamthitta (-0.3), Idukki (-0.4), Wayanad (-0.3) and one lower elevation station, Kozhikode (-0.3). The TRMM outcomes are sometimes diverge, especially during the monsoon, and it has several significant underestimations in assessing values at the higher elevation stations viz., Pathanamthitta (101 m), Idukki (900 m) and Wayanad (1018m) compared to the lower elevation stations (<80 m) (Figure 9). However, the research revealed that obtaining rainfall amounts in mountainous areas was challenging using the TRMM satellite data. Both Almazroui (2011) and Milweski et al. (2015) have recognized the significance of undulating topography in influencing satellite and rain gauge accuracy. They all exposed a low level of agreement between TRMM and rain gauges at the high altitudes. While the TRMM satisfactorily predict the rainfall data for entire lower elevation stations except for Kozhikode station (10m). When there is much convection over land, the TRMM precipitation radar algorithm likely underestimates the amount of precipitation (Iguchi et al., 2009; Kozu et al., 2009). Kumar et al., (2020) observed the dynamic characteristics of convective systems that resulted in widespread rainfall over west coast of Kerala. However, dense clouds around India’s West coast (8-20º N) indicate convective activity linked with low-pressure systems and active monsoon conditions in the southwest monsoon zone. Additionally, the higher level of emission from land obstructs the signal received by satellite sensors. As a result, an efficient statistical correction scheme may include stratifications for convective and stratiform precipitation, as well as rainfall over ocean and land (Chang et al., 2013). It may be the reason for the underestimation of station data of Kozhikode and some lower elevation station data by TRMM. However, because only ten years of station wise precipitation data were available, a fair conclusion could not be drawn in this context. Hence, a further detailed study using daily station wise data is necessary.
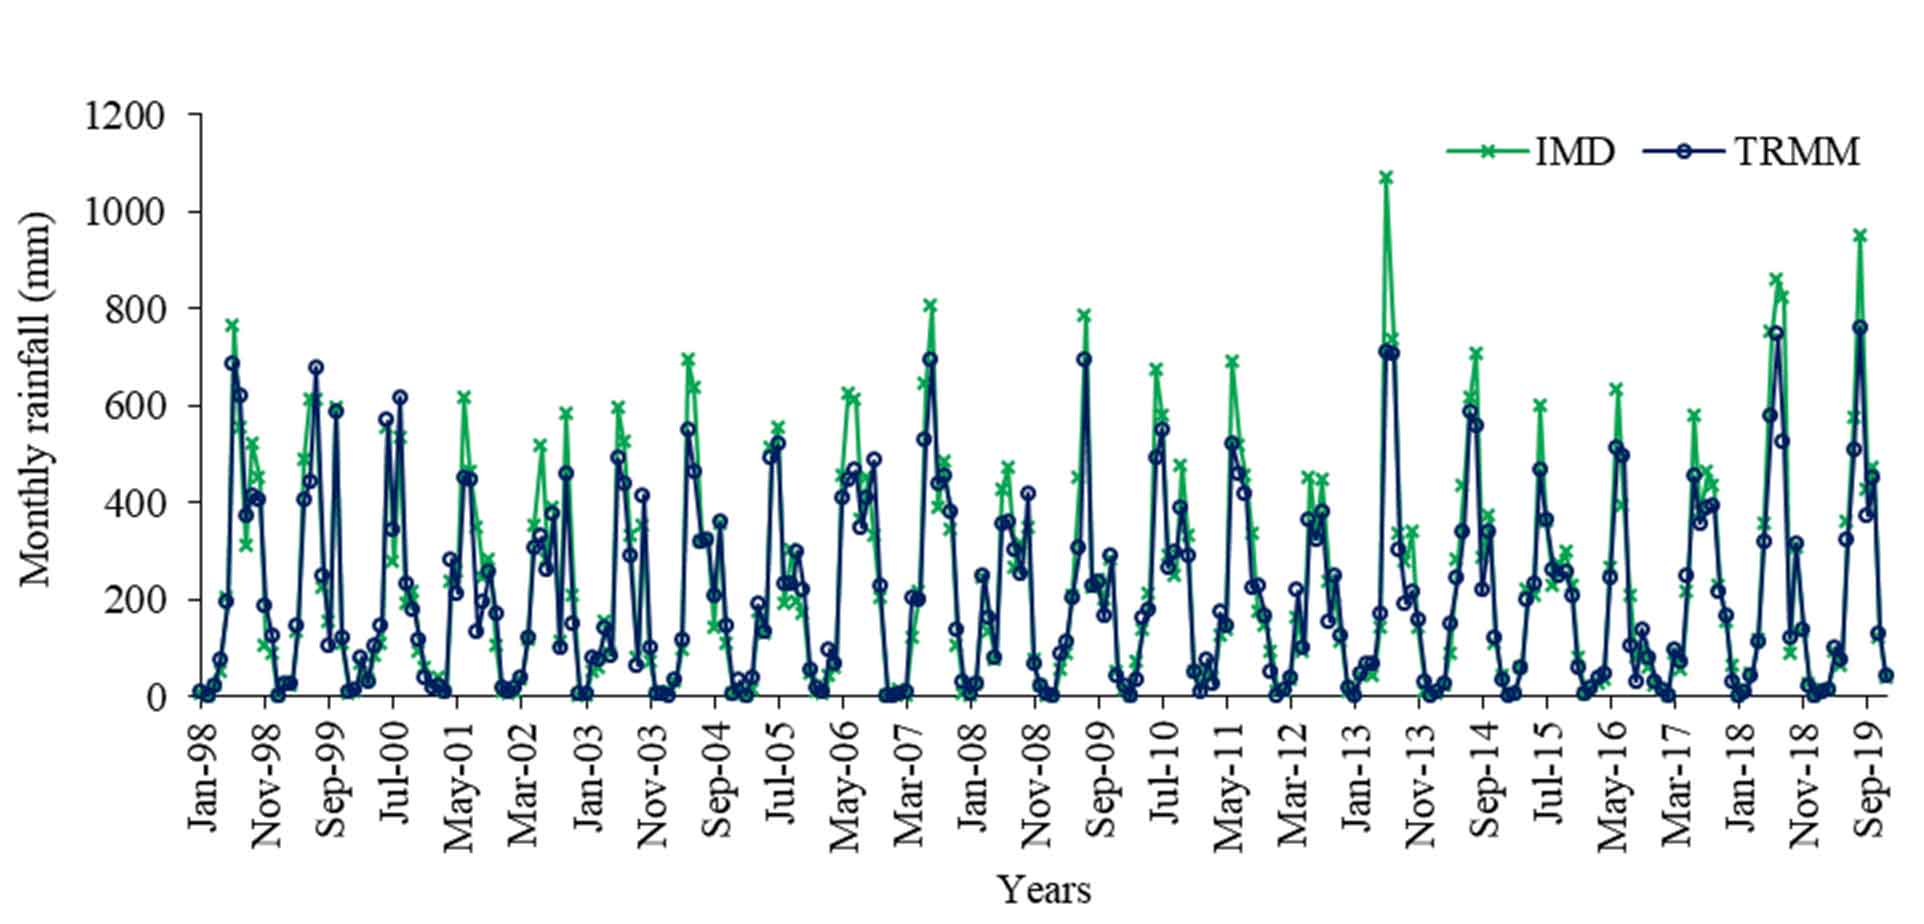
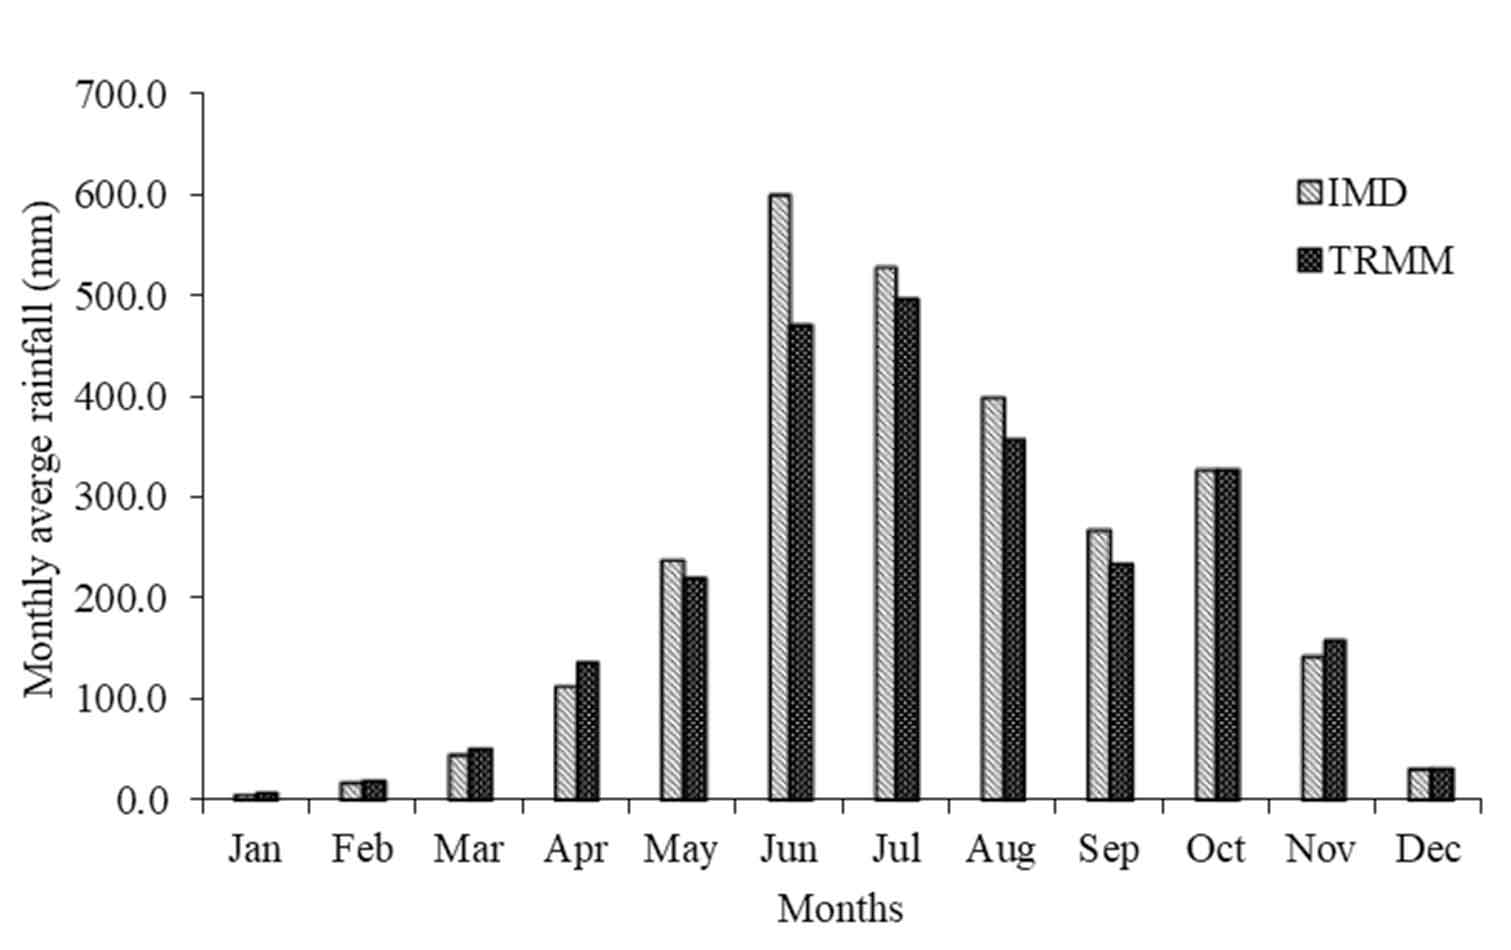
Between 1998 and 2019 (Table 3), the yearly average rainfall in Kerala, according to TRMM, was 2515 mm, with a standard deviation of 351.1 mm. While observatory data indicates it about 2722.3 mm and a standard deviation of 420.9 mm. TRMM measured seasonal rainfall of 410.6 mm, 1557.6 mm, 486.6 mm, and 60.6 mm during the pre-monsoon, southwest monsoon, post-monsoon, and winter seasons, respectively, while observatory data indicates 399 mm, 1794.5 mm, 470.1 mm, and 58.7 mm, respectively. Annual rainfall has a coefficient of variation about 14% for TRMM data and 15.5% for IMD data, indicating that the rainfall very consistently. July has the highest TRMM rainfall (496 mm) and accounts for 19.75% of the yearly rainfall (2515.5 mm), followed by June (18.66 per cent). August and September are the rainiest months, accounting for 14.2% and 9.3% of yearly precipitation, respectively. January has the least rainfall (7.7 mm) and contributes barely 0.3% to the yearly precipitation. According to IMD data, June (599.2 mm) is the wettest month, while January (7.1 mm) is the driest. This discrepancy is due to the underestimation of observatory rainfall by TRMM sensor.
Table 3. Monthly and seasonal means of rainfall over Kerala (1998-2019)
|
IMD-Rainfall
|
TRMM-Rainfall
|
|
Month/ Season
|
Mean (mm)
|
SD (mm)
|
CV (%)
|
Contribution
(%)
|
Mean
(mm)
|
SD
(mm)
|
CV
(%)
|
Contribution
(%)
|
|
January
|
7.1
|
7.5
|
106
|
0.26
|
7.7
|
8.3
|
107.5
|
0.31
|
|
February
|
18.6
|
19.6
|
105.4
|
0.68
|
20.8
|
26
|
124.9
|
0.83
|
|
March
|
46.1
|
48.8
|
106
|
1.69
|
52.3
|
51.5
|
98.5
|
2.08
|
|
April
|
114.2
|
53.3
|
46.7
|
4.2
|
137.2
|
59.1
|
43
|
5.45
|
|
May
|
238.7
|
154.6
|
64.8
|
8.77
|
221.1
|
118.3
|
53.5
|
8.79
|
|
June
|
599.2
|
148.5
|
24.8
|
22.01
|
469.4
|
108.7
|
23.2
|
18.66
|
|
July
|
527.1
|
169.3
|
32.1
|
19.36
|
496.8
|
145.9
|
29.4
|
19.75
|
|
August
|
399.5
|
199.2
|
49.9
|
14.67
|
357.5
|
154.3
|
43.2
|
14.21
|
|
September
|
268.7
|
133.3
|
49.6
|
9.87
|
233.9
|
117.4
|
50.2
|
9.30
|
|
October
|
327
|
129.5
|
39.6
|
12.01
|
327.6
|
117.5
|
35.9
|
13.02
|
|
November
|
143.1
|
69
|
48.2
|
5.26
|
159
|
58.5
|
36.8
|
6.32
|
|
December
|
33
|
29.5
|
89.3
|
1.21
|
32.1
|
26.8
|
83.3
|
1.28
|
|
Winter
|
58.7
|
38.2
|
65.1
|
2.16
|
60.6
|
34.6
|
57.0
|
2.41
|
|
Pre-Monsoon
|
399
|
152
|
38.1
|
14.66
|
410.6
|
117.3
|
28.6
|
16.32
|
|
SW-Monsoon
|
1794.5
|
374.4
|
20.9
|
65.92
|
1557.6
|
313.7
|
20.1
|
61.92
|
|
Post-Monsoon
|
470.1
|
155
|
33
|
17.27
|
486.6
|
126.1
|
25.9
|
19.34
|
|
Annual
|
2722.3
|
420.9
|
15.5
|
100
|
2515.5
|
351.1
|
14
|
100
|
For IMD data, in January and March (106%), the coefficient of variation was at its maximum, followed by February (105.4%) and December (89.3%), and the lowest in June (24.8%) and July (32.1%). The southwest monsoon (June-September) accounts for 65.92% of yearly precipitation. Pre-monsoon (March-May), post-monsoon (October-November), and winter (December-January) rainfall contribute 14.66%, 17.27%, and 2.16% to the yearly total, respectively. Seasonal rainfall throughout the monsoon season (June-September) is consistent, with a coefficient of variation of 20.1% for both data sets. Meanwhile, rainfall in the winter is unpredictable due to the higher coefficient of variation (65.1%).
4.2.1 Annual Trends
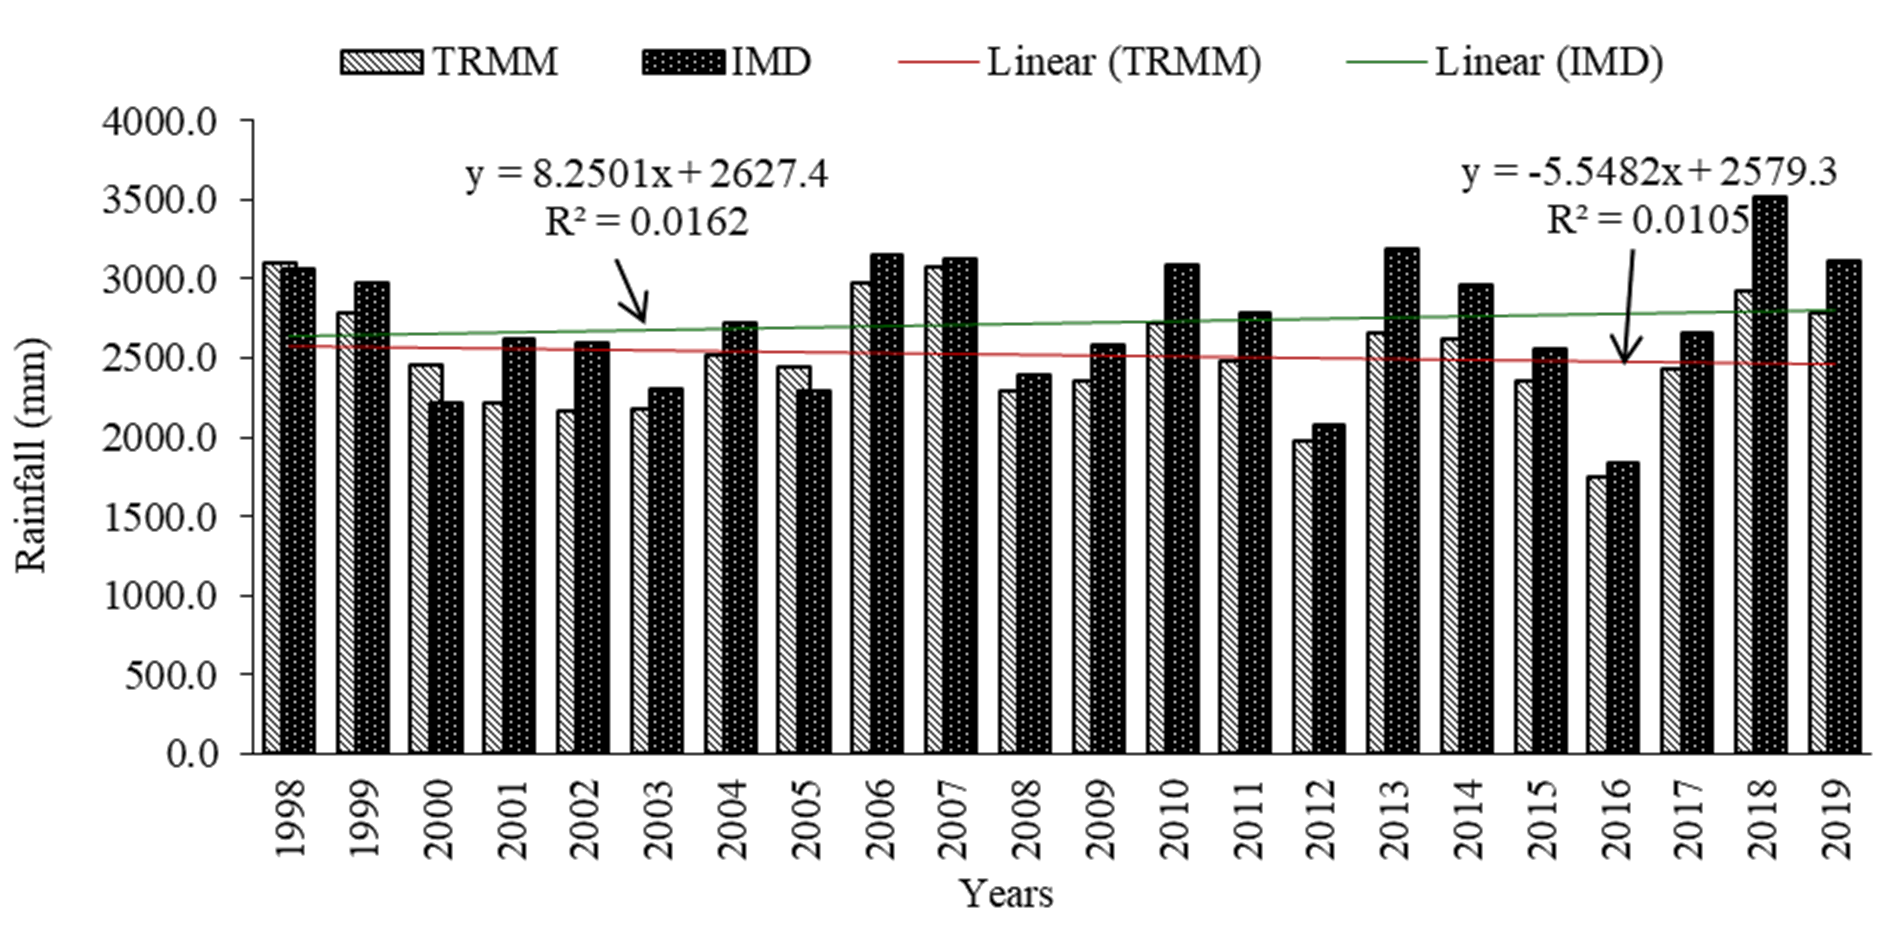
Between 1998 and 2019, the TRMM-derived mean annual rainfall across Kerala exhibited an insignificant decreasing trend. The Mann Kendall test yields a -9 S value. The magnitude of the trend determined by Sen’s slope is of -2.47 mm/year. At the same time, IMD observatory data from 1998 to 2019 over Kerala revealed an insignificant increasing trend. A positive S value of 21 obtained through the Mann Kendall test. The trend’s magnitude determined by Sen’s slope of 10.05 mm/year. The discrepancy is due to the underestimation of rainfall during the rainy months and overestimated during the drier months.
Figure 10 shows that the TRMM under predicts the rainfall in most cases, and the trend line of TRMM data is slightly decreasing, while the IMD data is relatively stable. The primary cause of the disparities in the two data sets is an underestimation of rainfall. It shows that the TRMM data can follow the trend of observatory data in most years. However, it is essential to note that no significant trend observed in the annual scale of rainfall during 1998-2019. As stated above, the validation of the data set is necessary for the TRMM studies in Kerala.
4.2.2 Monthly Trends
Individual monthly rainfall behaviour examined using the Man-Kendall test and Sen’s slope (Table 4). It is worth noting that rainfall in January exhibited a declining trend that was statistically significant at the 0.05 level for the TRMM data, whereas observatory data showed a decreasing trend but was not statistically significant. March, July, August, September, and December rainfall had an insignificant increase in TRMM and observatory data. January, February, April, May, June, and October rainfall revealed a declining trend that is statistically insignificant for both TRMM and observatory data. In November, the observatory data indicated an increasing trend, while the TRMM data indicated a decreasing trend, and both data indicated an insignificant trend.
Table 4. Man-Kendall test Sen’s slope statistics of monthly and seasonal rainfall
|
|
IMD
|
TRMM
|
|
Month/ Season
|
Mann-Kendall (S)
|
Sen’s Slope
(Q)
|
Mann-Kendall (S)
|
Sen’s Slope
(Q)
|
|
January
|
-23
|
-0.1
|
-76
|
-0.32*
|
|
February
|
-21
|
-0.29
|
-0.29
|
-0.38
|
|
March
|
49
|
1.21
|
39
|
0.93
|
|
April
|
-23
|
-1.29
|
-19
|
-1.16
|
|
May
|
-15
|
-1.63
|
-1
|
-0.21
|
|
June
|
-13
|
-1.21
|
-13
|
-2.01
|
|
July
|
37
|
5.45
|
31
|
3.15
|
|
August
|
53
|
9
|
39
|
6.1
|
|
September
|
15
|
4.2
|
5
|
1.12
|
|
October
|
-47
|
-4.37
|
-59
|
-6.94
|
|
November
|
39
|
1.2
|
-11
|
-0.79
|
|
December
|
51
|
1.23
|
39
|
0.94
|
|
Winter
|
1
|
0.13
|
-31
|
-0.73
|
|
Pre-Monsoon
|
-25
|
-6.44
|
-31
|
-4.67
|
|
SW-Monsoon
|
41
|
17.82
|
29
|
11.84
|
|
Post-Monsoon
|
-17
|
-2.02
|
-65
|
-7.91**
|
|
* Significant values at a<0.05, ** Significant values at a<0.1
|
Considering observatory data (IMD) from 1998 to 2019, there was a drop in June’s contribution to yearly rainfall (24 to 22 %) from 1991 to 2005 (Table 5). When comparing to rainfall data for June, the contribution of rainfall is more stable in July. At the same time, rainfall contributions increased in August (12.2 to 14.7%) and September (7.6 to 9.9%). A slight decrease in the yearly rainfall contribution observed throughout October and November. Over Kerala, the percentage rainfall contribution during the southwest monsoon increased while the post-monsoon season is decreasing and relatively consistent during the pre-monsoon and winter seasons. Recent decades have seen the development of these phenomena.
Table 5. Seasonal rainfall contribution to annual rainfall during 1998 to 2019 and 1991-2005
|
|
Krishnakumar et al. (2009)
|
IMD
|
TRMM
|
|
Month/ Season
|
1991-2005
(%)
|
1998-2019
(%)
|
1998-2019
(%)
|
|
June
|
24.0
|
22.0
|
18.7
|
|
July
|
19.7
|
19.4
|
19.8
|
|
August
|
12.2
|
14.7
|
14.2
|
|
September
|
07.6
|
09.9
|
09.3
|
|
October
|
13.3
|
12.0
|
13.0
|
|
November
|
06.3
|
05.3
|
06.3
|
|
Winter
|
02.4
|
02.2
|
02.4
|
|
Pre-Monsoon
|
14.4
|
14.7
|
16.3
|
|
SW-Monsoon
|
63.6
|
65.6
|
61.9
|
|
Post-Monsoon
|
19.5
|
17.3
|
19.3
|
4.2.3 Decadal Trends
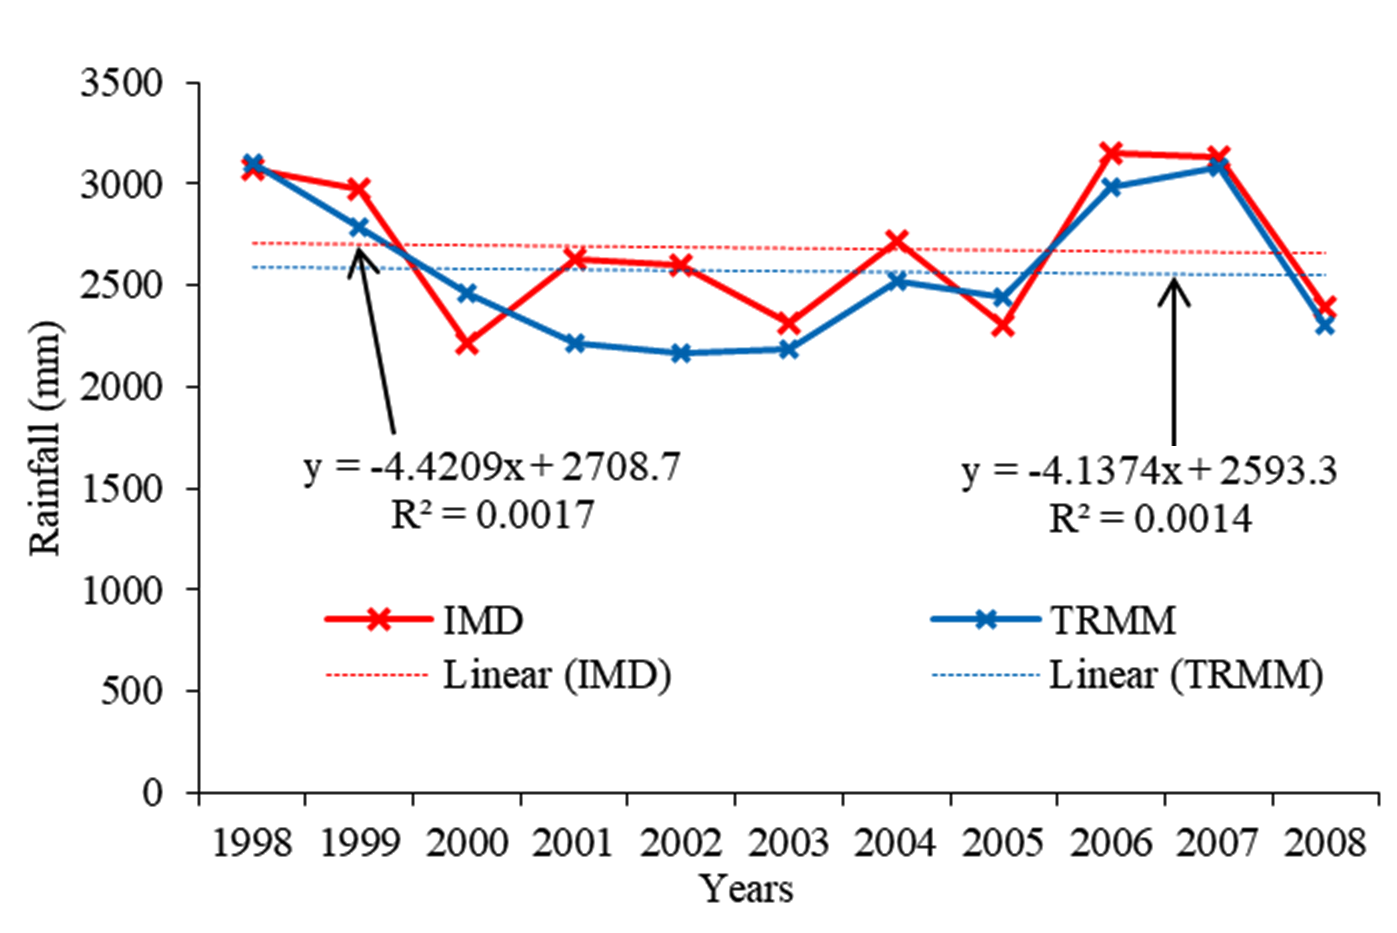
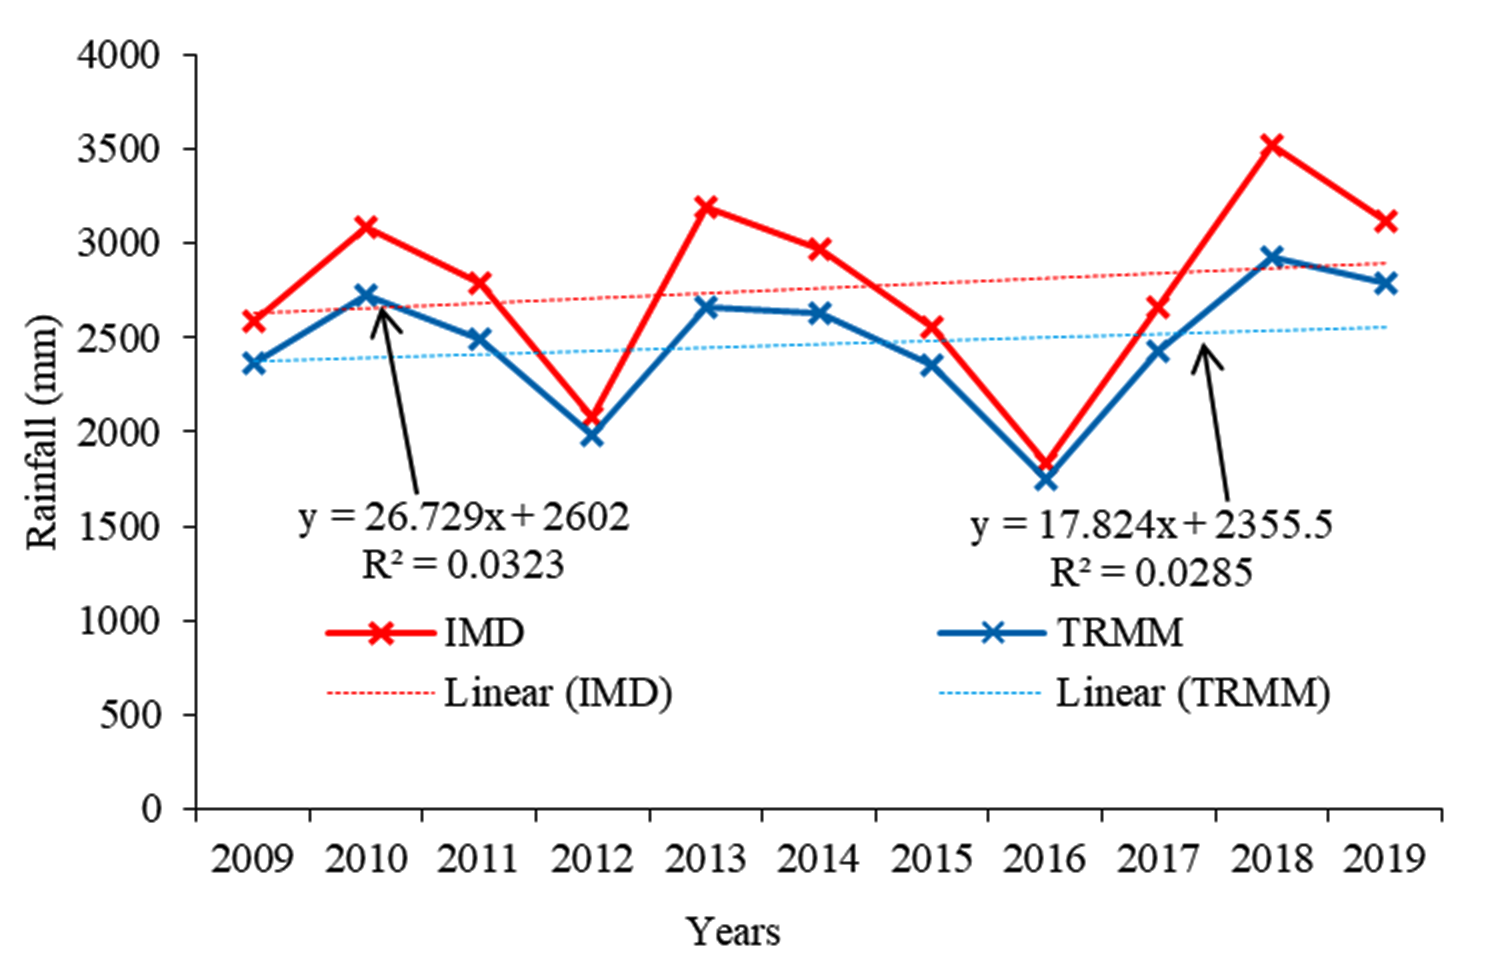
The monthly rainfall data is divided into two sections to determine the variability and trend of rainfall over two time periods: 1998-2008 and 2009-2019 (Figure 11). Between 1998 to 2008, yearly rainfall decreased at a rate of 3.27 mm/year and 5.50 mm/year for observatory data and TRMM data, respectively, with a Man-Kendall value of -3 and -1. It is also worth noting that rainfall increased between 2009 and 2019 using both observatory and TRMM data, with a Mann-Kendall S value of 7 for both and a rate of 24.58 mm/year and 34.50 mm/year, respectively. However, the trend found throughout these periods is statistically insignificant. Extreme precipitation events have strengthened the frequency and intensity in India over the previous few decades (Roxy et al., 2017) and the frequency of land falling tropical cyclones over the Arabian Sea has been increasing (Mohapatra, 2021). Thus, it could be the rising trend in rainfall over recent years. In addition, Mukherjee et al. (2018) observed an increase in heavy rainfall in India due to anthropogenic global warming, using data from the coupled model inter-comparison project 5 (CMIP5).
To explore the recent rainfall trend over Kerala, the most recent years, viz. 2009 to 2019 monthly, seasonal, and yearly rainfall, were analyzed using mean, SD, CV and percentage of contribution of annual rainfall (Table 6). The percentage contribution of rainfall during southwest rainfall increased from 1871 to 2005 (base period), while the post-monsoon and pre-monsoon showed a slight decrease compared to the base period. Compared to the base period, the months of August and October show a slight decrease in percentage contribution, while the rest of the month shows an approximately equal contribution to rainfall. The vital variation observed in the case of the variability of monthly and seasonal rainfall. The CV during the June, August, October months and the SW-monsoon and post-monsoons are increasing. It indicates that the consistency of rainfall during these months and seasons has decreased in the last decade, which means that uncertainty is increasing. At the same time, it is worth noting that annual rainfall is increasing compared to the baseline period. The frequent drought and flood years are the primary causes of these variations.
Table 6. Monthly and seasonal means of rainfall during 1871 to 2005 and 2009-2019
|
IMD-Rainfall (1871-2005)
|
IMD Rainfall (2009-2019)
|
|
Month/ Season
|
Mean (mm)
|
SD (mm)
|
CV (%)
|
Contribution
(%)
|
Mean
(mm)
|
SD
(mm)
|
CV
(%)
|
Contribution
(%)
|
|
January
|
12
|
17
|
146.1
|
0.26
|
7.4
|
7.5
|
100.6
|
0.27
|
|
February
|
17
|
19
|
115.4
|
0.68
|
15
|
17.8
|
118.8
|
0.54
|
|
March
|
36
|
28
|
78.5
|
1.69
|
46.4
|
22
|
47.5
|
1.68
|
|
April
|
112
|
52
|
46.5
|
4.2
|
105.2
|
55
|
52.3
|
3.81
|
|
May
|
246
|
159
|
64.6
|
8.77
|
198.2
|
86.3
|
43.5
|
7.18
|
|
June
|
684
|
194
|
28.4
|
22.01
|
607.9
|
196.3
|
32.3
|
22.01
|
|
July
|
632
|
209
|
33.2
|
19.36
|
557
|
181
|
32.5
|
20.16
|
|
August
|
373
|
157
|
42
|
14.67
|
466.1
|
255.1
|
54.7
|
16.87
|
|
September
|
224
|
122
|
54.7
|
9.87
|
265.5
|
113.8
|
42.9
|
9.61
|
|
October
|
288
|
108
|
37.5
|
12.01
|
286.1
|
122.1
|
42.7
|
10.36
|
|
November
|
156
|
85
|
54.4
|
5.26
|
164
|
82
|
50
|
5.94
|
|
December
|
38
|
39
|
102.1
|
1.21
|
43.6
|
26.8
|
61.6
|
1.58
|
|
Winter
|
65.3
|
65.3
|
14.4
|
2.16
|
66
|
38.4
|
58.2
|
2.39
|
|
Pre-Monsoon
|
393.7
|
393.7
|
41.5
|
14.66
|
349.8
|
103.9
|
29.7
|
12.66
|
|
SW-Monsoon
|
1913.5
|
377.7
|
19.7
|
65.92
|
1896.5
|
403.8
|
21.3
|
68.65
|
|
Post-Monsoon
|
444.1
|
138.4
|
31.2
|
17.27
|
450.1
|
169
|
37.5
|
16.29
|
|
Annual
|
2722.3
|
420.9
|
14.4
|
100
|
2762.4
|
493.4
|
17.9
|
100
|
The increase in southwest monsoon rainfall and decreasing post-monsoon season rainfall during 1998-2019 is a significant finding in this study. The increase in rainfall more pronounced from July to September but not in June during the monsoon season. However, this trend is statistically insignificant. All other studies concur with Kerala’s southwest monsoon rainfall is on the decline (Soman et al., 1988; Rupa Kumar et al., 1992; Guhathakurta and Rajeevan, 2007; Krishnakumar et al., 2009). However, this study shows an increasing insignificant trend. The pivotal factor is that all of these analyses take the long-term climate of the 20th century into account. Moreover, tropical cyclones have increased in frequency by a factor of two over the Bay of Bengal and Arabian Sea (Singh et al., 2001; Mohapatra, 2021). As a result, it could cause the current insignificant increase in the trend of rainfall.
4.3 Seasonal Trends
4.3.1 Winter (December, January and February)
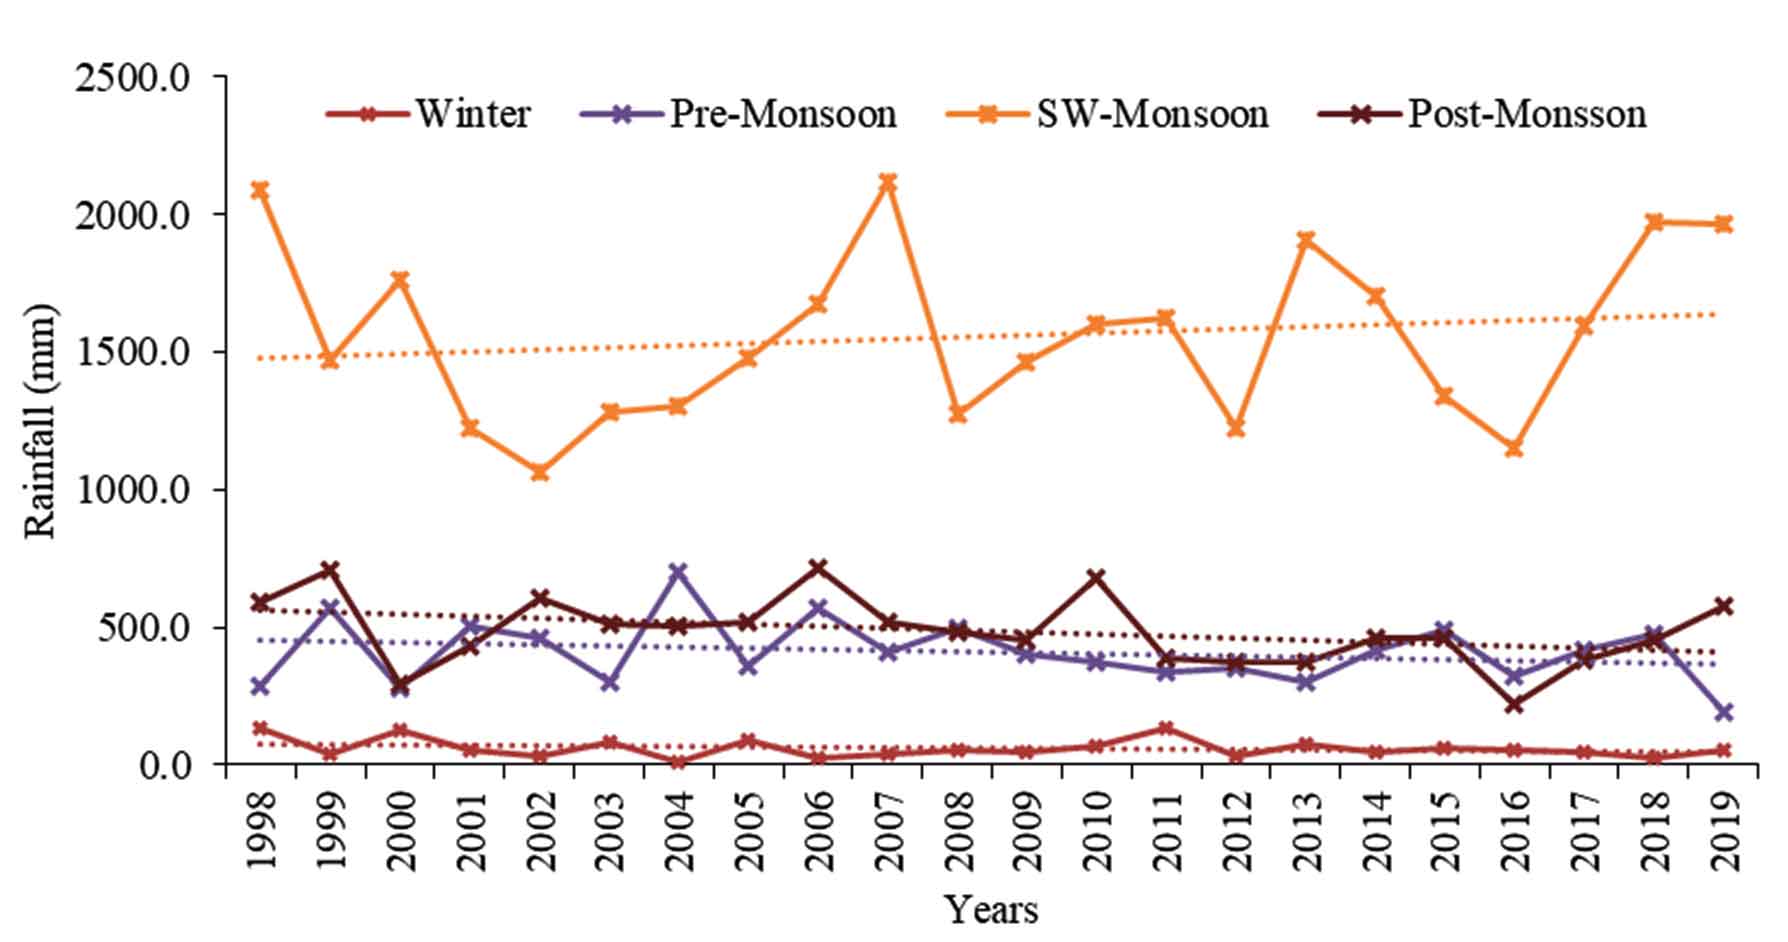
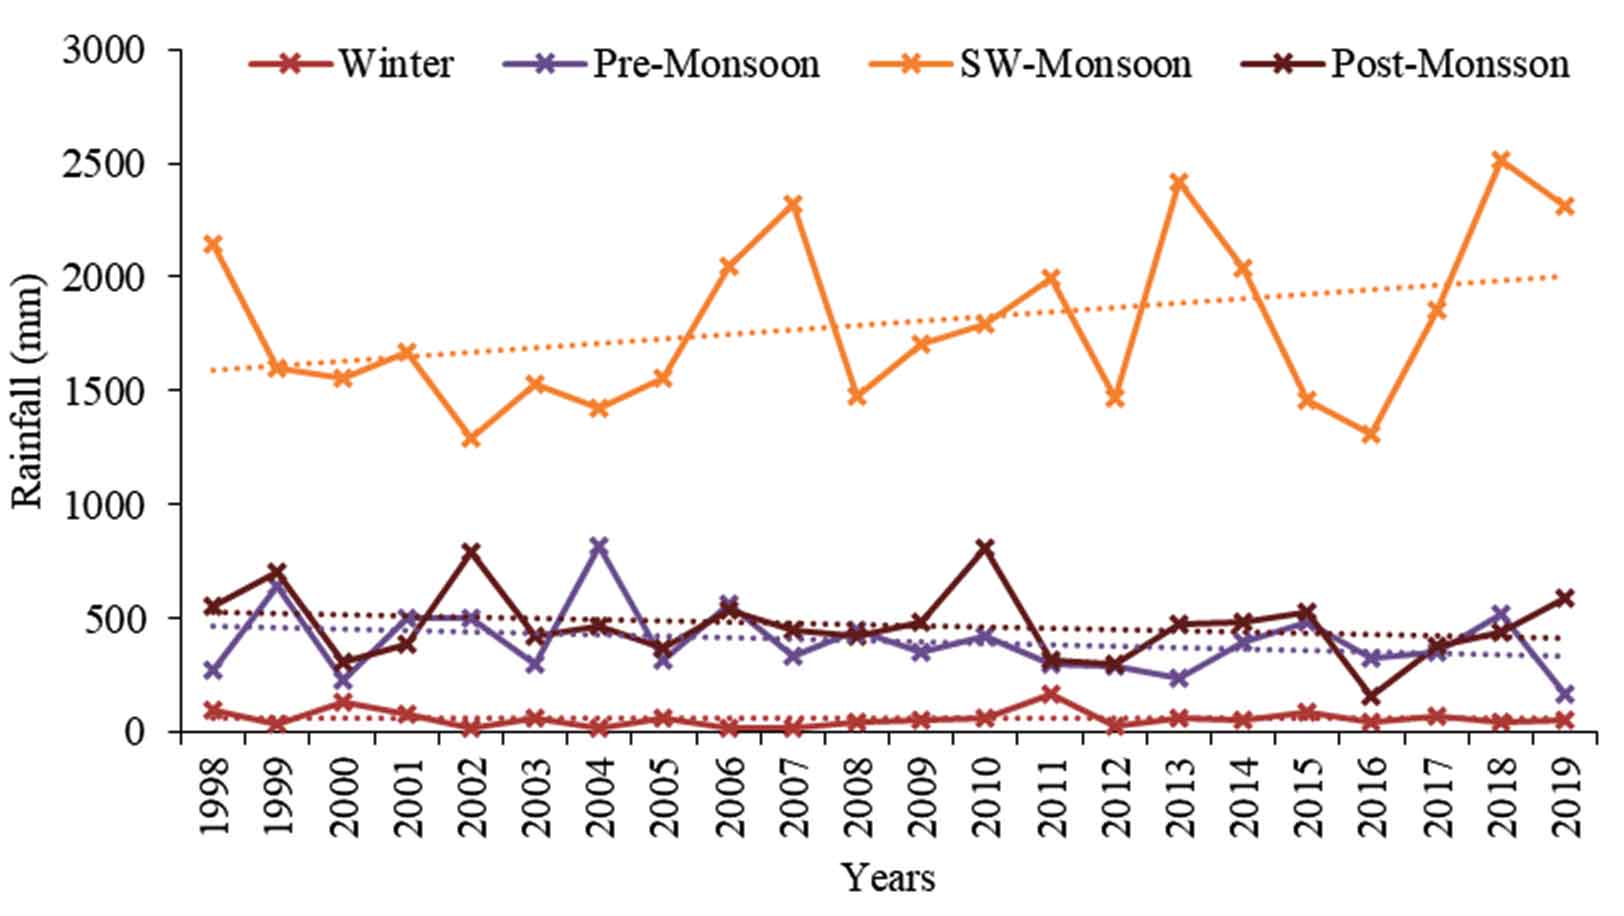
The TRMM data show a decreasing trend in winter rainfall, while the observatory data show a rising trend, which is not statistically significant (Figure 12a and 12b). The only season in which contradictory results received is the winter season. When observatory data (IMD) from 1998 to 2019 analyzed, the rainfall contribution from 1991 to 2005 remained relatively constant (2.4 to 2.2%) (Table 5). It also identified that TRMM overestimates rainfall in these months.
4.3.2 Pre-Monsoon (March, April and May)
During 1998 and 2019, both observatory and TRMM data indicated a reduction in pre-monsoon rainfall. The rainfall trend observed to be slightly decreasing during this period (Figure 12). However, when comparing winter rainfall (observatory data) from 1991 to 2005 to the current time, the pre-monsoon rainfall appears to be very consistent (14.4 to 14.7%) (Table 5).


 ,
K. R. Sooryamol 2
,
K. R. Sooryamol 2