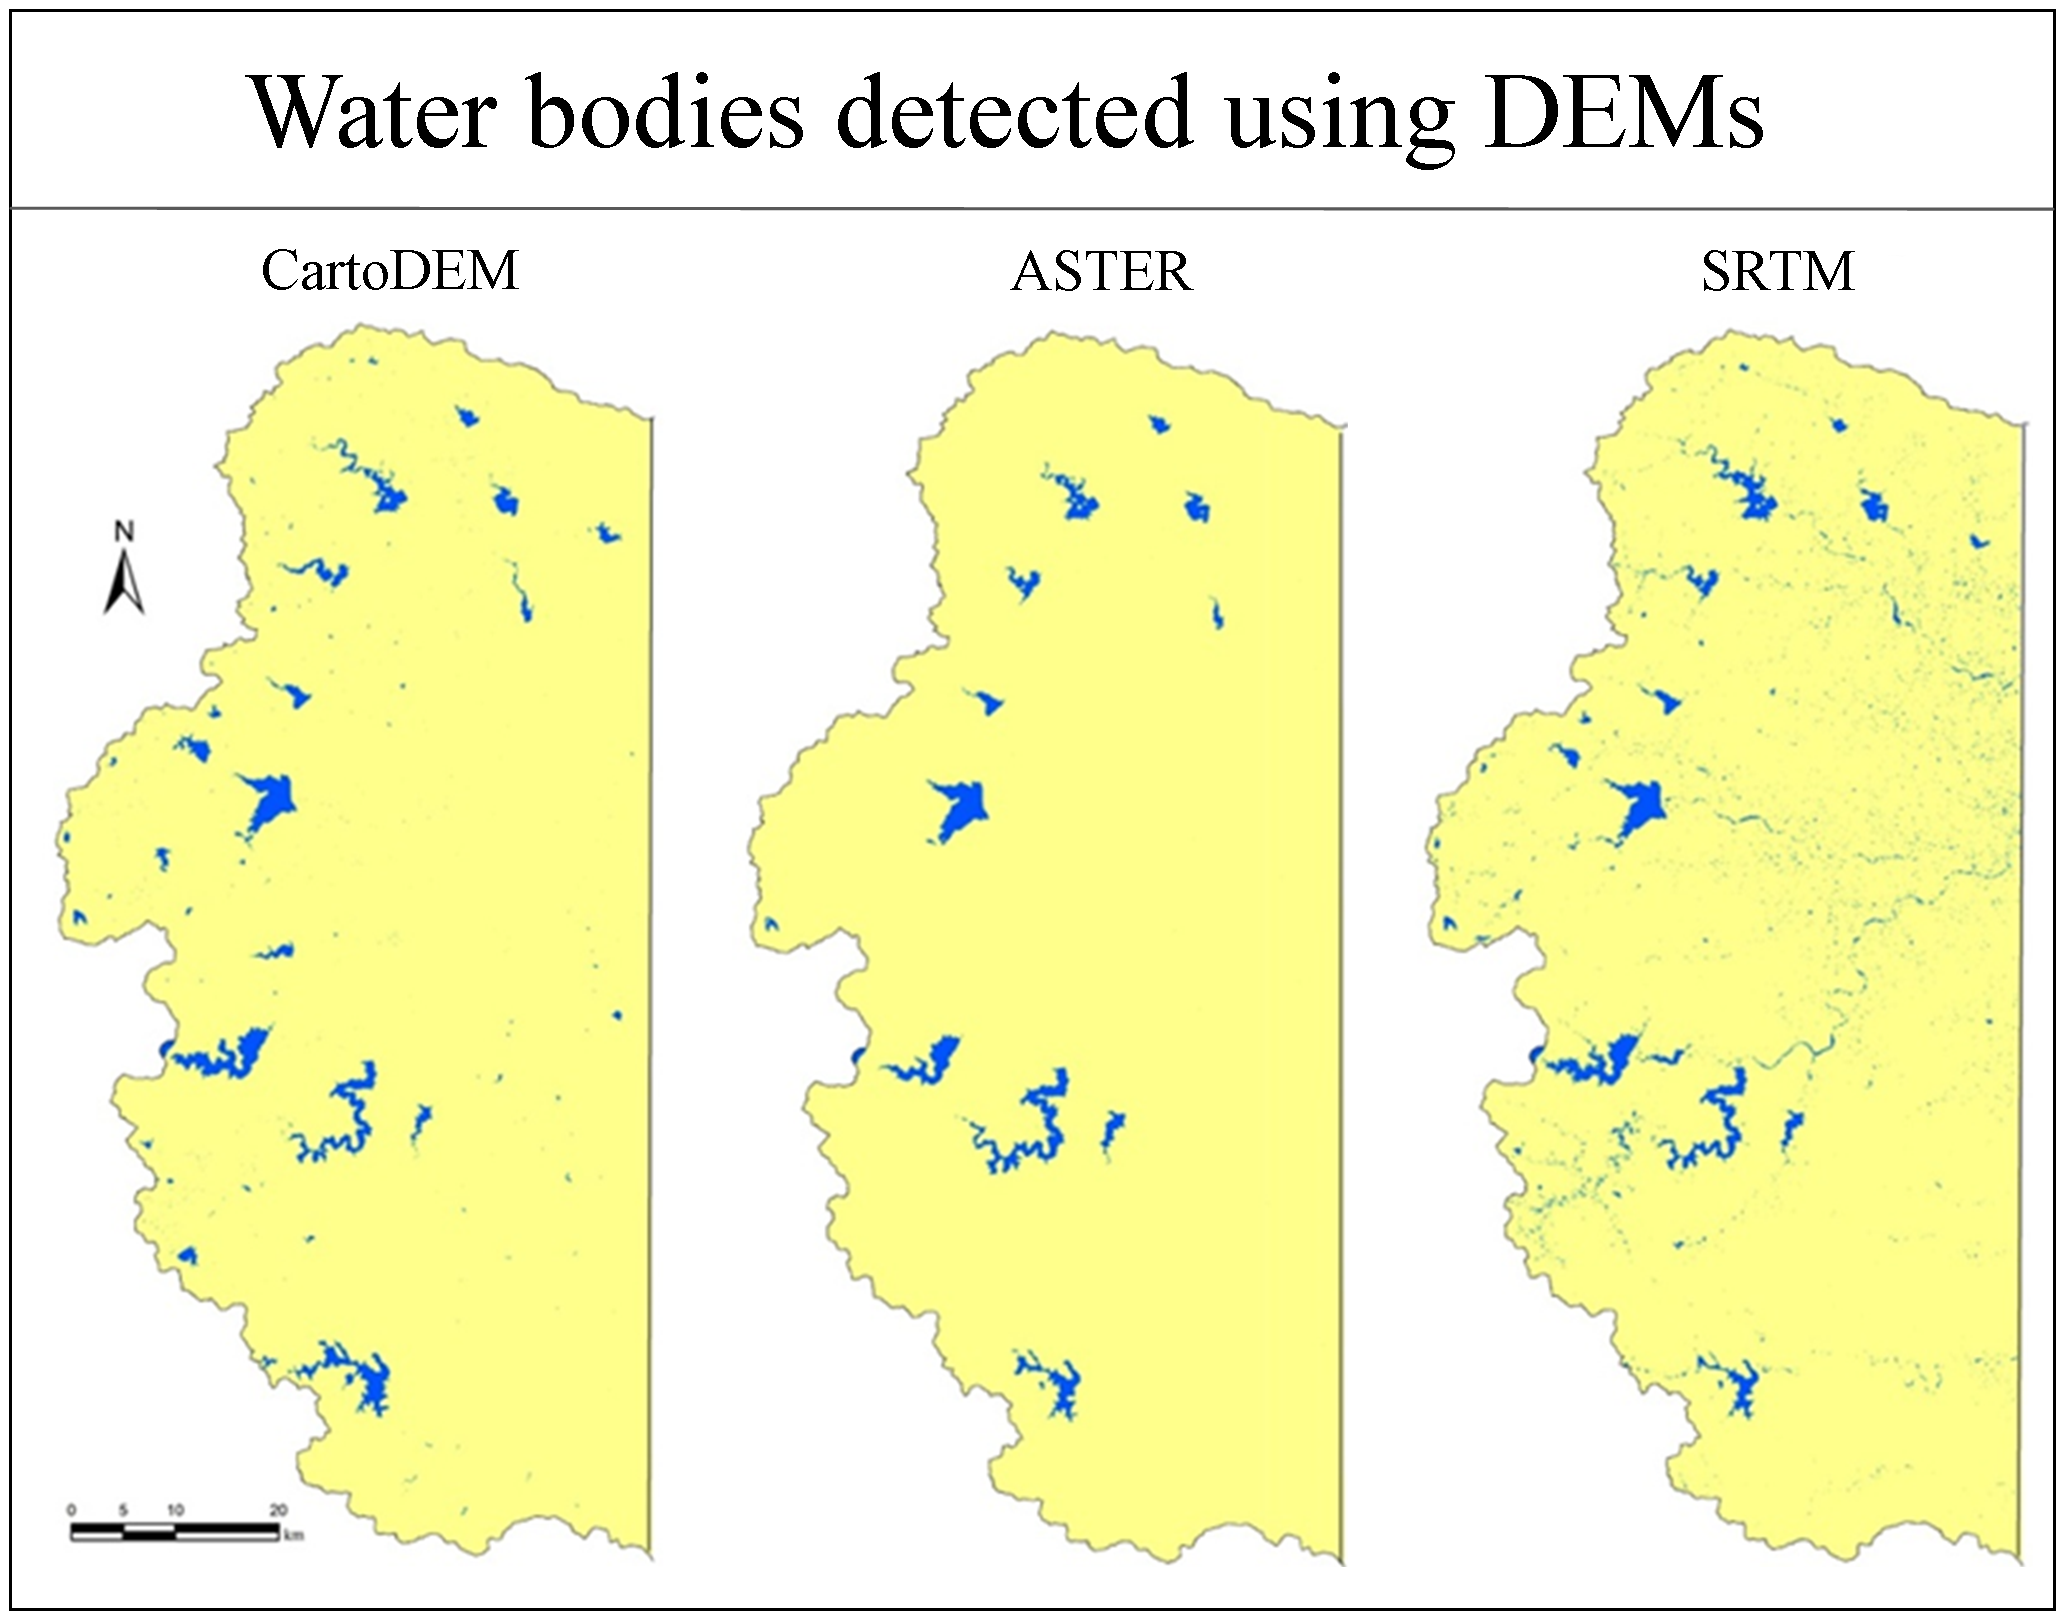
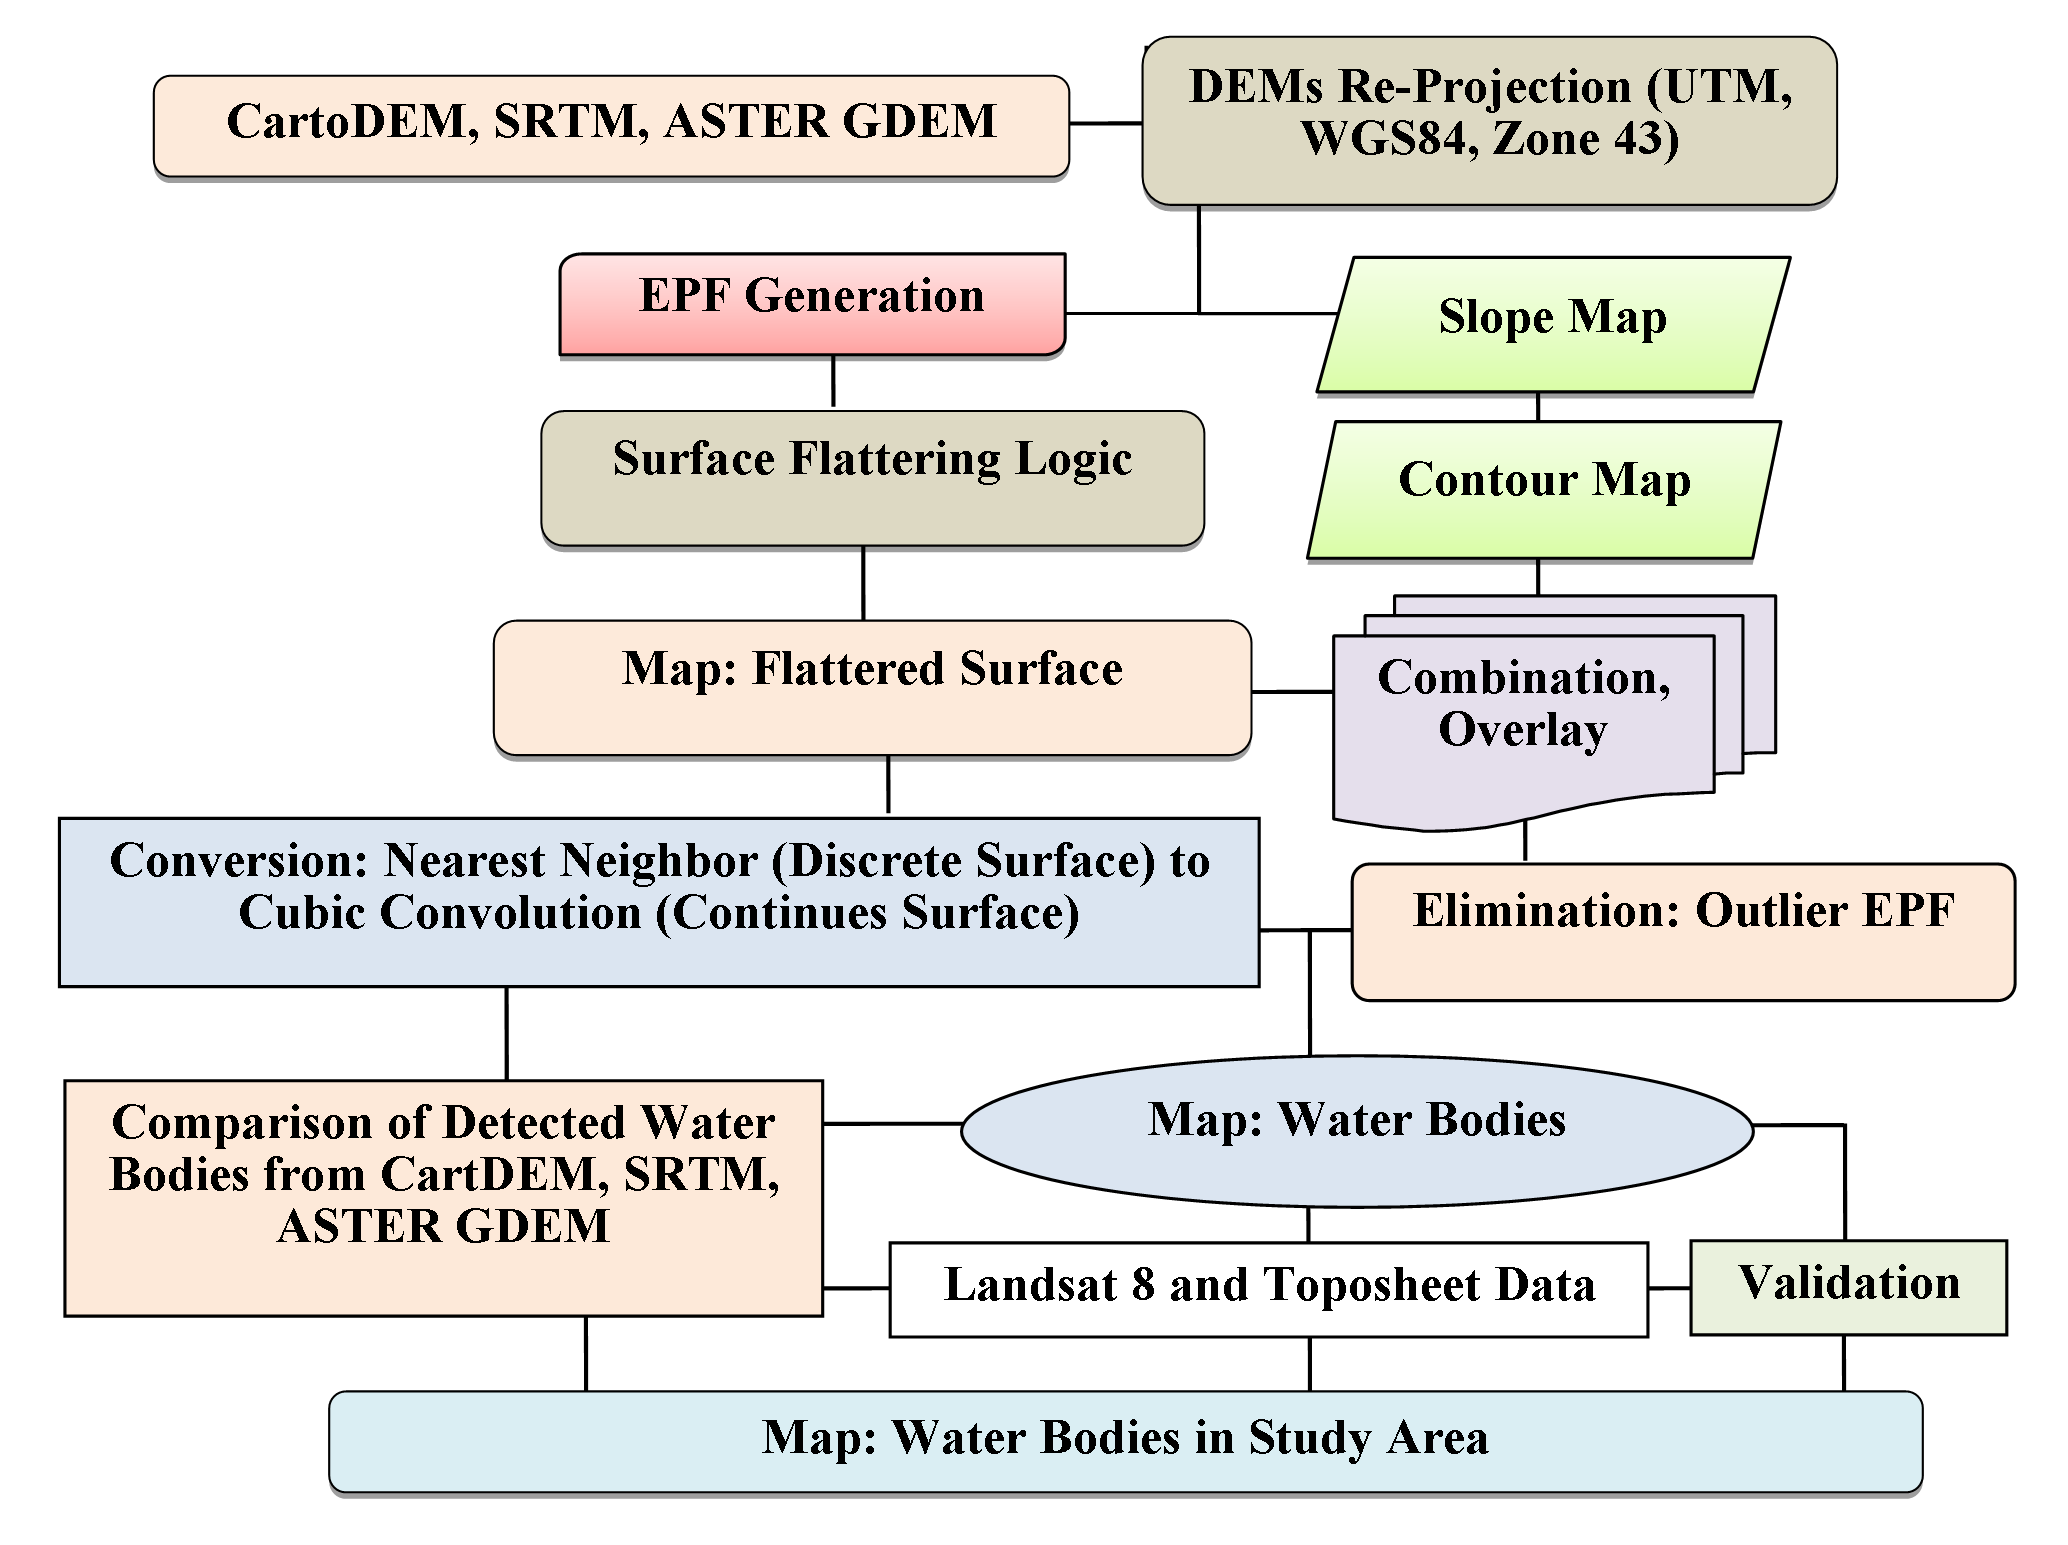
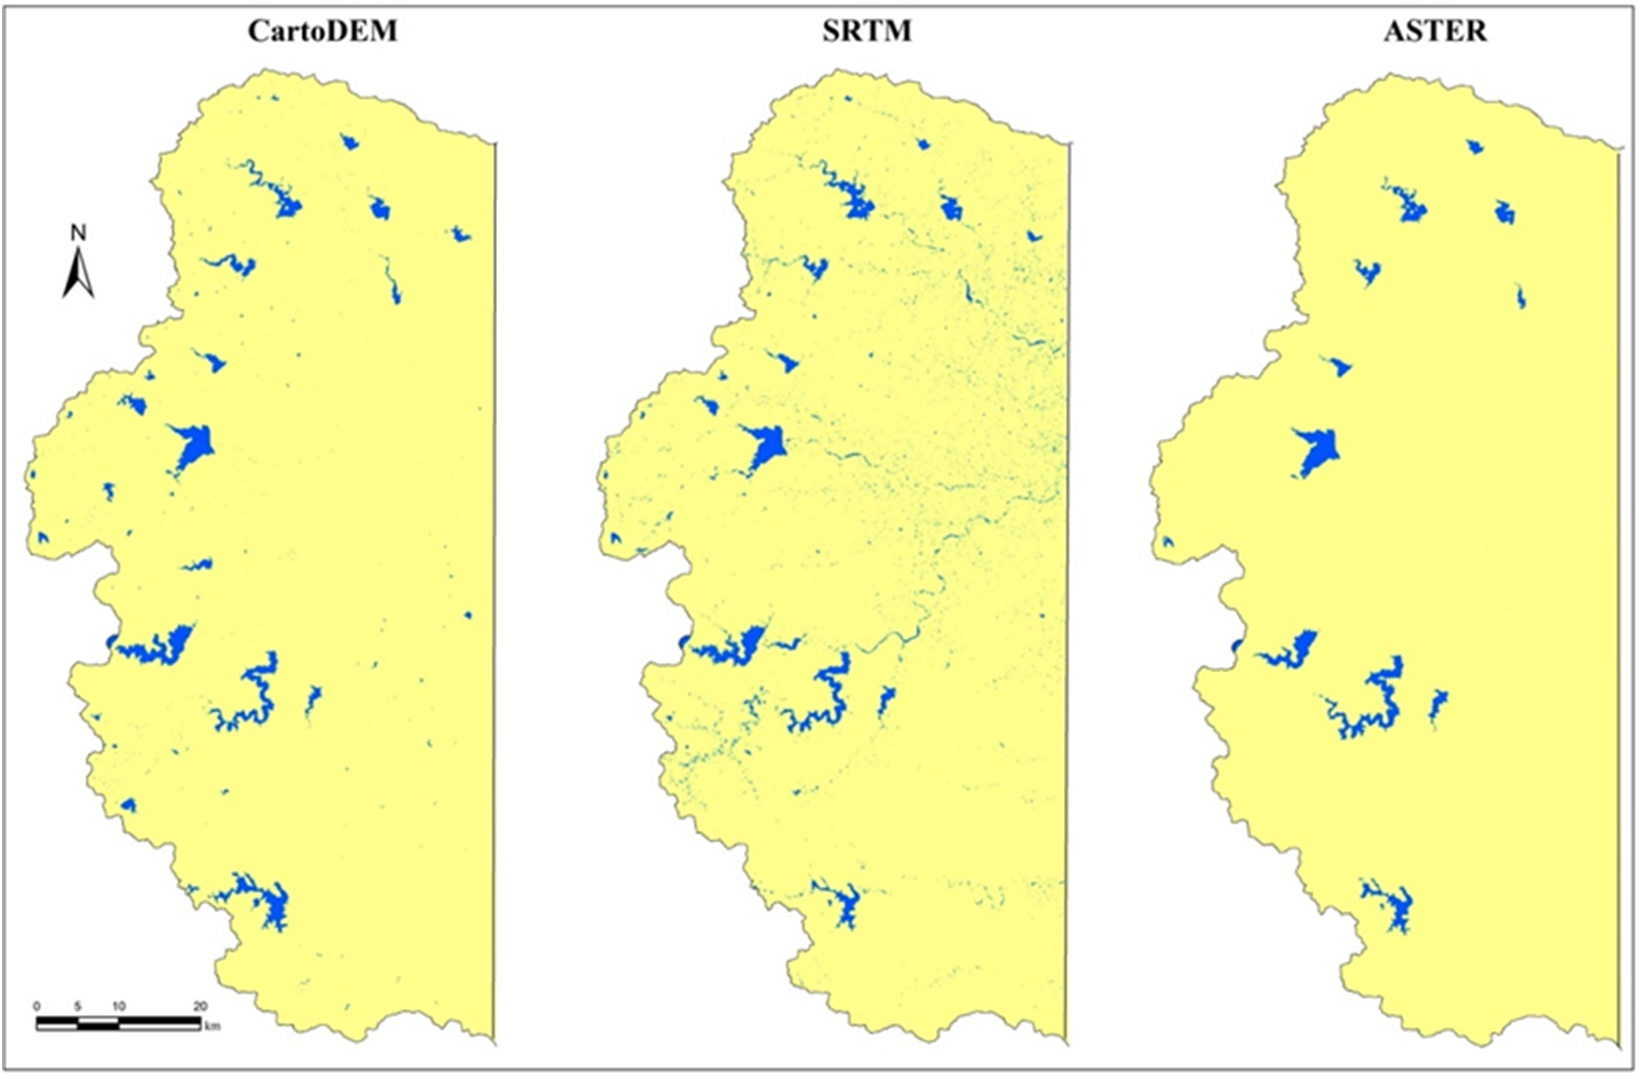
Detection and delineation of water bodies were carried out from CartoDEM, SRTM and ASTER GDEM data with comparative analysis by following steps: (I) generation of EPF from three DEMs, (II) primary detection of water bodies, (III) preparation of contour and slope maps and its combination with EPF, (IV) conversion of detected water bodies from nearest neighbor to cubic convolution and omission of outliers EPF, (V) final detection and delineation of water bodies from three DEMs and its combination with slope and contour maps, and (VI) Comparison of detected water bodies and its validation from Landsat 8 data and topographic maps (SOI) (Figure 2).
3.1 Database and Software used
Remotely sensed orthorectified CartoDEM, SRTM and ASTER GDEM datasets were used for detection and delineation of WBA. These DEMs could be used to monitor, detection and delineation of the surface WBA especially in inaccessible areas. For a comparative analysis of detecting and delineated water bodies, CartoDEM, SRTM and ASTER GDEM were re-projected to a common projection (UTM WGS84, Zone 43) in ArcGIS software. The ‘Hydrology’ toolset in ArcGIS, developed by ESRI (2004), has been used for DEM preprocessing and surface stream simulation. The precise co-registration among the DEMs is a pre-requisite because DEMs are sensitive to mis-registration for areas and relief as a shift of a fraction of a pixel may cause significant changes in the elevation difference (Ni et al., 2014). Details of datasets are given in Table 1.
Table 1. Details of used database
|
Database used
|
Spatial Resolution
|
Data Sources
|
|
SRTM DEM
|
90 meter
(3-arc-second)
|
http://gdem.ersdac.jspacesystems.or.jp
|
|
CartoDEM V1
|
30 meter
(1-arc-second)
|
http://bhuvan.nrsc.gov.in
|
|
ASTER GDEM
|
30 meter
(1-arc-second)
|
http://gdem.ersdac.jspacesystems.or.jp
|
3.1.1 CartoDEM
The Cartosat-1 DEM (CartoDEM version 1) is an Indian DEM developed by the Indian Space Research Organization (ISRO). This DEM has been used in multiple sectors for planning and decision making. It is derived from the Cartosat-1 stereo payload launched in May 2005 by ISRO, India. The primary output is a tile of 7.5ʹ × 7.5ʹ extents with DEM spacing of 1/3 arc-sec, and co-registered ortho-image at resolution 1/12 arc-sec (NRSC, 2015). The CartoDEM is a land surface model of digital elevation and covers land and covers
land surfaces within India (Das et al., 2016). Freely available 1 arc second spatial resolution NRSC CartoDEM V1 and CartoDEM V1.1R1 1×1 degree tile was downloaded from the NRSC website http://bhuvan.nrsc.gov.in. The operational procedure of this DEM generation comprised of stereo strip triangulation of 500 × 27 km segment with 30-m posting (Muralikrishnan et al., 2013). The vertical accuracy for CartoDEM (V1) claimed by NRSC is 8 m (Muralikrishnan et al., 2011). Considering the appearance of water bodies as a flatter surface over digital elevation model, this CartoDEM data was selected and used for detection of water bodies.
3.1.2 SRTM
SRTM and ASTER GDEM dataset is available at http://gdem.ersdac.jspacesystems.or.jp/ at 90 m and 30 m resolution. SRTM was an international project, spearheaded by the US National Geospatial-Intelligence Agency (NGA) and the National Aeronautics and Space Administration (NASA). The SRTM data provided a globally consistent digital elevation data for approximately 80% of the world’s land surface area. It’s produced by NASA and available at two spatial resolutions: 1-arc-second in the USA and a degraded 3-arc-second for the rest of the world. SRTM elevation data are based on the WGS84 ellipsoid as horizontal datum, while its mean sea level is defined by EGM96 geoid as vertical datum. The specified accuracy requirement for SRTM DEM products was 16 m absolute vertical error (at 90% confidence level). This paper deals with the better known and widely available 3-arc-second products, which are publicly available (Jing et al., 2014). Considering the smoothness in digital appearance and the visualization of WBA as a flatter surface over this DEM, this was used to achieve the objectives of the study.
3.1.3 ASTER GDEM
The ASTER GDEM purports to be the highest resolution, 30 m (1 arc second) spacing as compare to CartoDEM and SRTM DEM (Guth, 2010; Arefi and Reinartz, 2011). Moreover, the ASTER sensor on board of the Terra spacecraft has an along-track stereoscopic capability due to a nadir and 27.6º backward-looking telescopes in the Near Infrared (NIR) spectral band. This instrumental setup allows for photogrammetric DEM generation with vertical accuracies of ±15-30m (Toutin, 2008). It is freely available and would make a significant contribution to understand the water bodies. ASTER GDEM is a significant for representing digital topography at 30 m resolution, which was generated by stereo matching techniques, contributed by the Ministry of Economy, Trade, and Industry (METI) and NASA. Remotely sensed orthorectified ASTER GDEM (Version 1) dataset is available at free of cost from Earth Remote Sensing Data Analysis Center (ERSDAC) of Japan and NASA (ASTER GDEM, 2015). Complete GDEM covers land surfaces, which is wider than SRTM (Jing et al., 2014). Topographic parameters such as elevation point, slope, aspect, cross profile can be generated using this DEM and automated procedures for detection of water bodies with cross verifications. This DEM has good spatial resolution with clear appearance of the water bodies through falter digital surface over.
Global Mapper software (v11.01) together with ArcGIS (v10.0) was used for CartoDEM, SRTM and ASTER GDEM data processing, i.e. generation of EPFs (7194906), slope and contour map preparation. The obtained results from the EPFs, slope map and contour map were cross-validated from Landsat 8 satellite imagery (Dec 2013) and topographical maps (No. 47/E/5 and 47/E/9) obtained from Survey of India (SOI). Moreover, these water bodies were also verified from high-resolution Google Earth images. It is a complementary reference to help distinguish confusing water bodies from background noise like mountain shadows (Jiang et al., 2014).
3.2 Approaches
3.2.1 EPF Approach
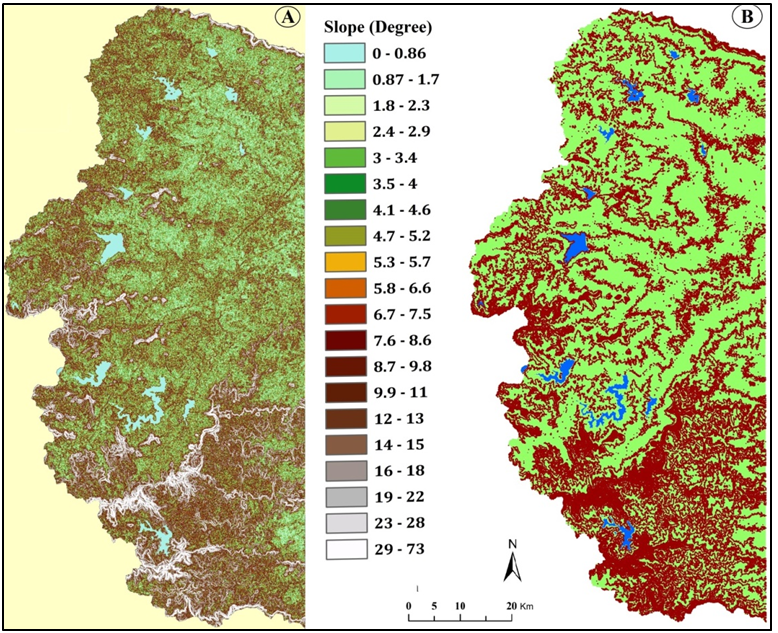
The smooth water bodies act as specular reflector and thus reflect most of the transmitted energy from the sensor that results the low backscatter values from water bodies (Hahmann et. al., 2008). Such water bodies are digitally appearing as flattening surface over inland water bodies on CartoDEM, SRTM and ASTER GDEM. In some cases, the water bodies may be normalized to have a slope value around zero degree. Therefore, the flattening surface over these DEMs is considered as water bodies that may be reservoir, lake, dam, etc. over inland surface. Scientifically, each and every water bodies are smooth and plain because of its liquid nature. Thus, water bodies are absolutely smooth and flat (Slope: 0°-0.5°) appeared on these DEMs images as compare to other region were considered as water bodies. Flat digital pixels over CartoDEM, SRTM and ASTER GDEM are seemed, as a water body (Frey and Paul, 2011) which can be used to detect the surface water body area (WBA) using slope and contour maps using combination logic.
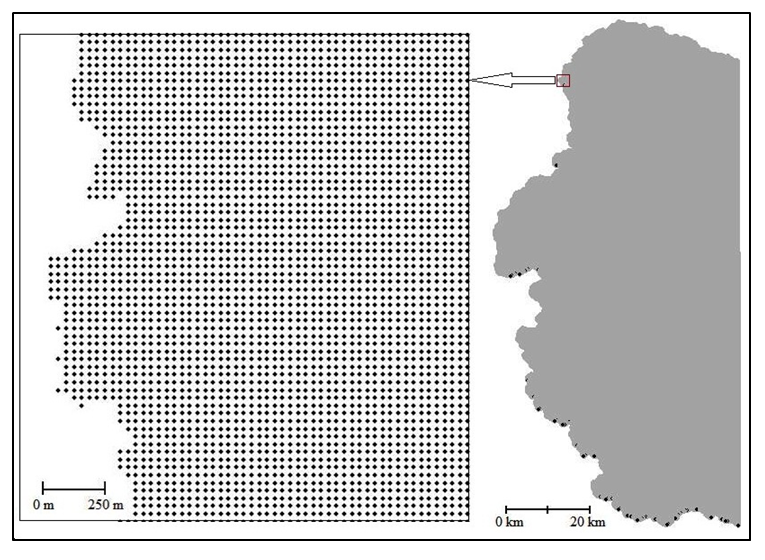
EPF is the grid points which are generated in unique array and consisted with specific height on the DEMs. It is the grid point which has the unique elevation value at specific intervals. In this study, CartoDEM, SRTM and ASTER GDEM data were processed for generation of EPFs (Figure 3). Conceptually, the unique DEM values (EPF) are picked up along the boundaries of water body as an input for determining the elevation of each water body. The logic behind unique EPFs is the flattening surface. Each of the water body has assigned flat elevation value in the DEMs. The EPF (7194906) was created at Elevation Grid Cell Centers (EGCC) by automated procedures (Figure 3). Spatial query was run in the query builder over the selected DEMs sample EPF for detection of the WBA in the selected study area. Generated EPFs were exported into point vector data shape file and put up in the software for further processing as quarry analysis. In the entire EPFs few outlier (non-water body) points are occurred due to unique elevation with the existed WBA. These identical spatial heights were an error with relevant water bodies in the surrounding area. Thus, the data combination approach was used to remove the non-water bodies’ points.
3.2.2 Combination Approach
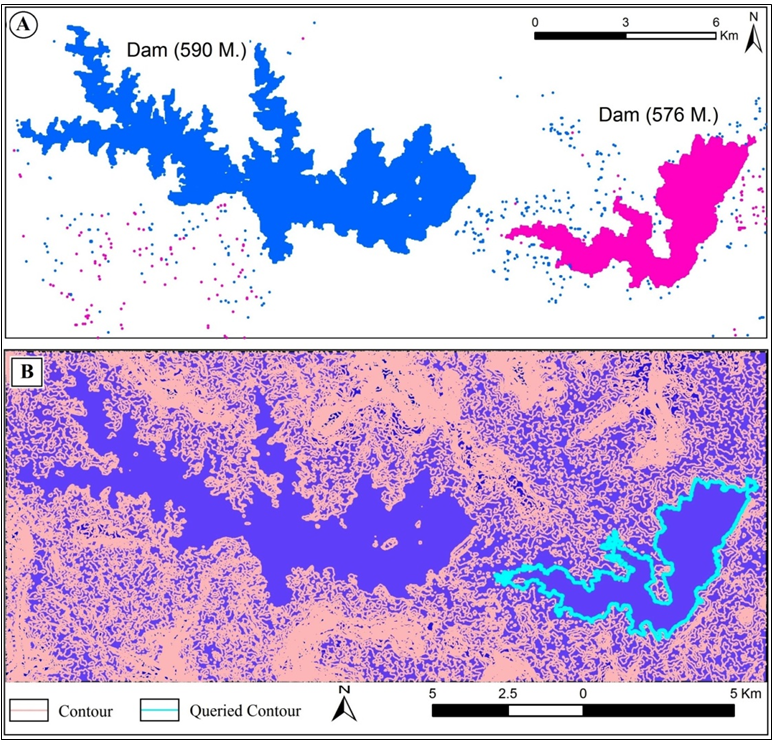
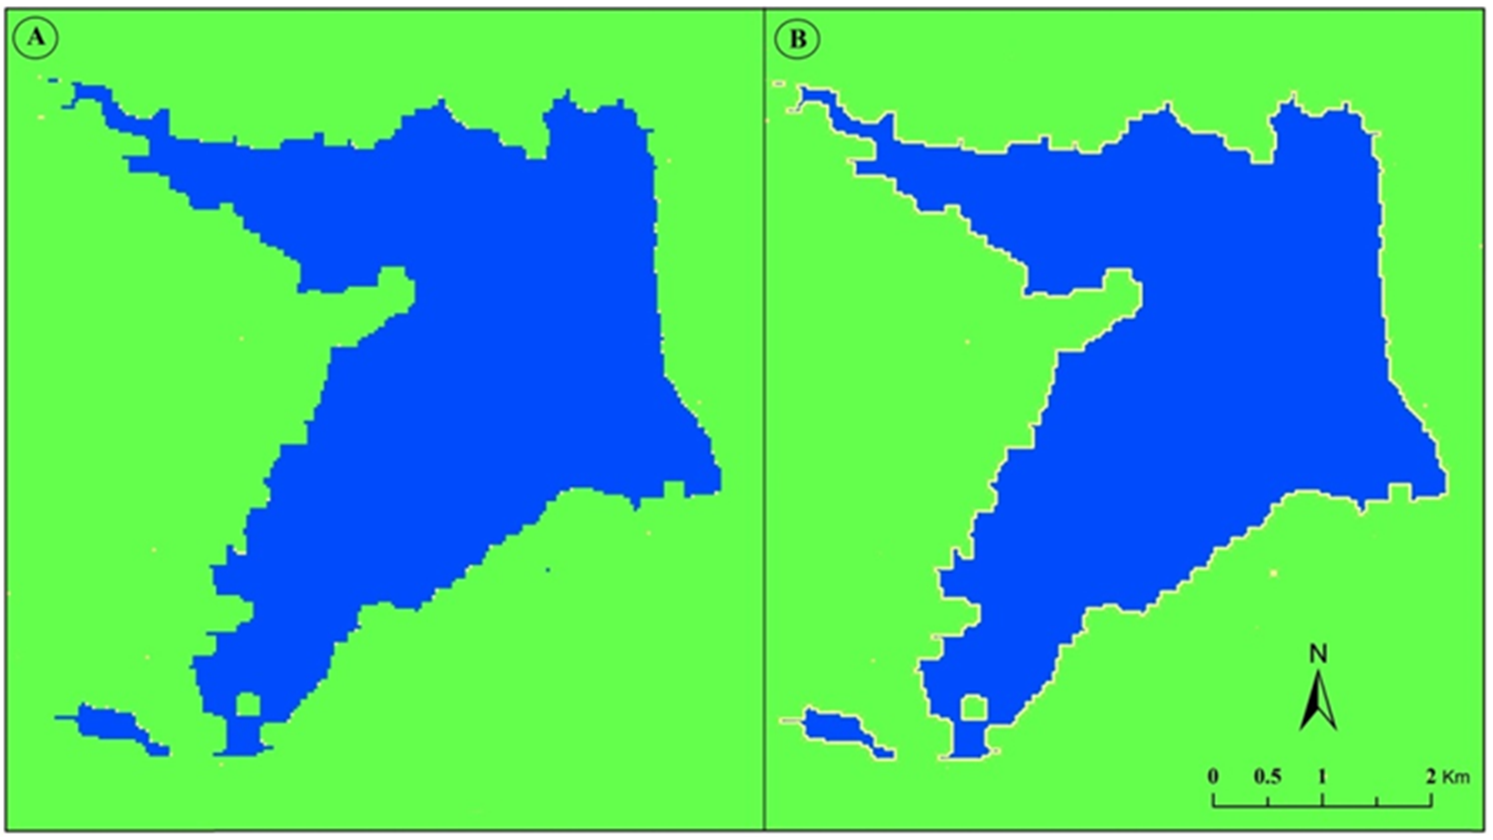
Generated EPFs are integrated with prepared contour and slope map using query analysis task by combining the generated 7194906 EPFs. The contour and slope maps were used to detect the WBA (Figure 4). Example: the contour line (576 m) detection at the edge of water bodies of Darna reservoir (Figure 5) was performed for cross verification of obtaining results from advance query and combination of slope map. The slope map with 0º to 0.5º was used to compare the WBA in the existed EPFs cluster. This detected EPFs (590m and 576m) area was cross-validated from Landsat 8 satellite imagery and topographical maps of the same region. The omission of unnecessary EPF (non-water bodies) is essential to measure the WBA, precisely. The delineation of contour at the edges of water bodies and its incorporation with slope map was therefore attempted (Figure 5). These were the non-clustered points (non-water bodies) and located in the outlier part of the existed water bodies. For the purpose of clear identification of boundaries of water bodies, nearest neighbor (for discrete surface) to cubic convolution (for continues surface) conversion of DEMs were carried out (Figure 6). Finally, the combination of EPFs, slope map, recognition of contour line at the edge of water bodies and nearest neighbor to cubic convolution of processed DEMs were attempted for final detection of the water bodies in the study area (Figure 7).


 ,
Komali Kantamaneni 2
,
Komali Kantamaneni 2