3 . METHODOLOGY
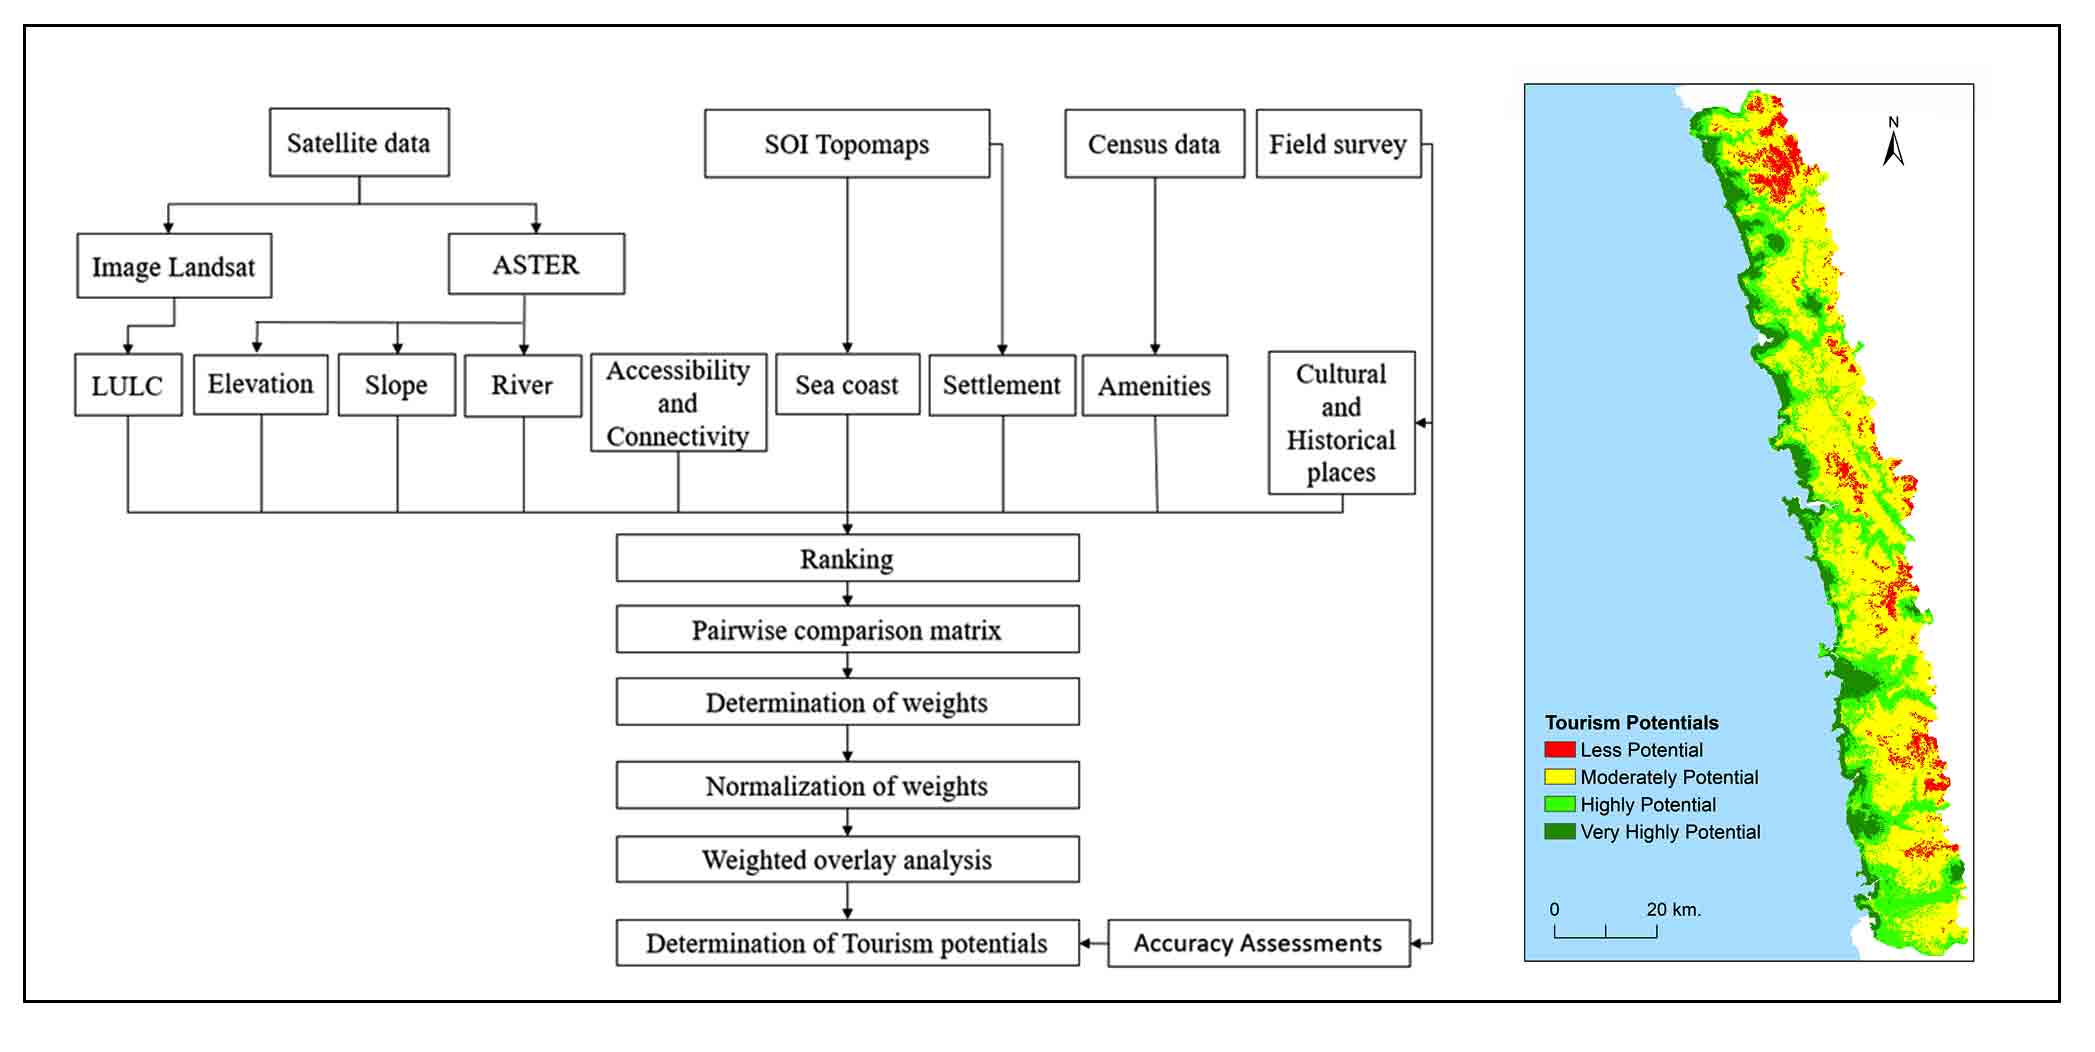
AHP base multi-criteria analysis performed for detection and delineation of potential areas for tourism in the coastal zone of Ratnagiri district. The physiographic and sociocultural criterions selected for the analysis of potential areas. The study processed through seven steps: 1) selection criteria, 2) ranking, 3) pairwise comparison, 4) calculation of weights, 5) determination of scores, 6) weighted overlay analysis, and 7) accuracy assessment.
3.1 Data
The topographic maps (1:50000) procured from Survey of India (SOI) (Hedge and Reju, 2007) and used to prepare the maps showing river network, seacoast, accessibility and connectivity, cultural and historical places, and density of settlements for determination of site suitability for tourism. Census data (Census, 2011) used to represent the number of amenities for the identification of areas with tourism potentials. The ASTER DEM (30m) data used to prepare the elevation and slope maps. The Landsat-8 ETM+ data at 30m resolution (path 147 and row 48) data used to identify the LULC analysis. This data has been widely used for detection of the potential areas for coastal tourism, eco-tourism, agriculture, irrigation, watershed management, built-up area, etc. (Murali et al., 2013; Jayappa et al., 2014; Zolekar and Bhagat, 2015; Thakur et al., 2020) (Figure 2 and Table 1). This satellite data was acquired on 14th February 2019 in a cloud-free situation and downloaded from USGS GloVis website for the preparation of LULC map. GPS [Global Positioning System] was used for identification of sites for sample survey during the field visits arranged to collect the ground truth data about LULC, cultural and historical places, beach sites and locations, lagoons, creeks, stream, landscape features, sites aerial view, etc. All geospatial data was loaded and processed in Arc GIS (10.2), Global Mapper (13), and ERDAS 9.2 software [Earth Resource Development Application System].
Table 1. Sources of spatial datasets
|
Criterions
|
Data source
|
Spatial resolution
|
|
Seacoast
|
GPS data, SOI Topo-maps
|
1:50000
|
|
Elevation
|
ASTER data
|
30 m
|
|
Slope
|
ASTER data
|
30 m
|
|
River
|
ASTER data
|
30 m
|
|
LULC
|
Satellite image
|
30 m
|
|
Accessibility and connectivity
|
SOI Topo-maps
|
1:50000
|
|
Settlement
|
SOI Topo-maps
|
1:50000
|
|
Amenities
|
Census data (2011)
|
|
|
Cultural and historical places
|
The filed survey, GPS data
|
|
3.2 Multi-Criteria Analysis (MCA)
The present study was used multi-criteria decision-making (MCDM) techniques i.e. AHP (Analytical Hierarchy Process), GIS (Geographical Information System), and Experts’ opinions to detection of potential area for tourism in a coastal zone (Liaghat et al., 2013; Ebrahimi et al., 2019). The MCDM technique is a significant tool for identifying the potential sites for the planning and management of tourism (Bunruamkaew and Murayam, 2011; Mansour et al. 2020; Ronizi et al., 2020). This is a simple but definite learning composite phenomenon to improve the design of methods (Kiani et al., 2019) to provide a convenient and equitable manner to achieve the specific objective of the study (Raha et al., 2021). MCDM requires an arrangement of several fundamental procedures e.g. ranking, pairwise comparison, calculation of weights, determination of scores, weighted overlay analysis, and accuracy assessment with an evaluation of criteria maps. The combinations and influence of criteria in the detection of suitable sites for tourism activities based on appropriate decision-making variables facilitate the selection process of these sites for tourism development (Ghamgosar et al., 2016; Fadafan et al., 2018). The integrated ranking and scaling procedures performed for selected criteria are useful for the qualitative and measurable spatial attributes for the site suitability analysis for tourism (Mamun and Mitra, 2012; Bagdanaviciute, 2018). This technique is precisely applicable to determine the weights of selected criterions useful to identify potential sites of tourism (Sahani, 2019). Carrillo and Jorge (2017) have used this technique for the construction of composite indicators, either to determine the weights of criteria (Carrillo and Jorge, 2017). Therefore, MCDM technique was used for site suitability analysis for tourism in the coastal zone of Ratnagiri District.
The selection of criterions for multi-criteria analysis for detection of potential sites for tourism performed based on review of published research (Table 2) on the coastal tourism. The scholars have been used different criterions for detection and delineation potential sites for tourism including seacoast, elevation, slope, river, LULC, cultural and historical attraction, accessibility and connectivity, size of settlements, viability of services and amenities, etc.
Table 2. Comparative weighted classes
|
Criterions
|
Comparative weighted classes
|
Authors
|
|
Low (1)
|
Moderate (2)
|
High (3)
|
Very high (4)
|
|
Seacoast
|
High hard rock cliff
|
Estuaries/ lagoons
|
Muddy
|
Sandy coasts
|
Lin and Pussella, 2017
|
|
Mud
|
Coarse
|
Medium sand
|
Fine sand
|
Silva et al., 2013
|
|
Cultural and historical attraction
|
Local
|
Regional
|
National
|
International
|
Pralong and Reynard, 2005
|
|
Inter local (2-1)
|
Interprovincial (4-3)
|
Nationwide (5-7)
|
International (8-10)
|
You-jun and Zheng-xin, 2009
|
|
Province-wide attractive (1)
|
Region-wide attractive (4)
|
Nation-wide attractive (7)
|
World-wide attractive (10)
|
Hoang et al., 2018
|
|
Site located less than 20 km from a recreational area or tourist attraction
|
Site located less than 15km from a recreational area or tourist attraction
|
Site located less than 10 km from a recreational area or tourist attraction
|
Site located less than 5km from a recreational area or tourist attraction
|
Brilha, 2016
|
|
Elevation (m)
|
< 550 m
|
550-650 m
|
650-750
|
> 750
|
Guerrero et al., 2020
|
|
>6
|
> 3- <6
|
> 0 - < 3
|
< 0
|
Murali et al., 2013
|
|
Low
|
Moderate
|
High
|
Very high
|
Pralong and Reynard, 2005
|
|
5-30 m (Cliff)
|
31-60m (Cliff)
|
61-90m (Cliff)
|
>90m (Cliff)
|
Anfuso et al.,
2017;
Mooser et al., 2021
|
|
0-100m
|
> 400m
|
100-300m
|
300-400m
|
Bunruamkaew et al., 2011
|
|
Low elevation
|
Moderate elevation
|
High elevation
|
Very high elevation
|
Ambecha et al., 2020
|
|
< 100m
|
> 400m
|
100 - 300m
|
300 - 400m
|
Wanyonyi et al., 2016
|
|
1400-1500m
|
1501-2300m
|
2301-3200m
|
3200-3680m
|
Asmamaw and Gidey, 2018
|
|
Slope
|
25-35%
|
15-25%
|
3-15%
|
0-3 %
|
Guerrero et al., 2020
|
|
Very steep (>20º)
|
Slightly high steep (5º - 20º)
|
Moderate steep (2º-5º )
|
Low steep ( <2º )
|
Silva et al., 2013
|
|
< 5º
(Beach face)
|
5º -10º
(Beach face)
|
10º -20º
(Beach face)
|
20º -45º
(Beach face)
|
Anfuso et al., 2017
|
|
> 1º
|
> 0.2º - < 1º
|
> 0.1º - < 0.2º
|
> 0º - 0. º <
|
Murali et al., 2013
|
|
> 35º
|
25º -35º
|
5º -25º
|
0º -5º
|
Bunruamkaew et al.,2011
|
|
1-2(%)
|
0.5-1(%)
|
0.1-0.5(%)
|
<0.1(%)
|
Lin and Pussella, 2017
|
|
Gentle Slope
|
Moderate slope
|
Steep slope
|
Highest Steep slope
|
Ambecha et al., 2020
|
|
35%
|
25%
|
0-25%
|
0-5%
|
Wanyonyi et al., 2016
|
|
>35º
|
25º-35º
|
5º-25º
|
0º-5º
|
Asmamaw and Gidey, 2018
|
|
Distance from River
|
> 6km
|
6km
|
3km
|
1km
|
Ambecha et al., 2020
|
|
150-200 m
|
100-150 m
|
50-100 m
|
< 50 m
|
Rocha et al., 2020
|
|
Land use land cover
(LULC)
|
Agriculture, Forestry, urban, Non vegetated area
|
Pasture
|
Grassland
|
Forest, Carredo, water
|
Guerrero et al., 2020
|
|
Built-up area
|
Open grassland and shrub land , cultivated land
|
Closed grassland
|
Lake and dense forest
|
Asmamaw and Gidey, 2018
|
|
Coastal sand
|
Forest
|
Agriculture
|
Urban and industrial infrastructures
|
Rocha et al., 2020
|
|
Barren land
|
Vegetated land
|
Agriculture / Fallow land
|
Urban, ecological sensitive region
|
Murali et al., 2013
|
|
Not suit
|
Marginal
|
Moderate
|
High
|
Bunruamkaew et al., 2011
|
|
Meadowland, sparsely brushwood
(1-3)
|
Only brushwood, meadowland (3-4)
|
Lonely greenwood, meadowland (5-7)
|
Greenwood, brushwood, meadowland (7-8)
|
Cetin et al., 2018
|
|
Forest
|
Shrubs
|
Agriculture/ marshy land
|
Built-up
|
Lin and Pussella , 2017
|
|
Urban
|
Bare land
|
Vegetated area
|
Forested area
|
Wanyonyi et al., 2016
|
|
Accessibility and connectivity
|
1500m
|
750-1500m
|
350-750m
|
< 350m
|
Guerrero et al.,
2020
|
|
2km buffer
|
1km buffer
|
500m buffer
|
250m buffer
|
Murali et al.,
2013
|
|
Less than 50m
|
between 50 and 200 m
|
between 200 and 500m
|
more than 500m
|
Pralong and Reynard,2005
|
|
Less than 1km of track
|
By a local road
|
By a road of regional importance
|
By a road of national importance
|
Pralong and Reynard, 2005
|
|
No buffer zone/ heavy traffic
|
No buffer zone/ light traffic
|
Parking lot visible from coastal area
|
Parking lot not visible from coastal area
|
Anfuso et al., 2017
|
|
>60 km (1)
|
>40-60 km (4)
|
20-40 km (7)
|
<20 km (10)
|
Hoang et al., 2018
|
|
Less than 1km from a road accessible by bus
|
Site accessible by bus but through a gravel road
|
Less than 500 m from a paved road
|
Less than 100 m from a paved road and with bus parking
|
Brilha, 2016
|
|
> 45km
(Accessibility)
|
30-45km
(Accessibility)
|
15-30km
(Accessibility)
|
0-15km
(Accessibility)
|
Bunruamkaew et al., 2011
|
|
Areas within 10 km buffer around major roads
|
Areas within 5 km buffer around second main roads
|
Areas within 2 km buffer around third main roads
|
Areas outside of any buffers around all roads
|
|
Cableway, railway, ferryboats, balloon, airplane, parachute, etc.
|
Vehicle availability at specific hours
|
Vehicle availability
|
Walking distance
|
Cetin et al., 2018
|
|
>6km
|
6km
|
3km
|
1km
|
Ambecha et al., 2020
|
|
>30km
(Cultural sites)
|
20-30km (Cultural sites)
|
10-20km (Cultural sites)
|
0-10km (Cultural sites)
|
Wanyonyi et al., 2016
|
|
2 km Buffer
|
5 km Buffer
|
10 km Buffer
|
Area outside
|
|
>500m (Accessible by private transport but no service and facilities)
|
< 500m (Accessible by private transport but limited service and facilities)
|
(Accessible by public transport but limited service and facilities-semi urban)
|
(Accessible by public transport and safety service and facilities- urban area)
|
Bagdanaviciute et al., 2018
|
|
Narrow road, only pedestrian, no vehicle access possible, bad road condition
|
Moderate road, vehicle allowed, bad road condition / Narrow road vehicle allowed, good condition
|
Wide road, vehicle allowed and moderate road condition
|
Wide road , vehicle allowed and good condition
|
Mamun and Mitra, 2012
|
|
Settlement (size)
|
<50000
|
>50000- <100000
|
>100000- <20000
|
> 200000
|
Murali et al., 2013
|
|
Heavy tourism and/ or urban
|
Light tourism and/or urban and/or sensitive
|
Sensitive tourism and/ or urban
|
Historic and/or none
|
Anfuso et al., 2017
|
|
100 inhabitants/km2
|
100-250 inhabitants/km2
|
250-1000 inhabitants/km2
|
More than 1000 inhabitants/km2
|
Brilha, 2016
|
|
>1000m (Urban)
|
500-1000m (Urban)
|
300-500m (Urban)
|
<300m (Urban)
|
Guerrero et al.,
2020
|
|
Urban settlements (>10000)
|
Small towns (1001-10000)
|
Unincorporated communities (1-1000)
|
Absence of permanent settlement (0)
|
Bunruamkaew et al., 2011
|
|
Up to 200 km (100,000)
|
Up to 100 km (100,000)
|
Up to 50 km (100,000)
|
Up to 20 km (100,000)
|
Cetin et al., 2018
|
|
0-25
(inhabitation/ km2
|
25-100
(inhabitation/
km2
|
100-250 (inhabitation/km2
|
>250 (inhabitation/ km2
|
Bagdanaviciute et al., 2018
|
|
Amenities
|
Absence of one or more of the basic facilities
|
Presence of all basic facilities, but poorly managed
|
Presence of all basic well managed facilities
|
Presence of all basic and important facilities
|
Semeoshenkova et al., 2016
|
|
Availability of potable water-source
|
Availability of potable water-well
|
Availability of potable water-artesian well
|
Availability of potable water-general network
|
Silva et al., 2013
|
|
Public sanitation system-Absent
|
Public sanitation system-To the sediment
|
Public sanitation system- General network
|
Public sanitation system- Treatment
|
|
Public transport distance->100m
|
Public transport distance-100m
|
Public transport distance-50m
|
Public transport distance -Next beach
|
|
Street lighting-absent
|
Electric generator
|
Electrical network 50%
|
Electrical network 100%
|
|
Street lighting-absent
|
-
|
Street lighting-little
|
Street lighting-adequate
|
Sousa et al., 2014
|
|
Public bathrooms-absent
|
--
|
Public bathrooms -little
|
Public bathrooms -adequate
|
Asmamaw and Gidey (2018) and Guerrero et al., (2020) have been showed the elevation >750m with very high potentials, 650-750m with high potential, 550-650m moderately potential and <550m with less potential of tourism Brazil and Ethiopia. The scholar like Bunruamkaew and Murayama (2011) and Wanyonyi et al. (2016) have suggested the elevation 300-400m as more suitable sites for tourism than the land with elevation of 0-100m in Kwale from Kenya. However, flat lands are more favorite sites for tourism in the coastal zones e.g. low elevation (<0) than the higher elevation (>6) (Murali et al., 2013). Further, Pralong and Reynard (2005) have reported that higher elevated sites are more suitable than the lowlands for these activities. However, Ambecha et al., (2020) have found out the coastal sites are more suitable for tourism. Therefore, variations in elevation considered as a criterion of the analysis of tourism potentials in coastal region.
The scholars have used slope of the land as the criterion for site suitability analysis (Silva et al., 2013; Murali et al., 2013; Guerrero et al., 2020). Some of the scholars have reported steep slopes as more suitable lands for tourism. However, coastal flat lands (<2ᵒ) are more suitable than the steep slopes (>20ᵒ) in coastal region (Silva et al., 2013). Further, the scholars like Wanyonyi et al. (2016), Lin and Pussella (2017), Asmamaw and Gidey (2018) have taken into consideration the gentle slopes as a criterion for the analysis of tourism sites in coastal region. Therefore, slope is significant criterion for site suitability analysis of tourism potential in the study area.
Lin and Pussella (2017) have suggested the assessment criterions for the analysis of beach tourism development with considering the sandy beaches as attraction points of tourists then the features like muddy beaches, lagoons and cliffs on shoreline in Shri Lanka. The fine sand coasts are more suitable than mud and coarse sand coast to the beach tourism activities (Silva et al., 2013). Therefore, the features at seacoasts selected as criterion for the analysis of potential sites for tourism activities.
Some of the scholars have analyzed the distance from river channel to find the potential sites for tourism (Ambecha et al., 2020; Rocha et al., 2020). have classified the distance from the river into four major categories: very high (1km), high (3km), moderate (6km) and low (>6km) tourism potential of tourism in Ethiopia. Further, Rocha et al. (2020) have also classified this distance into four categories of tourism potentials i.e., < 50m (very high), 50-100m (high), 100-150m (moderate) and 150-200m (low) in Portugal. Therefore, the distance from the river channels considered as a criterion for analysis of tourism.
Some of the scholars have analyzed the LULC for the detection of potential sites for tourism development (Bunruamkaew and Murayama, 2011; Wanyonyi et al., 2016; Lin and Pussella, 2017; Cetin et al., 2018; Guerrero et al., 2020) have classified the LULC for detection of prospective regions for ecotourism criterions including: 1) forest, Cerrado (tropical savanna ecoregion, Brazil) and water aspects as very highly suitable, 2) grassland as highly suitable, 3) pasture as moderately suitable, and 4) agriculture, forestry, urban and non-vegetated areas as less suitable. Asmamaw and Gidey (2018) have assessed LULC for the analysis ecotourism sites: 1) lakes and dense forest as highly suitable, 2) closed grassland as moderately suitable, 3) open grassland and shrub land, cultivated land as less suitable, and 4) built-up land as not suitable. Roach et al. (2020) have reported: 1) the urban and industrial infrastructures as extreme suitable, 2) agriculture as high suitable, 3) forest as moderately suitable, 4) coastal sand, water bodies, sparse vegetation, swamp or bare rock as less suitable category of LULC for tourism development. Murali et al. (2013) have analyzed the LULC for determination of site suitability of urban and ecological sensitive regions as very high tourism, agriculture/fallow lands as higher tourism, vegetated land or open spaces as moderate tourism, and barren land and less suitable for tourism. Therefore, LULC considered as a criterion for the analysis of tourism potentials in coastal region
The distribution of cultural and historical aspects is useful for site suitability analysis of tourism development with gradation regional influence like 1) international sites as very high suitable, 2) national sites as high suitable, 3) regional sites as moderate suitable, and 4) local sites less suitable for the tourism development (Pralong and Reynard, 2005; You-jun and Zheng-xin, 2009). 1) World-wide sites show very high potential of attraction, 2) nation-wide sites show high potential of attraction, 3) region-wide sites show moderate potential of attraction, and 4) province-wide sites show less potential of attraction for the tourists. Brilha (2016) has studied the attraction of tourist towards the cultural and historical places and classified into four major categories: 1) <5 km as very highly suitable, 2) <10km as highly suitable, 3) <15km as moderately suitable and 4) <20km as less suitable for the tourism development. Therefore, distribution of cultural and historical places are considered as a criterion for the analysis of tourism potentials in the coastal region.
Some of the scholars have analyzed the accessibility and connectivity for determination of potential sites for tourism development (Bunruamkaew and Murayama, 2011; Mamun and Mitra, 2012; Wanyonyi et al., 2016; Brilha, 2016; Anfuso et al., 2017; Hoang et al., 2018; Cetin et al., 2018; Bagdanaviciute et al., 2018). Guerrero et al., (2020) have found that the touristic attractions vary according to the accessibility and connectivity of the region and categorized into major four classes including: 1) tourist places near to the road (< 350m) show very high tourist attractions, 2) distance between 350 to 750m shows high tourist attractions, 3) distance between 750-1500m shows moderate tourist attractions, and 4) distance more than 1500m shows less tourist attractions. Murali et al. (2013) have suggested the road network as significant criterion for site suitability analysis of tourism and classified these regions with 1) 250m buffer as very high suitable, 2) 500m buffer as high suitable, 3) 1km buffer as moderate suitable and 4) 2km buffer as less suitable for tourism activities. Pralong and Reynard, (2005) have analyzed the site suitability for the tourism development and classified into four categories with regional view as national (very high), regional (high) and local roads (moderate) and <1km track (low). Ambecha et al. (2020) have considered the distance from the tourist places as most significant aspect for the tourism attraction and classified into four classes: 1) place on 1km distance as very high attraction point, 2) place on 3km as high attraction point, 3) place on 6km as moderate attraction point and 4) place on >6km distance as less attraction of tourist point. However, the scholars like Mamun and Mitra (2012) have used the density of road network as indicator of connectivity and accessibility and used as criterion for site suitability analysis for tourists places Murshidabad district, West Bengal, India. Therefore, density of road network was used as a criterion for analysis of the tourism potential in the study area.
Bunruamkaew and Murayama (2011) have found the significance of the size of settlement as in process of tourist activities and used this criterion for determination of site suitability as: 1) very high for absence of permanent settlement, 2) high for unincorporated communities, 3) moderate for small towns, and 4) less suitability for urban settlements. However, Anfuso et al. (2017) gave more significance for urban areas for tourists’ point of view. Further, Brilha (2016) and Bagdanaviciute et al. (2018) have classified the settlements into four main categories as >1000 inhabitants/km2 (very high potential), 250-1000 inhabitants/km2 (high potential), 100-250 inhabitants/km2 (moderate potential) and 100 inhabitants/km2 (less potential) to show the potentiality of different sites according to size of settlements for tourism purposes. Cetin et al. (2018) have used relationships between size of population and distance of buffer zone for this purpose as: 1) very highly suitable area having 100000 population in buffer of >20km, 2) highly suitable area having same population within > 50km buffer, 3) moderately suitable land of 100km buffer and 4) less suitable land up to 200km buffer. Murali et al. (2013) have reported the land having population size> 200000 as more suitable than land having population <50000 (low) for tourism purposes. Therefore, density of settlements considered as a criterion of the analysis of tourism potentials in coastal region.
Semeoshenkova et al. (2016) have used amenities and services as criterions for analysis tourism potential and classified into four categories i.e. presence of all basic and important facilities (very highly suitable), presence of all basic facilities but poorly managed (highly suitable), presence of all basic facilities (moderately suitable) and absence of one or more of the basic facilities (less suitable). Silva et al. (2013) and Sousa et al. (2014) have consider the number of amenities including availability of water, public sanitation system, public transport distance, electrification (100%), street lighting, adequate public bathrooms, for detection of potential sites for tourism.
Thus, nine criterions i.e. elevation, slope, seacoast, river, LULC, accessibility and connectivity, density of settlements, number of amenities, cultural and historical places were selected and used for detection of potential sites for tourist activities in the selected study region using AHP technique.
Further, the scholars like Moreno (2010), Falk (2014), Romero et al. (2019) have used that temperature as a significant criterion for analysis of beach tourism in temperate zone. Ridderstaat (2014) has reported that the beach tourism is possible in the destinations of comfortable temperature. The distribution of rainfall also reported as significant factor of tourism development (Ogbuene, 2011). However, Jeuring and Becken (2013), Fitchett et al. (2017) have reported negative effects of the heavy rainfall on tourism activities. The present study focused on detection of tourism potential in micro-region and the region shows minor variations in spatial distribution of rainfall and temperature. Therefore, the climatological criterions including rainfall and temperature not considered in the analysis. The natural diversity and landscape features are the major attraction points for tourists (Ha and Yang, 2019; Batman et al., 2019). The tourists are visiting the natural features for enjoy (Bunruamkaewa and Murayama, 2011). The region is coastal zone and therefore, landscape feature on coastlines including cliffs, platform and headland not specially points in the present analysis. Further, the tourism safety is important for tourist and play vital role in development of tourism industry (Chen et al., 2017).
3.3 Criterions
Nine criterions i.e. elevation, slope, seacoast, river network, LULC, accessibility and connectivity, density of settlements, number of amenities, cultural and historical places were used for detection of potential area for tourism activities in study region using MCDM based AHP technique.
3.3.1 Seacoast
The beach tourism is unique and dynamic business across the world (Butowski, 2018) and fresh, comprehensive and sandy coastlines (Klein et al., 2004) are major destinations for the tourism development (Monavari et al., 2012) with enhancement of beauty and entertaining activities e.g. sandy beach, landscape features, sand bar, lagoon, headland, cliff, cave, spit bar, tombolo, etc.
Pralong and Reynard (2005) have studied the morphological sites particularly landscape evolution as the major attraction point for tourist which give more income to the local people without environmental disturbance. Mooser et al. (2018) have reported most attractive landscape features along the coastlines such as headlands, cliff, caves, rocky, sandy beaches, etc.
The scholars like Kale (2015), Brilha (2016) have analyzed the potentials and diversity of geo-tourism. This activity focused on tourism of the natural surroundings, especially emphases on landscape (Kale, 2015). Geo-diversity tourism relates with the pictorial attractiveness of the geographical existence (Brilha, 2016). The landscapes in adjoining region of seacoasts show higher visual standards for tourism activities (Tomic et al., 2018). Batman et al. (2019) have suggested natural surroundings without landscape uniformity for tourism. Further, Priskin (2001) has described the prospective ecotourism locations Western Australia (Ambecha et al., 2020). Lin and Pussella (2017) have found that sandy coasts more suitable than the headland, cliff and rocky coast for tourism. Coastal swamplands are also suitable for various tourism amenities (Belsoy et al., 2012). Photography of sun at shoreline including natural landscape features is fundamentally potential sources for tourism development (Pereira et al., 2019). Therefore, analysis of natural landscapes is significant to establish the natural bases for development of tourism activities with eco-friendly approach. Coastal areas are significant regions for human settlements and tourism activities (Lin and Pussella, 2017) for financial support to local people (Chen and Bau, 2016). These activities can meet the forever-accumulative recreational requirements of town residents (Asur, 2019). However, Rangel-Buitrago et al. (2017) have reported problems like land degradation in this region due to this activities.
Table 3. Suitability levels: Seacoast characteristics
|
Suitability levels
|
Seacoast characteristics
|
Area
|
|
(km2)
|
(%)
|
|
Low suitable
|
Headland and cliffs
|
125.62
|
54.38
|
|
Moderately suitable
|
Sandy beaches, rocky coast with estuaries or lagoons
|
103.55
|
44.83
|
|
Highly suitable
|
Rocky and muddy sandy beaches with blackish sand
|
0.91
|
0.39
|
|
Very highly Suitable
|
White sandy beaches, sand bars, tombolo, etc.
|
0.91
|
0.39
|
The map showing seacoast was prepared using topographic (SOI) maps, Google earth data and field data. The seacoast tourism potential was calculated in Arc GIS 10.2 and classified into four categories i.e. headland-cliff (0.39 % area) less suitable for tourism, beach/rocky coast-blackish (0.39 % area), rocky/sandy beach-black and white sandy/rocky beach with including especially (headland, cliff, sand bar and tombolo) (54.38 % area) very highly suitable for tourism (Figure 3).
The seacoast characteristics: 1) headland and cliffs given low weightage 1, 2) sandy beaches, rocky coast with estuaries or lagoons given weightage 2, 3) rocky and muddy sandy beaches with blackish sand given weightage 3 and 4) white sandy beaches, sand bars, tombolo, etc. given weightage 4.
3.3.2 Cultural and Historical Places
Cultural heritage is more significant as traditional shoreline locations having scenic view for the tourists (Lacher et al., 2013). Prehistoric and cultural traditions are the most attractions for them (Escobar et al., 2020). Cultural heritages represent human tradition in the particular area including archaeological indications, historical forts, other buildings, etc. within the region. It is the symbol of human history and time considering the geographic and geological learning situations (Reynard, 2009). The presence of the cultural heritage is a past period distinctive physical cultural record indicating the challenges about climate changes impact on shoreline with surrounding natural resources (Li et al., 2021). Coastline service sector has built on a distinctive source combination of terrestrial and sea offering amenities such as marine, seashores, vegetation, landscape feature and differentiated artistic with historic heritage along the shoreline support the coastal tourism development (Cletus and Okpoko, 2015). The cultural heritage including folks, traditional clusters, homelands, and its value historic, artistic, trade and industry buildings, regions, ballet, fare, clothes, events, ethics, daily life and arts (Ismail et al., 2014) for attraction of tourism. The terrains of coastal zone are habitually attractive for the development of tourism amenities and services i.e. residential building, hotel, hospital, restaurant, security organization, etc. (Nikiforov et al., 2018). Pralong and Reynard (2005) and You-jun and Zheng-xin (2009) have found that international cultural and historical heritage very high suitable for coastal tourism, national places are high suitable for tourism and local heritage less suitable to the tourism. Therefore, cultural and historical heritage tourist sites considered as higher potential of coastal tourism development in the region.
About 3.40% TGA is classified in cultural and historical attraction proximity >5km distributed in the Western part along with the seacoastline, 7.03% TGA within the 3-4km, 8.66 % TGA within 2-3km, and 80.92% TGA within the <1km. Coastal side area having high value representing the high tourism potentials (Table 4 and Figure 4). Here, the cultural and historical attraction proximity is reclassified into four categories and assigned weights of 1, 2, 3 and 4, respectively.
Table 4. Suitability levels: Cultural and historical attraction proximity
|
Suitability levels
|
Classes
(km)
|
Area
|
|
(km2)
|
(%)
|
|
Low suitable
|
>5
|
101.66
|
3.40
|
|
Moderately suitable
|
3-4
|
210.04
|
7.03
|
|
High suitable
|
2-3
|
258.73
|
8.66
|
|
Very high suitable
|
< 1
|
2418.57
|
80.92
|
|
Total
|
2989.00
|
100.00
|
3.3.3 Elevation
Ambecha et al., (2020) have noticed elevation as the prime factor of attraction point of view from tourism scenery landscapes. The relief disparity shows significant impact on scenic landscape (Maharashtra state gazetteers, 1962). Absolute relief represents the highest elevation of topography and plays a fundamental role in tourism development (Mirzekhanova and Fetisov, 2008). Therefore, the analysis of elevation is useful to point out the potential sites for tourism. Mirzekhanova and Fetisov (2008) have found and recommended favorable height up to 300m and unfavorable above 300m for tourism development. Guerrero et al. (2020) have notified that elevation of landscape less than750m has beauty that is more scenic. The higher elevation of land shows significant scenic value for tourism activities (Pralong and Reynard, 2005). However, some of the scholars have noted less elevation as favorable landscape for tourism viz. Cetin (2016) has reported the lowland topography is favorable for various tourism activities. Highest elevation suggested as more suitable for ecotourism (Ambecha et al., 2020). The present study area is the coastal zone and coastline has more attraction of tourists. At some places, lowlands show high risk at the coastal area including natural calamities like tsunami, floods, landslides, etc., (Murali et al., 2013). Therefore, the disparity in elevation of the study analyzed to identify the potential sites for tourism.
The maps showing distribution of elevation in Ratnagiri Coastal Zone (RCZ) was prepared using Cartosat DEM data (Figure 3). The height varies from 0m at coastline to 413m at Sawari village (Mandangad Tahsil). The map classified into four categories based on the comparative weighted class values as lowland (4), moderate land (3), highland (2) and very highland elevation (1). The area was estimated 19.42% TGA into lowland, 29.06 % TGA into moderate, 33.47% TGA area into high and 18.05% TGA area in very highlands. In the study area, the coastal area has higher attraction of tourists compare to other land classes therefore, the costal lowland has been give higher weightage (4) for AHP analysis. Further, the class of moderate elevation has given weightage 3, high elevation given weightage 2 and very highlands given weightage 1 for AHP analysis (Table 5 and Figure 5). Therefore, coastline areas including beaches (Chen and Bau, 2016), headlands, lagoons, creek, cliffs, etc. have more attraction of tourism.
Table 5. Suitability levels: Elevation
|
Suitability levels
|
Elevation (m)
|
Classes
|
Area
|
|
km2
|
%
|
|
Very highly suitable
|
Lowland
|
< 59
|
580.38
|
19.42
|
|
Highly suitable
|
Moderate elevation
|
60-126
|
868.62
|
29.06
|
|
Moderately suitable
|
Highland
|
127-193
|
1000.49
|
33.47
|
|
Less suitable
|
Very highland
|
> 193
|
539.51
|
18.05
|
|
Total
|
2989.00
|
100
|
3.3.4 Slopes
The slope refers to the degree of gradient of a landform (Sundriyal et al., 2018). Slopes indicate convince for tourists, accessibility to cultural locations, distance from road and rail network (Wanyonyi et al., 2016), aquatic spring, distance from the landscape features, vegetation, wild life and territory (Abed et al., 2011) are significant to find out scenic beauty (Guerrero et al., 2020). Therefore, the slope is one of the important indicators to find the potential sites for tourism (Ambecha et al., 2020). The scholars like Anfuso et al. (2017), Lin and Pussella (2017) have focused on steep slopes (vertical 90º) as suitable category including headlands and the cliff features. However, Bunruamkaew and Murayama (2011) and Asmamaw and Gidey (2018) have reported almost gentle slope (0-5⁰) as favorable category for tourism. Further, Asmamaw and Gidey (2018) have reported the slope >35º as not suitable land for tourism development. The places in hilly areas are most attractive points for various tourism activities like visits to hill station and identified botanical regions, trekking, watching and film making of wild life, horse-riding, caving and adventure, (Cetin and Sevik, 2016) rafting, tableland tourism (Batman et al., 2019), walking and driving, etc. (Rutherford, 2014). Coastal lowland areas are mostly suitable for development of tourism activities at sandy beach, rocky beach, coastal landform, cliff, headland inlet, lagoon, sand spits, etc. (Hegde and Reju, 2007). Slope analysis of coastal area is more significant for construction of human settlement and its related land mapping (Bagheri et al, 2013). The study related to analysis and identification of tourism potential area of coastal zone of Ratnagiri district. Therefore, coastline area has more importance as tourism landscape in the region (Batman et al., 2019). The slope map was prepared using Cartosat DEM data with slopes variation from almost flat (0⁰) to steep slope (90º). The slopes reclassified into four weighted comparative classes as gentle slopes (4), moderate slopes (3), steep slopes (2), and very steep slopes (1). About 29.07% TGA is classified in the class showing slope < 5⁰ distributed in the western part along with the sea coastline, 69.90% within the class of 5 to 25⁰, 0.98% within 25 to 35⁰ and 0.05% within slope > 35⁰. Coastal sides having higher values represent the high tourism potentials (Sahani 2019; Ambecha et al., 2020) (Table 6 and Figure 6).
Table 6. Suitability levels: Slope
|
Suitability levels
|
Slope classes
|
Slope (ᵒ)
|
Area
|
|
km2
|
%
|
|
Very highly suitable
|
Gentle slope
|
< 5
|
868.79
|
29.07
|
|
Highly suitable
|
Moderate slope
|
5-25
|
2089.46
|
69.90
|
|
Moderately suitable
|
Steep slope
|
25-35
|
29.20
|
0.98
|
|
Low suitable
|
Very steep slope
|
> 35
|
1.55
|
0.05
|
|
Total
|
2989.00
|
100.00
|
3.3.5 Rivers
Rivers play the significant role in formation of view point tourists as pilgrim attraction including birthplace of many saints, poets and philosophers, land of spirits and divinity, (Jaswal, 2014) historical places, traditional locations, morphological attraction such as river oxbow lakes, waterfalls, hot springs, delta, etc. (Sepahi et al., 2015). Tourists are currently competent to holiday parts of river circular track (Tomic et al., 2018) using both sides of the river banks as the most appropriate starting point including boating, colorful sunny museum ferry (Hsu et al., 2009), side view of river bank, etc. The river morphometric study shows an imperative part in scenery feature and tributary actions such as progress of the hydro-tourism (Rahman and Rindam, 2017). The places of aquatic sources on rivers are more suitable for tourists’ attractions and leisure (Aklıbasında and Bulut, 2014). Aklıbasında and Bulut (2014) have been reported the water resource as the attraction of tourist considering the 0-300m distance from river site scenic value. Further, Rocha et al. (2020) showed four weighted classes of distance from river channel as 150-200m into low potential, 100-150m moderate potential, 50-100m higher potential and < 50m distance from river show higher potential of tourism development. They gave more weightage for nearness to the river for selection of suitable sites for tourism. Therefore, in the present study, lands near to the river channel considered as higher potential lands for tourism development.
The map showing distance from the river channel was prepared based on the drainage map prepared using topographic (SOI) maps. The distances were calculated using multiple ring buffer available in Arc GIS 10.2 and classified in four categories (Ambecha et al., 2020): distance <1km (20.77%), 1 to 3km (34.62 %), 3 to 6km (32.01%) and >6 km (12.60 %). The land near to the river channel (1km) has been given more weightage 4, 1 to 3km give 3, 3 to 6km 2 and for distance more than 6km given weightage 1 (Table 7 and Figure 7).
Table 7. Suitability levels: Distance from river
|
Suitability levels
|
Classes
|
Area
|
|
km2
|
%
|
|
Very highly suitable
|
< 1km
|
620.76
|
20.77
|
|
Highly suitable
|
1 to 3km
|
1034.69
|
34.62
|
|
Moderately suitable
|
3 to 6km
|
956.78
|
32.01
|
|
Less suitable
|
> 6km
|
376.76
|
12.60
|
|
Total
|
2989.00
|
100.00
|
3.3.6 Land Use Land Cover (LULC)
The human population densities (Ellis et al., 2010), sprawl and service sector progressive actions are changing the present state of LULC varies the natural environment (Clark, 1982; Jaiswal et al., 1999; Chilar, 2000; Yuan et al., 2005; Yılmaz, 2009; Joshi et al., 2011; Luna and Robles, 2013; Rawat et al., 2013; Kaliraj et al., 2016). LULC is uneven distributed for the reason that of man-made events and natural disasters (Muttitanon and Tripathi, 2004; Lambin et al., 2003; Qiang and Lam, 2015; Khan et al., 2015). LULC variations due to a number of morphological processes, climatic and anthropogenic activities (Thakur et al., 2020) are indirectly influencing the human society on shoreline native people. The satellite data has become significant apparatus for studying LULC change (Szuster et al., 2011). The GIS is one of most significant apparatus for analysis of land suitability of seacoast area for future planning of housing, farming, industrial, hotel, lodging, transport, settlement, shoreline tourism, etc. (Bagheri et al., 2013). The assessment is necessary for accepting the LULC classes in a specific area and its assistance in accumulative or shrinking the exposure of a region (Murali et al., 2013). LULC is important for biodiversity protection and sustenance of travelers’ events (Pisolkar and Chaudhary, 2016). The tourists’ attractions are points in coastal zone and from this time provide a lot of chance for tourism development (Naik et al., 2018). Therefore, LULC analysis is the fundamental component to detecting for the potential lands for tourism development. Coastal zones are major source of fish food, biodiversity, coastal landscape features and entertaining opportunities with vast challenges (Bernard and Rivaud, 2013). Murali et al. (2013) have recognized that barren land is less suitable for coastal tourism. Moderately suitable places are the sparsely vegetated areas and high suitable lands are in agricultural zones and fallow lands. Very highly suitable lands observed in urban and ecologically sensitive region. The LULC map was prepared in Arc GIS 10.2 and ERDAS software using Landsat 08 OLI satellite image (14/02/2019) and classified in four categories (Murali et al., 2013; Wanyonyi et al., 2016; Lin and Pussella, 2017) (Figure 8 and Table 8). Further, this LULC map was classified into four suitability levels: 1) barren and open lands (51.24%) are less suitable for tourism as assigned weightage 1, 2) the sparse vegetation (2.00%) and agriculture land (41.41 %) are moderately suitable and assigned the weightage 2, 3) the dense vegetation (0.10 %) and built-up area (1.92 %) is highly suitable and assigned the weightage 3 and 4) water bodies (2.32%) are very highly suitable for tourism development and assigned the weightage 4 (Figure 8 and Table 8).
Table 8. Suitability level: LULC
|
Suitability levels
|
Classes
|
Area
|
|
km2
|
%
|
|
Less suitable
|
Barren land / open land
|
1561.43
|
52.24
|
|
Moderately suitable
|
Sparse vegetation
|
59.86
|
2.00
|
|
Agriculture
|
1237.7
|
41.41
|
|
Highly suitable
|
Dense vegetation
|
3.13
|
0.10
|
|
Built-up area
|
57.5
|
1.92
|
|
Very highly suitable
|
Water body
|
69.38
|
2.32
|
|
Total
|
2989
|
100
|
3.3.7 Accessibility and Connectivity
Accessibility and connectivity are important components of the tourism industry and development of tourist sites (Prideaux, 2000; Cejas and Sanchez, 2010; Kovacic and Milosevic, 2016; Virkar and Mallya, 2018; Khadaroo and Seetenah, 2008; Taye et al., 2019). The tourism and transportation networks have close associated movements of tourists (Hacia, 2019). It is essential to provide various facilities and services to tourists at the time of traveling and stay at tourist places (Cetin, 2016). The innovative technologies in the transport sector are useful for tourism development in any region (Mammadov, 2012) and infrastructures supporting to the tourism value of the particular tourist sites (Cocean and Cocean, 2016). The development of the international tourism in any nation requires well network system including road, railway, metro as well as shipping (Albalate and Bel, 2009; Kubalikova and Kirchner, 2015). However, the transport cost inversely effects the development of the tourism sector and the selection of travelling mode (Kim and Lee, 2016). Therefore, transport network and connectivity analyzed to understand the tourism potential in the region.
Bunruamkaew et al. (2011) and Pralong and Reynard (2005) have delineated suitable areas based on buffer zone from roads for tourism. In the present study, the road density map was prepared (Figure 9) to find the potential areas for tourism in the coastal zone of Ratnagiri district. The road densities vary from 1.25 to 0.52 and categorized into four classes (Table 9).
Table 9. Suitability levels: Road densities
|
Suitability levels
|
Class
|
Area
|
|
km2
|
%
|
|
Low suitable
|
>1.25
|
101.01
|
3.38
|
|
Moderately suitable
|
1.24-0.81
|
334.83
|
11.20
|
|
High suitable
|
0.53 - 0.80
|
1039.07
|
34.76
|
|
Very high suitable
|
< 0.52
|
1514.09
|
50.66
|
|
Total
|
|
2989.00
|
100.00
|
3.3.8 Density of Settlements
Settlements are naturally attractive, pulling factor of tourists and have more tourism potential (Bunruamkaew, 2012). Historic and ancient settlements in coastal region are the significant corridor for tourism (Ertas, 2017; Batman, 2019). The shoreline settlements show the cultural integration of arts, traditions, festivals, etc. (Asur, 2019) and helping for preserving their traditional architectural designs (Prabawa and Gunawarman, 2020). About 11% world residents observed in shoreline area due to their various economic activities (Stanchev et al., 2015; Wijerathne and Senevirathna, 2020). The settlements are the nest of rural tourism which provide various facilities to the tourist including lunch, dinner and staying and shopping facilities, etc. (Hamzah et al., 2014; Lakshmi and Shaji, 2015; Trukhachev, 2015). The fish foods are main attraction of tourists and fisherman-families are providing the fish-food to the tourists (Setioko et al., 2011). These settlements are comfort zone for tourists during the time of travelling on shoreline (Merwe and Niekerk, 2013). However, the growth of settlement in this area shows negative impact on coastal environment (Buitrago et al., 2020) e.g. rapid growth of cities along the coast (Setioko et al., 2011), coastal destructions, litter, degradation of dunes, seacoast erosion, salinity near shore area, floods, beach pollution, sewage problem, crowd on roads, etc. (Snoussi et al., 2007). The density of households estimated based on number of households reported in census 2011. The Ratnagiri city region shows high household densities (>1138km2.) as compared to the eastern hilly region (<242km2). The estimated household density is classified into four classes: <242km2 (1.14 % TGA), 242-690km2 (1.56 % area), 690-1138km2 (37.05 % area) and >1138.01km2 (60.25 % area). The map reclassified into main four comparative suitability classes and assigned 1 to 4 values for determination of the weight of these sub-criterions (Table 10 and Figure 10).
Table 10. Suitability levels: Settlement densities
|
Suitability levels
|
Classes (households/ km2)
|
Area
|
|
km2
|
%
|
|
Low suitable
|
< 242
|
34.10
|
1.14
|
|
Moderately suitable
|
242-690
|
46.68
|
1.56
|
|
High suitable
|
690-1138
|
1107.36
|
37.05
|
|
Very high Suitable
|
> 1138
|
1800.86
|
60.25
|
|
Total
|
|
2989.00
|
100.00
|
3.3.9 Amenities
The basic amenities like medical, hospital, hotel, café, restaurants, water supply, electricity, entertainment, housing, safety and security at tourist places, parking facilities, libraries, bookstores and transport services, etc. are important for: 1) development of tourism activities (Lam and Xiao, 2000; Popichit et al., 2013; Manaf et al., 2015; Ruano, 2018; Luo et al., 2019), 2) income to local communities (Green, 2001; Jackson and Murphy, 2006; Lee et al., 2013; Yun, 2014), and 3) improvement in rural market (Ejiofor et al., 2012; Yun, 2014; Bel et al., 2014). The amenities and services are the more dynamic activities, which create the employment in the tourism sector (Nooripoor et al., 2020). The amenities are supporting for the movement of tourists and improving the tourists’ satisfactions (Hermawan et al., 2019; Vuin et al., 2019). Therefore, the availability of basic amenities required 24 hours on travelling ways and tourist places (Ruano, 2018). The participations of local people can be helpful to improve the satisfaction of tourists and sustainability in development of tourism (Hamzah et al., 2014). Therefore, availability of amenities and services are studies based on census data (2011) and mapped to understand the spatial diversity and its relationship with tourism activities.
The number of available amenities mapped and reclassified into four categories: 1) amenities < 5 (3.38 %) are less suitable for tourism as assigned weightage 1, 2) 5 to 10 (11.20 %) are moderately suitable and assigned the weightage 2, 3) 10 to 15 (34.76 %) is highly suitable and assigned the weightage 3 and 4) > 15 (50.66%) are very highly suitable for tourism development and assigned the weightage 4 (Table 11 and Figure 11).
Table 11. Suitability levels: Amenities
|
Suitability levels
|
Classes
|
Area
|
|
km2
|
%
|
|
Low suitable
|
< 5
|
3.28
|
0.11
|
|
Moderately suitable
|
5 to 10
|
2492.5
|
83.39
|
|
Highly suitable
|
10 to 15
|
442.8
|
14.81
|
|
Very highly suitable
|
> 15
|
50.37
|
1.69
|
|
Total
|
2989.0
|
100.00
|
3.4 Analytic Hierarchy Process (AHP)
Prof. Thomas L. Saaty has introduced the AHP technique in 1960s to solving complex problems of decision-making (Bunruamkaew and Murayama, 2011; Zolekar and Bhagat, 2015; Gaikwad and Bhagat, 2017; Raha et al., 2021) of site suitability for planning and management of tourism activities (Sahani, 2019; Ambecha et al., 2020; Gyinaye et al., 2017). MCDM and geographical information system (GIS) are useful tools for suitability assessments to find the suitable sites (Malczewski, 2006) based on verifying the sustainability of judgment modifications (Ebrahimi et al., 2019; Boroushaki and Malczewski, 2010). AHP based hierarchical structure is mostly useful for complex spatial judgment with advanced confidence level (Wind and Saaty, 1980). Generally, scholars are using the AHP techniques due to the effective mathematical properties to determine the criterion weights through pairwise comparison and assigning score for sub-criterions (Mansour et al., 2020; Raha et al., 2021). Some of the scholars like Bunruamkaewa and Murayama (2011), Zolekar and Bhagat (2015), Ghamgosar et al. (2016), Gaikwad and Bhagat (2017), Navale et al., (2021) have used the AHP multi-criteria techniques for evaluation of suitable for land applications and tourism potentials. The researcher have used the this technique for arrangement of the data to identify the site suitability for specific tourism sites by using weighting overlay and calculated values for each criterion and sub-criterions (Asmamaw and Gidey, 2018; Ebrahimi et al., 2019; Yuwono et al., 2021). AHP is unique technique acquainted with prejudice and conflicts in biased decisions. Its conflicts can be verified and amended, resultant in an additional consistent final ranking (Hsu et al., 2009). Thus, it reduces the judging faults confined by particular mechanism (Gyinaye et al., 2017). It is additional flexible technique with complex accuracy in site suitability (Malczewski, 2006; Zolekar and Bhagat, 2015). The ranks of criterions chosen need inverted for additions and demarcation of criterions (Wijnmalen and Wedley, 2009). However, stated views about ranks and weights assigned to selected criterion in the present study shows prejudice decision unbiased by the defendant. Therefore, AHP technique has selected for robust decision of ranking and calculation of weights for selected criterions and assignments of the score for sub-criterion (Zolekar and Bhagat, 2015).
3.4.1 Ranking
Scholars likes Klein et al. (2004), Pourebrahim et al. (2014), Wanyonyi et al., (2016), Raha et al., (2021), etc. have used multi-criteria decision-making and pairwise comparison matrix for site suitability analysis. Computable and qualitative techniques have been commonly used for determination of ranks to the selected criterions for weighted evaluates (Gaikwad and Bhagat, 2018). Phillips et al. (2010) have studied experts’ judgment and data collection for decent exercise and assessment. The expert’s opinion is useful for analysis of data about selected criterion obtain from authentic literatures and professional with knowledge in the field (Bunruamkaew and Murayama, 2011; Chen et al., 2017). However, sometimes experts are not able to attain the query of research due to misunderstanding or shortage subject knowledge. Further, the specialist experts are able to getting the implication of expert decision in selection of criterions, determining the scores and weights in specific field of research. The appropriate assessments of selected criterions are depending on the judgment reviews from experts but certain cases (Gyinaye et al., 2017). However, the subjective expert opinion is a significant phase particularly in the situation of statistics inadequacy, ambiguity and contradiction (Murali et al., 2013).
The ranks of selected criterions assigned based on opinions collected from experts from the fields of tourism, ecotourism and agro-tourism. The questionnaires circulated to these selected experts to collect the judgments and opinions about hierarchy of influence of criterions selected for site suitability analysis of tourism in coastal region (Ergin et al., 2004). The experts’ judgments were used for determination of ranks (1 to 9) of selected criterion. It shows the significance level of parameters. Forty-two experts from the field of tourism have selected for opinions of about ranks for asked criterion. Seacoast, cultural and historical attraction, elevation and slope have more influence on tourism sites in coastal zone and ranked 1 to 4, respectively. The criterions viz. river (rank 5), LULC (rank 6) and accessibility and connectivity (rank 7) strongly influencing on sites suitability for tourism. Density of settlements and amenities illustrate relatively less significance than other criterions (Table 12).
Table 12. Rank assigned to criterion
|
Criterions
|
Seacoast
|
Cultural and
historical
places
|
Elevation
|
Slope
|
River
|
LULC
|
Accessibility
/connectivity
|
Densities of settlement
|
No. of amenities
|
|
Ranks
|
1
|
2
|
3
|
4
|
5
|
6
|
7
|
8
|
9
|
3.4.2 Pairwise Comparison Matrix (PCM)
The experts’ opinions considered to determine the ranks of influencing criterions selected for the study (Murali et al., 2016). The MCDM technique and Pairwise Comparison Matrix (PCM) are significant for detection and delineation of potential sites for tourism development in the region. AHP technique was used for preparing the PCM for calculation of precise relative importance of the selected criterions in tourism activities (Bunruamkaewa and Murayamaa, 2011; Ebrahimi, 2019). The normalized weights for selected criterions calculated according to the significance of criterions in tourism (Brilha, 2016) for calculation of potential areas for tourism development (Saaty, 1987; Mansour et al., 2020). Ranks assigned (1 to 9) to the criterions show illustrative and mechanisms (Table 13).
Table 13. Pairwise comparison matrix
|
Criterion
|
Seacoast
|
Cultural and historical
places
|
Elevation
|
Slope
|
River
|
LULC
|
Accessibility
/connectivity
|
Densities of
settlement
|
No. of
amenities
|
|
Seacoast
|
1/1
|
2/1
|
3/1
|
4/1
|
5/1
|
6/1
|
7/1
|
8/1
|
9/1
|
|
Cultural and historical places
|
1/2
|
2/2
|
3/2
|
4/2
|
5/2
|
6/2
|
7/2
|
8/2
|
9/2
|
|
Elevation
|
1/3
|
2/3
|
3/3
|
4/3
|
5/3
|
6/3
|
7/3
|
8/3
|
9/3
|
|
Slope
|
1/4
|
2/4
|
3/4
|
4/4
|
5/4
|
6/4
|
7/4
|
8/4
|
9/4
|
|
River
|
1/5
|
2/5
|
3/5
|
4/5
|
5/5
|
6/5
|
7/5
|
8/5
|
9/5
|
|
LULC
|
1/6
|
2/6
|
3/6
|
4/6
|
5/6
|
6/6
|
7/6
|
8/6
|
9/6
|
|
Accessibility/cone-ctivity
|
1/7
|
2/7
|
3/7
|
4/7
|
5/7
|
6/7
|
7/7
|
8/7
|
9/7
|
|
Densities of
settlement
|
1/8
|
2/8
|
3/8
|
4/8
|
5/8
|
6/8
|
7/8
|
8/8
|
9/8
|
|
Amenities
|
1/9
|
2/9
|
3/9
|
4/9
|
5/9
|
6/9
|
7/9
|
8/9
|
9/9
|
3.4.3 Calculation of Weights
The calculation of weights is based PCM technique using the software AHP-OS (Analytic Hierarchy Process-Online System) according to the four steps: 1) judgment formation, 2) ranking, 3) normalized pairwise comparison matrix and 4) calculation of weights (Zolekar and Bhagat, 2015). The weights calculated using equation (1) Gaikwad and Bhagat (2018).
(1) \(£c_i = {{w_c} \over £w_s} × 100\)
£ci = Normalized influence of the criterion.
WC = Sum of PCA values in row.
£WC = Total of PCA values all criterions.
The ranking of the selected criterions performed based on expert opinion used for calculation of weights in the PCM. The PCM cell values of each selected criterions was proceeded to find the cell values in normalized PCM (Table 13) (Zolekar and Bhagat, 2015). PCM calculates the precise weights of criterions influenced by consistency decisions of grades of the criterions. The consistency ratio (CR) calculates the consistency of the decision and simplifies the sympathy of conceivable inaccuracies (Saaty, 1977).
(2) \(CR = {{CI} \over RI}\)
CR= Consistency ratio
CI= Consistency index
RI= Random index
The consistency ratio value <0.10 shows significant consistency and the value >0.10 shows inconsistencies (Saaty, 1977; Bunruamkaewa and Murayama, 2011; Zolekar and Bhagat, 2015; Mansour et al., 2020; Navale et al., 2021). The consistency index (CI) calculated as:
(3) \(CI=λmax-n/(n-1)\)
The calculated CR value is 0.07 and significantly acceptable (more than tabulated CI value 0.10) showing consistency in the calculated values for selected criterions for analysis of tourism potentials in the region.
Table 14. Normalized pairwise comparison matrix
|
Criterions
|
Seacoast
|
Cultural and historical
places
|
Elevation
|
Slopes
|
River
|
LULC
|
Accessibility and connectivity
|
Densities of settlement
|
No. amenities
|
Sum
|
Weight
|
Influence (%)
|
|
Seacoast
|
1.00
|
2.00
|
3.00
|
4.00
|
5.00
|
6.00
|
7.00
|
8.00
|
9.00
|
45.00
|
0.35
|
35
|
|
Cultural and historical places
|
0.50
|
1.00
|
1.50
|
2.00
|
2.50
|
3.00
|
3.50
|
4.00
|
4.50
|
22.50
|
0.18
|
18
|
|
Elevation
|
0.33
|
0.67
|
1.00
|
1.33
|
1.67
|
2.00
|
2.33
|
2.67
|
3.00
|
15.00
|
0.12
|
12
|
|
Slopes
|
0.25
|
0.50
|
0.75
|
1.00
|
1.25
|
1.50
|
1.75
|
2.00
|
2.25
|
11.25
|
0.09
|
9
|
|
River
|
0.20
|
0.40
|
0.60
|
0.80
|
1.00
|
1.20
|
1.40
|
1.60
|
1.80
|
9.00
|
0.07
|
7
|
|
LULC
|
0.17
|
0.33
|
0.50
|
0.67
|
0.83
|
1.00
|
1.17
|
1.33
|
1.50
|
7.50
|
0.06
|
6
|
|
Accessibility and connectivity
|
0.14
|
0.29
|
0.43
|
0.57
|
0.71
|
0.86
|
1.00
|
1.14
|
1.29
|
6.43
|
0.05
|
5
|
|
Densities of
settlement
|
0.13
|
0.25
|
0.38
|
0.50
|
0.63
|
0.75
|
0.88
|
1.00
|
1.13
|
5.63
|
0.04
|
4
|
|
Amenities
|
0.11
|
0.22
|
0.33
|
0.44
|
0.56
|
0.67
|
0.78
|
0.89
|
1.00
|
5.00
|
0.04
|
4
|
|
Sum
|
2.83
|
5.66
|
8.49
|
11.32
|
14.14
|
16.97
|
19.80
|
22.63
|
25.46
|
127.30
|
1.00
|
100
|
3.4.4 Determination of Score for Sub-Criterions
The scholars like Pralong (2005), You-jun and Zheng-xin (2009), Bunruamkaew et al. (2011), Mamun and Mitra (2012), Murali et al. (2013), Silva et al. (2013), Wanyonyi et al. (2016), Semeoshenkova et al. (2016), Brilha (2016), Lin and Pussella (2017), Anfuso et al. (2017), Asmamaw and Gidey (2018), Cetin et al. (2018), Bagdanaviciute et al. (2018), Hoang et al. (2018), Ambecha et al. (2020), Guerrero et al. (2020), Rocha et al. (2020) and Mooser et al. (2021) have assigned the score for sub-criterions of the selected criterions for determination of suitable sites for different purposes. In the present study, the score values assigned for sub-criterions varied from 1 to 4. Here, all thematic maps were reclassified within four categories and assigned score values from 1 to 4 according to the suitability levels of classified categories. The score value 1 is assigned for less suitable category, 2 for moderately suitable category, 3 for highly suitable category and 4 for very highly suitable category created in the reclassified maps including seacoast, elevation, slope, river, LULC, accessibility and connectivity, cultural and historical attraction, density of settlements and number of amenities (Table 15).
Table 15. Weightages and scores
|
Criterions
|
Weightage
|
Influence
|
Class
|
Sub-criterions
|
Area (km2)
|
scores
|
|
Seacoast
|
0.35
|
35
|
Low suitable
|
Headland ,cliff
|
125.62
|
1
|
|
Moderately suitable
|
Beach/rocky coast, blackish
|
103.55
|
2
|
|
Highly suitable
|
Rocky/sand beach, black
|
0.91
|
3
|
|
Very highly suitable
|
White sandy/rocky beach, sand bar, tombolo
|
0.91
|
4
|
|
Cultural and historical places
|
0.18
|
18
|
Low suitable
|
> 5 km
|
|
1
|
|
Moderately suitable
|
3 -4 km
|
|
2
|
|
High suitable
|
2-3 km
|
|
3
|
|
Very high suitable
|
< 1 km
|
|
4
|
|
Elevation
|
0.12
|
12
|
Very highly suitable
|
Lowland ( <59)
|
580.38
|
4
|
|
Highly suitable
|
Moderate elevation (60-126)
|
868.62
|
3
|
|
Moderately suitable
|
Highland (127-193)
|
1000.49
|
2
|
|
Low suitable
|
Very highland (>193)
|
520.81
|
1
|
|
Slope
|
0.09
|
9
|
Very highly suitable
|
Gentle slope (<5)
|
868.79
|
4
|
|
Highly suitable
|
Moderate slope (5-25)
|
2070.41
|
3
|
|
Moderately suitable
|
Steep slope (25-35)
|
29.2
|
2
|
|
Low suitable
|
Very steep slope (<35)
|
1.55
|
1
|
|
River
|
0.07
|
7
|
Very highly suitable
|
< 1km
|
620.76
|
4
|
|
Highly suitable
|
1 to 3 km
|
1014.98
|
3
|
|
Moderately suitable
|
3 to 6 km
|
956.78
|
2
|
|
Low suitable
|
> 6km
|
376.76
|
1
|
|
LULC
|
0.06
|
6
|
Less suitable
|
Barren land / open land
|
1542.72
|
1
|
|
Moderately suitable
|
Sparse vegetation
|
59.86
|
|
|
Agriculture
|
1237.7
|
2
|
|
Highly suitable
|
Dense vegetation
|
3.13
|
|
|
Built-up land
|
57.5
|
3
|
|
Very highly suitable
|
Water body
|
69.38
|
4
|
|
Accessibility and connectivity
|
0.05
|
5
|
Low suitable
|
local level road (> 1.25)
|
101.01
|
1
|
|
Moderately suitable
|
district level road (1.24-0.81)
|
334.83
|
2
|
|
High suitable
|
state level road (0.53-0.80)
|
1039.07
|
3
|
|
Very high suitable
|
local, state, national, railway (<0.52)
|
1513.12
|
4
|
|
Densities of Settlement
|
0.04
|
4
|
Low suitable
|
< 242
|
34.01
|
1
|
|
Moderately suitable
|
242-690
|
46.67
|
2
|
|
High suitable
|
690-1138
|
1107.35
|
3
|
|
Very high suitable
|
> 1138
|
1773.43
|
4
|
|
No. of Amenities
|
0.04
|
4
|
Low suitable
|
< 5
|
3.28
|
1
|
|
Moderately suitable
|
5 to 10
|
2464.99
|
2
|
|
Highly suitable
|
10 to 15
|
442.81
|
3
|
|
Very highly suitable
|
> 15
|
50.38
|
4
|
3.4.5 Weighted Overlay Analysis
The GIS based weighted overlay analysis was used to find the levels of tourism potentials in the region (Pourebrahim et al., 2011; Aklıbasında and Bulut, 2014; Yuwono et al., 2021). The technique solves the composite spatial complications in common measurements of dissimilar and different ideas (Ambecha et al., 2020). The calculated weights based on AHP techniques were used in this weighted overlay analysis of selected criterions considering effective influences in hierarchy of certain inputs (Mansour et al., 2020). GIS is using unified entirely thematic strata with the weighted overlay techniques (Raha et al., 2021). The potentials of tourism in the region put in weighted overlay procedures. The rasterized maps prepared for selected criterions and reclassified with four categories according the suitability levels and used for weighted overlay. The cell values of respective input raster stratum are multiplied by their weights to give influence of criterions in defining the levels of tourism potentials (Cengiz and Akbulak, 2009; Bunruamkaew and Murayama, 2012; Wanyonyi et al., 2016; Ambecha et al., 2020; Chaudhary et al., 2021).
(4) \(T_p = {∑_i^n}{_=}{_1} W_i X_i\) (Cengiz and Akbulak, 2009)
where,
\(T_p \) = Tourism potential in the region,
\(W_i\) = AHP based calculated weight for selected criterion,
\(X_i\) = Score of sub-criteria of ith layer,
\(n\) = Number of criterions
Thus, the estimated map showing tourism potential in the region was classified into four potentiality levels i.e. very high potential, high potential, moderate potential and less potential of tourism activities (Aklıbasında and Bulut, 2014) in the coastal region of Ratanagiri district.
3.4.6 Accuracy Assessment
The information of selected pixels from categorized map and reference data compared to get judgment of accuracy of produced map (Comber et al., 2012; Zolekar and Bhagat, 2015). The resultant irritated arrangement of categorized data counter to reference data universally recognized such as error matrix (Zolekar and Bhagat, 2015). The accuracy of produced map estimated for producers’ and users’ purposes using the error matrix. The inclusion of pixels considered as classified to the class and exclusion belongs to the actual class (Vijay et al., 2015). The overall accuracy estimated to understand the total applicability of produced map (Lillesand et al., 2016). Further, Kappa statistics also calculated to understand accuracy assessment (Comber et al., 2012).
(5)\(\)\( K^\bigwedge = { N∑^r}{_i}_{=1} {{x_{ij}-{∑^r}_{i=1} {{(x_i+.x+i)}}} \over N^2- {∑^r}_{i=1} {{(x_i+.x+i)}}} \) (Lillesand et al., 2016)
where,
r = number of row in the error matrix,
xij = number of observations in row i and column j,
xi + = total of observation in row i,
x + 1= total of observation in column i,
N= total number of observation included in matrix.
The data form the study area collected through field assessments and sites selected using the Global Position System (GPS) as reference points from the classified map and compared in the error matrix. The overall accuracy of the categorized map is estimated 89.60 %. The producers’ accuracy was estimated 94.55% for very highly suitable area and 86% for less suitable area whereas users’ accuracy was estimated 96.30% for very highly suitable area and 86% for less suitable for tourism activities. The thematic maps viz. amenities and settlement were processed using inverse distance weighted (IWD) interpolation technique therefore, some areas from highly suitable category are merged in the category, ‘moderate suitable’. About 87.80% producer’s accuracy and 86.87% users’ accuracy estimated for highly suitable area whereas 90.48% accuracy estimated for moderate suitable area as users’ and producer’s’ perspectives (Table 16).
Table 16. Error matrix: accuracy assessment
|
Classified classes
|
Reference class
|
|
Very highly suitable
|
Highly suitable
|
Moderately suitable
|
Less suitable
|
Total sample
|
Users’ accuracy (%)
|
|
Very highly suitable
|
52
|
3
|
0
|
0
|
55
|
96.30
|
|
Highly suitable
|
2
|
57
|
4
|
0
|
63
|
86.75
|
|
Moderately suitable
|
0
|
3
|
72
|
7
|
82
|
90.48
|
|
Less suitable
|
0
|
0
|
7
|
43
|
50
|
86.00
|
|
Total sample
|
54
|
63
|
83
|
50
|
250
|
|
|
Producers’ accuracy (%)
|
94.55
|
87.80
|
90.48
|
86.00
|
|
|
|
Total accuracy (%)
|
|
|
|
|
89.60
|


 ,
Vijay Bhagat 2
,
Vijay Bhagat 2