1 . INTRODUCTION
In many countries, groundwater is a major source of water for domestic, industrial and irrigation purposes worldwide (Lapworth et al., 2020). Significant population growth and accelerated modernization have resulted in a massive increase in the demand for fresh water over the last few decades. According to Siebert et al. (2010), groundwater accounts for 43% of global irrigation water consumption (1277 km3) per year. One of the most pressing challenges of the twenty-first century appears to be ensuring adequate supplies of usable water to meet the needs of people and the environment (Gowd, 2005; Oki and Akana, 2016). Waterborne diseases account for nearly 80% of all human diseases, according to the WHO (2017) (Srinivasamoorthy et al., 2014; Wu et al., 2017; Li et al., 2019; Adimalla et al., 2021; Panneerselvam et al., 2021). Therefore, water quality testing is essential for determining its suitability for various applications. The water quality index is one of the most effective methods for disseminating water quality information to concerned individuals and policymakers. As a result, it has become an important indicator for assessing and managing groundwater. As a result, it has become an important indicator for assessing and managing groundwater. In order to properly create new groundwater schemes and manage groundwater resources, it is necessary to analyze a groundwater flow system and map spatial variation of groundwater parameters (Manoj et al., 2017). Over the last few decades, a water quality index (WQI) has been used all over the world to assess both surface and groundwater quality in order to better understand the overall water quality of a water source (Tyagi et al., 2014; Yadav et al., 2015; Seth et al., 2016; Bora et al., 2017;Vishnu Radhan et al., 2017; Bhutiani et al., 2018; Dash et al., 2021). In recent years, groundwater quality has been assessed and monitored on a regular basis using GIS technology combined with the IDW interpolation techniques, which has proven to be a powerful tool for evaluating and analyzing spatial data of water resources (Balamurugan et al., 2020; Soujanya Kamble et al., 2020; Ram et al., 2021). It’s a quick and low-cost way to transform massive data sets into diverse spatial distribution maps and projections that show trends, associations, and sources of toxins and pollutants. A Geographic Information System (GIS) was used in this study to assess the spatial distribution of various groundwater quality parameters (Ram et al., 2021). Groundwater samples have been collected during pre-monsoon (2020) and these samples analyzed using laboratory methods. The spatial variations of groundwater qualities estimated using interpolation technique in ArcGIS environment to study the groundwater suitability for drinking purposes using WQI
2 . STUDY AREA
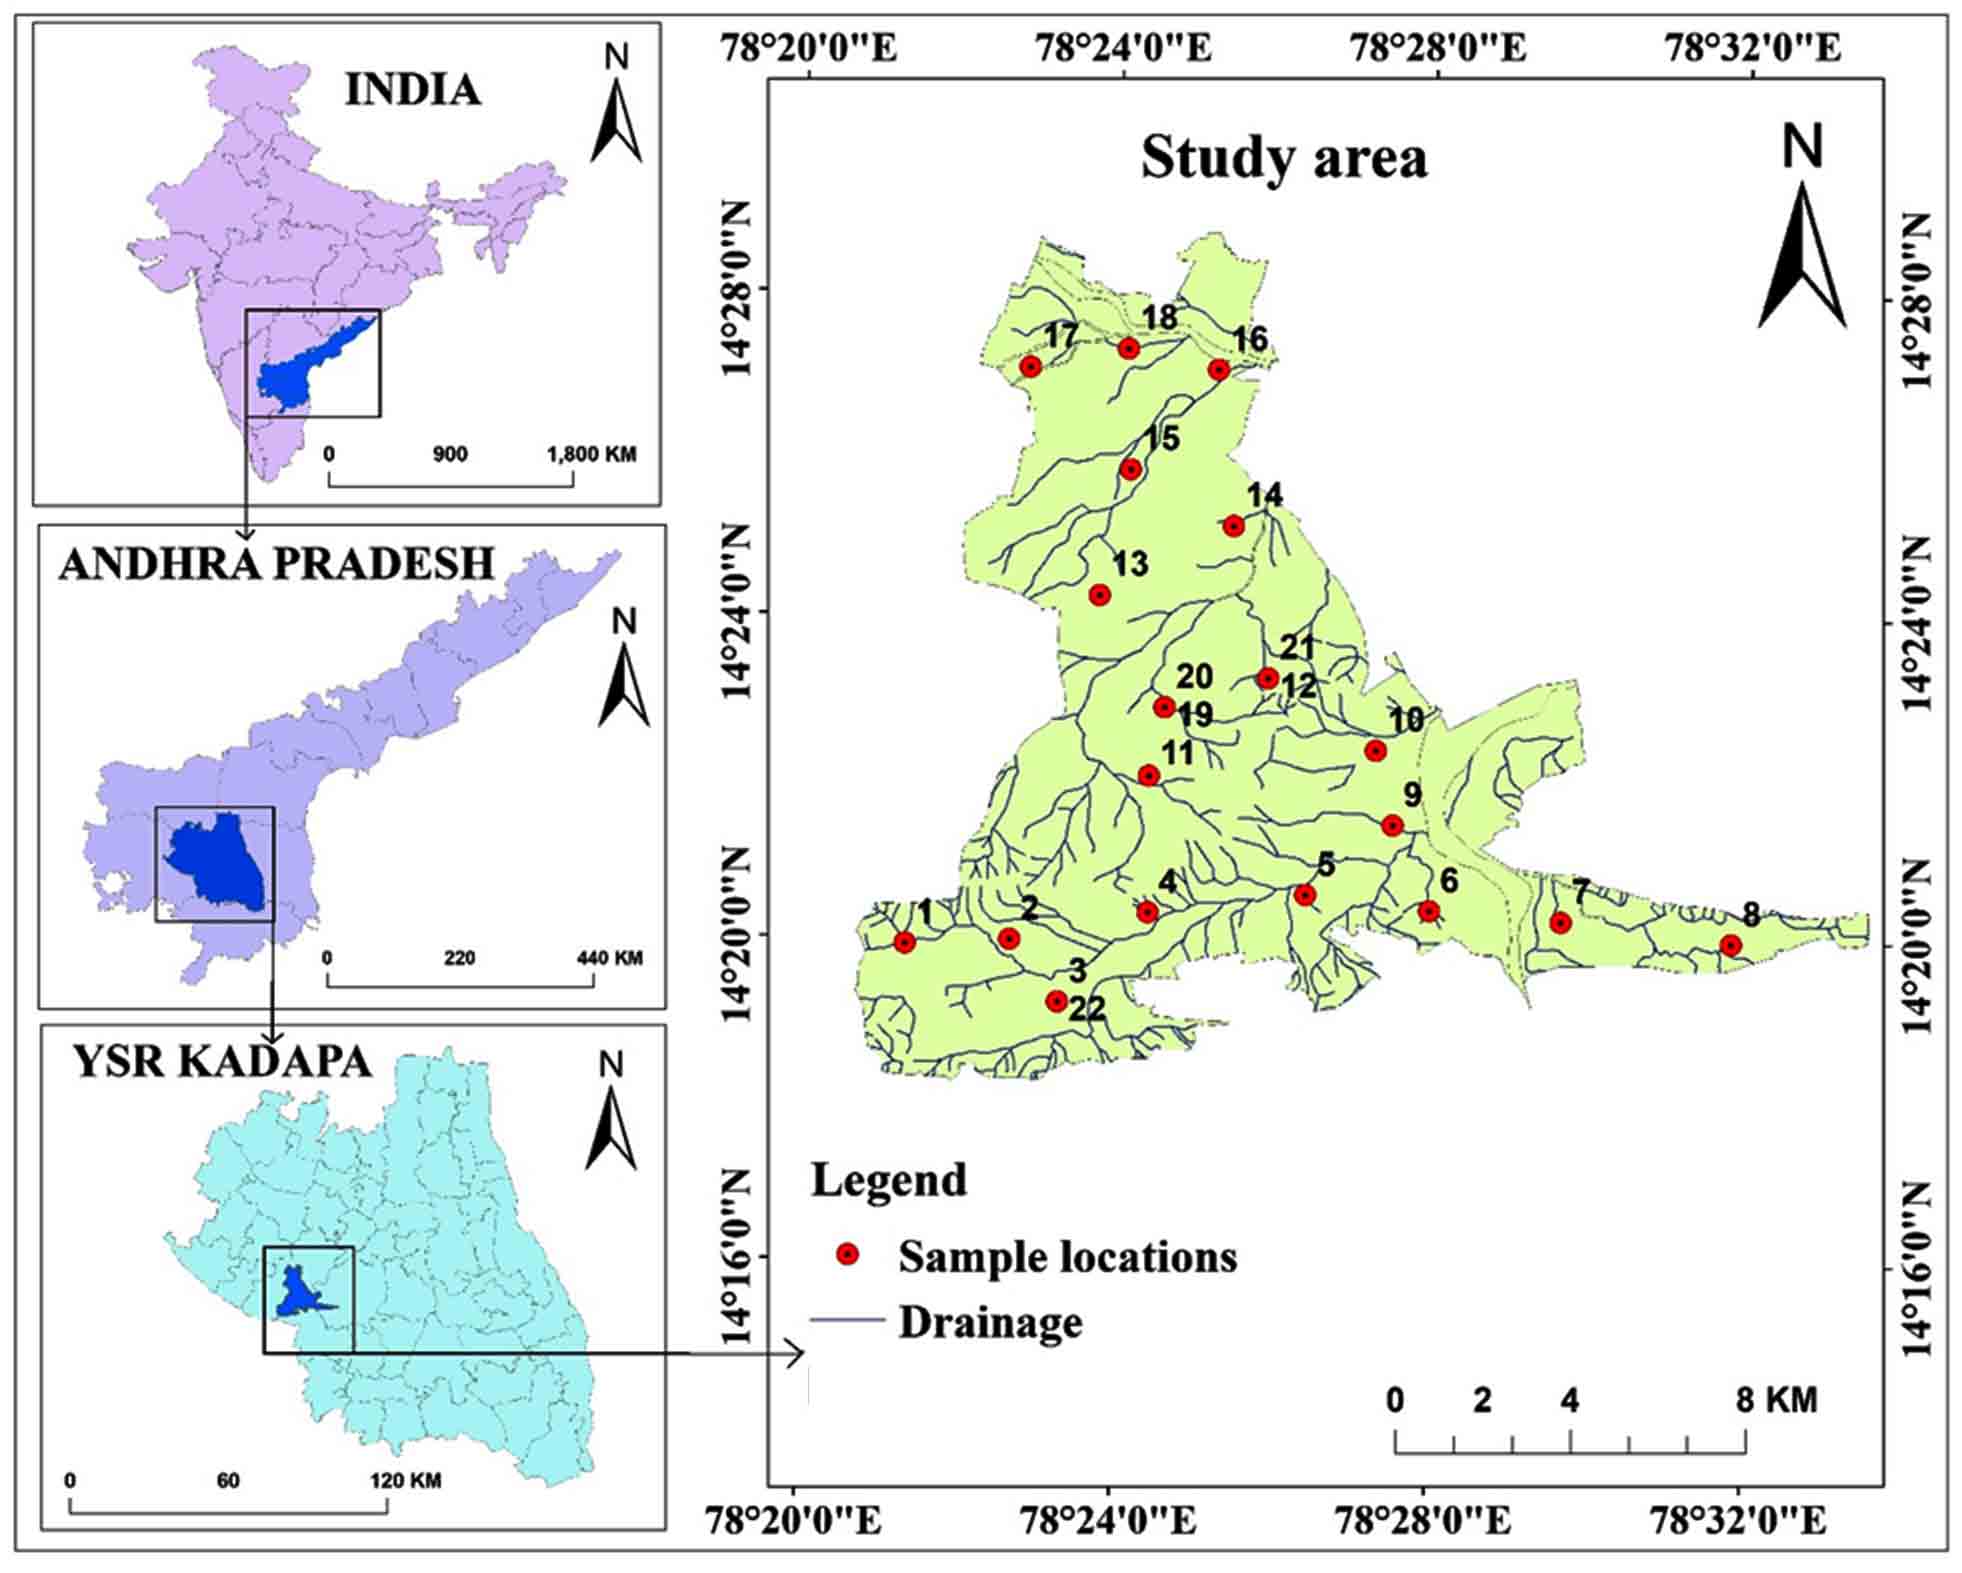
The study region lies between 78º 24ʹ 32" to 78º 05ʹ 0" E and 14º 32ʹ 0" to 14º 35ʹ 30" N (SOI toposheets: 57J/06 and 57J/11) with an area of 168.21 km2 of the Vempalle Mandal, YSR district, Andhra Pradesh (Figure 1). A tropical climate observed with an average annual temperature of 34ºC and precipitation of 753mm per year. Brown and red soils as well as loam and shallow and deep clay loam soils are observed in the region. Groundnut, sunflower, red gram, Bengal gram, paddy, cotton, and Sesamum are among the crops produced.
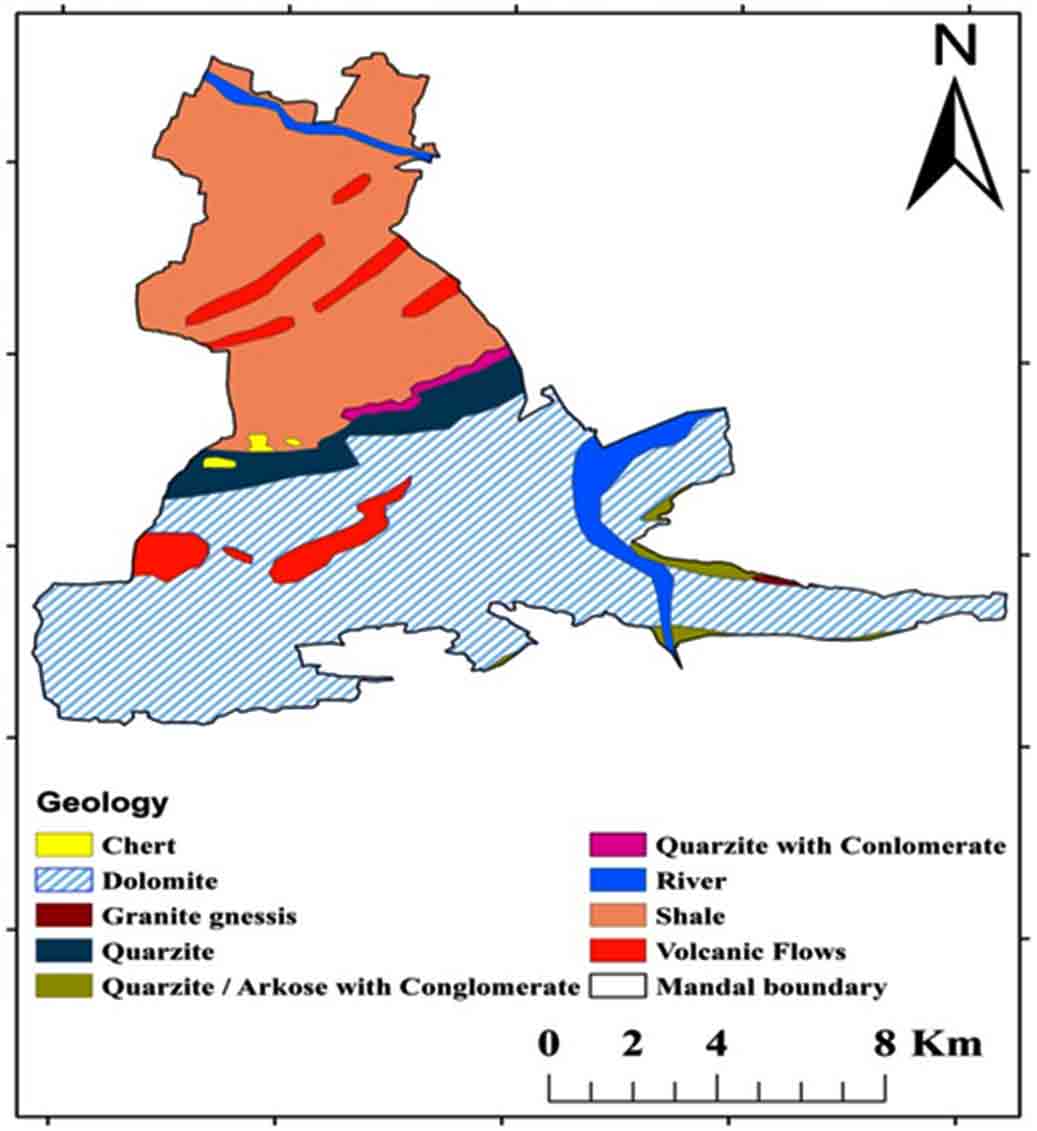
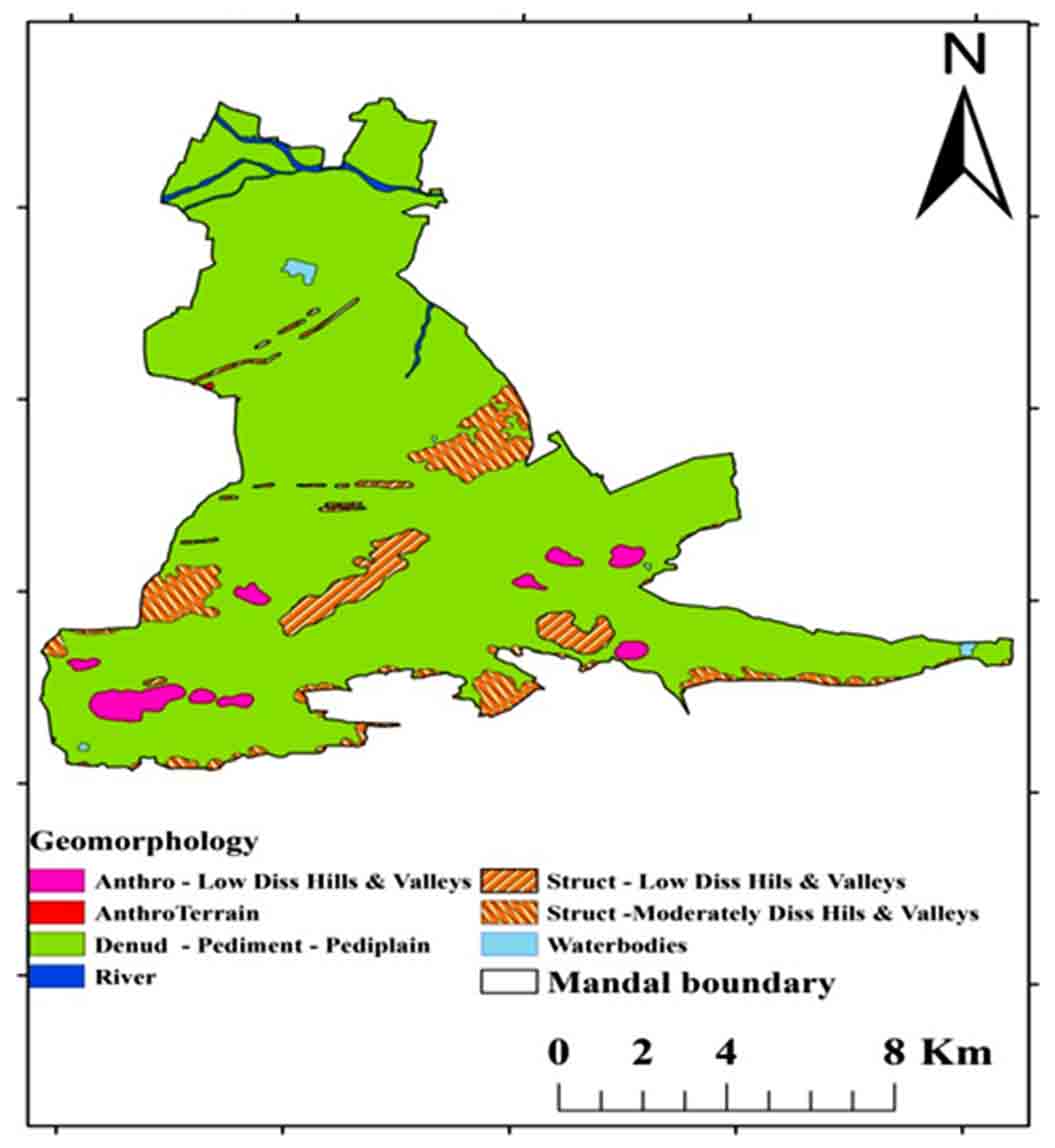
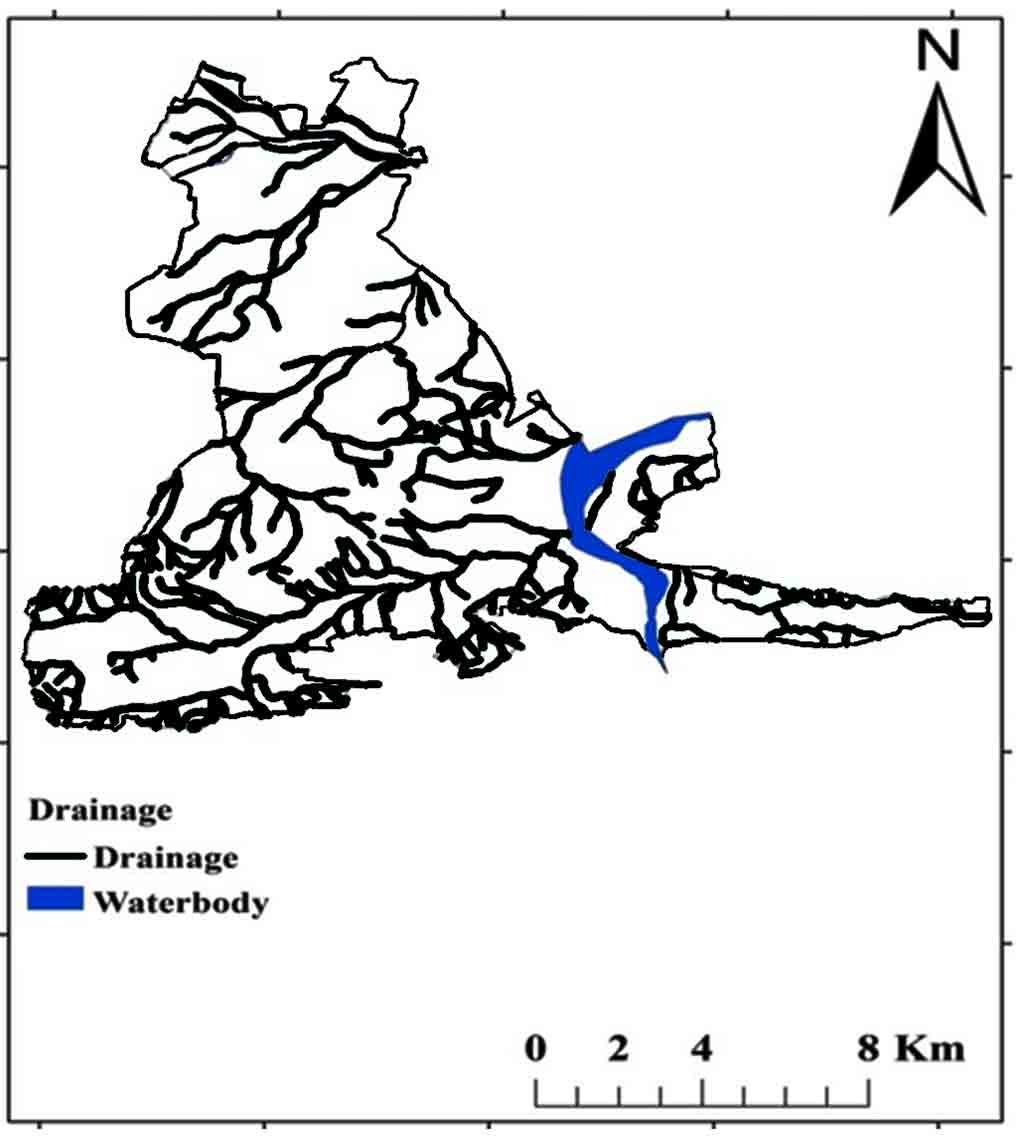
According to Zachariah (1999), the Tadipatri and Vempalle formations are 1779 Ma and 1752 Ma, respectively, and the Pulivendula formation is 1817 Ma, according to Bhaskar Rao et al., (1995). The Papaghni Group’s Vempalle Formation in the Cuddapah Supergroup is mostly composed of basic flows, dolomite, quartzite, conglomerate, and shale (Figure 2). Residual hills, Pediment, Pediplain, Structural hills and valleys are examples of geomorphological terrain generated by denudational, fluvial, and structural sources (Figure 3). The depth of the water fluctuates between 10 and 50m (CGWB, 2014). The Mogamureru River, a tributary of the Papaghni River, rises from west to east and joins the Papaghni River in Animela village in Veerapunayunipalle Mandal, with a primarily dendritic drainage pattern (Figure 4).
3 . METHODOLOGY
Twenty-two samples collected from villages in the Vempalle Mandal of the YSR district. One liter storage cans were cleaned and disinfected before being preserved with nitric acid. The samples were analyzed to determine ex-site and in-site characteristics such as alkalinity (carbonates and bicarbonates), chlorides, magnesium, calcium, electrical conductivity, pH, total dissolved solids, and total hardness (Table 1). In the laboratory, alkalinity, Cl-, and Mg2+ parameters are measured using the titration method, Ca2+ is measured using a flame photometer, pH is determined using a pH meter, and EC and TDS are assessed using conductivity meter. Parameters that are compared to the ranges of the Bureau of Indian Standards are also shown in the graphs. The weighted arithmetic technique was used to calculate the Water Quality Index. The parameters and WQI values showed on the maps using the IDW tool of Arc-GIS software.
Table 1. Physico-chemical parameters
|
S. No
|
Village Name
|
Longitude
|
Latitude
|
pH
|
EC
|
TDS
|
Ca2+
|
Mg 2+
|
CO32-
|
HCO3-
|
Cl-
|
TH
|
|
1
|
Vempalle
|
78.355721°
|
14.331964°
|
7.9
|
1020
|
600
|
50
|
65
|
15
|
85
|
350
|
68
|
|
2
|
Edupulapaya
|
78.377839°
|
14.332943°
|
8.5
|
968
|
575
|
125
|
82
|
47
|
69
|
110
|
87
|
|
3
|
A. Cherlopalli
|
78.388129°
|
14.320102°
|
7.5
|
1151
|
690
|
84
|
39
|
24
|
42
|
454
|
25
|
|
4
|
Ramireddypalle
|
78.407050°
|
14.338755°
|
8.5
|
1590
|
954
|
135
|
58
|
58
|
0
|
647
|
658
|
|
5
|
Ammaigaripalli
|
78.440434°
|
14.342626°
|
7.7
|
634
|
390
|
65
|
112
|
12
|
36
|
100
|
125
|
|
6
|
pamuluru
|
78.466688°
|
14.339588°
|
7.2
|
875
|
520
|
190
|
96
|
37
|
94
|
78
|
98
|
|
7
|
Alavalapadu
|
78.494623°
|
14.337503°
|
8
|
1350
|
800
|
150
|
35
|
45
|
54
|
441
|
358
|
|
8
|
Borlagondicheruvu
|
78.530698°
|
14.333185°
|
7.2
|
942
|
570
|
84
|
99
|
0
|
0
|
332
|
574
|
|
9
|
Naguru
|
78.458748°
|
14.357179°
|
8.8
|
1110
|
675
|
73
|
112
|
24
|
65
|
376
|
45
|
|
10
|
Musulreddypalli
|
78.455109°
|
14.372630°
|
7
|
954
|
590
|
100
|
58
|
29
|
38
|
320
|
39
|
|
11
|
T. Velamavaripalli
|
78.407051°
|
14.366983°
|
7.4
|
798
|
490
|
95
|
43
|
0
|
0
|
232
|
187
|
|
12
|
Alireddypalli
|
78.432104°
|
14.387316°
|
8.5
|
1105
|
670
|
120
|
120
|
0
|
0
|
410
|
354
|
|
13
|
Chinthalamadugupalli
|
78.396207°
|
14.404166°
|
7.5
|
1288
|
780
|
50
|
45
|
19
|
90
|
500
|
456
|
|
14
|
kattuluru
|
78.424502°
|
14.418699°
|
8
|
1006
|
612
|
174
|
65
|
46
|
68
|
195
|
291
|
|
15
|
kuppalapalli
|
78.402485°
|
14.430193°
|
7.6
|
748
|
460
|
32
|
54
|
35
|
85
|
230
|
257
|
|
16
|
pamuluru
|
78.420971°
|
14.450894°
|
8.5
|
967
|
590
|
71
|
100
|
21
|
36
|
290
|
457
|
|
17
|
Vempalli
|
78.381039°
|
14.451130°
|
7.7
|
1120
|
670
|
89
|
87
|
27
|
65
|
364
|
354
|
|
18
|
Tallapalli
|
78.401835°
|
14.455093°
|
7.7
|
990
|
600
|
150
|
30
|
38
|
102
|
270
|
254
|
|
19
|
Eguvathuvvapalli
|
78.410204°
|
14.381103°
|
7
|
600
|
500
|
55
|
60
|
17
|
0
|
200
|
74
|
|
20
|
Mallepalli
|
78.371232°
|
14.390213°
|
8
|
1000
|
650
|
90
|
118
|
25
|
70
|
420
|
550
|
|
21
|
mopurigaripalli
|
78.501485°
|
14.420752°
|
8.3
|
700
|
590
|
86
|
85
|
44
|
80
|
300
|
130
|
|
22
|
Nandipalli
|
78.512934°
|
14.440371°
|
8
|
620
|
750
|
35
|
125
|
35
|
100
|
445
|
200
|
3.1 Water Quality Index (WQI)
The Water Quality Index is unique measurement that identifies the root causes of contradictory water qualities. The suitability components of water for people used to calculate the WQI. pH, electrical conductivity, chloride, dissolved solids, hardness, sulphate, sodium, manganese, calcium, potassium, and magnesium were taken into account while computing WQI. The weighted computation by the WQI used in many kinds of research this type of estimates (Bouslah et al., 2017; Jamshidzadeh et al., 2018; Ekere et al., 2019; Chowdhury et al., 2021).
3.2 Weighted Arithmetic Water Quality Index
The weighted arithmetic water quality index clarifies the water quality according to the standard of quality by using the most commonly measured water quality factors. Numerous scientists have used this technique (Chauhan et al., 2010; Balan et al, 2012; Chowdhury et al., 2021) to calculate WQI (Rown et al., 1972; Xiao et al., 2019; Gao et al., 2020; Ram et al., 2021):
\(K = {1 \over \sum({1 \over Si})}\)
where, k denotes steady-state proportionality, Si is standards of parameter.
The sub-index (Wi) was calculated by taking the parameter’s optimal (ideal) value:
\(Wi = {K \over Si}\)
The following formula used to calculate the sub-index (Qi).
\(Wi = 100 [{Vi-V0 \over Si-V0}]\)
where, Vi is concentrate of the parameter in analyzing water, Si is standard desirable value of parameter, Vo is the parameter’s actual value in pure water (for natural water and Vo is 0 for hardness.
\(WQI= {\sum Wi Qi \over \sum Wi}\)
where, WQI is a number between 0 and 100 that indicates the quality of the water; Qi is a relative value of water specific to each parameter; i is represent the range of parameters.
4 . RESULTS AND DISCUSSION
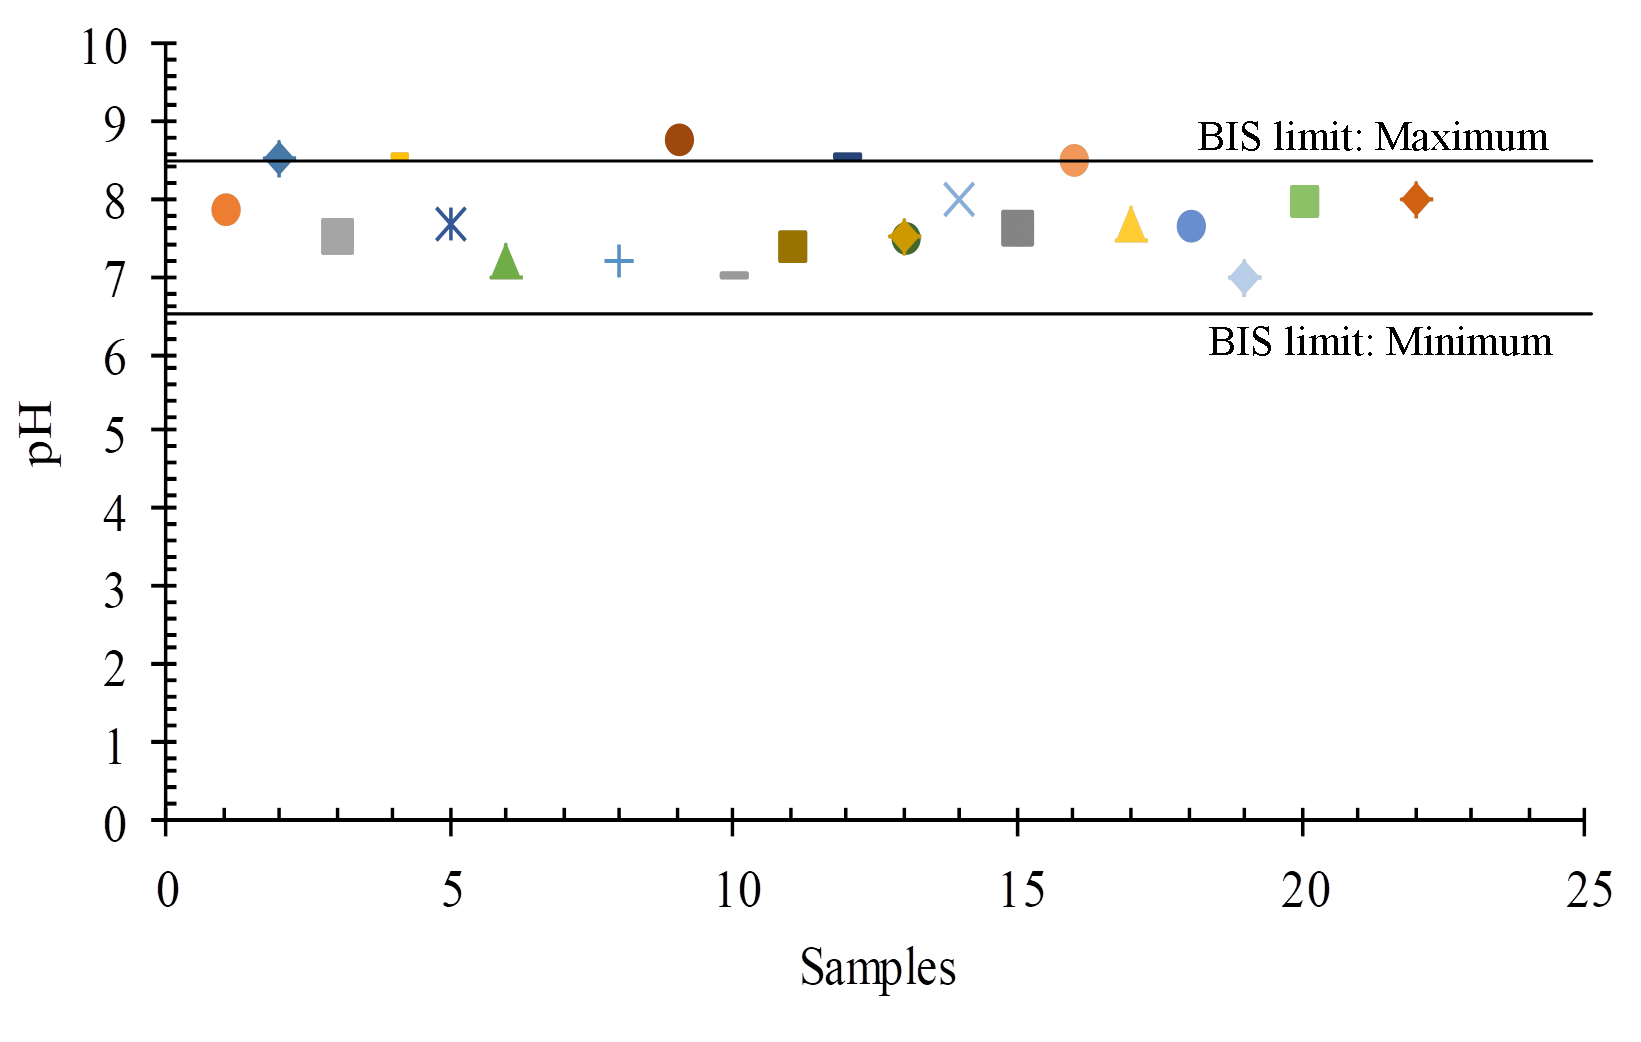
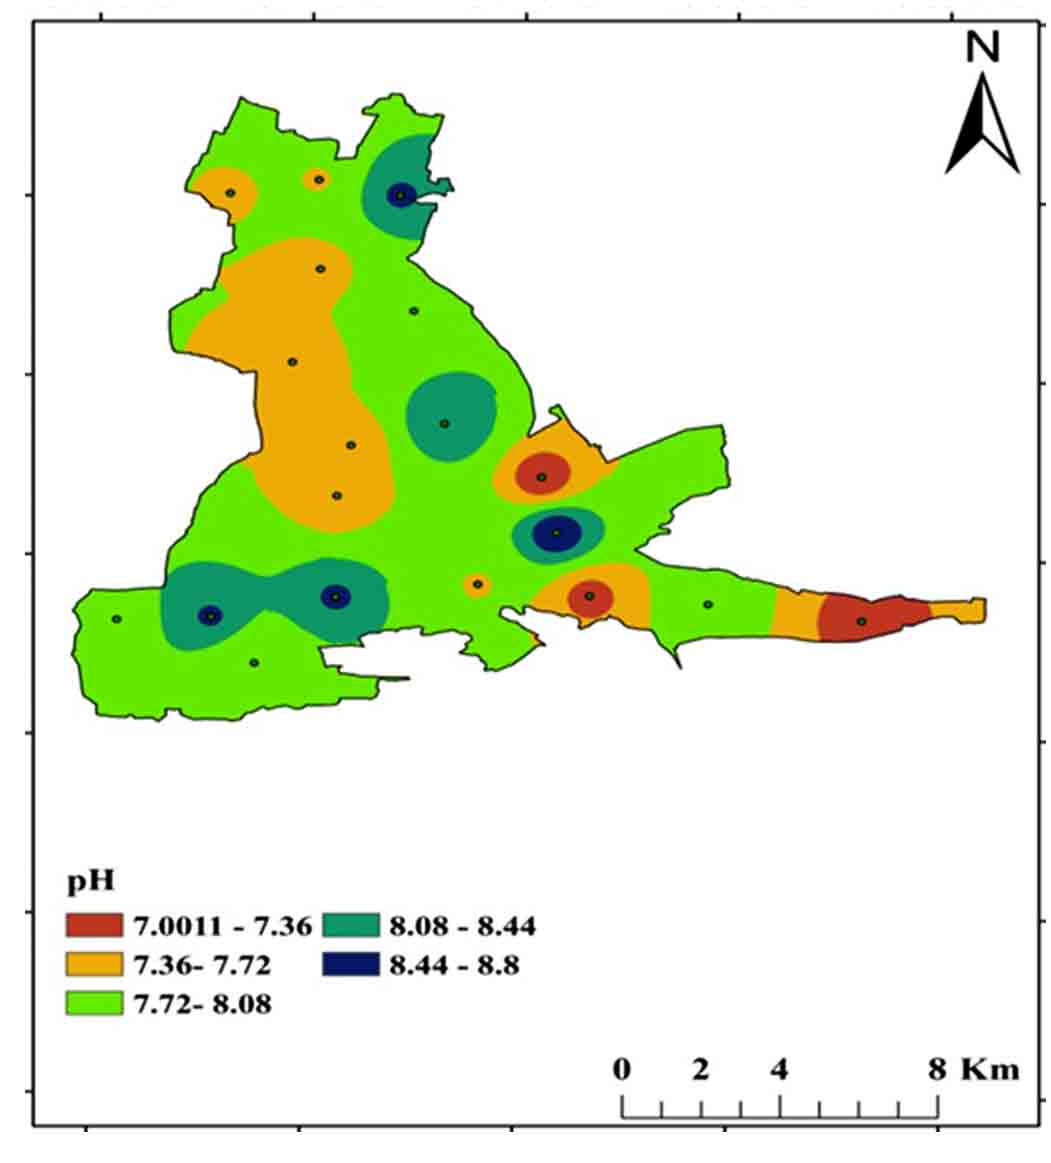
4.1 pH
The quality and penetration rate of groundwater recharge, the rate of refilling water, and the interaction between water and rock in the aquifer all influence pH fluctuations in space and time. The recommended BIS limit for drinking purposes is 6.5 to 8.5 pH, and in the study area ranges from 7.0 to 8.8 (Figures 5 and 6).
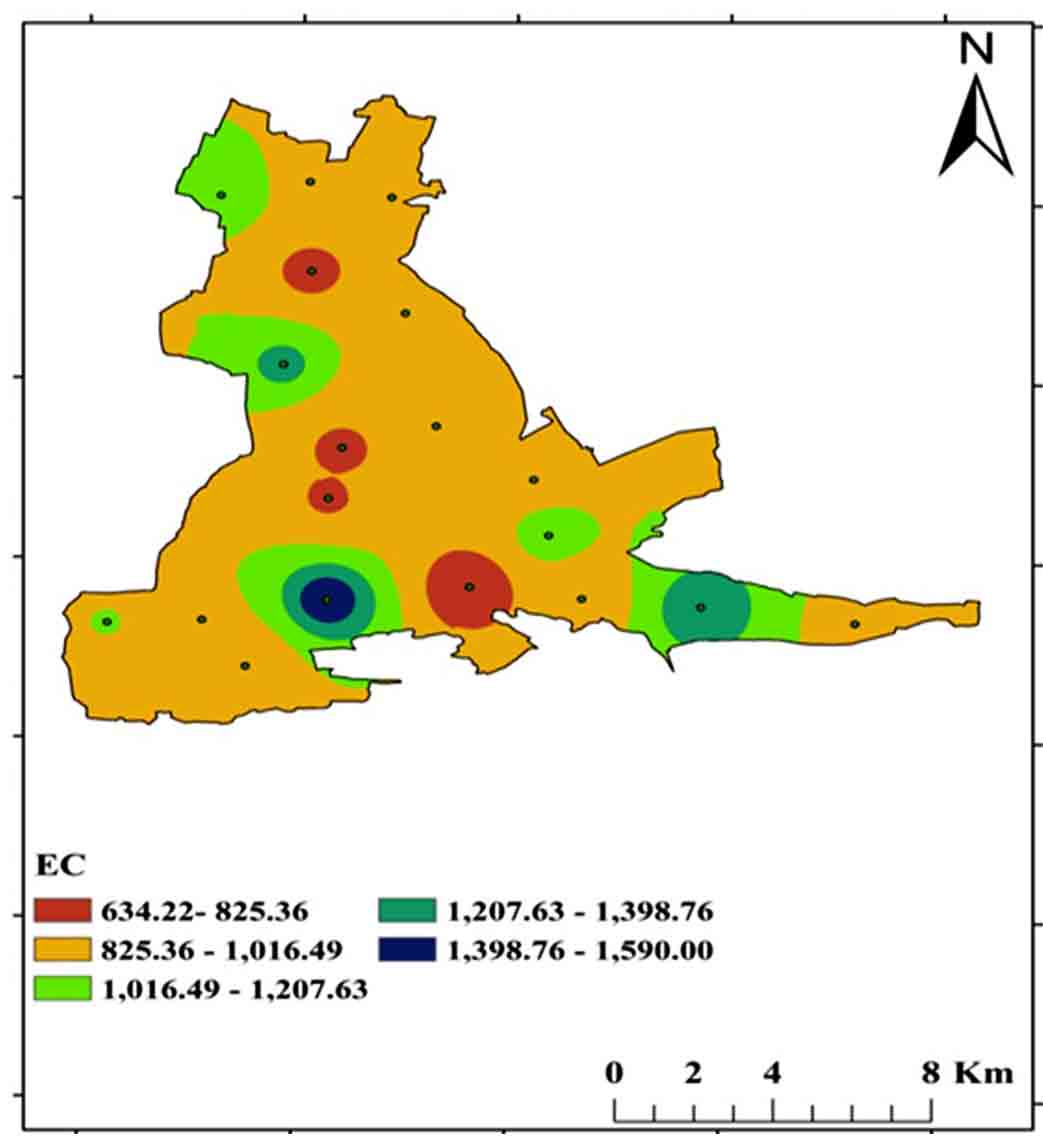
4.2 Electrical Conductivity
Electrical conductivity defined as its ability to conduct an electric current. When salts or other chemical substances dissolve which divided into positive and negative ions. Electrical conductivity can be classed into four categories: excellent, good, permitted, and dubious (Tlili-Zrelli et al., 2018). The study region ranges from 600 to 1590 μS/Cm, with samples falling into the good and permissible categories (Table 2; Figure 7).
Table 2. Electrical conductivity
|
Water classes
|
EC
|
Samples
|
Sample
|
|
No.
|
%
|
|
Excellent
|
<250
|
-
|
-
|
|
Good
|
250-750
|
4
|
18
|
|
Permissible
|
750-2250
|
18
|
82
|
|
Doubtful
|
>2250
|
-
|
-
|
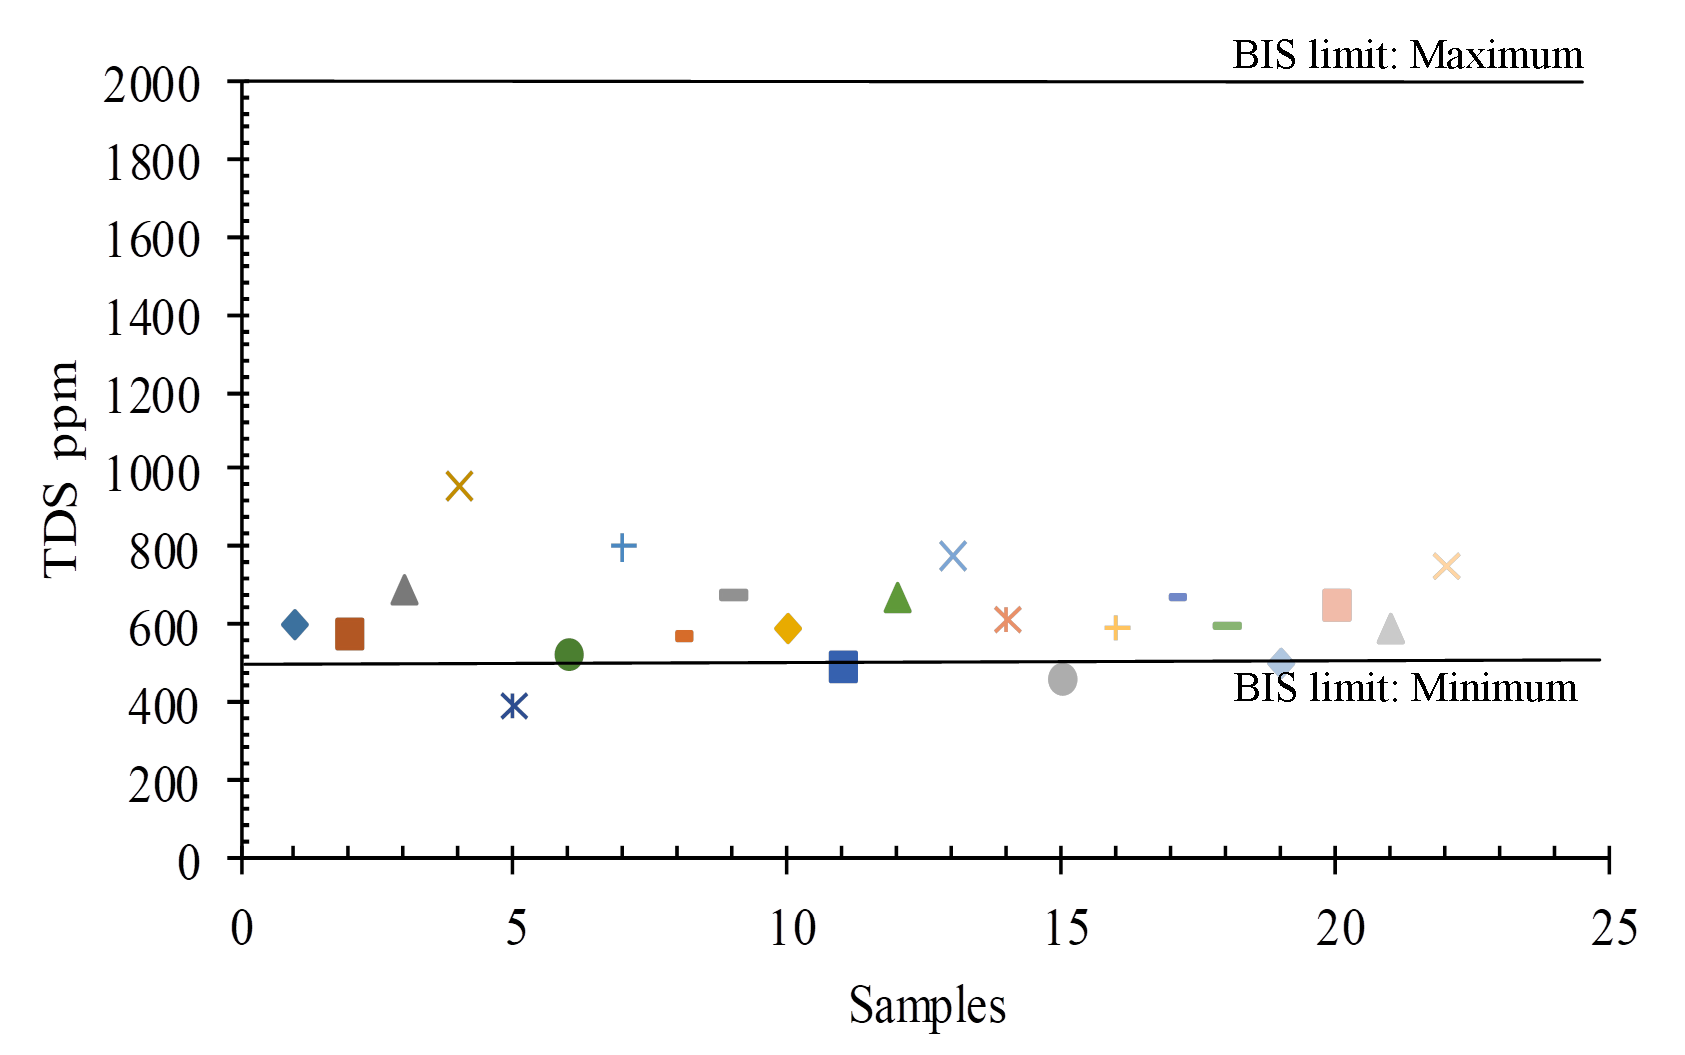
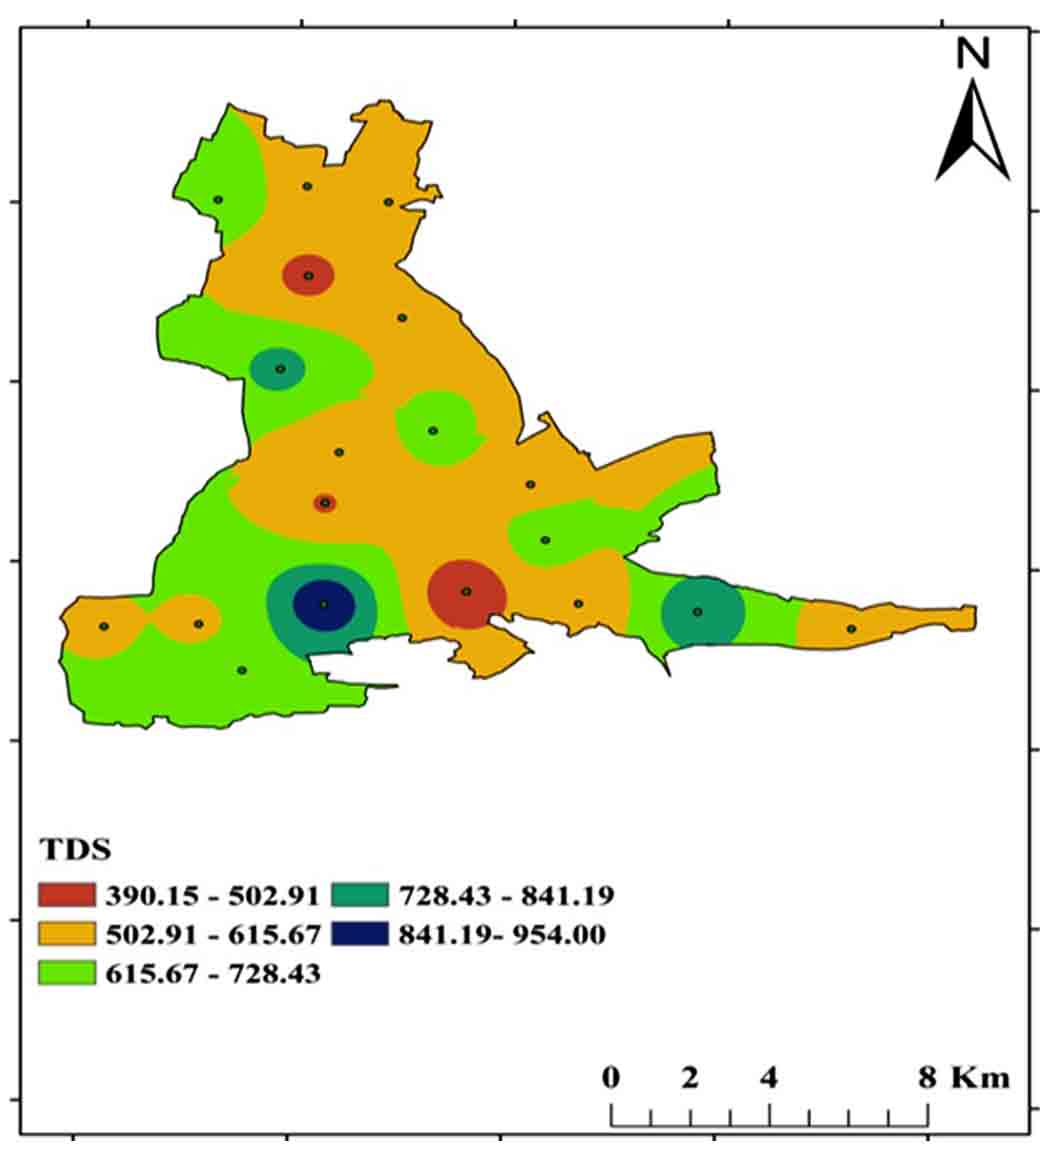
4.3 Total Dissolved Solids (TDS)
TDS is an abbreviation for total dissolved solids, which are inorganic and small amounts of organic components that are present in water as a solution. For drinking purposes, the BIS (2012) permissible limit is 500 mg/L to 2000 mg/L, with a range of 390-954 mg/L in the study region (Figure 10 and 8). Fresh water, slightly brackish water, slightly brackish water, brackish water, saline water, and braine water are the six forms of TDS (Ramaraju and Giridhar 2017). All samples were fallen into freshwater category and the TDS (Table 3).
Table 3. Total Dissolved Solids
|
Water Class
|
Concentration of TDS (Todd 2005) mg/l
|
No. of Samples
|
|
Fresh water
|
10-1000
|
All
|
|
Slightly water
|
-------
|
-
|
|
Slightly-brackish water
|
1000-10,000
|
-
|
|
Brackish water
|
10,000-10,0000
|
-
|
|
Saline water
|
-----
|
-
|
|
Braine water
|
>10,0000
|
-
|
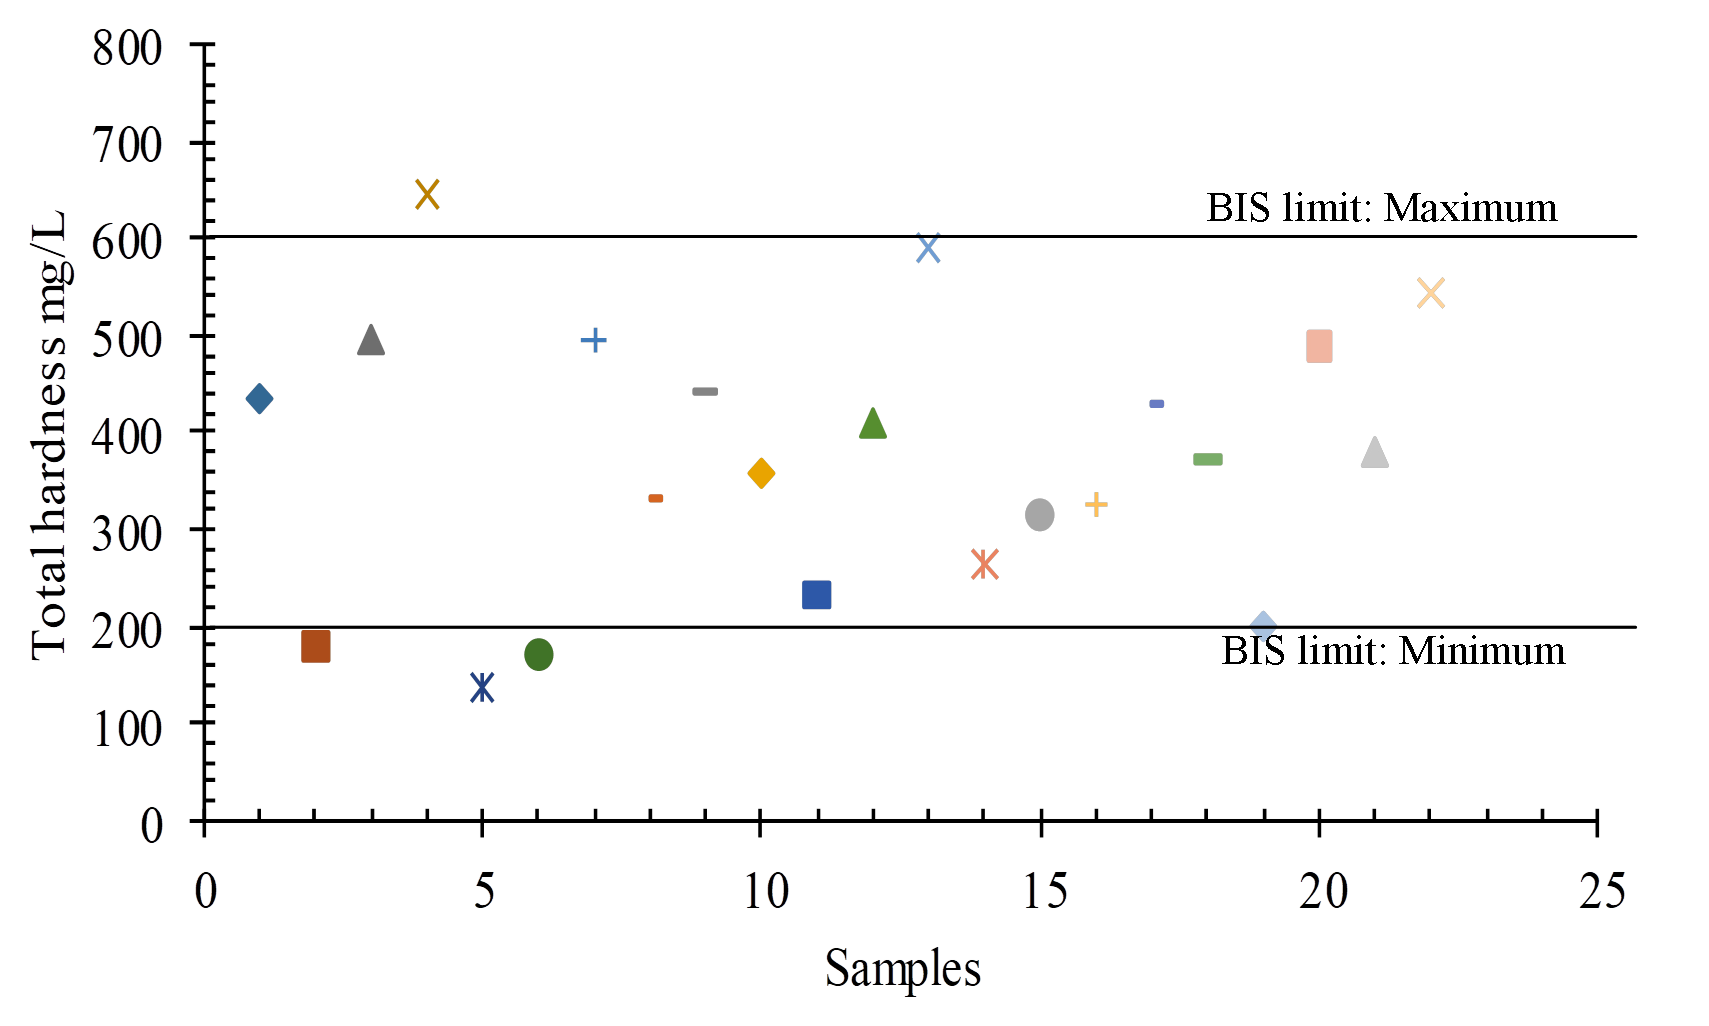
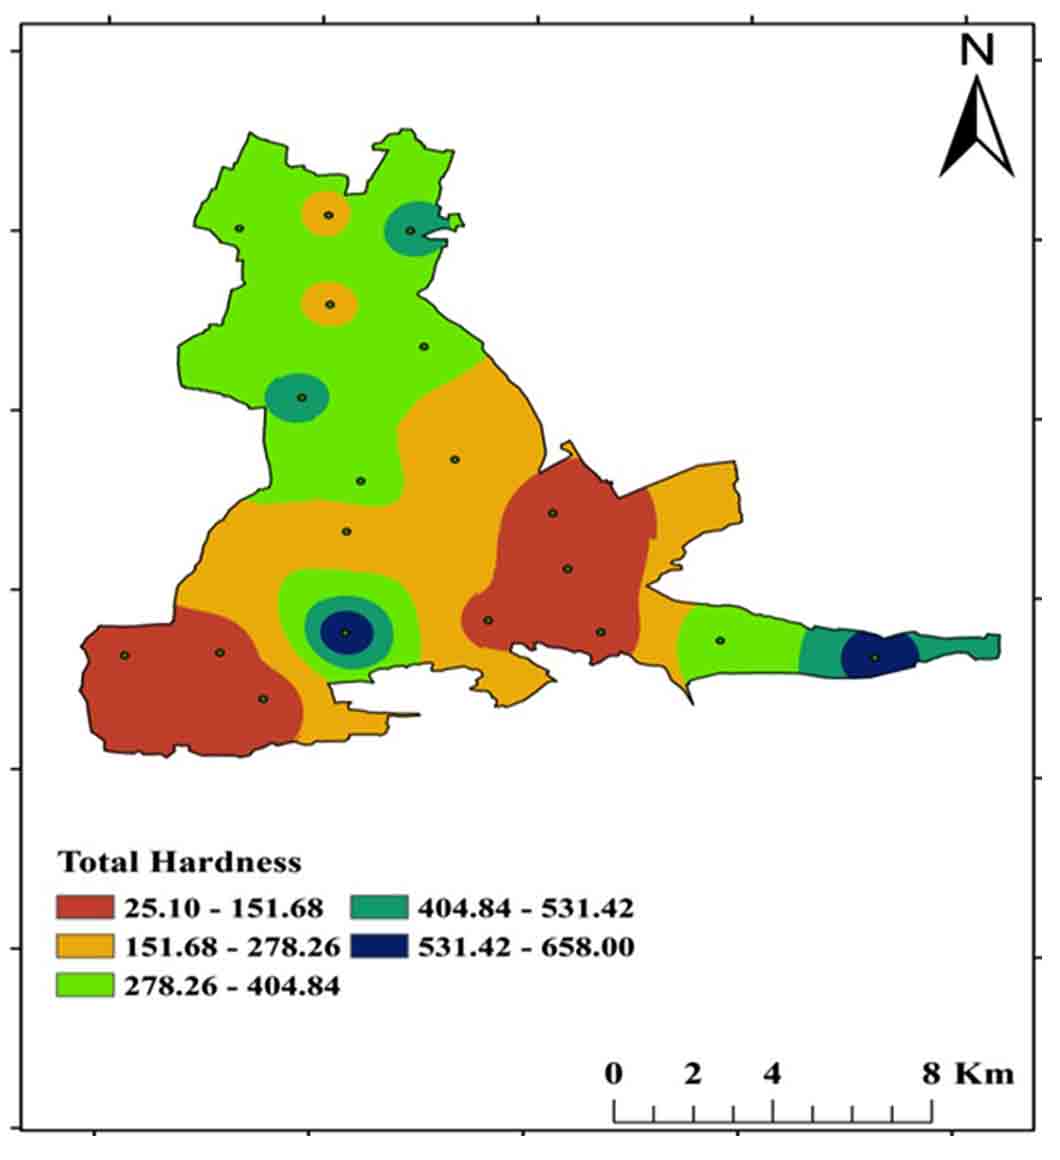
4.4 Hardness
Dissolved polyvalent metallic ions from sedimentary rocks such as limestone and dolomite are the most common causes of hardness in water, and the two main ions are Ca2+ and Mg 2+. Carbonate (temporary) and non-carbonate (permanent) hardness are two types of total hardness. For drinking purposes, the BSI (2012) permissible range is 200 mg/L to 600 mg/L TH, with a range of 25mg/L-658 mg/L in the study region (Figure 9 and 11).
Total hardness (mg/l as CaCO3) = Carbonate hardness + Non-carbonate hardness
\(Calcium \ Hardness = 20 { mg \over L} {\times} {{(100 \ Caco3)⁄Mm} \over (400 mg \ Calcium)⁄Mm} mg/L\)
\(Magnesium \ Hardness = 10 { mg \over L} {\times} {{(100 \ Caco3)⁄Mm} \over (24.31 mg \ Calcium)⁄Mm} mg/L\)
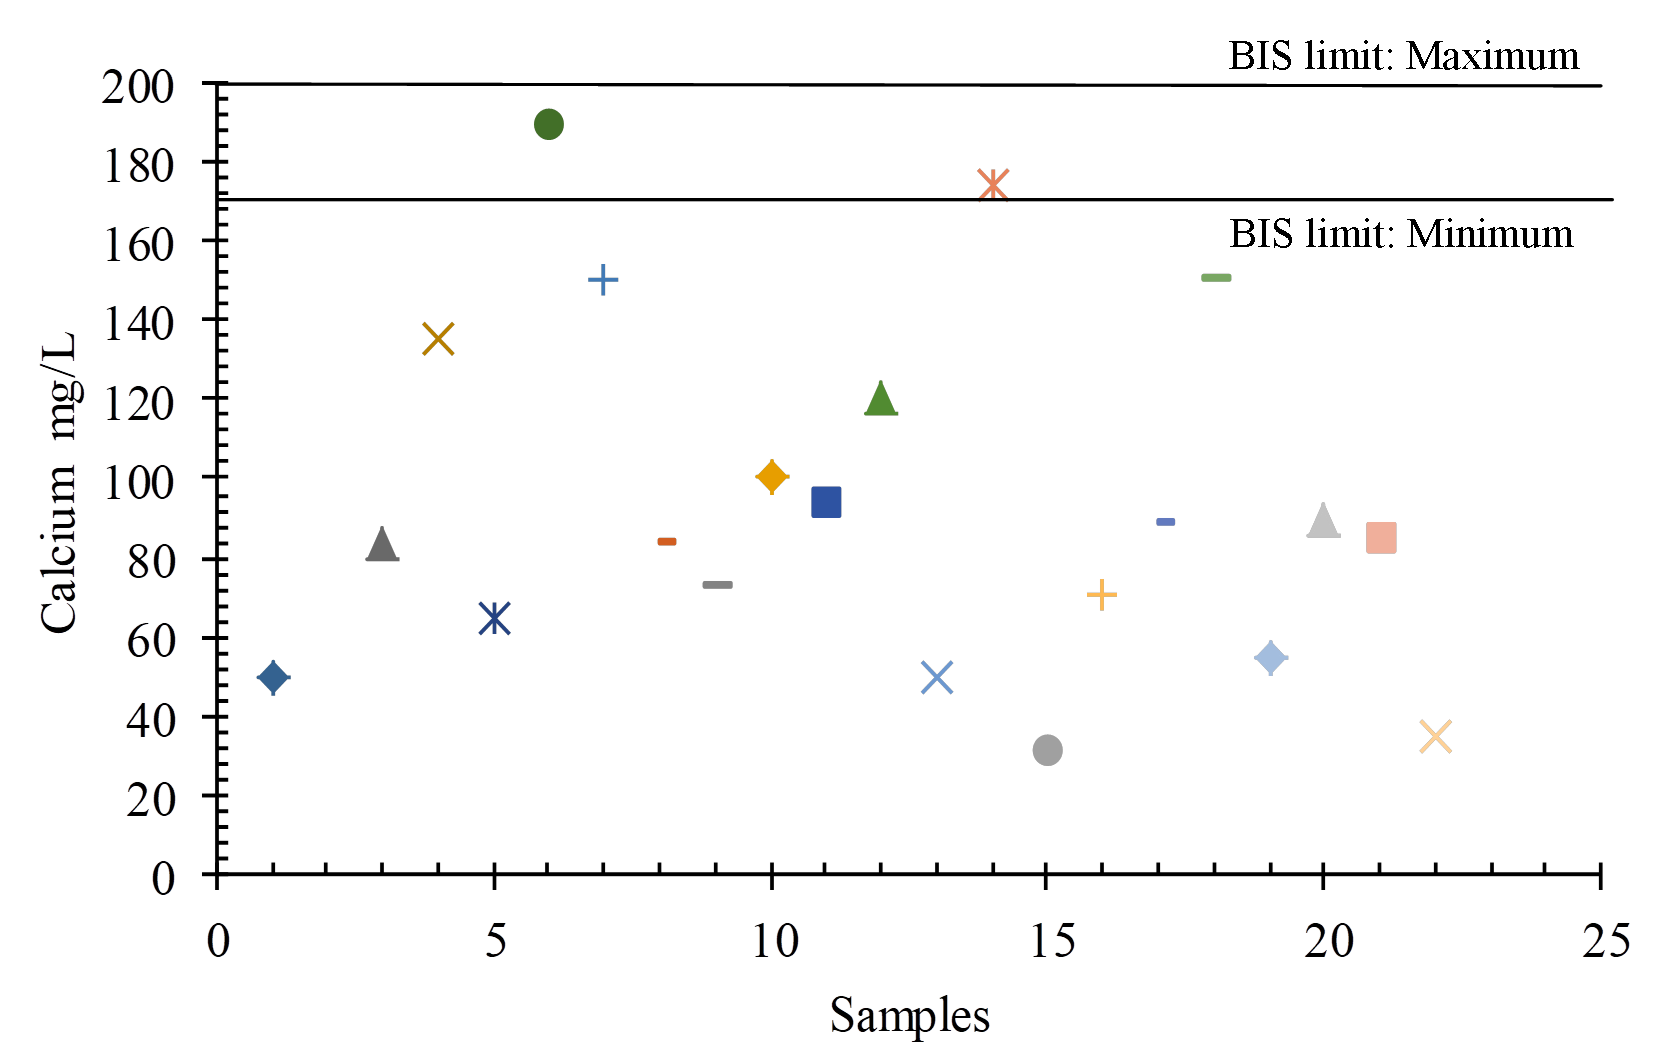
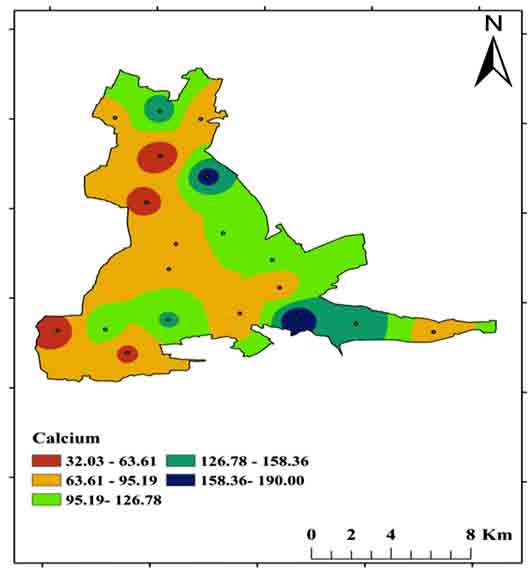
4.5 Calcium
Calcium (Ca2+) may dissolve from rocks such as limestone and dolomite in the study area. For drinking purposes, the BIS (2012) permissible limit is Ca2+ 75 mg/L to 200 mg/L, whereas in the study area ranges between 32 mg/Land 190 mg/L (Figures 12 and 14).
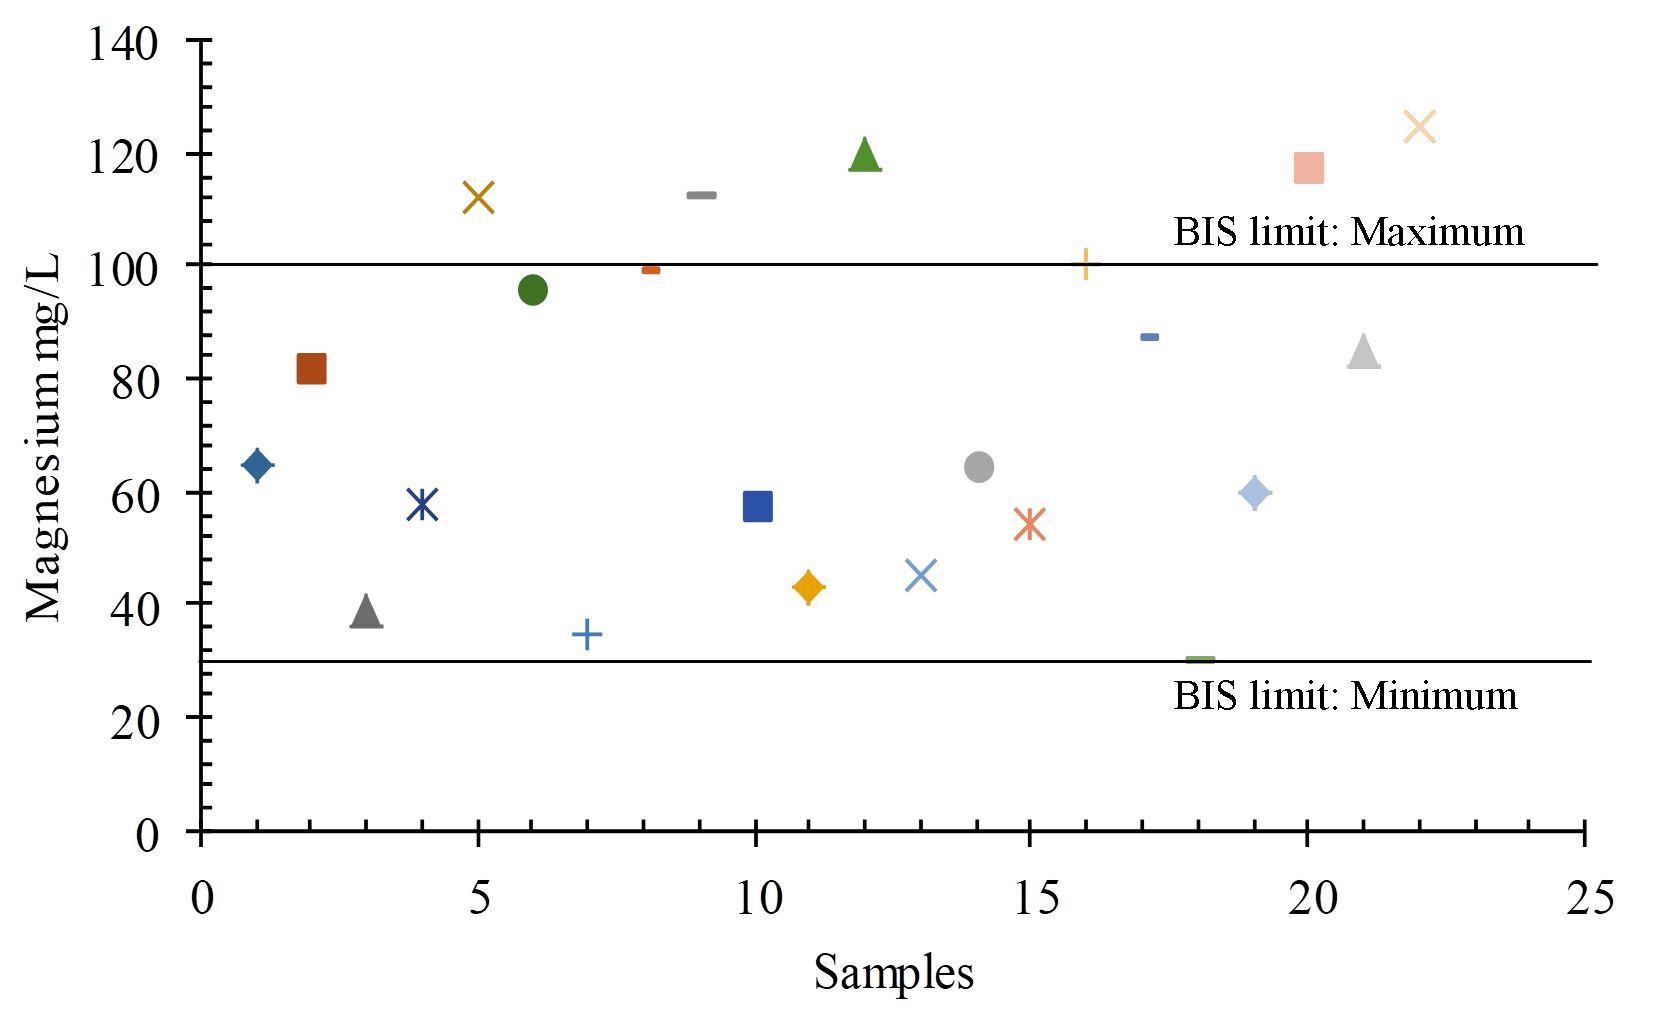
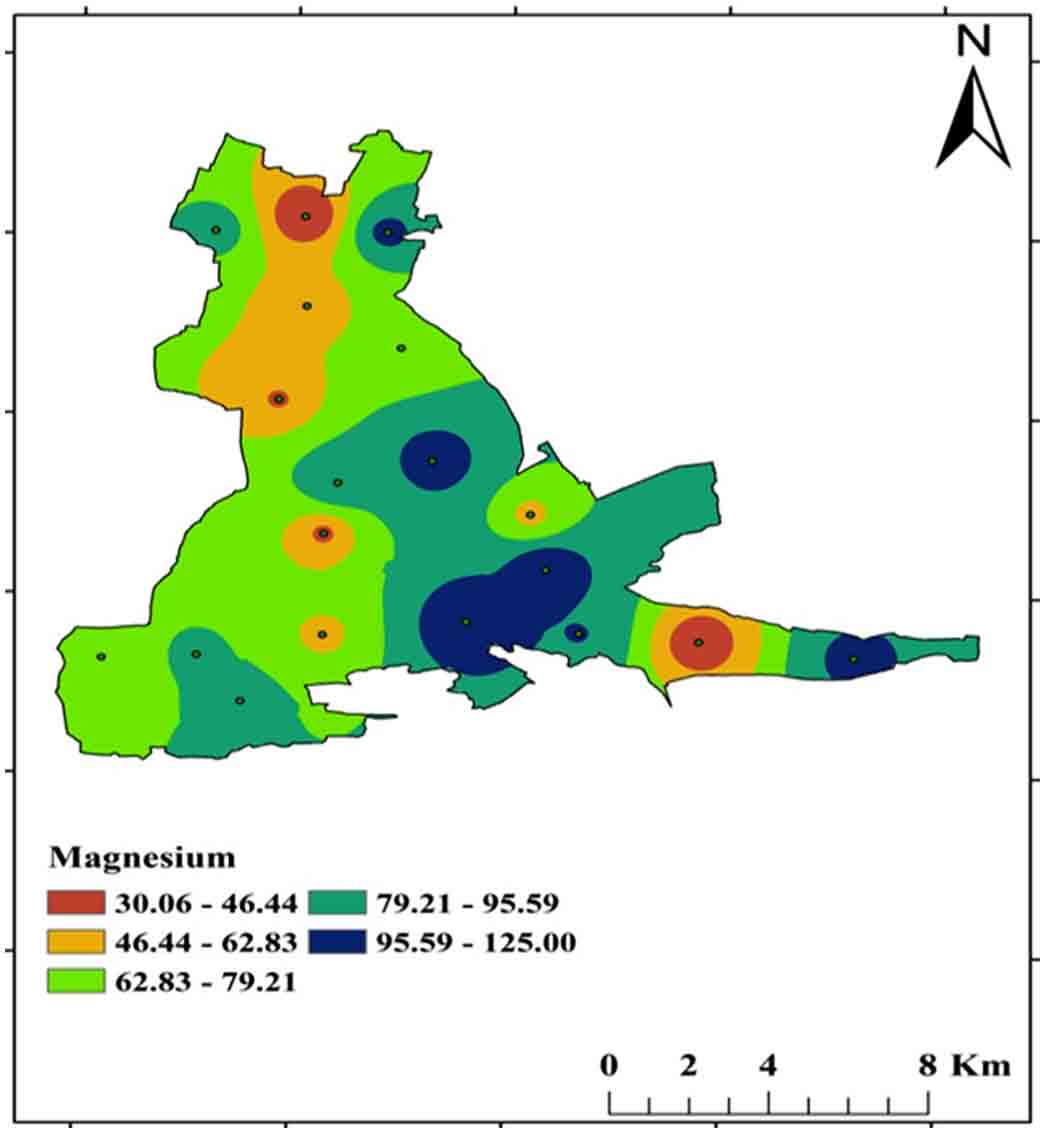
4.6 Magnesium
Magnesium (Mg2+) is the most abundant element in the earth’s crust and is formed by the weathering of specific minerals such as dolomite. Magnesium, together with calcium, is necessary for water hardness. For drinking purposes, the BIS (2012) permissible limit is Mg2+ from 30 mg/L to 100 mg/L, and concentrations ranging from 30 mg/L-125 mg/L in the study area (Figure 13 and 15).
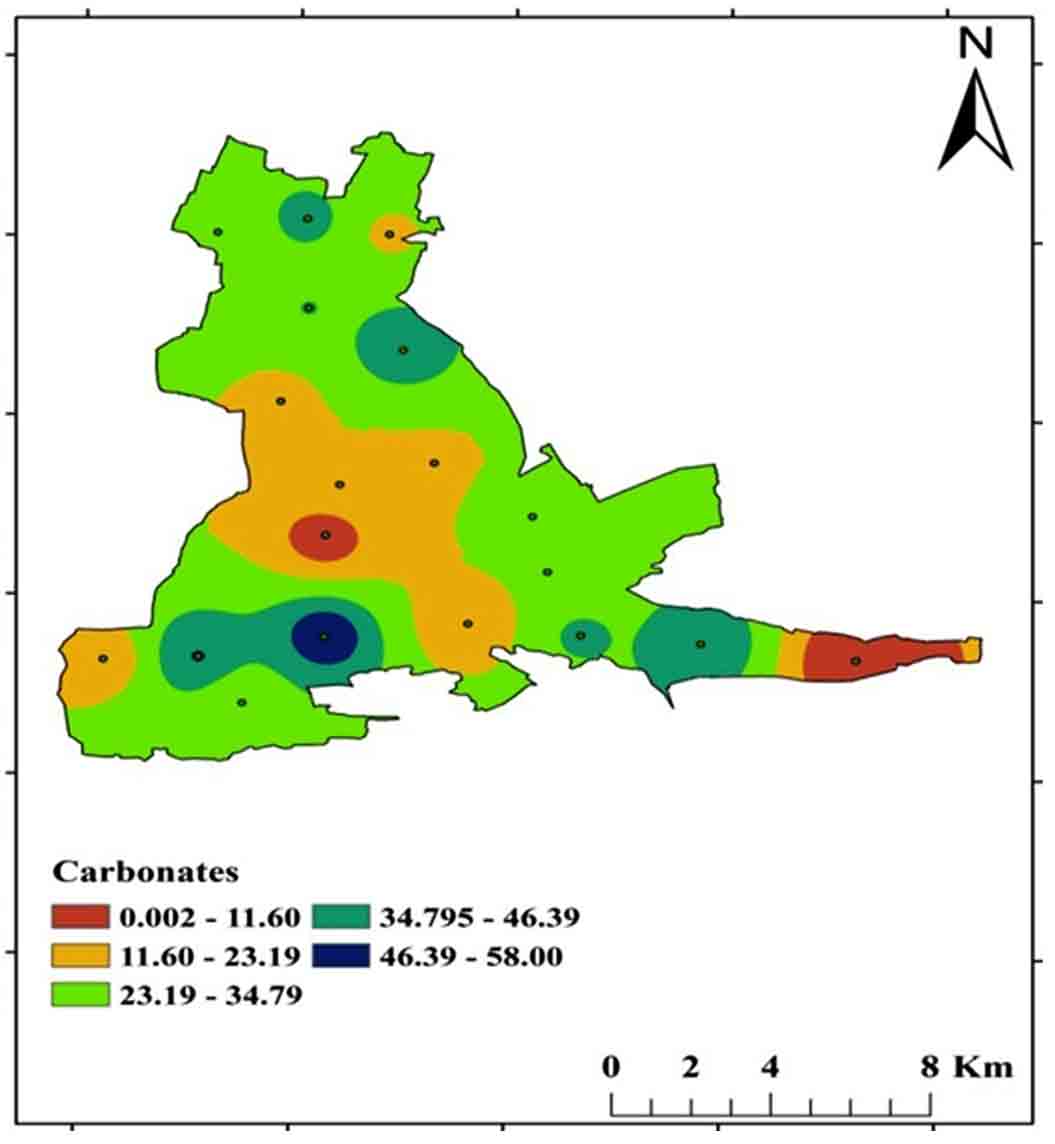
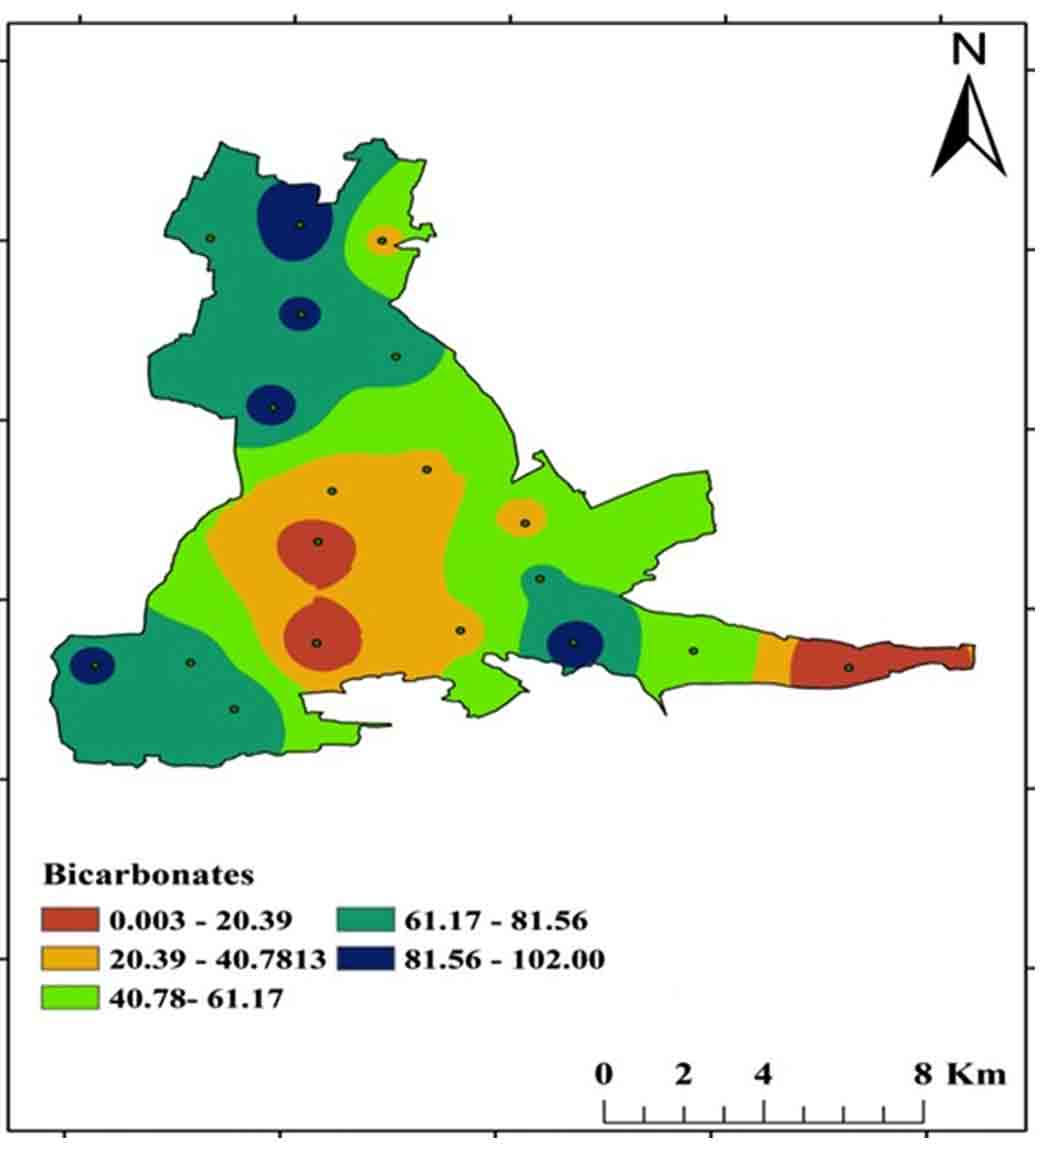
4.7 Carbonates (CO3-) and Bicarbonates (HCO3-)
Carbonates (CO32-), Bicarbonates (HCO3-), and hydroxide compounds, as well as Phosphates, Silicates, and Borates, make up the alkaline character of water. Carbonates are typically found in carbonaceous rocks such as limestone, and this sort of environment has a high alkalinity and hardness. CO3- and HCO3- concentrations in the research area range from 0-58 mg/L and 0-102 mg/L, respectively. Soft water has low alkalinity, while hard water has significant alkalinity Figure 16 and 17 shows a spatial distribution map of CO3- and HCO3- concentrations.
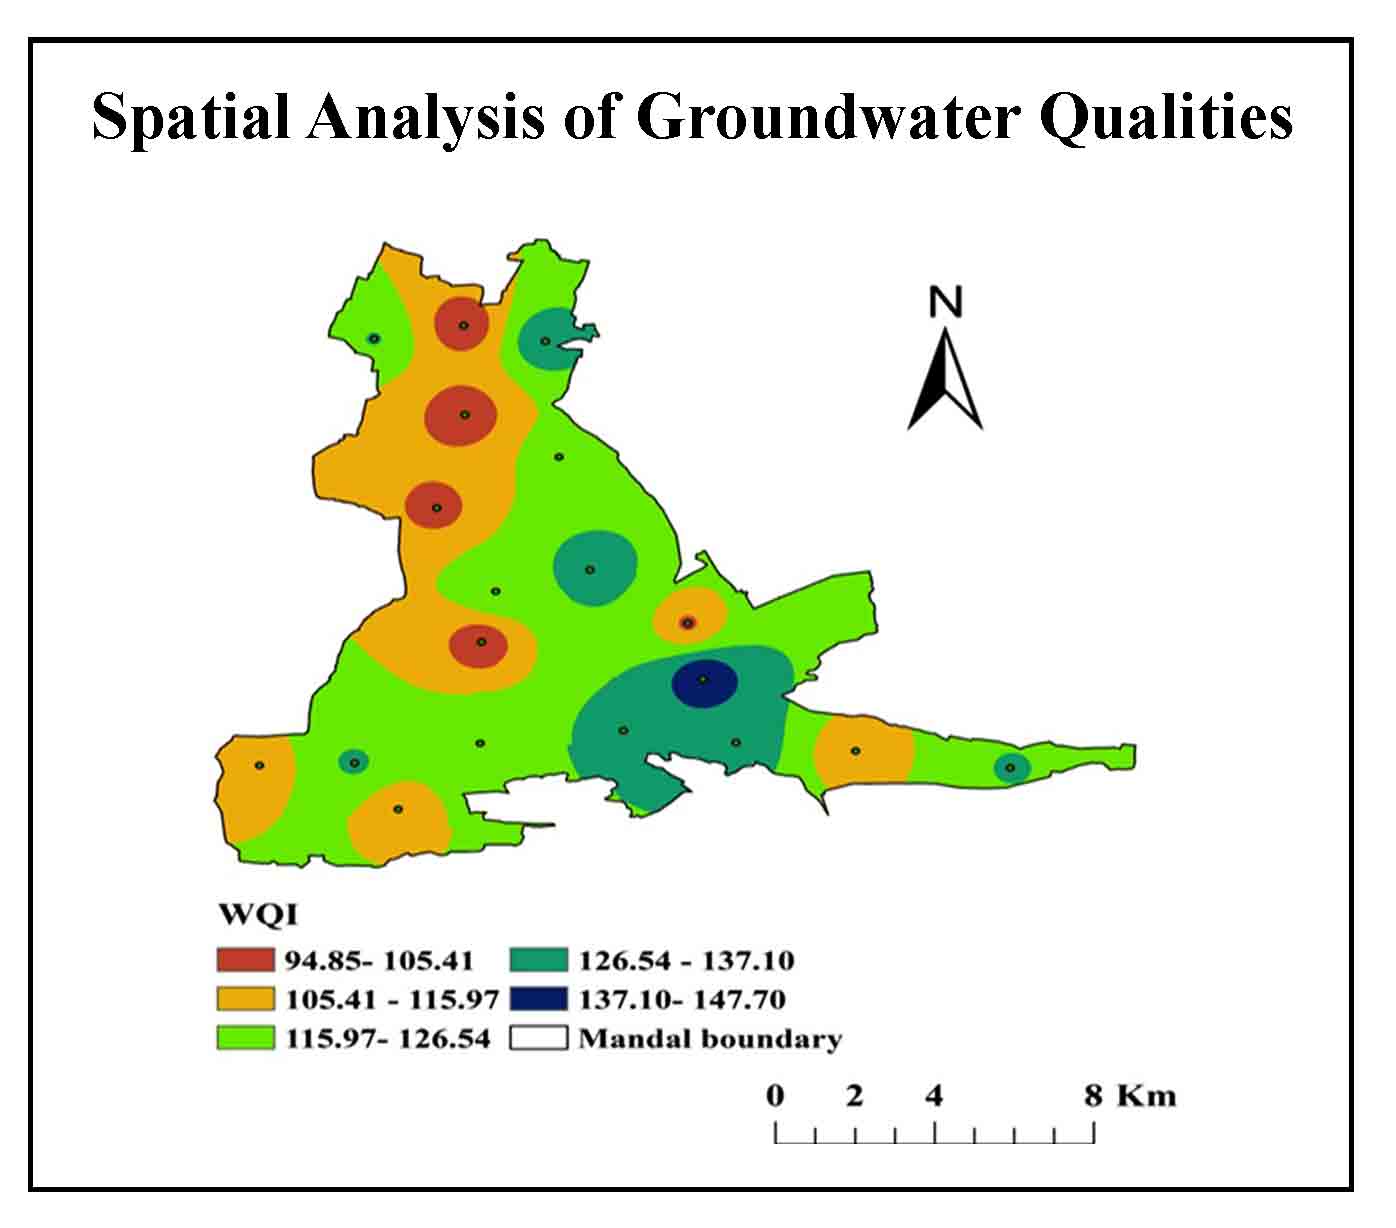
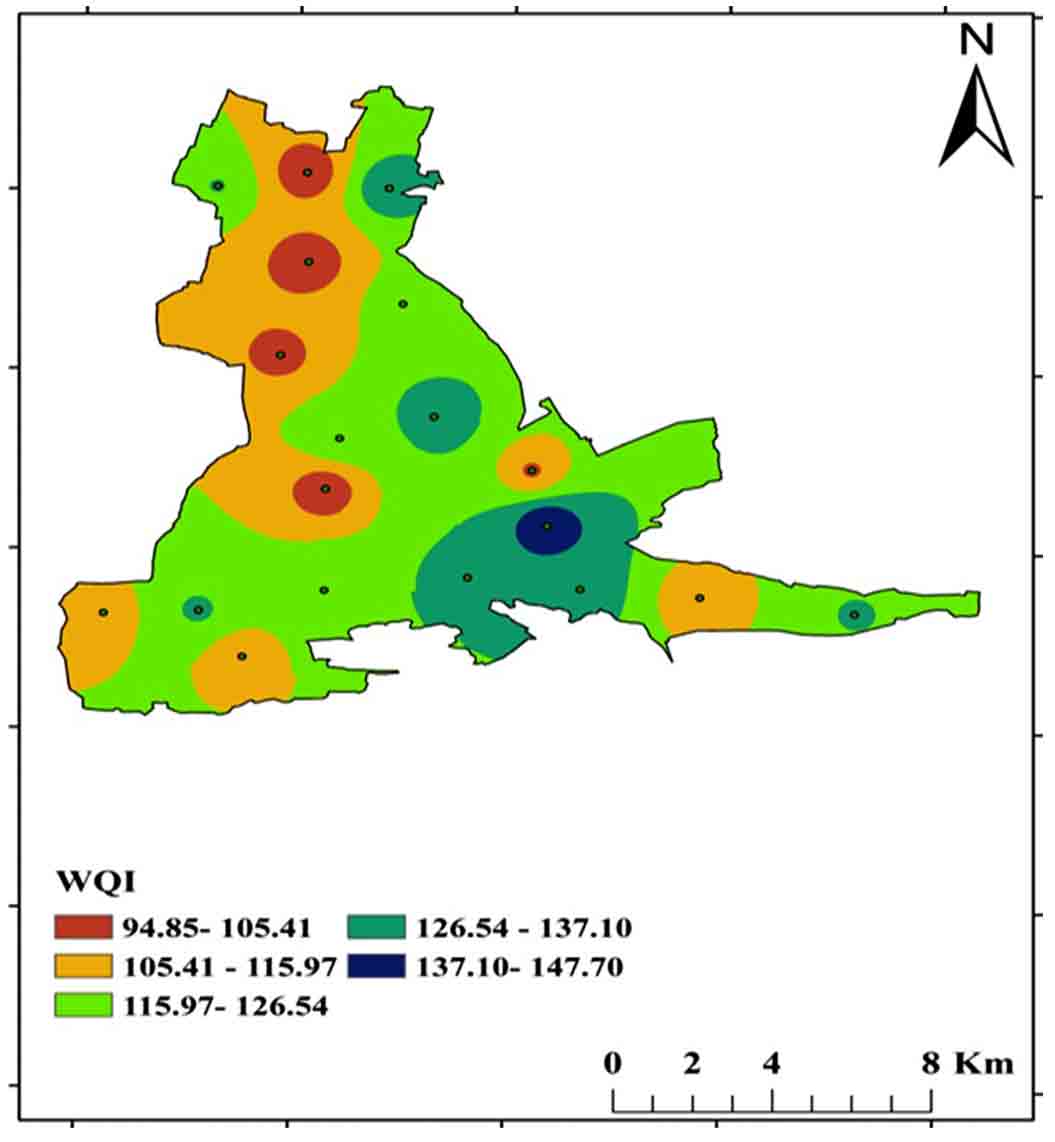
4.8 Water Quality Index (WQI)
The value generated for the Weighted Arithmetic WQI technique can be used to calculate the water ecological popularity. Table 4 shows the water quality criteria for drinking purposes and the unit-weights allocated to each parameter used in calculating the WQI. Brown (1972) categorizes the WQI into five classes (Table 5). Four samples from villages namely Cherlopalli, T. Velamavaripalli, Kuppapalapalli, Tallapalli, and Eguvathuvvapalli classified into poor category and others falling into the unsuitable category (Table 6, Figure 18).
Table 4. Relative weights (Wn) used to calculate the WQI
|
Parameters
|
BIS standard (Vs)
|
Ranges
|
Unit weight (Wn)
|
|
pH
|
8.5
|
7.0-8.8
|
0.60
|
|
EC
|
300
|
634-1590
|
0.02
|
|
TDS
|
500
|
390-954
|
0.010
|
|
TH
|
300
|
25-658
|
0.02
|
|
Ca2+
|
75
|
32-190
|
0.10
|
|
Mg2+
|
30
|
30-120
|
0.20
|
|
TA
|
200
|
58- 102
|
0.03
|
|
Cl-
|
250
|
78-647
|
0.02
|
|
Σ Wn
|
|
|
1
|
Table 5. Classification of the Water Quality Index (Brown 1972)
|
Water Quality Class
|
Range
|
Grade
|
Possible Usage
|
No. of Samples
|
|
Excellent
|
0-25
|
A
|
Drinking, irrigation and industrial
|
-
|
|
Good
|
26-50
|
B
|
Drinking, irrigation and industrial
|
-
|
|
Poor
|
51-75
|
C
|
Irrigation and industrial
|
-
|
|
Very Poor
|
76-100
|
D
|
Irrigation
|
5
|
|
Unsuitable
|
>100
|
E
|
Proper treatment required before use
|
17
|
Table 6. WQI categories
|
Sample Id
|
Longitude
|
Latitude
|
WQI Values
|
WQI Category
|
|
V1
|
78.355721°
|
14.331964°
|
111.6
|
Unsuitable
|
|
V2
|
78.377839°
|
14.332943°
|
128.5
|
Unsuitable
|
|
V3
|
78.388129°
|
14.320102°
|
98.6
|
Very Poor
|
|
V4
|
78.407050°
|
14.338755°
|
126.2
|
Unsuitable
|
|
V5
|
78.440434°
|
14.342626°
|
131.4
|
Unsuitable
|
|
V6
|
78.466688°
|
14.339588°
|
132.5
|
Unsuitable
|
|
V7
|
78.494623°
|
14.337503°
|
107.3
|
Unsuitable
|
|
V8
|
78.530698°
|
14.333185°
|
126.8
|
Unsuitable
|
|
V9
|
78.458748°
|
14.357179°
|
147.7
|
Unsuitable
|
|
V10
|
78.455109°
|
14.372630°
|
104.1
|
Unsuitable
|
|
V11
|
78.407051°
|
14.366983°
|
94.8
|
Very Poor
|
|
V12
|
78.432104°
|
14.387316°
|
153.6
|
Unsuitable
|
|
V13
|
78.396207°
|
14.404166°
|
101.4
|
Unsuitable
|
|
V14
|
78.424502°
|
14.418699°
|
121.1
|
Unsuitable
|
|
V15
|
78.402485°
|
14.430193°
|
98.01
|
Very Poor
|
|
V16
|
78.420971°
|
14.450894°
|
135.8
|
Unsuitable
|
|
V17
|
78.381039°
|
14.451130°
|
126.9
|
Unsuitable
|
|
V18
|
78.401835°
|
14.455093°
|
98.3
|
Very Poor
|
|
V19
|
78.410204°
|
14.381103°
|
96.5
|
Very Poor
|
|
V20
|
78.371232°
|
14.390213°
|
146.9
|
Unsuitable
|
|
V21
|
78.501485°
|
14.420752°
|
109.7
|
Unsuitable
|
|
V22
|
78.512934°
|
14.440371°
|
126.1
|
Unsuitable
|
5 . CONCLUSION
The BIS (2012) establishes the study for the evaluation of groundwater samples for drinking and irrigation purposes. The collected samples analyzed to determine ex-site and in-site characteristics such as alkalinity (carbonates and bicarbonates), chlorides, magnesium, calcium, electrical conductivity, pH, total dissolved solids, and total hardness. The weighted arithmetic technique used to calculate the Water Quality Index. The parameters and WQI values plotted to show spatial distribution using the IDW tool of Arc-GIS software.
The EC of groundwater is good in 18% of the samples and permissible in 82% of the samples. Most of the samples are permissible resulting in high EC values. Absolute TDS, hardness, calcium, magnesium bicarbonates, and carbonates classified into permissible limits. WQI estimated for 22.8% samples classified as very poor and 77.2% are unsuitable. Water collected from these samples contaminated due to mining in the region. Very poor quality groundwater is useful only for irrigation purposes.


 ,
Srinivasa Gowd Somagouni 1
,
Srinivasa Gowd Somagouni 1