3 . METHODOLOGY
Multi-criteria AHP [Analytic Hierarchy Process] technique was used for impact assessment of tourism activities on socioeconomic development in coastal zone of Ratnagiri district based on socio-eco-cultural criteria including accessibility and connectivity, amenities, health care facilities, business, employability, standard of living, agriculture and fisheries, immovable properties and cultural values. The impact analysis was performed through eight steps (Figure 3): 1) selection of criteria, 2) collection of data, 3) ranking, 4) pairwise comparison matrix, 5) calculation of weights, 6) determination of score, 7) weighted analysis, and 8) validation. Impact of tourism activities on socioeconomic development of the region was analyzed in respondents’ point of view’ and respondents are native people in the study area.
3.1 Data
The topographic maps (1:50000) were procured from Survey of India (SIO) (Hegde and Reju, 2007) to locate tourists places in the study area. The field survey was conducted using structured questionnaires and interviews for impact assessment of tourism on development in the coastal zone of Ratnagiri district. The potential tourist places including beaches, headlands, cliffs, creeks, rivers, waterfalls, jetties, historical fort, memorials, temples, festivals, tourist villages, fish markets, clubs, lighthouses, research institutions, etc. observed in the region. The majority of tourists are visiting the pleases located on shorelines due to attraction of landscape features including caves, platforms, cliffs, colorful sands, sunset and sunrise, coastal vegetation including mangroves, coconut, mangoes, etc. (Table 1). About 32 beaches observed on the shoreline of Ratnagiri district and these are major attraction points of the tourists in the area. Therefore, the primary survey was conducted at nine out of 32 beaches viz. Harne, Guhagar, Budal, Velneshwar, Hedavi, Malgund, Bhatye, Ganpatipule and Madban to understand the variations in socioeconomic aspects for impact analysis of coastal tourism on economic development in the region.
Table 1. Tourist sites: Coastal zone of Ratnagiri district
|
Types
|
Tourism sites
|
|
Beaches
|
Dandewadi beach, Madban beach, Ambolgad beach, Godvane beach, Purnagad beach,Ganeshgule beach, Bhatye Beach, Mandavi Beach, Mirya beach, Kalbadevi beach,Ware beach, Bhandarpur beach, Ganapatipule beach, Malgud beach, Reel beach, Tavasal beach, Rohile beach, Hedavi beach, Velneshwar beach, Karul beach, Borya beach, Palshet beach, Guhagar beach, Kolthare beach, Ladghar beach, Karde beach, Murud beach, Palande beach, Harnai beach, Anjarle beach, Kelshi beach and Budal beach.
|
|
Cliffs
|
Kolthare, Velneshwar and Jagarh
|
|
Headlands
|
Anjarle, Budal, Kolthare, Velneshwar, Jagarh, Guhagar, Mirya, Kalbadevi and Borya
|
|
Creeks
|
Kalbadevi creek, Bhatye creek, Purangad creek and Rajapur creek
|
|
Waterfalls
|
Ranpat waterfall and Ukshi waterfall
|
|
Rivers
|
Jagbudi, Vashishti, Kodavali, Shastri and Bav
|
|
Temples
|
Ganpatipule temple, Dashbhuj Ganpati, Bhagavati Mandir, Chandika devi Mandir, Datta temple chinchakhari, Dhutpapeshwar Mandir, Durgadevi Mandir (Murud), Ganeshgule Mandir, Ganpati Mandir, Jai Vinayak Temple, Kadyawaril Ganpati, Kelshi Ganpati(Pandhara), Kelshi Village, Keshavraj Mandir, Shir Kanakaditya Mandir, Shri Lakshmi Keshav Devasthan, Karle, Tamastirth, Urfata Ganpati, Velneshwar Mandir and Vyadeshwar Mandir
|
|
Masjids
|
Baba Yakut Darga, Jama Masjid and Shahi Masjid
|
|
Villages
|
Anjarle, Asud Pool and Murud (Maharshi Karve)
|
|
Jettys
|
Dabhol Dhopve Jetty and Musakaji Jetty
|
|
Markets
|
Harnai Fish Market , Mirkarwada Jetty and Fish Market
|
|
Lighthouses
|
Jaigad Light House
|
|
Clubs
|
Royal Goldfield Sport Club
|
|
Forts
|
Ambolgad fort, Bankot Fort, Bhagavati Fort, Gopalgad Fort, Purnagad Fort, Ratnadurga Fort, Jaigad Fort and Suvarndurga Fort
|
|
Memorials
|
Lokmany Smark, Kesvshut Smark, Panhalekaji Caves, Savrkar Statue, Thiba Palace, Tilak Smarak , Velas Village(Nana Fandavnis), Kavi Keshavsoot Smark and Gateway of Ratnagiri
|
|
Research centers
|
Agom Aushadhalaya, Coconut reseach center, Konkan Krishi Vidyapeeth
Marine Aquarium and Museum
|
|
Festivals
|
Ganpati festivals, holi festivals, Turtle festivals, Katal Shilpa festivals, Anjarle festivals and Alphonos mangoes festivals, etc.
|
The questionnaires were prepared based on literature reviews for collection of data in four level of impact: high, moderate, less and very less impact. Nine criteria were selected viz. accessibility and connectivity, amenities, health care facilities, local business, employability, standard of living, cultural values, agriculture and fisheries, immovable properties for impact assessment of coastal tourism (Figure 2). The native people are well aware and beneficiaries of economic development and socio-cultural changes in the area therefore, they considered as potential informer of about development in the region. The opinions of 156 respondents were recorded using the questionnaires into four levels viz. high, moderate, less and very less impact.
3.2 Multi-Criteria Analysis (MCA)
The multi-criteria decision-making technique (MCDM), AHP and experts’ opinions were used for impact assessment of tourism on socioeconomic development in the region (Ebrahimi et al., 2019; Navale and Bhagat, 2021). Multi-criteria decision-making technique (MCDM) is useful apparatus to find the levels of impact on economic development, planning and management of tourism (Bunruamkaewa and Murayama, 2011). This is a simple but confident learning complex phenomenon to develop the design of methods includes the stages of aptitude, strategy and choice. Its processes are too unbiased way to attain the specific objectives of the study (Raha et al., 2021; Navale and Bhagat, 2021) and have the ability to analyze difficult problems to produce different results and find the alternatives (Cengiz and Akbulak, 2009). AHP based MCDM technique needs a preparation of essential procedures e.g. ranking, pairwise comparison analysis, calculation of weights, determination of score and validation of results. This technique is calculating the comparison of decision indicators and criteria (Mansour et al., 2020). It is useful for detection and delineation of tourism potential (Navale and Bhagat, 2021), land suitability analysis for agriculture (Zolekar and Bhagat, 2015; Zolekar and Bhagat, 2018), land use planning and coastal management (Pourebrahim et al., 2014). This procedure is specifically valid to define the weights of selected criteria convenient to detect potential sites of tourism. This technique is useful for analysis of composite indicators and determines the weights of selected criteria (Sahani, 2019; Carrillo and Jorge, 2017). Therefore, MCDM technique was used for impact assessment of tourism activities in the coastal zone of Ratnagiri district.
The scholars like Blancas et al. (2011), Aminu et al. (2014), Semeoshenkova et al. (2016), Wang et al. (2016), Lee and Hsieh (2016), Yu et al. (2018), Boskovic (2019), Choi and Sirakaya (2006) have used different indicators i.e. landscape, ecology, environment, economic, socio-culture aspects, etc. for analysis of socioeconomic development at local to regional levels. Lee and Hsieh (2016) and Boskovic et al. (2019) used such indicators as a tool for planning and management of traditional tourism and to inculcate the awareness about environmental issues for sustainable tourism development. Indicator based analysis helps to motivate universal vision for balanced financial progress with environmental conservation and sociocultural peace (Wang et al., 2016). Further, the tourism indicators are useful for monitoring the different aspects of development including commercial, community, traditional, ecological, radical and scientific aspects in difficult regions (Choi and Sirakaya, 2006). Indicators are useful for monitoring and measuring the tourism development in tourist places such as socioeconomic change in tourism sectors, amenities and facilities services, cultural values impact on visitors and tourists, environment changes impact on the tourism development (Boskovic, 2019) (Table 2).
Table 2. Indicators of tourism impacts on development
Landscape diversities are significantly relating with development of nature based tourism (Wang et al., 2016). The natural landscapes include biodiversity, wildlife, ecosystems, beautiful scenery at valleys, mountains and beaches (Irandu, 2004). Reported landscape indictors are: 1) highland view-shed areas, 2) quality of river water, 3) slope less than 25%, and 4) large open space (Aminu et al., 2014). Some of the studies have used these landscape indicators as criteria for planning and management of sustainable tourism (Aminu et al., 2014).
The environmental aspects are impacting the development (Karlekar et al., 2017; Wang et al., 2016) and environmental planning (Ghamgosar et al., 2016) in coastal area. The environment awareness is supportive to inculcate the attraction in visitors of about the nature (Franco et al., 2019; Chen and Bau, 2016). The tourist environmental aspects are classified into four categories: 1) coastal, 2) mountain, 3) urban and 4) rural (Delgado and Palomeque, 2014). The beach environment on coastal area is reported as highly suitable landscape for tourism activities (Semeoshenkova et al., 2016). Further, Semeoshenkova et al. (2016) have classified the coastal landscape considering beach qualities including sand types, stability, erosion, etc. and 2) states of habitat. Wang et al. (2016) have used environmental aspects as indicators for analysis of sustainable development of coastal tourism: 1) environmental monitoring system, 2) environmental maintenance, and 3) pollution treatment and prevention. Lee and Hsieh (2016) have analyzed the participative views of native people, biological diversity and tourism for measurement of the sustainability indicators for the analysis of development. These sustainability indicators are: 1) rate of ecosystem degradation, 2) loss of renewable resources, 3) rate of reuse, recycle, reduction of resources use, and 4) environmental impact of tourism activities. Therefore, management and planning of environmental aspects are important for protection of nature and scenic beauty of coastal area for development of tourism activities.
Wang et al. (2016) have analyzed tourism sustainability considering: 1) ecological planning, 2) ecological restoration system for balancing the environmental management, 3) financial development and 4) socio-cultural harmony. Aminu et al. (2014) have suggested that conservation of ecosystem is significant for development of tourism with specific zones like 1) the largest habitat patch, and 2) distant areas for rare flora and fauna.
Scholar like Blancas et al. (2011), Choi and Sirakaya (2006), Trukhachev (2015), Wang et al. (2016) have considered economic aspects for analysis of development achieved through tourism projects with socio-cultural harmony. These aspects are: 1) financial services, 2) employment opportunities in tourism, agricultural and local sectors, 3) economic subsidy, 4) developmental association operations for development of tourism activities, and 5) recreational industry planning. The planning and monitoring of these aspects are more significant for development of tourism activities including visits and stays of tourists in the session with accommodation capacities at tourism destination. These tourism facilities are helpful for growth of economic activities and national tourism market (Semeoshenkova et al., 2016). Some reported criteria of analysis are: 1) presence of all basic and important facilities, 2) presence of all basic well managed facilities, 3) presence of all basic facilities, but poorly managed facilities, and 4) absence of one or more basic facilities for tourism development. Yu et al. (2018) reported that tourism growth and development are supportive for economic sectors: 1) tax revenues, 2) investment, etc. Choi and Sirakaya, (2006) have reported contribution of tourism to economic development through increase in employment and income, prices of different products, import, contribution to local economy, GDP and economic stability. However, tourism activities also have negative impact on the goods and services, price of land and houses, increased taxation and cost of living to local societies. Blancas et al., (2011) informed that tourism activities are affecting the local people and tourism destination as increase in value of real estate, service industry, unemployment, etc. Therefore, amenities and service are key factor for development of rural tourism (Park and Yoon, 2011)
Blancas et al. (2011) have reported social indicators of economic development through tourism local tradition and culture to the visitors as sense of security and these criteria like sports, health, transport, education facilities, financial services, life expectancy, income education, property value of real estate, price-quality relationship tourists and tourism, land use planning for tourism, access to network (airport, road, railway) and density, general demographic dependency index and tourist satisfaction level to determine the peace condition of local society.
Yu et al. (2018) stated that local community is supportive for the development of rural tourism activities as: 1) additional recreation opportunities, 2) improving quality of services, 3) better police and fire fighting protection and 4) cultural, historical and entertainment activities. However, negative factors are affecting the local community and tourist places. These negative factors are: 1) disrupting quality of life, 2) overcrowded, 3) overused recreational resources, 4) tourism growing too fast, and 5) crime and vandalism. Therefore, the peaceful with selection of secured tourist destination for development of tourism destinations such as social appreciates a great significance to development of local tourism.
Scholar likes Wang et al. (2016); Yu et al. (2018), Fadafan et al. (2018), etc. have reported that preservation of local culture is supportive for varied recreational activities and encourage tourism development. These aspects are: 1) protection of local culture, 2) cultural identity, 3) cultural entertainment activities, and 4) historical and cultural sites. It is helpful to preserve the tradition value for satisfy of visitors to encourage tourist flow at the tourist destination. Therefore, natural scenic beauty of beach as well comfort environment, ecology system and biodiversity are helpful to tourism activities but without presence of sociocultural harmony, tourism development is not possible. Thus, the many scholars have used multi-criteria impact analysis of tourism activities on socioeconomic development at local to regional levels.
3.3 Criteria
Nine criteria were selected viz. accessibility and connectivity, amenities, health care, facilities, business, employability, standard of living, cultural values, agriculture and fisheries, immovable properties for impact assessment of coastal tourism in the study area using AHP based weighted analysis technique. The distribution of respondents (%) shown according to the selected tourists’ sites to show the spatial variations in impact of tourism on socioeconomic development in the region in view of native people.
3.3.1 Accessibility and Connectivity
The transportation is one of significant sector in the economy of any nation. The road connectivity is a significant criterion in measuring ecotourism and convenience to visitor geo-sites and geo-morpho-sites (Anna and Zdzislawa, 2017; Mansour et al., 2020). The accessibility and connectivity including road, railway and airport as well as sea face road are more significant for the development beach tourism (Murali et al., 2013; Navale et al., 2021). The study assesses the accessibility of the tourist places and the existence of visitor infrastructure i.e. lodging, cafes, shops, local food, etc. It is the attraction of tourist and local involvement in the tourist sectors is the ideal principles for tourism development (Kubalikova and Kirchner, 2015). The concentration of roads, distance from tourist site, shops, art centers, recreation facilities, guesthouses, lodgings available in coastal zone show impact on tourism and tourists’ activities (Liaghat et al., 2013; Nahuelhual et al., 2013) and opportunities of localized tourism (Singh et al., 2021). The impact on accessibility and connectivity was assessed using opinions recorded from native people of tourist places in the coastal area and classified into four categories: High, moderate, less and very less impact. About 35.9 % respondent showed the high, 28.8% respondent showed moderate, 28.2% respondents showed less and 7.1% respondents showed very less impact of tourism activities on accessibility and connectivity in the area.
Higher impact of tourism activities on accessibility and connectivity was reported at Ganpatipule (68.8%), Malgund (61.5%) and Bhatye (59.3%) beaches. All these beaches are located near the district headquarter and connected through national (NH-204), state (SH-106, 110 and 167) and district roads to other towns, cities and tourist places. It is notable that railway facilities are available for these beaches. Moderate impact was estimated for Guhagar (53.8%), Velneshwar (44.4%), Harne (40.9%) and Hedavi (40%) beaches with good connectivity of state highways (SH-04, 96,102, 103, 110,112,167) and district roads whereas less impact was reported far Madban beach (75%) located at far South area with undulating topography. Similarly, Budal (75%) beach also show less impact on connectivity due to rugged topography. However, these beaches have comparatively more scenic beauty and tourism potentials for exploration (Figure 4 and Table 3).
Table 3. Accessibility and connectivity
|
Beaches
|
Levels of impact (%)
|
|
High
|
Moderate
|
Less
|
Very less
|
|
Harne
|
22.7
|
40.9
|
31.8
|
4.5
|
|
Guhagar
|
46.2
|
53.8
|
0.0
|
0.0
|
|
Budal
|
0.0
|
6.3
|
75.0
|
18.8
|
|
Velneshwar
|
33.3
|
44.4
|
11.1
|
11.1
|
|
Hedavi
|
26.7
|
40.0
|
33.3
|
0.0
|
|
Malgund
|
61.5
|
23.1
|
15.4
|
0.0
|
|
Bhatye
|
59.3
|
29.6
|
7.4
|
3.7
|
|
Ganpatipule
|
68.8
|
12.5
|
12.5
|
6.3
|
|
Madban
|
0.0
|
6.3
|
75.0
|
18.8
|
|
Total
|
35.9
|
28.8
|
28.2
|
7.1
|
3.3.2 Amenities
The amenities show a vital role in growth of local tourism in the region (Deller et al., 2001). Amenities are supportive to build attractions in tourist’s mind about different destinations. These amenities are hotels, holiday resorts, lodging and boarding, shops, cafes, snack bars, public washings, public telephone, tour guides, art galleries, different services including parking, public transportation, electricity, water supply, banking, currency exchange, medical stores, clinics, gardens, exhibitions, airports, etc. (Lam and Xiao, 2000; Manaf et al., 2015; Riwayatiningsih and Purnaweni, 2018; Ruano, 2018; Navale and Bhagat, 2021). These amenities are supportive for growth in number of visitors, the tourism activities and job opportunities (Nooripoor et al., 2020). The quality of available services and facilities at the tourist destinations are significant to grow attraction of tourists. Therefore, amenities are most important for the tourism development. About 42.95% respondents showed the high, 26.92% respondents showed moderate, 19.87% respondents showed less and 10.26% respondents showed very less impact of tourism activities on development of amenities in the study area.
The higher impact of tourism activities on amenities, service and facilities was reported at Ganpatipule (75%), Guhagar (61.54%), and Velneshwar (61.11%) Harne (54.55%) and Bhatye (40.74%) beaches. These beaches are connected to administrative and urban center with more facilities and services including roads, railways, hotels, restaurants, drinking water, public security and safety. Moderate impact observed for Hedavi (60 %) with good amenities and service. However, Budal (68.75 %) and Madban (43.75%) beaches are away from administrative places and poor amenities and services. Similarly, Malgund (38.46%) also show less impact of tourism on services and facilities. The local government provided the infrastructure, recreation facilities and entertainment opportunities to native people (Figure 5 and Table 4).
Table 4. Levels of impact: Amenities
|
Beaches
|
Levels of impact (%)
|
|
High
|
Moderate
|
Less
|
Very less
|
|
Harne
|
54.55
|
31.82
|
9.09
|
4.55
|
|
Guhagar
|
61.54
|
7.69
|
30.77
|
0.00
|
|
Budal
|
0.00
|
31.25
|
68.75
|
0.00
|
|
Velneshwar
|
61.11
|
27.78
|
11.11
|
0.00
|
|
Hedavi
|
33.33
|
60.00
|
6.67
|
0.00
|
|
Malgund
|
30.77
|
30.77
|
38.46
|
0.00
|
|
Bhatye
|
40.74
|
18.52
|
11.11
|
29.63
|
|
Ganpatipule
|
75.00
|
25.00
|
0.00
|
0.00
|
|
Madban
|
25.00
|
12.50
|
18.75
|
43.75
|
|
Total
|
42.95
|
26.92
|
19.87
|
10.26
|
3.3.3 Health Care Facilities
The health care facilities including safety movements, pure water, clean beaches, safe access to beaches, bathing, customs offices, financial service, tourist information resources, beauty salon, fire stations, public security facilities, medical services, etc. for tourism development in the region (Blancas et al., 2016; Meyer and Meyer, 2015; Chen and Bau, 2016; Semeoshenkova et al., 2016). Chen and Bau (2016) have used these parameters to decide the tourism standards and analysis of development (Chen, 2010). Tourism activities are affecting sociocultural and natural environment positively as well as negatively (Terzidou et al., 2008).
Environment provides a variety of services including social welfare, health and livings (Sun et al., 2019). Therefore, some of the scholars have recommended the ecotourism for health care and treatments to recover from some of the diseases (Hughes and Scheyvens, 2018; Sharbatian and Khazaee, 2012). Ecotourism places become major attraction points especially for urban visitors. Health resorts are main attractions of tourists for different health caring treatments. It is famous as health tourism through health resorts and hospitals (Hacia, 2018). However, many coastal tourism destination show scarcity of important health care facilities including public sanitation, sewage, drinking water, clean environment, lodging and boarding, clinics, etc. It shows impact on a natural environment and health caring of native people and visitors (Sousa et al., 2014). In this study, the impact of tourism on health care facilities was assessed using responses of native people from selected tourists’ places. These responses are classified into four categories: High (35.90 %), moderate (28.21%), less (27.56%) and very less (8.33%).
Higher impact of tourism activities on health care facilities was reported at Ganpatipule (56.25%), Guhagar (53.85%), Bhatye (51.85%), and Velneshwar (50%) beaches. The economic growth at these beaches is significantly helpful for providing the medical services including health care facilities at primary health center, healthcare institutions, hospitals, private clinics. Moderate impact on health care services was observed at Harne (45.45 %), Hedavi (40 %) and Malgund (38.46 %) beaches. The beaches like Budal (87.50 %) and Madban (43.75%) show less impact of tourism on health care facilities. However, all these beaches show healthy environment including good vegetation cover, pure drinking water, clean air and sky, nearness of ocean, etc. Therefore, the natural environment is favorable for medical tourism, outdoor visits, mounting, riding, adventures, sport activities, educational tours, etc. (Gyinaye et al., 2017) (Figure 6 and Table 5).
Table 5. Levels of impact: Health care facilities
|
Beaches
|
Levels of impact (%)
|
|
High
|
Moderate
|
Less
|
Very less
|
|
Harne
|
31.82
|
45.45
|
9.09
|
13.64
|
|
Guhagar
|
53.85
|
23.08
|
23.08
|
0.00
|
|
Budal
|
0.00
|
12.50
|
87.50
|
0.00
|
|
Velneshwar
|
50.00
|
11.11
|
38.89
|
0.00
|
|
Hedavi
|
33.33
|
40.00
|
26.67
|
0.00
|
|
Malgund
|
23.08
|
38.46
|
30.77
|
7.69
|
|
Bhatye
|
51.85
|
29.63
|
11.11
|
7.41
|
|
Ganpatipule
|
56.25
|
31.25
|
12.50
|
0.00
|
|
Madban
|
12.50
|
18.75
|
25.00
|
43.75
|
|
Total
|
35.90
|
28.21
|
27.56
|
8.33
|
3.3.4 Local Business
Tourism is a significant device for financial development in developing and under developed countries (Gupta and Dutta, 2017), which creates employment and income for local people (Ejiofor et al., 2012) with affordable innovative commercial prospects. Tourism creates the amount of revenue from local business with individual earnings of native people. The tourism businesses are supportive for the investment and development (Khoshkam et al., 2016) in local business such as farm-stays, tour guides, stores, local transportations, hotels, etc. (Petrovic, 2018). Further, claim over composite visitor’s comings is allied by commercial development in dual customs. Foremost, visitors spend currency on accommodation, lunchtimes, attractions, supermarkets, etc. Additional, tourist comings from side to side claim offshoot indirect special effects on the GDP, which is including the high expert operations, information, and innovative concepts in tourism sector (Croes et al., 2021). About 33.33% respondents showed the high, 38.46% respondents showed moderate, 22.44% respondents showed less and 5.77% respondents showed very less impact of tourism activities on local business.
The higher impact of tourism activities on local business was reported at Guhagar (61.54 %), Ganpatipule (60 %) Velneshwar (44.44%) and Harne (45 %) beaches. These beaches are located near to the city through good road and railway network which promoting the local business like farm-based business, traditional business stores, small restaurants, small markets, apartments, hostels, camping facilities, etc. The small-scale business are supportive for tourism development with employability and income for native people. The traditional and cultural invents and some festivals are helping to develop the small-scale and seasonal business like small hotels, restaurants, home stay, entrainment business including dances, traditional drama, theatres, etc. Hedavi (86.67%), Budal (75%), Bhatye (55.56%) Madban, (57.14%) and Malgund (30.77%) beaches show less growth of local business due to poor connectivity (Figure 7 and Table 6).
Table 6. Levels of impact: Local business
3.3.5 Employability
Tourism reflects as an identical key device and source of employment to native people (Green, 2001). Tourism activities are supportive to growth the settlements, business, hotel, restaurant, lodging, entertainment, cafe, shops, art gallery and revenue to government authorities (Kantawateera et al., 2017; Susano et al., 2019; Chaudhary et al., 2021; Figueroa and Rotarou, 2016; Nunkooa and Ramkissoon, 2010). The native people are able to provide traditional facilities to visitors which provides employment opportunities with affordable earning (Rio and Nunes, 2012; Ferreira, 2007). About 29.49% respondents from the study area showed the high, 31.41% respondents showed moderate, 24.36% respondents showed less and 14.74% respondents showed very less impact of tourism activities on employability.
The higher impact of tourism activities on employability was reported at Ganpatipule (56.25%), Malgund (38.46 %) and Guhagar (38.46 %) beaches. Small-scale businesses like hotels, restaurants, lodging, cafés, tourist centers, medical stores and clinics are growing in these area and employability increasing for local people. Hedavi (60%) and Madban beaches (50%), Velneshwar (50 %), Bhatye (40 %) and Budal (37%) beaches show less ability to generate employment. Similarly, Harne (36.36 %) beach also shows less socioeconomic development and employability. However, these beaches have comparatively more scenic beauty and tourism potentials and employment to local people through socioeconomic development (Figure 8 and Table 7).
Table 7. Levels of impact: Employability
|
Beaches
|
Levels of impact (%)
|
|
High
|
Moderate
|
Less
|
Very less
|
|
Harne
|
31.82
|
13.64
|
36.36
|
18.18
|
|
Guhagar
|
38.46
|
30.77
|
30.77
|
0.00
|
|
Budal
|
0.00
|
37.50
|
25.00
|
37.50
|
|
Velneshwar
|
38.89
|
50.00
|
0.00
|
11.11
|
|
Hedavi
|
13.33
|
26.67
|
60.00
|
0.00
|
|
Malgund
|
38.46
|
30.77
|
23.08
|
7.69
|
|
Bhatye
|
25.93
|
40.74
|
25.93
|
7.41
|
|
Ganpatipule
|
56.25
|
37.50
|
6.25
|
0.00
|
|
Madban
|
25.00
|
12.50
|
12.50
|
50.00
|
|
Total
|
29.49
|
31.41
|
24.36
|
14.74
|
3.3.6 Standard of Living
Tourism increases revenue, diversity in business, sales and goods, public infrastructures and standard of living (Hanafiah et al., 2013; Jafar et al., 2015; Mirzaei, 2020). Tourism as dynamic economic sector is useful to change capability of local people to increase the socioeconomic conditions (Ghoochani et al., 2019). The situation stands assumed that contributing factor of tourism movements to tourist places their amenities and facilities are adequate with higher standard of living. The income is influencing more to change these tourist places with inadequate amenities and facilities (Khadaroo and Seetanah, 2008). The tourism industry is an international marketplace for both developed and underdeveloped countries. It is supporting to national economy and ultimately to increase the income and standard of living of native people (Hong, 2009). In addition to that, tourism industry helps to the development of new setup, accessibility and more connectivity to the tourist destinations. The tourism activities are upgrading the economic empowerment of local societies (Gnanapala and Sandaruwani, 2016). Therefore, the opinions of local people were recorded to understand the contribution of tourism for changing the standard of living in the region and the responses were classified into four comparative categories: High (33.33%), moderate (37.78%), less (18.59%) and very less (10.90 %) impact (Figure 9 and Table 8).
The higher impact of tourism activities on standard of living of local communities was reported for Ganpatipule (68.75%), Guhagar (53.85%), Velneshwar (44.44 %) and Malgund (38.46%) beach areas. Ganpatipule and Guhagar beaches show improved infrastructure including roads, electricity and schools, which is supportive for growth in small-scale business and property values, improving building qualities, expansion of local market and employability for native people. Hedavi (86.67%), Budal (62.50%) Bhatye (51.85 %), Madban beach (50%) and Harne (45.45 %) beaches show moderate impact on transportation and recreational facilities (Figure 9 and Table 8).
Table 8. Levels of impact: Standard of living
|
Beaches
|
Levels of impact (%)
|
|
High
|
Moderate
|
Less
|
Very less
|
|
Harne
|
27.27
|
45.45
|
13.64
|
13.64
|
|
Guhagar
|
53.85
|
38.46
|
7.69
|
0.00
|
|
Budal
|
0.00
|
12.50
|
25.00
|
62.50
|
|
Velneshwar
|
44.44
|
16.67
|
27.78
|
11.11
|
|
Hedavi
|
6.67
|
86.67
|
6.67
|
0.00
|
|
Malgund
|
38.46
|
30.77
|
30.77
|
0.00
|
|
Bhatye
|
37.04
|
51.85
|
3.70
|
7.41
|
|
Ganpatipule
|
68.75
|
18.75
|
12.50
|
0.00
|
|
Madban
|
25.00
|
25.00
|
50.00
|
0.00
|
|
Total
|
33.33
|
37.18
|
18.59
|
10.90
|
3.3.7 Cultural Values
The historic and cultural traditions are interrelated parameters and play an important role in growth of tourism in the region (Ismagilova et al., 2015). Cultural tourism is significant for the development of innovative growth of market with imageries in and within nations (Hughes and Allen, 2005). 1) Cultural festivals, 2) cultural materials like carpets, picnic basket, multifarious beads, 3) different arts: traditional dance, drama, songs, etc. 4) historical monument, and 5) cultural excursions, 6) carnivals and related events, 7) ancient vicinities and memorials, ancient ports are major cultural attraction of tourists in the region (Zadel and Bogdan, 2013; Cletus and Okpoko, 2015).
Heritage tourism introduces societies to their traditional backgrounds. Archeological explorations give information about ancient cultures and attract visitors (Mckercher et al., 2005). Cultural landscapes represent recollections of extensive affiliation of anthropological atmosphere (Mahmud and Muhammad, 2018). Tangible cultural assets are the physical record of social involvements (Li et al., 2021).
Therefore, cultural values of the region promote tourism activities and significant for job opportunities and financial support with social welfares to both visitors and native people (Oyola et al., 2012). The rural traditions are useful to inculcate unity in the society without the distinctive features of the rural community (Yun, 2014). Furthermore, tourism raises the national revenue, offers employability, foreign exchange and community integration in diversity (Selim et al., 2021). Therefore, responses from the local people recorded to understand the contribution of cultural values in economic development in the regin and classified into four categories: High (32.69%), moderate (32.05%), less (20.51%) and very less (14.74%). Higher impact of tourism activities reported at Ganpatipule (62.50%), Bhatye (44.44%),
Veleneshwar (44.44%) and Guhagar (38.46%) beaches are famous pilgrimage centers of Kokan region. The main attraction of tourists is to visit such cultural places and cultural festivals. Moderate impact was estimated for Malgund (53.85 %), Hedavi (46.67%) and Harne (40.91 %) beaches with moderate cultural and traditional attraction places in this region whereas less impact was reported for Madban (50%) and Budal (68.75%) beaches poor connectivity due to rugged topography (Figure 10 and Table 9).
Table 9. Levels of impact: Cultural value
3.3.8 Agriculture and Fisheries
The agriculture and fisheries are major activities along the coastal regions (Snoussi et al., 2007). Fisheries play a vital role in the commercial activities for more earnings of families (Wanyonyi et al., 2016). Maritime tourism is unique fastest growing tourism sector and consist of entertaining events. The marine fishing activities are supportive to the marine tourism and creating the employment opportunities in marine tourism sector (Chen, 2010). Agriculture is a dynamic and unique sector favorable for the agro-tourism like mango festivals (Skanavis and Sakellari, 2008). Similarly, fisheries in the region are the attraction of tourists like fish food. Therefore, responses about role of agriculture and fisheries have been recorded from native people and classified into four categories: High (45.51%), moderate (24.36%), less (22.44%) and very less (7.69%) (Figure 11 and Table 10).
The higher impact of tourism activities on agricultural and fisheries was reported for Harne (68.18%), Ganpatipule (62.50%), Bhatye (59.26%), Velneshwar (55.56%) and Guhagar (46.15%) beaches. These beaches areas show abundant laterite and red soils useful for coconut, mango, cashewnut and rice production. Area near to Harne beach is a famous for fishing and Alphanso mango. Moderate impact reported for Malgund (53.85 %) and Madban (50 %) beaches with less agriculture and fishing activates. Less impact reported for Budal beach (43.75 %) located in middle area. Hedavi (75%) beach shows less fishing activities due poor fishing infrastructures (Figure 11 and Table 10).
Table 10. Levels of impact: Agriculture and fisheries
|
Beaches
|
Levels of impact (%)
|
|
High
|
Moderate
|
Less
|
Very less
|
|
Harne
|
68.18
|
22.73
|
9.09
|
0.00
|
|
Guhagar
|
46.15
|
15.38
|
38.46
|
0.00
|
|
Budal
|
12.50
|
12.50
|
31.25
|
43.75
|
|
Velneshwar
|
55.56
|
27.78
|
16.67
|
0.00
|
|
Hedavi
|
26.67
|
20.00
|
40.00
|
13.33
|
|
Malgund
|
30.77
|
53.85
|
15.38
|
0.00
|
|
Bhatye
|
59.26
|
14.81
|
22.22
|
3.70
|
|
Ganpatipule
|
62.50
|
12.50
|
12.50
|
12.50
|
|
Madban
|
25.00
|
50.00
|
25.00
|
0.00
|
|
Total
|
45.51
|
24.36
|
22.44
|
7.69
|
3.3.9 Immovable Properties
The tourism activities are supportive for development of houses, community places, administrative building, amenities like hotels, restaurants, shops, cafes, parking, etc. Therefore, growth in such kind of immovable properties is major indicator of contribution in the socioeconomic development of the region (Mandic et al., 2018). The growth and development in these properties are helping to increase revenue to local self-government for administration and development of public infrastructure. Tourism activities in the coastal region are supporting to the development of these properties including commercial and domestic purposes from private and public sectors (Cervantes and Espejel, 2008). Therefore, tourism activities reflect the growth in commercial, domestic and public infrastructure with increased revenue and employments (Sullivan and Jackson, 2002). Tangible heritage, geo-heritage buildings and historical places, memorials and art galleries are major attractions and require protection and maintenance (Alfane, 2020). Therefore, level of protection and maintenance of these archeological and historical properties also indicator of development in the region. The researcher has recorded response from respondents about growth and development in immovable properties from the study area and classified into four categories: High (41.81%), moderate (25.30%), less (23.04%) and very less (9.85%) (Figure 12 and Table 11).
The higher impact of tourism activities on immovable properties reported at Ganpatipule (81.25%), Bhatye (77.78 %), Velneshwar (55.56%) and Guhagar (53.85%) beaches. These all beaches are located near the administrative place and connected with district roads to tourist places. The various amenities and facilities including rail network, road network, hotel, restaurant, lodging, medical store, café, entertainment center, hospital, seacoast recreational facilities, etc. are supportive for development of tourist activities along the coastal area of the study area. Therefore, higher growth in immovable properties observed in this region. Moderate impact was estimated for Malgund (46.15 %) and Harne (36.36 %) beaches with less amenities and facilities, and district roads whereas less impact was reported far Hedavi (33.33%), Madban beach (37.50 %) located at far South and low tourism development. Similarly, Budal (37.50%) beach is in hill zone with far away from cities. It is not favorable for growth in immovable properties because of tourists visiting very rarely to this place (Figure 12 and Table 11).
Table 11. Levels of impact: Immovable properties
|
Beaches
|
Levels of impact (%)
|
|
High
|
Moderate
|
Less
|
Very less
|
|
Harne
|
27.27
|
36.36
|
31.82
|
4.55
|
|
Guhagar
|
53.85
|
30.77
|
15.38
|
0.00
|
|
Budal
|
25.00
|
25.00
|
37.50
|
12.50
|
|
Velneshwar
|
55.56
|
16.67
|
11.11
|
16.67
|
|
Hedavi
|
20.00
|
26.67
|
33.33
|
20.00
|
|
Malgund
|
23.08
|
46.15
|
30.77
|
0.00
|
|
Bhatye
|
77.78
|
14.81
|
3.70
|
3.70
|
|
Ganpatipule
|
81.25
|
12.50
|
6.25
|
0.00
|
|
Madban
|
12.50
|
18.75
|
37.50
|
31.25
|
|
Total
|
41.81
|
25.30
|
23.04
|
9.85
|
3.2 Analytic Hierarchy Process (AHP)
In 1960, AHP techniques used for resolving composite difficulties of judgment making by Prof. Thomas L. Saaty. Zolekar and Bhagat (2015); Gaikwad and Bhagat (2017); Raha et al. (2021), Navale and Bhagat (2021) have used this technique for site suitability analysis for identification of suitable sites for agriculture, watershed management and tourism activities (Ambecha et al., 2020; Gyinaye et al., 2017). MCA and Geographical Information System (GIS) are significant apparatuses for suitability assessments to find suitable sites (Malczewski, 2006). Sahani (2019) suggested GIS and Multi-Criteria Decision Analysis (MCDA) techniques for the identification of the nature-built tourism prospective places based on socioeconomic and environmental indicators. Wind and Saaty (1980) reported that AHP structure is commonly scientific properties to define the weights criteria through pairwise judgment and sub-criterion score (Raha et al., 2021; Navale and Bhagat, 2021b). Some of the researchers like Zolekar and Bhagat (2015), Ghamgosar et al. (2016), Gaikwad and Bhagat (2017), Navale et al., (2021) and Navale and Bhagat (2021b) have used the AHP techniques for assessment of land and tourism sites. The scholars have used the AHP techniques to produce the statistics and addition of data for detection of suitable sites for tourism activities by using the overlaying the weighting value considered for criteria and sub-criteria (Asmamaw and Gidey, 2018; Ebrahimi et al., 2019). The AHP techniques mostly used to define dominance and weighting between data layers its result set to the site selection problem. AHP are determined the judgment-construction and assessment process to define judgment structure, with executive features and principles. AHP is a method that rationally conglomerates statistics, knowledge, specific judgments and anticipations (Gumusay et al., 2016). It is extra flexible method with composite correctness in site suitability to land (Zolekar and Bhagat, 2015). Wijnmalen and Wedley (2008) stated that criteria ranks selected to be reversed giving to additions and demarcation of criterion. However, definite opinions about ranks and weights assigned to selected criterion in the existing investigation illustrations prejudgment verdict fair by the respondent. Thus, AHP techniques have been used for robust judgment of rank and calculation of weights for criterion and assignment of the score for sub-criterion (Navale and Bhagat, 2021b). AHP technique used for impact assessment of coastal tourism can be defined into five phases i.e.1) ranking, 2) pairwise comparison matrix, 3) calculation of weights, 4) determination of score and 5) weighted analysis.
3.4.1 Ranking
The multi-criteria decision-making (MCDM) are used for analysis of selected criteria for understand the impact assessment of coastal tourism (Klein et al., 2004; Wanyonyi et al., 2016; Gaikwad and Bhagat, 2018; Raha et al., 2021; Navale and Bhagat, 2021b). Computable and qualitative techniques have been commonly used for determination of ranks to the selected criteria for weighted evaluates (Gaikwad and Bhagat, 2018). Priskin (2001) has used experts’ decision for assessment of scenic beauty and natural resources. Ghamgosar (2011) stated that experts’ opinion is essential for classification and standardization of the selected criteria. The experts’ opinion is complex in the MCDA method. Experts must have sufficient information of the tourism activities in the region besides of the prospective influences of environment change to sustainable tourism administration and policy (Michailidou et al., 2016). The suitable assessment to selected criteria in the study area are mostly rest on the decision assessments from authorities but definite cases, here is the assignment of statistics simplicity of practice almost the calculation criteria (Gyinaye et al., 2017). Mishra et al. (2015) and Moreno (2010) stated that AHP techniques mostly based on experts’ judgment but its sometime are individual. If such judgments are incorrect of selected criteria be able to simply taken to the weight assignment or deficiency of specificity. However, the particular experts’ opinion is an important stage mostly in the condition of statistics insufficiency, uncertainty and conflict (Murali et al., 2013).
The selected criteria ranked by the 44 experts working in government sector, industries and research in the field of geography, ecotourism and agro-tourism with help of questionnaires sent as online in Google form for impact assessment of coastal tourism on socioeconomic development in this region (Chen and Bau, 2016). The experts’ opinions were used for determination of ranks (1 to 9) of selected criteria. Accessibility and connectivity, amenities, health care facilities, business are impacting more on tourism activities and ranked 1-4, respectively. The criteria viz. employability (5), standard of living (6) and cultural values (7) show less impact on tourism activities in the region. Agriculture and fishery, an immovable properties show relatively less significance in the development and assigned 8 and 9 ranks (Table 12).
Table 12. Ranking
|
Criteria
|
Ranks
|
|
Accessibility / connectivity
|
1
|
|
Amenities
|
2
|
|
Health care facilities
|
3
|
|
Business
|
4
|
|
Employability
|
5
|
|
Standard of living
|
6
|
|
Cultural value
|
7
|
|
Agriculture and fisheries
|
8
|
|
Immovable properties
|
9
|
3.4.2 Pairwise Comparison Matrix (PCM)
In the projected technique, the weights of the selection criteria are determined by pairwise comparison matrices using AHP (Pourebrahima et al., 2011). The MCDM technique and Pairwise Comparison Matrix (PCM) are important for impact assessment of coastal tourism in the region. AHP technique was used for preparing the PCM for calculation of specific comparative significance of the selected criteria in suitable sites (Mishra et al., 2015). The normalized weights for selected criteria were intended affording the implication of criteria in tourism (Brilha, 2016) for calculation of impact for tourism on socioeconomic development in the region (Saaty, 1987; Burak et al., 2004) based on ranks assigned (1-9) to the selected criteria (Table 13).
Table 13. Pairwise comparison matrix
|
Criteria
|
Accessibility/ connectivity
|
Amenities
|
Health care facilities
|
Business
|
Employability
|
Standard of living
|
Cultural value
|
Agriculture and fisheries
|
Immovable properties
|
|
Accessibility / Connectivity
|
1/1
|
2/1
|
3/1
|
4/1
|
5/1
|
6/1
|
7/1
|
8/1
|
9/1
|
|
Amenities
|
1/2
|
2/2
|
3/2
|
4/2
|
5/2
|
6/2
|
7/2
|
8/2
|
9/2
|
|
Health care facilities
|
1/3
|
2/3
|
3/3
|
4/3
|
5/3
|
6/3
|
7/3
|
8/3
|
9/3
|
|
Business
|
1/4
|
2/4
|
3/4
|
4/4
|
5/4
|
6/4
|
7/4
|
8/4
|
9/4
|
|
Employability
|
1/5
|
2/5
|
3/5
|
4/5
|
5/5
|
6/5
|
7/5
|
8/5
|
9/5
|
|
Standard of living
|
1/6
|
2/6
|
3/6
|
4/6
|
5/6
|
6/6
|
7/6
|
8/6
|
9/6
|
|
Cultural value
|
1/7
|
2/7
|
3/7
|
4/7
|
5/7
|
6/7
|
7/7
|
8/7
|
9/7
|
|
Agriculture and fisheries
|
1/8
|
2/8
|
3/8
|
4/8
|
5/8
|
6/8
|
7/8
|
8/8
|
9/8
|
|
Immovable properties
|
1/9
|
2/9
|
3/9
|
4/9
|
5/9
|
6/9
|
7/9
|
8/9
|
9/9
|
3.4.3 Calculation of Weights
The AHP-OS (Analytic Hierarchy Process-Online System) technique was used to calculate the weights based PCM technique into the four phases: 1) decision formation, 2) ranking, 3) normalized pairwise comparison matrix, and 4) calculation of weights (Zolekar and Bhagat, 2015; Navale and Bhagat, 2021b). The following equation used for calculation of weights:
\(£c_i = {W_c \over £W_s}\) (1)
\(£c_i \) = Normalized influence of the criteria; \(W_c\) = Sum of PCA values in row; \(£W_S \) = Total of PCA values all criteria.
The expert’s opinion was the base of ranking the selected criteria and its calculation of weights in the pairwise comparison matrix. The pairwise comparison matrix cell was continued to find the cell values in normalized pairwise comparison matrix (Table 14) (Navale and Bhagat, 2021b). Pairwise comparison matrix computes the specific weights of criteria prejudiced by uniformity judgments of score of the criteria. The CR calculates the consistency of the judgments and shortens the consideration of feasible inaccuracies (Saaty, 1977).
\(CR= {CI \over RI}\) (2)
CR= Consistency ratio; CI= Consistency index; RI= Random Index.
The CR value <0.10 illustration significant consistency and the value >0.10 illustrations inconsistencies (Saaty, 1977; Zolekar and Bhagat, 2015; Mansour et al., 2020; Navale et al., 2021; Navale and Bhagat, 2021b). The following equation is used for calculation of CI:
\(CI=λmax-n/(n-1)\) (3)
The calculated CR is 0.07 showing (CI value 0.10) significant consistency in the calculated values for selected criteria for impact assessment of coastal tourism in the region.
Table 14. Normalized pairwise comparisons matrix
|
Criteria
|
Accessibility / connectivity
|
Amenities
|
Health care facilities
|
Business
|
Employability
|
Standard of living
|
Cultural Value
|
Agriculture and fisheries
|
Immovable properties
|
Sum
|
weight
|
Influence
(%)
|
|
Accessibility / Connectivity
|
1/1
|
2/1
|
3/1
|
4/1
|
5/1
|
6/1
|
7/1
|
8/1
|
9/1
|
45.00
|
0.35
|
35
|
|
Amenities
|
1/2
|
2/2
|
3/2
|
4/2
|
5/2
|
6/2
|
7/2
|
8/2
|
9/2
|
22.50
|
0.18
|
18
|
|
Health care facilities
|
1/3
|
2/3
|
3/3
|
4/3
|
5/3
|
6/3
|
7/3
|
8/3
|
9/3
|
15.00
|
0.12
|
12
|
|
Business
|
1/4
|
2/4
|
3/4
|
4/4
|
5/4
|
6/4
|
7/4
|
8/4
|
9/4
|
11.25
|
0.09
|
9
|
|
Employability
|
1/5
|
2/5
|
3/5
|
4/5
|
5/5
|
6/5
|
7/5
|
8/5
|
9/5
|
9.00
|
0.07
|
7
|
|
Standard of living
|
1/6
|
2/6
|
3/6
|
4/6
|
5/6
|
6/6
|
7/6
|
8/6
|
9/6
|
7.50
|
0.06
|
6
|
|
Cultural value
|
1/7
|
2/7
|
3/7
|
4/7
|
5/7
|
6/7
|
7/7
|
8/7
|
9/7
|
6.43
|
0.05
|
5
|
|
Agriculture and fisheries
|
1/8
|
2/8
|
3/8
|
4/8
|
5/8
|
6/8
|
7/8
|
8/8
|
9/8
|
5.63
|
0.04
|
4
|
|
Immovable properties
|
1/9
|
2/9
|
3/9
|
4/9
|
5/9
|
6/9
|
7/9
|
9/9
|
9
|
5.00
|
0.04
|
4
|
|
Sum
|
2.83
|
5.66
|
8.49
|
11.3
|
14.14
|
16.97
|
19.8
|
22.63
|
25.5
|
127.3
|
1.00
|
100
|
3.4.4 Weighted Analysis
Mikulic (2015) stated that weights are important influence on the classifications of analyzed provinces and conditional decision. Weighted analysis techniques is applied to analysis the impact assessment of selected criterion to the study area were used the calculated weight of each criterion based on 1 to 10 score considering effective influences in hierarchy of certain inputs (Mansour et al., 2020; Ronizi et al., 2020; Raha et al., 2021). The AHP weighting is mostly determined through the judgment-producers who conduct PCM to afford a foundation of assessment among two indices (Zhang et al., 2011). The weights and scores calculated and allotted to criteria for impact assessment of coastal tourism (Mansour et al., 2020). The impact of coastal tourism on socioeconomic development was classified into four categories: High, moderate, less and very less. The cell values of respectively input score are multiplied by their weights to give influence of criteria in defining the levels of impact of coastal tourism in the coastal region of Ratnagiri district (Cengiz and Akbulak, 2009; Ghamgosar et al., 2011, Navale and Bhagat, 2021b).
\(T_p= \sum_{i=1}^n W_i X_i \) (4) (Cengiz and Akbulak, 2009)
where, \(T_p\) = Tourism potential in the region,
\(W_i\) = AHP based calculated weight for selected criterion,
\(X_i\) = Score of sub-criteria of ith criterion,
n = Number of criteria selected for impact assessment.
The calculated values were classified into high, moderate, less and very less categories tourism impact on socioeconomic development in the region.
3.5 Validity
Validity is significant to understand the applicability and limitation of results obtain from analysis of primary data. Validity interprets precision of data and the procedures used for analysis with the fact consistency in accuracy. It used to understand the uniformity and diversity of different parameters in development process estimated based on information gathered through survey (Masadeh et al., 2017). The scholars like Jangra et al. (2021), Sousa et al. (2014), Sun et al. (2019), Chiu et al. (2016), etc. have used different statistical techniques viz. ANOVA test, chi-square, Z-score, student t-test for validation results obtained in analysis of socioeconomic aspects. Jangra et al. (2021) have used ANOVA test to understand variations in perception of respondent about selected criteria. ANOVA test was calculated as a consistency parameter to check the overall internal uniformity consistency of a set of parameter. The results of investigation were compared at 0.05 level of significance in present research area (Jangra et al., 2021).
Table 15. Weights and scores
|
Criteria
|
Weights
|
Influence
(%)
|
Beaches
|
Scores (1 to 10 scale)
|
|
High
|
Moderate
|
Less
|
Very less
|
|
Accessibility and connectivity
|
0.35
|
35
|
Harne
|
2
|
4
|
3
|
1
|
|
Guhagar
|
5
|
5
|
0
|
0
|
|
Budal
|
0
|
1
|
8
|
2
|
|
Velneshwar
|
3
|
4
|
1
|
1
|
|
Hedavi
|
3
|
4
|
3
|
0
|
|
Malgund
|
6
|
2
|
2
|
0
|
|
Bhate
|
6
|
3
|
1
|
1
|
|
Ganpatipule
|
7
|
1
|
1
|
1
|
|
Madban
|
0
|
1
|
7
|
2
|
|
Harne
|
5
|
3
|
1
|
1
|
|
Amenities
|
0.18
|
18
|
Guhagar
|
6
|
1
|
3
|
0
|
|
Budal
|
0
|
3
|
7
|
0
|
|
Velneshwar
|
6
|
3
|
1
|
0
|
|
Hedavi
|
3
|
6
|
1
|
0
|
|
Malgund
|
3
|
3
|
4
|
0
|
|
Bhate
|
4
|
2
|
1
|
3
|
|
Ganpatipule
|
7
|
2
|
0
|
0
|
|
Madban
|
2
|
1
|
2
|
4
|
|
Harne
|
3
|
4
|
1
|
1
|
|
Health care facilities
|
0.12
|
12
|
Guhagar
|
5
|
2
|
2
|
0
|
|
Budal
|
0
|
1
|
9
|
0
|
|
Velneshwar
|
5
|
1
|
4
|
0
|
|
Hedavi
|
3
|
4
|
3
|
0
|
|
Malgund
|
2
|
4
|
3
|
1
|
|
Bhate
|
5
|
3
|
1
|
1
|
|
Ganpatipule
|
6
|
3
|
1
|
0
|
|
Madban
|
1
|
2
|
2
|
4
|
|
Harne
|
4
|
3
|
1
|
1
|
|
Business
|
0.09
|
9
|
Guhagar
|
6
|
4
|
0
|
0
|
|
Budal
|
0
|
2
|
7
|
0
|
|
Velneshwar
|
4
|
4
|
1
|
1
|
|
Hedavi
|
1
|
8
|
1
|
0
|
|
Malgund
|
2
|
3
|
2
|
3
|
|
Bhate
|
4
|
6
|
1
|
0
|
|
Ganpatipule
|
6
|
2
|
2
|
0
|
|
Madban
|
1
|
1
|
6
|
1
|
|
Harne
|
3
|
1
|
4
|
2
|
|
Employability
|
0.07
|
7
|
Guhagar
|
4
|
3
|
3
|
0
|
|
Budal
|
0
|
4
|
2
|
4
|
|
Velneshwar
|
4
|
5
|
0
|
1
|
|
Hedavi
|
1
|
3
|
6
|
0
|
|
Malgund
|
4
|
3
|
2
|
1
|
|
Bhate
|
3
|
4
|
3
|
1
|
|
Ganpatipule
|
6
|
4
|
1
|
0
|
|
Madban
|
2
|
1
|
1
|
5
|
|
Harne
|
3
|
5
|
1
|
1
|
|
Standard of living
|
0.06
|
6
|
Guhagar
|
5
|
4
|
1
|
0
|
|
Budal
|
0
|
1
|
2
|
6
|
|
Velneshwar
|
4
|
2
|
3
|
1
|
|
Hedavi
|
1
|
9
|
1
|
0
|
|
Malgund
|
4
|
3
|
3
|
0
|
|
Bhate
|
4
|
5
|
1
|
1
|
|
Ganpatipule
|
7
|
2
|
1
|
0
|
|
Madban
|
2
|
2
|
5
|
0
|
|
Harne
|
2
|
4
|
1
|
3
|
|
Cultural value
|
0.05
|
5
|
Guhagar
|
4
|
2
|
3
|
1
|
|
Budal
|
0
|
2
|
1
|
7
|
|
Velneshwar
|
1
|
3
|
1
|
2
|
|
Hedavi
|
1
|
5
|
4
|
0
|
|
Malgund
|
2
|
5
|
1
|
1
|
|
Bhate
|
4
|
3
|
2
|
1
|
|
Ganpatipule
|
6
|
3
|
1
|
0
|
|
Madban
|
4
|
1
|
5
|
0
|
|
Harne
|
7
|
2
|
1
|
0
|
|
Agriculture and fisheries
|
0.04
|
4
|
Guhagar
|
5
|
2
|
4
|
0
|
|
Budal
|
1
|
1
|
3
|
4
|
|
Velneshwar
|
6
|
3
|
2
|
0
|
|
Hedavi
|
3
|
2
|
4
|
1
|
|
Malgund
|
3
|
5
|
2
|
0
|
|
Bhate
|
6
|
2
|
2
|
1
|
|
Ganpatipule
|
6
|
1
|
1
|
1
|
|
Madban
|
2
|
5
|
2
|
0
|
|
Harne
|
3
|
4
|
3
|
1
|
|
Immovable properties
|
0.04
|
4
|
Guhagar
|
5
|
3
|
2
|
0
|
|
Budal
|
5
|
2
|
2
|
0
|
|
Velneshwar
|
6
|
2
|
1
|
2
|
|
Hedavi
|
5
|
3
|
0
|
2
|
|
Malgund
|
2
|
5
|
3
|
0
|
|
Bhate
|
8
|
1
|
1
|
1
|
|
Ganpatipule
|
8
|
1
|
1
|
0
|
|
Madban
|
1
|
2
|
4
|
3
|
Table 16. ANOVA: Single factor
|
Beaches
|
Impact assessment (%)
|
|
Count
|
High
|
Moderate
|
Less
|
Very less
|
|
Sum
|
Average
|
Variance
|
Sum
|
Average
|
Variance
|
Sum
|
Average
|
Variance
|
Sum
|
Average
|
Variance
|
|
Harne
|
9
|
331.36
|
36.82
|
249.27
|
307.27
|
34.14
|
115.72
|
165.00
|
18.33
|
132.96
|
96.37
|
10.71
|
72.05
|
|
Guhagar
|
9
|
453.85
|
50.43
|
75.61
|
261.54
|
29.06
|
189.02
|
176.92
|
19.66
|
208.75
|
7.69
|
0.85
|
6.57
|
|
Budal
|
9
|
62.50
|
6.94
|
277.78
|
181.25
|
20.14
|
105.25
|
425.00
|
47.22
|
821.40
|
231.25
|
25.69
|
795.36
|
|
Velneshwar
|
9
|
427.78
|
47.53
|
78.03
|
261.11
|
29.01
|
175.74
|
138.89
|
15.43
|
129.46
|
72.23
|
8.03
|
47.16
|
|
Hedavi
|
9
|
180.00
|
20.00
|
111.11
|
433.34
|
48.15
|
619.74
|
253.33
|
28.15
|
341.97
|
33.33
|
3.70
|
56.79
|
|
Malgund
|
9
|
284.62
|
31.62
|
184.08
|
338.46
|
37.61
|
124.91
|
223.08
|
24.79
|
70.68
|
53.85
|
5.98
|
100.26
|
|
Bhatye
|
9
|
433.34
|
48.15
|
243.50
|
288.88
|
32.10
|
226.36
|
111.18
|
12.35
|
65.02
|
66.66
|
7.41
|
75.45
|
|
Ganpatipule
|
9
|
591.25
|
65.69
|
72.31
|
201.25
|
22.36
|
88.06
|
88.75
|
9.86
|
33.38
|
18.75
|
2.08
|
19.53
|
|
Madban
|
9
|
176.79
|
19.64
|
118.78
|
170.54
|
18.95
|
163.58
|
350.89
|
38.99
|
421.72
|
201.79
|
22.42
|
417.02
|
Table 17. ANOVA: Single factor
|
Levels of impact
|
Source of Variation
|
Sums of square
|
df
|
MS
|
F
|
P-value
|
F-critical value
|
|
High
|
Between group
|
24814.65
|
8
|
3101.83
|
19.79
|
2.03E-15
|
2.07
|
|
Within groups
|
11283.80
|
72
|
156.72
|
|
|
|
|
Total
|
36098.45
|
80
|
|
|
|
|
|
Moderate
|
Between group
|
6193.01
|
8
|
774.13
|
3.85
|
0.000802
|
2.07
|
|
Within groups
|
14467.10
|
72
|
200.93
|
|
|
|
|
Total
|
20660.10
|
80
|
|
|
|
|
|
Less
|
Between group
|
11173.57
|
8
|
1396.70
|
5.65
|
1.45E-05
|
2.07
|
|
Within groups
|
17802.59
|
72
|
247.26
|
|
|
|
|
Total
|
28976.16
|
80
|
|
|
|
|
|
Very less
|
Between group
|
5514.49
|
8
|
689.31
|
3.90
|
0.000717
|
2.07
|
|
Within groups
|
12721.60
|
72
|
176.69
|
|
|
|
|
Total
|
18236.09
|
80
|
|
|
|
|
4 . RESULT AND DISCUSSION
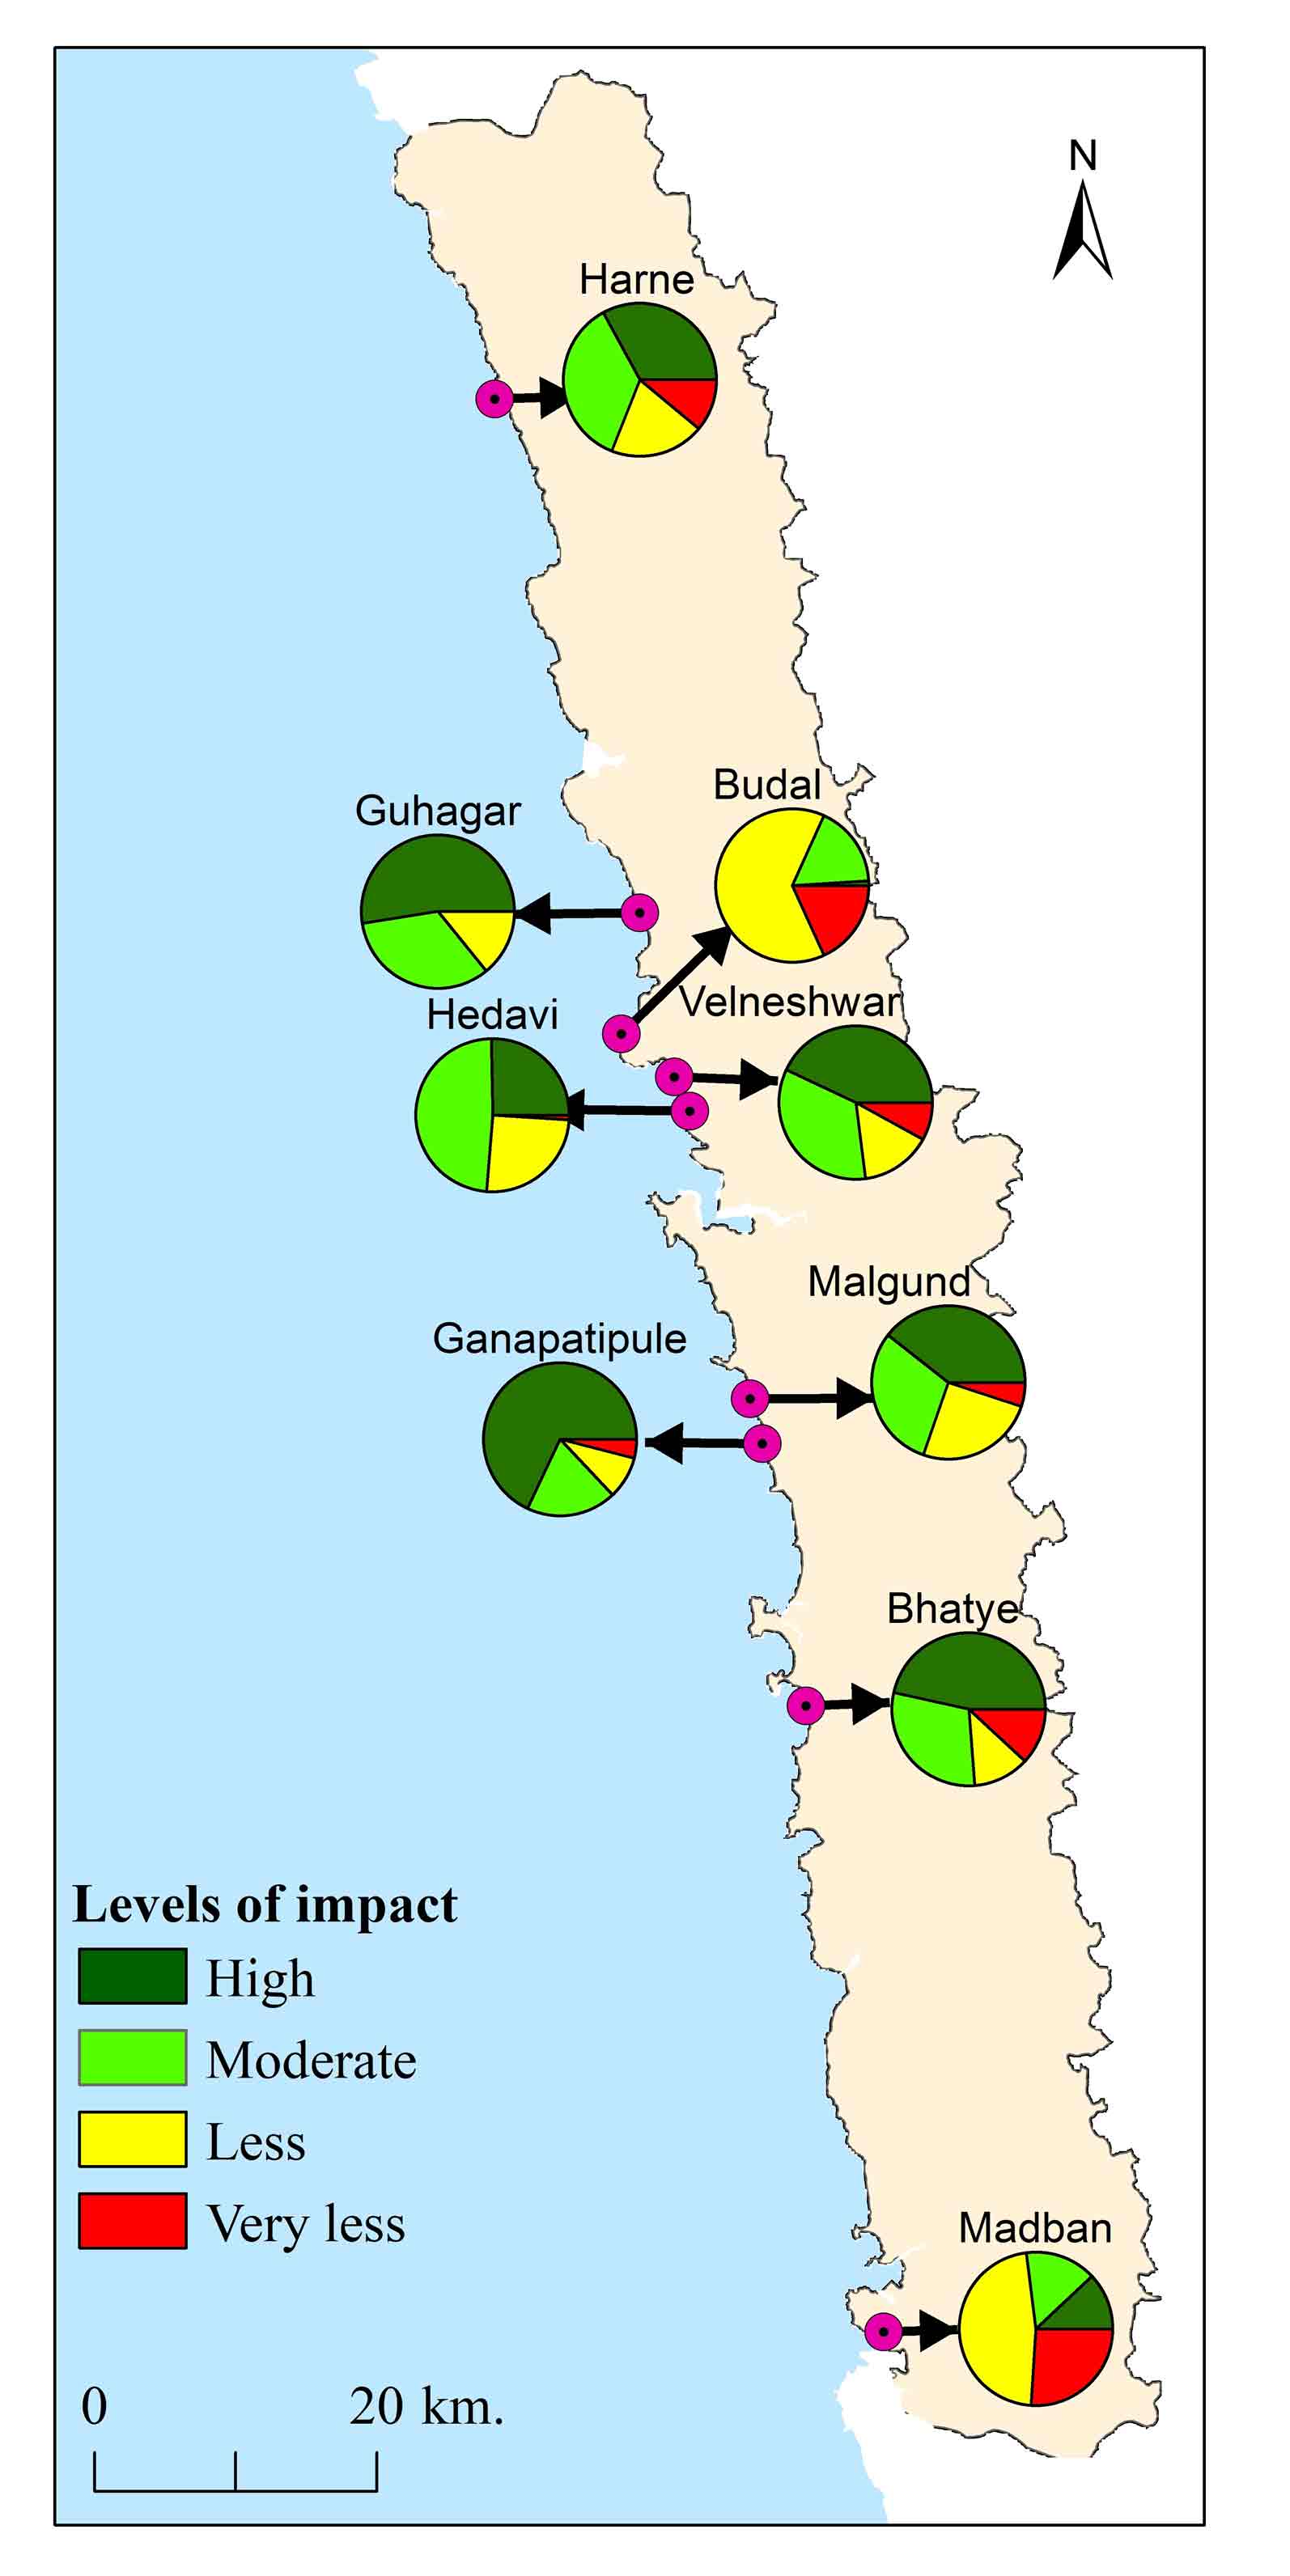
AHP technique was used for impact assessment of coastal tourism on socioeconomic development in coastal zone in Ratnagiri District, Maharashtra (India). The experts’ opinions were used to select and scale out the influences of selected criteria including connectivity and accessibility, amenities, health care facilities, local businesses, employability, standard of living, cultural values, agriculture and fisheries, and immovable properties. All these criteria selected based on literature review and experts’ opinions for collection of data. AHP based weighted analysis was used for impact analysis of tourism activities on socioeconomic development with classification into four categories (Figure 13): 1) high, 2) moderate, 3) less, and 4) very less. The present impact analysis is in ‘view of respondents’ with local variations within selected beaches.
4.1 High Impact
About 35.55% respondents reported higher impact of tourism on socioeconomic development in the coastal zone of Ratnagiri district. The Ganpatipule (67.72%), Guhagar (51.91%), Bhatye (46.88%), Velneshwar (43.18%) and Malgund (39.07%) are highly developed sites for tourism and economic activities (Table 18 and 19). The less variance values estimated for Ganpatipule (72.31%), Guhagar (75.61%), and Velneshwar (78.03%) beaches compared to the other beaches show uniformity within for selected parameters showing higher impact on the development (Figure 13 and Table 18). These beaches show developed facilities like connectivity and accessibility, health care, financial services, more employability, health care facilities, local businesses, employability, standard of living, cultural values, agriculture and fisheries, and immovable properties, etc. as compare to other beaches.
Table 18. Level of impact of tourism on socioeconomic development
|
Beaches
|
Levels of impact (%)
|
|
High
|
Moderate
|
Less
|
Very less
|
|
Harne
|
32.61
|
35.62
|
20.28
|
11.49
|
|
Guhagar
|
51.91
|
33.12
|
14.47
|
0.50
|
|
Budal
|
1.20
|
17.47
|
62.84
|
18.50
|
|
Velneshwar
|
43.18
|
33.86
|
15.12
|
7.84
|
|
Hedavi
|
25.26
|
48.48
|
25.07
|
1.19
|
|
Malgund
|
39.07
|
30.42
|
25.41
|
5.11
|
|
Bhatye
|
46.88
|
29.66
|
11.54
|
11.91
|
|
Ganpatipule
|
67.72
|
19.05
|
9.24
|
3.98
|
|
Madban
|
12.14
|
14.60
|
47.22
|
26.04
|
|
Total
|
35.55
|
29.14
|
25.69
|
9.62
|
Further, less development was reported by respondents for Hedavi, Madban, Malgund, Bhatye and Harne beaches. Hedavi (111.11%), Madban (118.78%), Malgund (184.08%), Bhatye (243.50%), Harne (249.27%) and Budal (277.78%) show higher values of variance indicating variability diversity in contribution of parameters in development processes. The parameters viz. accessibility and connectivity, amenities, health care facilities, local business, employability, cultural values contribute more than the standard of living, agriculture and fisheries, immovable properties in this process of development.
The calculated value of F-statistic (19.79) is < critical value for d.f. (n-1) (2.07) at 0.05 significance level means rejecting the Ho and accepting the H1. It shows significant relationship between the parameters of socioeconomic development in the beach area. Therefore, efficient planning and management needed for the parameters viz. accessibility and connectivity, local business and employability for optimal development through tourism activities in the area of Bhatye, Harne and Budal beaches.
4.2 Moderate Impact
About 29.14 % respondents informed moderate impact for beaches like Hedavi (48.48%) and Harne (35.62%) sites on economic development. Variance value estimated for Hedavi (619.74%) at higher level indicating more contribution cultural value in socioeconomic development whereas variance value for Harne (115.72%) beach at lower level showing uniformity in contribution for the development. Therefore, development of accessibility and connectivity, health care facilities, local business will be helpful to achieve higher socioeconomic development at Hedavi beach and uniform efforts for improvement in all criteria at Harne (115.72 %). Similarly, Budal (105.25%), Harne (115.72 %), Malgund (124.91%), Madban (163.58 %) and Bhatye (226.36%) show
moderate impact on development with lesser variance values indicating requirement of improvement in all criteria for the development. The calculated value F- statistic (3.85) is <critical value for d.f. (n-1) (2.07) at 0.05 significance level. The Ho is rejected and H1 accepted showing significant relationship between the parameters of socioeconomic development in the beach area.
4.3 Less Impact
About 25.69% respondents are reported less impact of tourism activities on development in the region. However, 47.22% and 62.84% respondents informed less impact for Madban and Budal beaches. Higher variance values 341.97%, 421.72% and 821.40% for Hedavi, Madban and Budal beaches indicating requirements of selective efforts for some parameters e.g. accessibility and connectivity, amenities and health care facilities of development. Budal and Madban beaches show more potential of tourism but poor facilities like accessibility, connectivity, required amenities and services with poor employability and standard of living of native people. The variance values estimated for Ganpatipule (33.38 %), Bhatye (65.02%) and Malgund (70.68 %) beaches are less showing uniformity in the parameters in the development. Therefore, efforts for development require uniformly for all selected parameters to achieve socioeconomic development in the area. The calculated value F- statistic (5.65) is < critical value for d.f. (n-1) (2.07) at 0.05 significance level, its means rejecting the Ho and accepting the H1.
4.4 Very Less Impact
About 9.62% respondents reported very less impact of tourism activities in the process of development in the region. Guhagar (0.50 %), Hedavi (1.19%), Ganpatipule (3.98%), Malgund (5.19%) and Velneshwar (7.84%) are reported as very less developed (Table 18 and 19). The variance values are also less for these beaches as Guhagar (6.57 %), Ganpatipule (19.53%), Velneshwar (47.16%) and Hedavi (56.79) beaches indicating uniformity of all parameters in the process of development and all parameters are under and poorly developed. The calculated value F-statistic (3.90) is < critical value for d. f. (n-1) (2.07) at 0.05 significance level rejecting the Ho and accepting the H1. It shows significant relationship between the parameters of socioeconomic development in the beach area.
The information about the different parameters of socioeconomic development was gathered from native people through structured questionnaires and interviews of selected persons. The criteria selected and the ranking performed based on the experts options collected through the questionnaires circulated during the study period. Therefore, the results may vary according the selected respondents from native people and experts.
Table 19. Impact characteristics for tourism development
|
Levels of impact
|
Characteristics
|
Remarks
|
|
High
|
About 35.55% respondents have reported impact of tourism on socioeconomic development at comparatively level.
The Ganpatipule (67.72 %), Guhagar (51.91%), Bhatye (46.88%), Velneshwar (43.18%) and Malgund (39.07%) are highly developed including connectivity and accessibility, health facilities, amenities, financial services, income level, education, recreation opportunities, quality of services etc.
These localities are efficiently connected to the district headquarter and urban area.
The growth in business and employability are observed more at these places.
The tourism development in this region incredibly influencing the standard of living of locale people.
These beaches show tradition cultural and various festivals.
Cultural uniqueness are observed particular Ganpatipule and Velneshwar beaches.
|
The amenities and facilities are more suitable for development of tourism activities at Ganpatipule and Guhagar than Velneshwar, Bhatye and Malgund beaches.
|
|
Moderate
|
About 29.14 % showing moderate impact are recorded like Hedavi (48.48%) and Harne (35.62%) connectivity and accessibility, medical facilities, employability, income and standard of living are moderately observed in this beaches sites.
The fishing and horticulture activities are more significant at the Harne beaches.
The local business are more favorable to development of tourism activities in this region.
Change in immovable properties are moderately observed at selected beaches in this region.
|
Moderate agro-tourism activities are observed but still need of development of horticulture and fishing activities with well planning and management.
The cultural festivals and fishing activities are attraction points of tourists’ in the study area.
|
|
Less
|
About 25.69% respondents have reported less impact of tourism activities on the development with variation at Budal (62.84%) and Madban (47.22%) beaches.
The Budal and Madban beach is high tourism potential with more scenic beauty are observed in this tourist sites. It’s supportive for the development tourism activities. Here, accessibility and connectivity, medical facilities, standard of living, social and cultural uniformity are less developed observed.
The tourism activities, employability and medical facilities are less observed in this region.
|
These beach sites show poor road network, employability, improved stranded of living, income, immovable properties and cultural activities.
These beaches show nice natural environment with tourism potential.
All amenities and facilities need improvement for the development of tourism activities.
|
|
Very less
|
About 9.62 % respondents show very less impact of tourism in the process of development.
|
These sites are less suitable for coastal tourism and need proper planning and policy for the development of required amenities and services for tourism development.
|


 ,
Vijay Bhagat 2
,
Vijay Bhagat 2