The study was focused on quality analysis of housing of native ethnic tribes of cold desert, Leh-Ladakh.
About 40% of households were having Kacha houses with (55.77%) houses of two rooms.
Nearly, 23.10% households were having the size of the rooms as less than 100 sq. ft2.
Majority of households (96.36) were not satisfied with their housing conditions.
Abstract
The present study was carried out to assess the quality of housing of native ethnic tribes of cold desert, Leh-Ladakh. These ethnic tribes being the inhabitants of remote areas of cold desert are lacking behind in almost all the basic facilities. The study reveals that 40% of households were having Kacha houses. Most of the houses (55.77%) had two rooms for human use. Nearly, 23.10% households were having the size of the rooms as less than 100 ft2. The average number of persons sharing each room was less than the recommended standard. About 85.44% households have improper ventilation and 38.59% households have traditional/pit latrines and even 63.35% of households were having pit latrines inside the house. About 49.27% of households have a cowshed located inside the courtyard. Majority of households (96.36) were not satisfied with their housing conditions. Very high quality of housing has been reported in the urban area. Both high and medium quality of housing has been noted in five blocks each, and low/very low quality of housing has been reported also in five blocks. The improvement in housing will lead to better health conditions and overall quality of life.
Housing is not only an essential component of quality of life but also an essential human need as it is the house that reflects the values, aspirations, future expectations and social and cultural identity of its residents and also of society as a whole (Hamdi, 1990; Deheragoda, 2004). Housing environment includes housing conditions, household water supply conditions, indoor air pollution and indoor noise pollution (Rahman, 1998). Housing reflects the cultural, social and economic values of the society (Omole, 2010). The major determinants of environmental health conditions are the lack of access to clean water, inadequate sanitation, poor waste disposal, indoor air pollution and overcrowding in housing (Leukman et al., 2014) and one of the essential derivatives of defective or deteriorated housing is poor health (Smith, 1966). Fuel wood or biomass fuels used for cooking are major sources of indoor air pollutants, which negatively affect the health conditions especially of women (Singh et al., 1996). Traditional residential adjustment in response to harsh climatic conditions leads to various aspects of poor housing that in turn leads to poor health (Rather et al., 2017). There is strong relationship between poor housing and diseases (Park, 2015).
Open for sunlight and ventilation (3x3feet and in cross)
Cattle shed
Outside at >25 feet
Latrine if dry
Outside at >25 feet
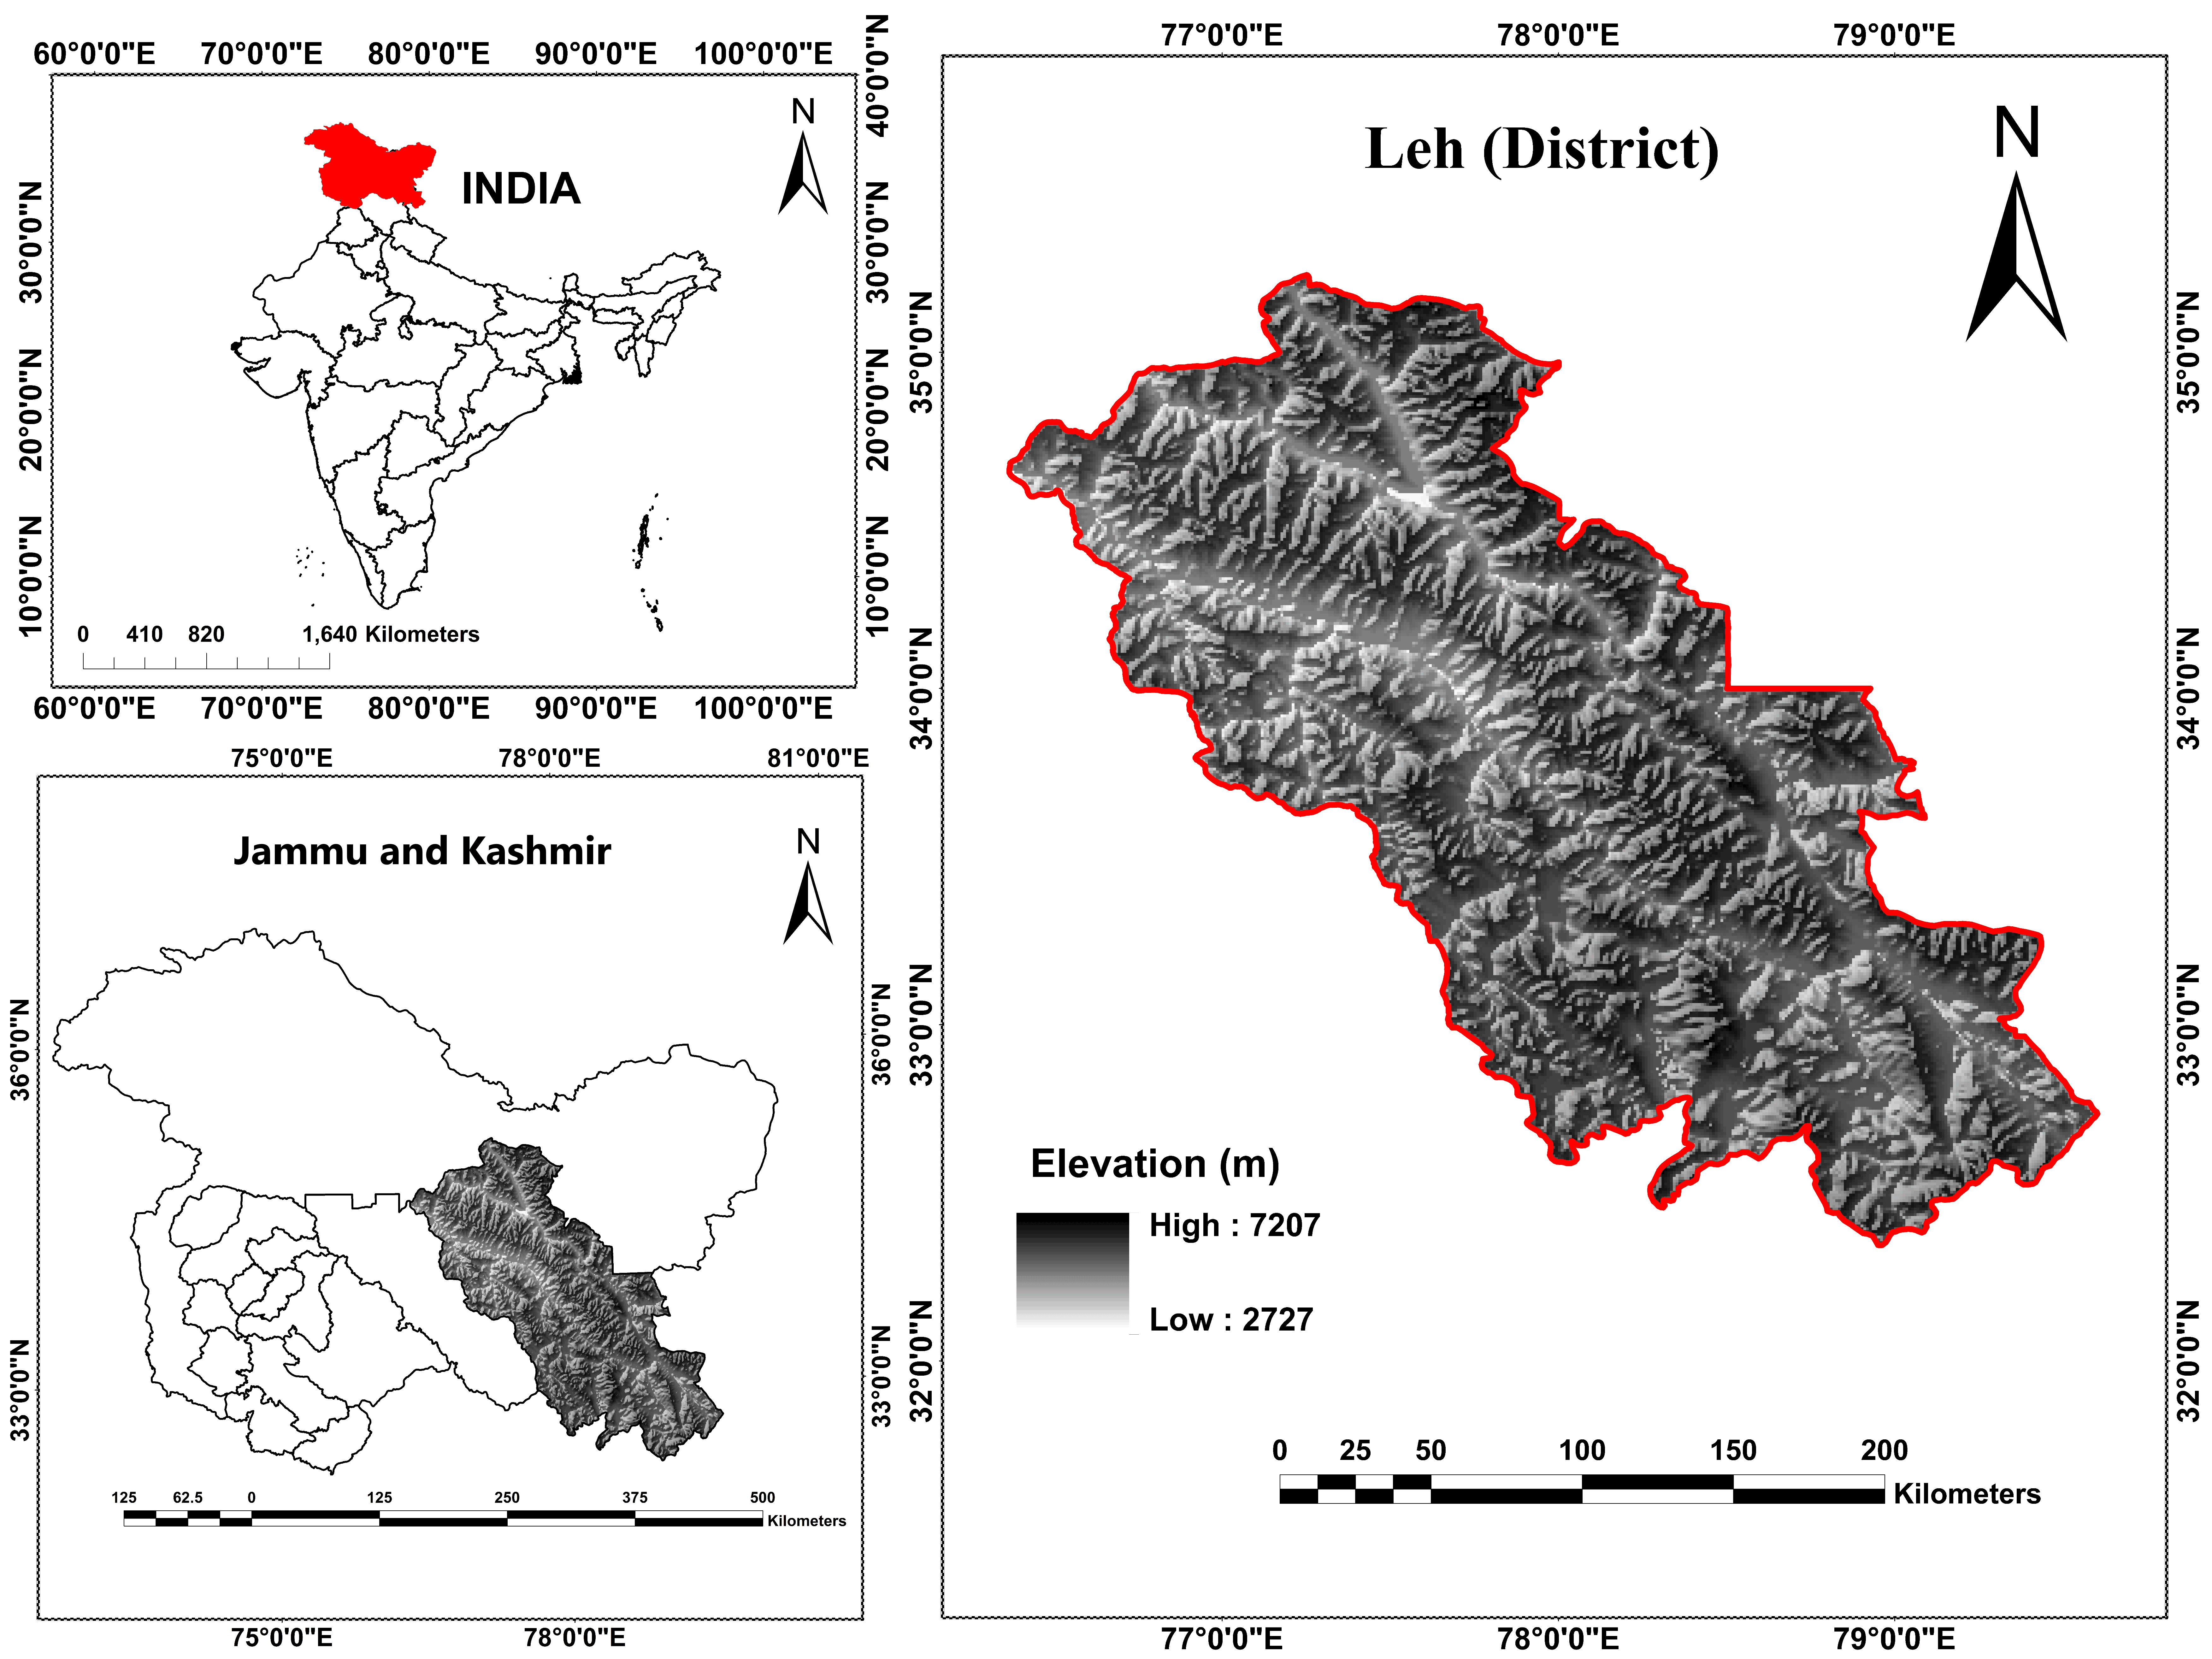
2 . STUDY AREA
The study area is located at an altitude of 2900 to 5900m and lies between 32º to 36ºN latitude and 72º to 80ºE longitude (Figure 1). This is the largest district of Ladakh Union Territory and covers an area of 45100 km2. The area is mountainous throughout within three parallel ranges, the Zanskar, Ladakh, and Karakoram (Husain, 1984). Shayok, Indus, and Zanskar are the three main rivers. Majority of the population lives in river valleys. The main climatic features of the area are wide diurnal and seasonal fluctuation in temperature with -40°C in winter and 35°C in summer seasons (Sagwal, 1991). The annual range of temperature is about 25°C (Husain, 1984).
Figure 1. Study area: Leh district (India)
The study area has a total population of 133487 persons, out of these 87816 persons (65.78%) live in rural areas while as 45671 persons (34.22%) inhabit the urban areas of the district. The majority of the population 95763 (71.74%) is tribal (Census, 2011) and major ethnic tribes are, Bhots, Brokpas, Champas, Mons and Arghuns. They are the descendants of a blended race of Mons of North India, Dards of Baltistan and Mongols of Central Asia (Dewan, 2004).
3 . DATABASE AND METHODOLOGY
Toposheets (Survey of India: 1961) on 1:50,000 scales were used to delineate the study area and to demarcate different blocks. Block was the unit of study in the present research. The present work was based on both primary and secondary data. Primary data was collected through household survey in order to collect the data regarding quality of heath of native ethnic tribes of cold desert Leh-Ladakh. A sample size of around 10% of sample villages (18) and 4 to 10% of sample households (412) were selected for the present study (Table 2). Field survey of 412 sample households in stratified sample of 18 villages and 2 urban wards and Choglamsar notified area was carried out with a structured questionnaire. Interview technique was used for data collection and the questionnaire/schedule was the tool. Head of the village were interviewed for information regarding housing conditions. Secondary data regarding demographic aspects was obtained from Department of Census and Directorate of Economics and Statistics. Secondary data regarding other aspects of quality of housing was also obtained from different departments.
Table 2. Sampling framework
Adminis-trative Units
Blocks
Villages/ wards (no.)
Sampled villages/ wards
Sample villages/
wards (%)
Households (no.)
Sampled
households (no.)
Leh
Leh
5
Saboo
20.00
259
26
Nimmo
9
Nimoo
11.11
193
20
Nyoma
5
Kuyol
20.00
115
12
Rupsho
3
Karzok
33.33
253
26
Chumamathang
9
Keray
11.11
60
06
Durbok
6
Tagste
16.66
126
13
Kharu
15
Shung
13.33
51+140= 191
12+9=21
Chusot
6
Chusot- Gogma
16.66
368
37
Thiksey
4
Shey
25.00
398
28
Khaltsi
Khaltsi
9
Khaltsi
11.11
156
16
Saspool
6
Alchi
16.66
145
15
Lingshet
4
Lingshet
25.00
116
12
Skurbuchan
4
Dah
25.00
103
11
Nubra
Disket
17
Hundar
Skanpok
11.76
269+93= 363
22+14= 36
Turtuk
6
Taksi
16.66
112
12
Panamic
5
Sumoor
20.00
164
17
Urban
areas
Leh town
21
Wards: 9 and 21
14.28
141+91+45=277
50
Choglamsar
01
Choglamsar
100
1931
50
Total
16
135
18
412
Source: Computed from SOI toposheets and census of India (2011)
For determining the quality of housing, 18 variables (Table 3) were selected. Composite score method was used for the measurement of quality of housing. Ranks were assigned according to the order of magnitude of the variables, that is 1 for very high, 2 for high, 3 for medium, 4 for low and 5 for very low (Table 4). In order to remove the biases of scale and with no weightage problem, percentage of variables were assigned ranks. Removal of tie, if any was carried out by taking the average of the ranks of the same values of different blocks. The final score of each variable was obtained by adding the different ranks and finally comparative analysis was done to show the quality of housing in different blocks (Jha and Tripathi, 2014).
Table 3. Variable used for analysis
Variables
Y1 House hold density
Y2 Kacha house (%)
Y3 Pakka house (%)
Y4 Concrete house (%)
Y5 Houses (%) with 1 household
Y6 Houses (%) with 2 households
Y7 Houses (%) with > 2 households
Y8 Room share ratio with < 1person (%)
Y9 Room share ratio with 1-2 persons (%)
Y10 Room share ratio with > 2 persons (%)
Y11 Size of room with >100 ft2 (%)
Y12 Size of room with >100 ft2 (%)
Y13 Houses aged <15 years (%)
Y14 Houses aged 16-35 years (%)
Y15 Houses aged > 35 years (%)
Y16 Ventilated houses (%)
Y17 Houses with cowshed inside house (%)
Y18 Houses with cowshed outside house <25feet (%)
Y19 Houses with flush inside house (%)
Y20 Houses with dry pit latrine inside house (%)
Y21 Houses with dry pit latrine outside house <25feet (%)
Y22 House with good neighborhood relations (%)
Y23 Housing satisfaction (%)
4 . RESULTS AND DISCUSSIONS
4.1 Housing Characteristics
4.1.1 Household Density and Households /House
There is uneven distribution of households in Leh-Ladakh. Average density of households is 93. Density of households ranges from 36 in Durbuk to 366 in Khaltsi. The number of households in a house indicates the internal living density as well as the condition of the housing facility. Out of 412 households surveyed 398 households were having only one household/ house while 10 households were living as 2 households/ house and even 4 households were living as more than 2 households /house (Table 4).
Table 4. Housing characteristics and composite score
Villages
Y1
Y2
Y3
Y4
Y5
Y6
Y7
Y8
Y9
Y10
Y11
Y12
Y13
Y14
Y15
Y16
Y17
Y18
Y19
Y20
Y21
Y22
Y23
Scores
Saboo
98 (1)
23 (2)
38.5 (4)
38.5(4)
88.5 (1)
11 (1)
0 (1)
50.0 (3)
42.3 (3)
7.7 (1)
34.6 (2)
65.4 (4)
26.9 (4)
61.5 (4)
11.5 (4)
84.6 (1)
92.3 (5)
23 7 (2)
57.1 (3)
80.8 (1)
26.9 (2)
53.8 (3)
46.2 (3)
58
Nimmo
48 (1)
10 (1)
40
(4)
50 (3)
90 (1)
10 (1)
0 (1)
35.0 (4)
45.0 (3)
20.0 (2)
40.0 (2)
60.0 (3)
80.0 (2)
20.0 (1)
0.0 (5)
100(1)
100 (5)
30.0 (2)
50.0 (3)
90.0 (1)
10.0 (5)
90.0 (5)
20.0 (5)
61
Kuyol
45 (1)
50 (3)
16.7 (1)
33.3 (4)
100 (1)
0 (1)
0 (1)
33.3 (4)
66.7 (4)
0.0 (1)
16.7 (4)
83.3 (5)
33.3 (4)
66.7 (4)
0.0 (5)
50 (2)
50.0 (2)
33.3 (2)
50.0 (3)
66.7 (2)
50.0 (3)
66.7 (3)
50.0 (3)
63
Karzok
64 (1)
15.4 (1)
53.8 (3)
30.8 (4)
100 (1)
0 (1)
0 (1)
19.2 (5)
73.1 (4)
7.7 (1)
15.4 (4)
84.6 (5)
38.5 (4)
53.8 (3)
7.7 (5)
100(1)
70.0 (4)
23.1 (2)
30.8 (2)
53.8 (3)
46.2 (3)
23.1 (2)
76.9 (4)
64
Kerrey
67 (1)
50 (3)
30
(4)
20 (5)
100 (1)
0 (1)
0 (1)
20.0 (5)
80.0 (4)
0.0 (1)
40.0 (2)
60.0 (3)
40.0 (4)
60.0 (3)
0.0 (5)
100(1)
70.0 (5)
90.0 (5)
40.0 (2)
80.0 (2)
40.0 (2)
80.0 (4)
40.0 (2)
66
Tagste
36 (1)
0 (1)
46
(3)
54 (3)
100 (1)
0 (1)
0 (1)
38.5 (4)
61.5 (4)
0.0 (1)
23.1 (3)
76.9 (4)
30.8 (4)
69.2 (4)
0.0 (5)
100(1)
100. (5)
90.0 (5)
46.2 (3)
100 (1)
23.1 (2)
76.9 (4)
23.1 (2)
63
Gia and Shang
48 (1)
42.9 (3)
23.8 (4)
33.3 (4)
100 (1)
0 (1)
0 (1)
66.7 (2)
19.0 (1)
14.3 (1)
42.8 (1)
57.2 (3)
47.6 (3)
52.4 (3)
0.0 (5)
100(1)
90.5 (5)
80.5 (4)
57.1 (3)
71.5 (2)
17.2 (5)
61.9 (4)
14.3 (5)
63
Gogma
79 (1)
8.1 (1)
67.6 (2)
27.3 (4)
100 (1)
0 (1)
0 (1)
21.6 (4)
70.3 (4)
8.1 (1)
35.1 (2)
64.9 (4)
24.3 (4)
67.6 (4)
8.1 (5)
100(1)
100 (5)
0.0 (1)
86.5 (5)
91.9 (1)
8.1 (5)
71.9 (4)
8.1 (5)
65
Shey
129 (2)
7.7 (1)
42.3 (3)
50 (3)
100 (1)
0 (1)
0 (1)
28.6 (4)
42.9 (3)
28.6 (2)
16.7 (4)
83.3 (5)
17.9 (5)
82.1 (4)
0.0 (5)
100(1)
92.9 (5)
17.1 (1)
21.4 (2)
85.7 (1)
42.9 (3)
17.7 (1)
82.9 (3)
62
Khaltsi
125 (2)
0 (1)
50 (3)
50 (3)
100 (1)
0 (1)
0 (1)
37.5 (4)
37.5 (2)
25.0 (2)
12.5 (4)
87.5 (5)
37.5 (4)
50.0 (3)
12.5 (5)
100(1)
100 (5)
12.5 (1)
75.0 (4)
62.5 (2)
62.5 (4)
75.0 (4)
50.0 (3)
63
Alchi
166 (2)
40 (2)
33.3 (4)
26.7 (4)
100 (1)
0 (1)
0 (1)
26.7 (4)
20.0 (1)
53.3 (3)
46.7 (1)
53.3 (3)
26.7 (4)
73.3 (4)
0.0 (5)
100 (1)
100 (5)
0.0 (1)
40.0 (2)
86.7 (1)
13.3 (5)
36.7 (4)
63.3 (4)
62
Lingshet
80 (1)
8.3 (1)
41.7 (3)
50 (3)
83.3 (1)
0 (1)
17 (1)
33.3 (4)
50.0 (3)
16.7 (1)
0.0 (5)
100 (5)
75.0 (2)
25.0 (2)
0.0 (5)
100 (1)
100 (5)
0.0 (1)
66.7 (4)
16.7 (5)
83.3 (5)
50 (3)
50.0 (3)
65
Dah
48 (1)
45.4 (3)
36.4 (4)
18.2 (5)
100 (1)
0 (1)
0 (1)
45.5 (3)
54.5 (3)
0.0 (1)
18.2 (4)
81.8 (5)
54.5 (3)
18.2 (1)
27.3 (2)
10.0 (5)
100 (5)
81.2 (5)
36.4 (2)
19.8 (5)
36.4 (2)
63.6 (4)
36.4 (2)
68
Hundar/ Skanpok
40 (1)
27.8 (2)
36.1 (4)
36.1 (4)
100 (1)
0 (1)
0 (1)
30.6 (4)
52.8 (3)
16.7 (1)
5.6 (5)
94.4 (5)
41.7 (3)
58.3 (3)
0.0 (5)
100(1)
88.9 (5)
5.6 (1)
46.7 (3)
83.3 (1)
66.7 (4)
33.3 (2)
22.2 (2)
61
Taksi
52 (1)
0 (1)
50
(3)
50 (3)
100 (1)
0 (1)
0 (1)
0.0 (5)
100 (1)
0.0 (1)
0.0 (5)
100 (5)
50.0 (3)
50.0 (3)
0.0 (5)
100(1)
100 (5)
66.0 (4)
33.3 (2)
50.0 (3)
50.0 (3)
33.3 (2)
66.7 (4)
63
Sumoor
63 (1)
23.5 (2)
11.8 (1)
64.7(2)
88 (1)
12 (1)
0 (1)
23.5 (4)
76.5 (4)
0.0 (1)
11.8 (4)
88.2 (5)
29.4 (4)
70.6 (4)
0.0 (5)
100(1)
100 (5)
23.5 (2)
76.5 (4)
64.7 (2)
35.3 (2)
52.9 (3)
58.8 (3)
62
Wards: 4, 9, 21 and Choglamsar
195 (2)
0 (1)
20 (4)
80 (1)
95 (1)
3 (1)
2 (1)
20.0 (5)
67.0 (4)
13.0 (1)
22.0 (3)
78.0 (4)
45.0 (3)
51.0 (3)
4.0 (5)
100(1)
0.0 (5)
8.0 (1)
46.0 (3)
75.0 (2)
30.0 (2)
67.0 (4)
39.0 (2)
59
4.1.2 Type of Houses
Type of house in terms of construction is an important indicator of quality of housing and indicates affordable capacity of a household. So far as the type of houses in Leh-Ladakh is concerned there is wide variation at block level. The majority of households surveyed (161) comprising of 39.10% of total households surveyed were living in Pakka houses. Near about 138 households comprising around 33.50% were having concrete housing. However, 113 households (27.40%) were still living in Kacha houses. These sampled villages of some blocks are at far off distance where material for construction of pakka or concrete houses is very difficult to reach.
4.1.3 Room Occupancy Ratio
This indicator of room occupancy gives a better idea of the internal living density within the area. Analysis of the data reveals that near about 30.13% of households surveyed were having the room occupancy of one person per room and 55.77% households were having two persons per room. However, 14.10% households were having more than 2 persons per room.
4.1.4 Size of Room
The size of room in a house indicates the internal living condition of the house. The majority of household (76.90 %) were having size of room as per standards (100 feet2). However, some households (23.10%) was having size of room less than the 100 ft2.
4.1.5 Age of Houses
This indicator gives a better idea of the physical structure of the houses. The age of houses varies from Leh town to the outskirts. It is relatively more in the town than in the outside of the Leh town. Large number of houses (40.00%) was less than 15 years in age while as 55.20% of houses were varying in age from 16- 35 years. About 4.80% houses are more than 35 years of age (Table 4).
4.1.6 Ventilation of Houses
The majority of sampled households (85.44%) are lacking behind in terms of ventilation because of lack of knowledge of maintaining good health, poor housing and prolonged severe winter conditions.
4.1.7 Cowshed Location
The majority of the households have cowshed inside the house due to cold winter conditions for about six months. The cowshed location within house is observed in 49.27% (Table 4).
4.1.8 Latrine Location
The majority of the households (71.41%) have flush type of latrine. However, 38.59% household showed dry pit type latrine because of poverty and even about 63.35% of households were having pit latrine inside the house especially in rural areas while as 45.87% of households were having pit latrine outside the house (Table 4).
4.1.9 Housing Perception and Neighborhood Relations
It includes the overall satisfaction of the respondents related to their houses and neighborhood. The housing satisfaction decreases as we move towards the town. The people are living in miserable conditions in far-flung areas. Majority of households (96.36%) were not satisfied with their housing but very less percent of households were having bad neighborhoods (3.63%).
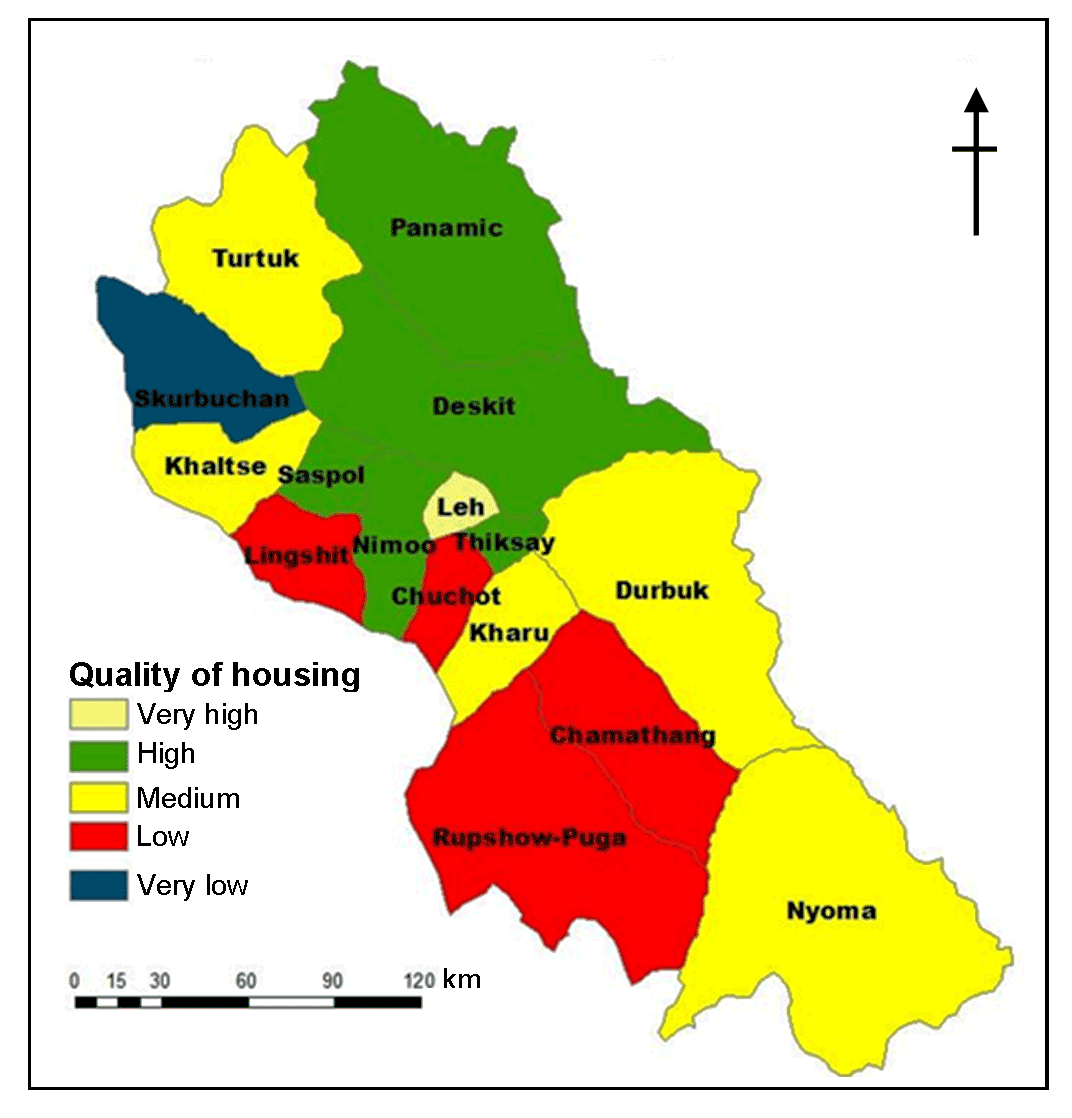
4.2 Quality of Housing
On the basis of composite score, the sample blocks and sample villages were categorized into different levels of quality of housing in Leh- Ladakh (Table 5; Figure 2).
Figure 2. Quality of housing
4.2.1 Very High
Sampled blocks with lowest composite score of less than 60 are categorized under the category of very high quality of housing. Very high quality of education has been noted in the sampled village Saboo of Block Leh, and in urban wards 9 and 21 and in Choglamsar urban area due to good development especially in education sector.
4.2.2 High
All the blocks with composite score of 60-62 are categorized under high quality of housing. This level of housing has been noted in the sample village Nimmo of block Nimmo, Hundar and Skanpok of block Disket, Alchi of block Saspool, Sumoor of block Panamic and Shey of block Thiksey.
Table 5. Housing qualities
Housing qualities
Composite scores
Sample
blocks
Sample villages
Very high
< 60
Leh, Urban Areas.
Saboo, urban ward 9, urban ward 21 and Choglamsar
High
60-62
Nimmo, Thiksey
Disket, Saspool, Panamic
Nimmo, Shey, Hundar, Skanpok.
Alchi and Sumoor
Medium
62- 64
Nyoma, Khaltsi,
Durbuk, Turtuk, Kharu
Kuyol, Khaltsi, Tagste, Shang
and Gia
Low
64- 66
Lingshet, Rupsho, Chachut
Chumathang,
Lingshet, Karzok, chachut Gogma and Keray
Very low
>66
Skurbuchan,
Dah
4.2.3 Medium
This category of quality of housing has the composite score of 62-64 and comprises of sample village Kuyol of block Nyoma, Tagste of block Durbuk, Taksi of block Turtuk, Taksi of block Turtuk, Shang and Gia of block Kharu and village Khaltsi of block Khaltsi.
4.2.4 Low
Under this category of quality of housing all the blocks having composite score of 64-66 have been grouped. This category of quality of Housing has been reported in the sample village Keray of block Chumathang, h chachut Gogma of block Chachut, h Lingshet of block Lingshet and h Karzok of block Rupsho due to lacking of development.
4.2.5 Very Low
The sample blocks having a composite score of greater than 66 have been categorized under very low quality of housing. This category of quality of housing comprises of sample village Dah of block Skurbuchan due to lacking of housing facilities.
5 . CONCLUSION
The study leads to the conclusion that majority of households were having only one household. Majority of households in urban areas of Leh-Ladakh were living in Pakka house, however people in rural areas were still living in Kacha houses. The number of persons per room is more than recommended standard in majority of households and varies from block to block. Majority of household were having size of room not as per standard. Majority of the households have cowshed inside the house. The majority of the households were having flush type of latrine, however 39% households were having dry pit type latrine and 63% households were having pit latrine inside house especially in rural areas. Majority of households were not satisfied with their housing and very less number of households were having bad relations with their neighbors. Very high quality of housing has been noted in the block Leh, and in urban wards 9 and 21 and in Chuglamsar urban area. High quality of Housing has been noted in the blocks of Nimmo, Disket, Saspool, Panamic and Thiksey. Medium quality of housing has been reported in the blocks of Nyoma, Durbuk, Turtuk, Kharu and Khaltsi. Low quality of housing has been reported in the blocks of Chumathang, Chachut, Lingshet and Rupsho, while as very low quality of housing has been noted in the block Skurbuchan.
Tables
Figures
Conflict of Interest
The author declares that there is no conflict of interest.
Acknowledgements
Author is highly thankful to Indian Council for Social Science Research. The present research paper is a part of project entitled assessment of quality of life among native tribes of cold desert Leh-Ladakh, funded by ICSSR.
References
1.
Aderamo, A. and Ayobolu, D., 2010. Spatial Structure of Housing Quality in Nigeria. Research Journal of Social Sciences, 1(5), 12-27.
Baba, S., 2015. Residential environment and related health problems in Srinagar city, Jammu and Kashmir, Doctoral dissertation, Aligarh Muslim University.
Deheragoda, K., 2004. Housing as a fundamental right and sector policy. Housing: Policy Issues and Challenges-Economic Review, Colombo: The People’s Bank Discussion Paper FSIII 01-401, Berlin: Science Centre.
6.
Dewan, P., 2004. Jammu, Kashmir and Ladakh, Manas Publications, New Delhi. Economic Research Discussion, 38.
7.
Eja, 2011. A comparative analysis of residential housing quality and waste management in Ikom Local government area. British Journal of Humanities and Social Sciences, 1(2), 61-71.
8.
Gilg, A., 1985. An Introduction to Rural Geography, Adward Arnold Publications, 61.
9.
Hamdi, N., 1991. Housing without houses: Participation, flexibility, enablement (Book Review). Third World Planning Review, 13(3), 309.
10.
Hussain, M., 1984. Geography of Jammu and Kashmir State, Rajesh Publishers, New Delhi, 34.
Kulkarni, K. M., 1998. Geography of Crowding and Human Response- A Study of Ahmadabad City, Concept publishing company, New Delhi, 74.
14.
Lukeman, Y., Bako, A.I, Omole, F. K., Nwokoro, I. I.C. and Alakinde, M. K., 2014. Environmental health conditions of Slum dwellers of Ijora-Badia of Lagos state, Nigeria, Academic J. of Interdisciplinary Studies, 3(4), 79- 88.
Rahman, A., 1998. Household Environment and Health, B R publication, New Delhi, 119.
20.
Rather, G. M, Dar, R. A., and Bhat, M. S., 2017. Residential environment and related health problems in cold desert Ladakh. Geographical Review, 1(5), 42-57.
21.
Sagwal, S., 1991. Ladakh-Ecology and Environment, Ashish Publishing House, New Delhi, 9-21.