1 . INTRODUCTION
Rapid expansion of urban settlements driven by an increase in human population, socioeconomic activities and economic prosperity turns pressure on the surrounding environment (Al-Kofahi et al., 2018). The rate of land loss to urbanization in recent times has been a source of concern globally, thus the need for effective monitoring and regulation (Al-Kofahi et al., 2018). The expansion of new cities has resulted in the fragmentation of agricultural land, reduction in agricultural land size, hereby hampering the sector’s ability to provide food security. In developing economies like Nigeria, the land tenure system has made it difficult for agricultural practices (Famoriyo, 2010) to thrive and meet the population’s food demand and ensure food security. This underscores the need to understand these complexities from a space-based approach. In a similar vein, the incidence of climate extremes amidst food demand projected to add pressure on the agricultural production system thus making availability of food required for human survival difficult to come by. Sequel to the creation of Niger state in 1976 and the increase in its administrative functions, the state has experienced population rise from approximately 3million in 2006 census (NBS, 2018) to a projected 8million by the end of year 2021 (Brinkhoff, 2021). The rapid increase in the population of Niger State attributed to the inflow of people in search of better opportunities resulting to rapid urbanization. Rapid urbanization and socioeconomic transformation triggers change in land use in the short run, and in the long term it results in the degradation of landscape ecology and the human environment. One of the adverse effects of urbanization is the encroachment of large areas land with high agricultural prospects, which is likely to impact on agricultural productivity and food security. As the state continues in its socioeconomic and industrial development drive to attain economic prosperity, an effective study of the agricultural land encroachment rates due to urbanization is critical to understanding its potential effect on food production while offering policy makers critical information as to the best directions for sustainable growth.
Many researches have explored the potentiality of conventional survey data in monitoring land use changes with interesting results (Mas, 1999; Loveland et al., 2002; Al-Tahir and Ali, 2004; Coulter and Stow, 2005; Brilliant et al., 2020). Their results however, are often deficient in the capability of handling variations among surface features and conditions, alongside assessing remote areas. Such limitations often lead to the ambiguous generalization could result in misclassification and degrade their application in environmental monitoring. As an improvement over the conventional approach, the superiority of Remote Sensing (RS) data provides a robust database of all surface features and conditions across all wavelengths. Furthermore, RS data has found wide application in environmental monitoring application; especially land use changes, by integration of the remotely sensed data in a geospatial workspace to allow for decision making on a regional scale. The use of RS and GIS has featured in many land cover change detections monitoring systems in the recent times. These studies include an assessment of net vegetation changes in Detroit (Ryznar and Wagner, 2001) while Xian and Crane (2005) have used RS and GIS to study urbanization rates. Hardinm et al. (2007) used remotely sensed data, conventional survey and historical data to evaluate the sustainable urbanization in Minna, Niger State, Nigeria. Langley et al. (2001), Richards (2013), Zaidi et al. (2017) and Zanotta et al. (2018) have explored RS and GIS to study urbanization characteristics using supervised classification techniques. Zanotta et al. (2018) and Bashir et al. (2019) used the potentiality of RS to model and analyze the urbanization rate. These studies revealed significant relationships between population growth and land use changes driven by socioeconomic process while reviewing a wide variety of modeling approaches applied in the land use change prediction studies. Therefore, for sustainable agricultural land use conservation and change tracking, explicit LULC maps are critical for management purposes. This study thus seeks to assess the impact of LULC encroachment on agricultural land as it relates to food security using spatiotemporal remote sensing data and digital image classification techniques.
2 . MATERIAL AND METHODS
2.1 Study Area
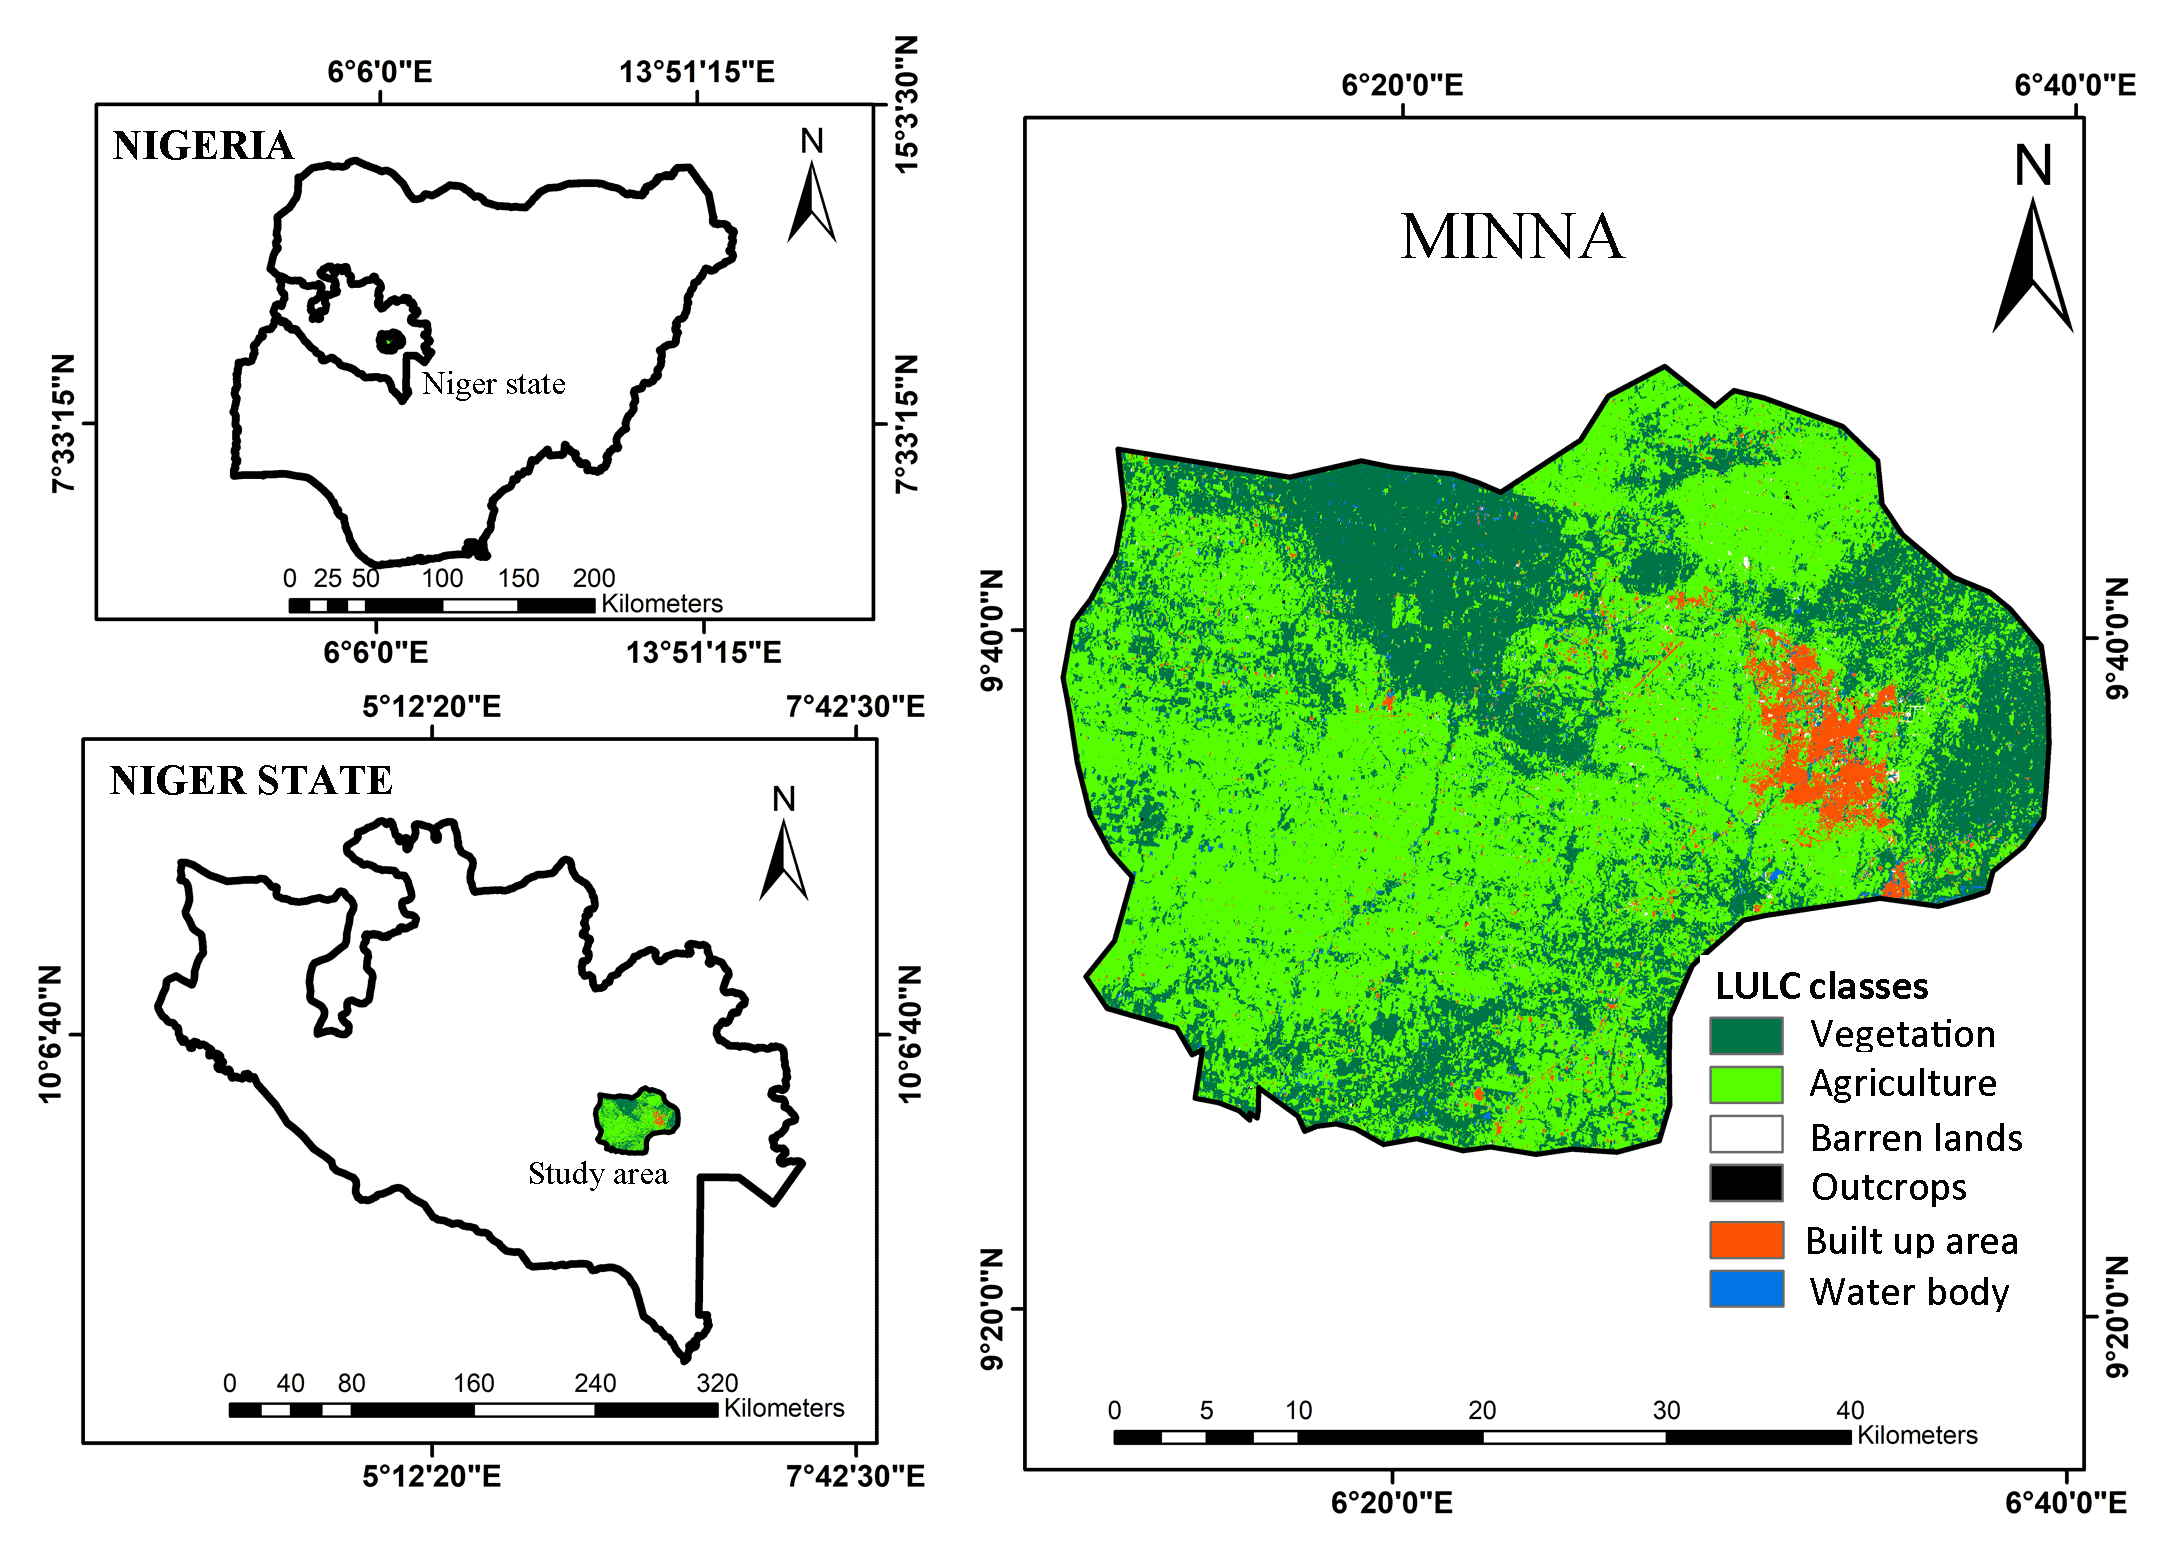
The study area of this research is Minna, Niger State in North Central Nigeria. Minna is located on longitude 9°22'31" to longitude 9°47'59"N and Latitude 6°10'06" to 6°39'15"E with a total land area of 1,585km2 (Figure 1). The land cover of Minna is predominantly vegetation, agriculture and some isolated forests. The physical setting of Minna shows a gradual rise from a gentle slope ranging from a minimum of 3.10o to a maximum of 36o at the eastern part. The highly elevated areas include the Bosso Khukun, Maikunkele hills and the Maitumbi outcrops of igneous formation along the North and Southeastern part of the study area. Elevation varies from as little as 150m to a peak of 340m above mean sea level (AMSL). The low lands correspond to the Gbeganu areas towards the Federal University of Technology Minna, permanent site along Minna-Bida Road. The highly elevated areas on the contrary occur along the Eastern part of Bosso, Tayi village and Maikunkele areas of Minna. The climate of the study area belongs to the tropical wet and dry savanna based on the Köppen Classification. This kind of climate is associated with pronounced dry season in low-sun months, no cold season, wet season in the high-sun months (Adefolalu, 1988; Ayinde et al., 2013). Temperature ranges from 26°C to 40°C in the month of January and April, respectively. There exists a slight rainfall variation across the study area with an average value of 2200mm (Adefolalu, 1988).
2.2 Data
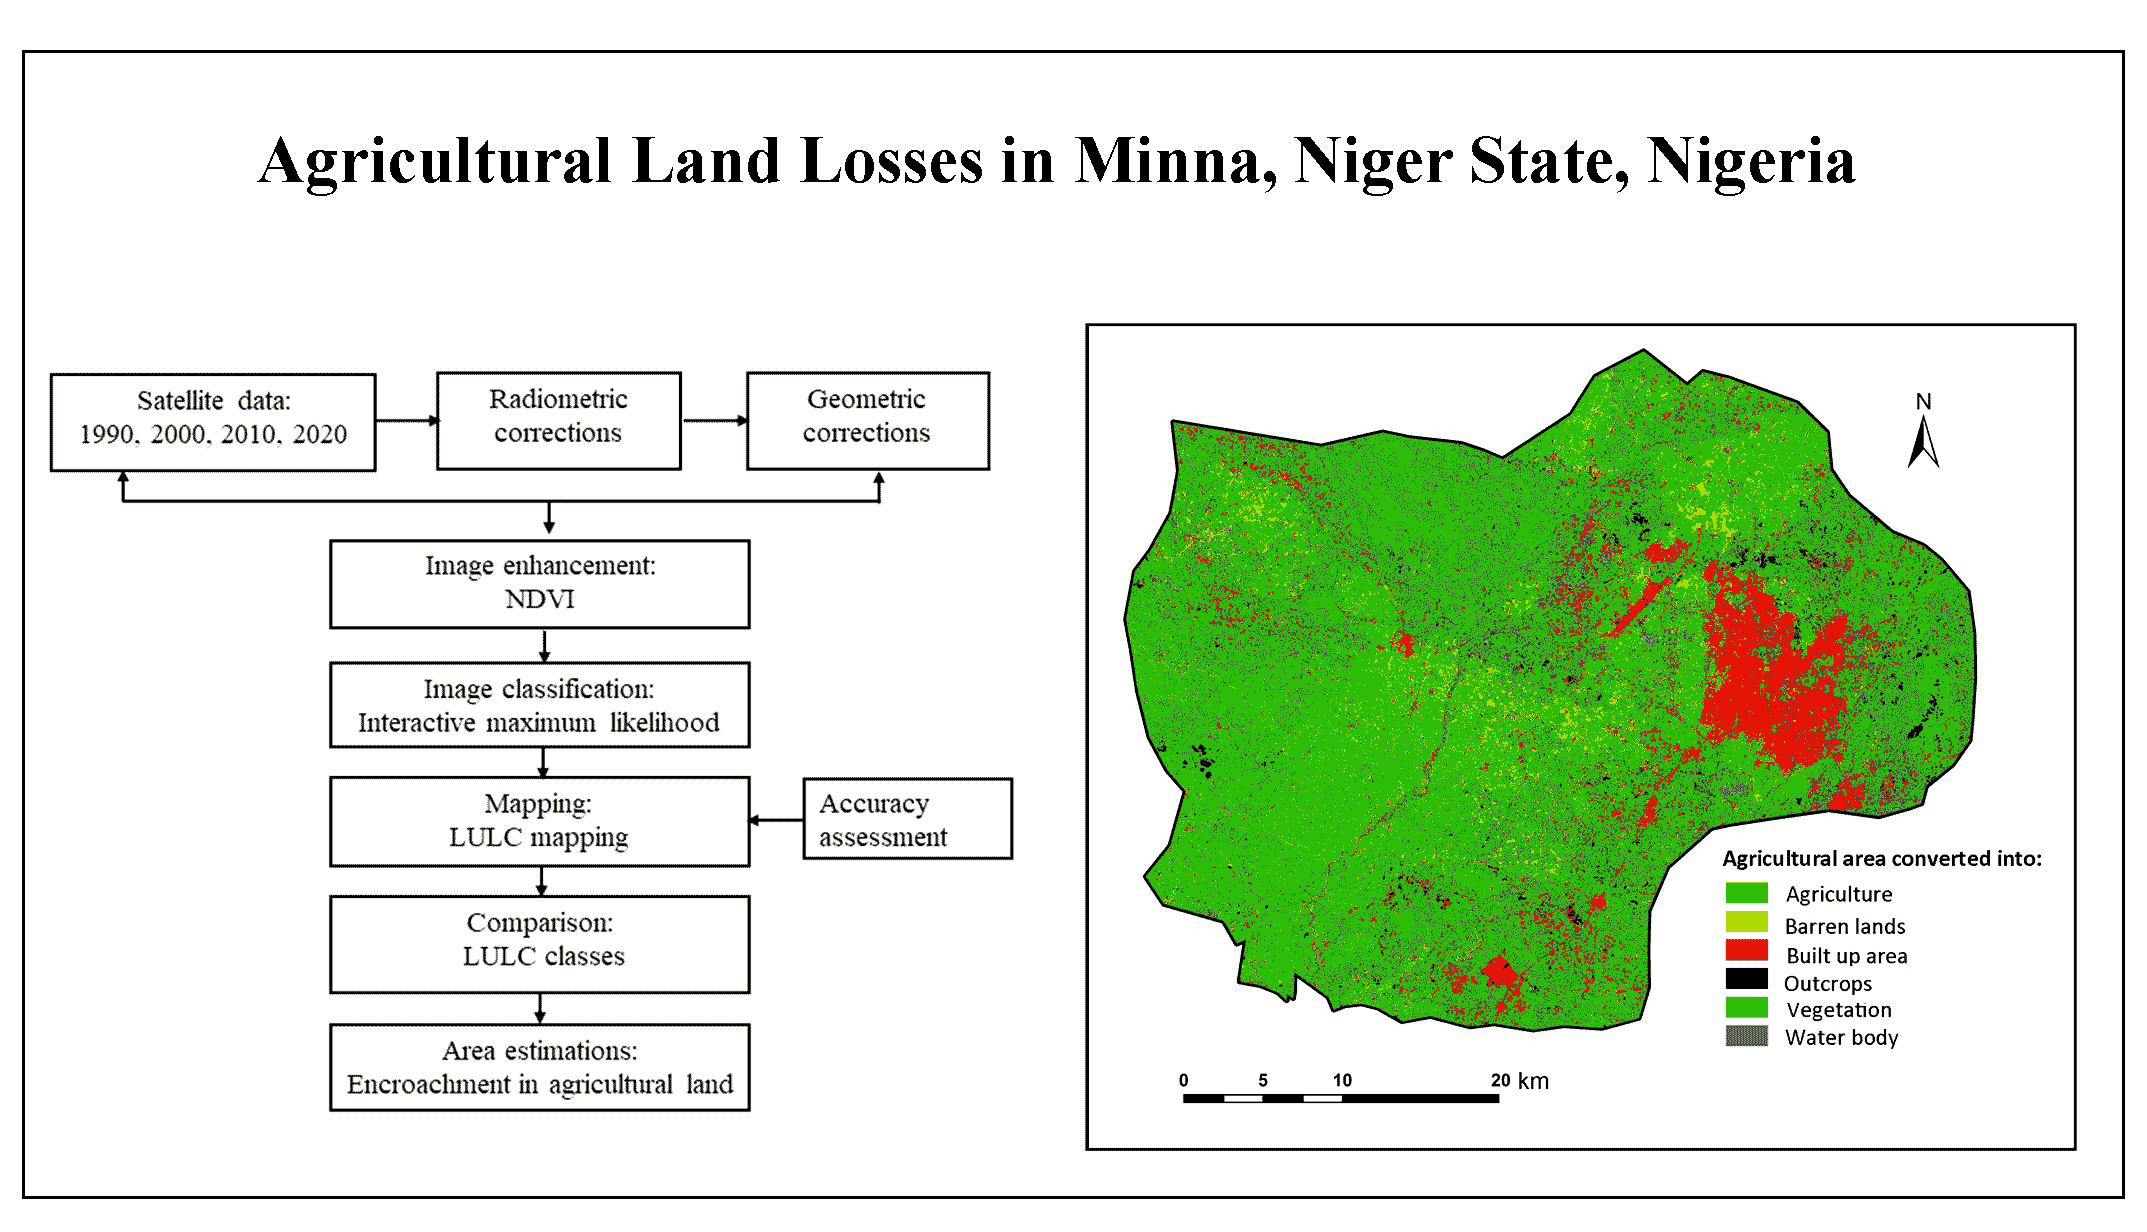
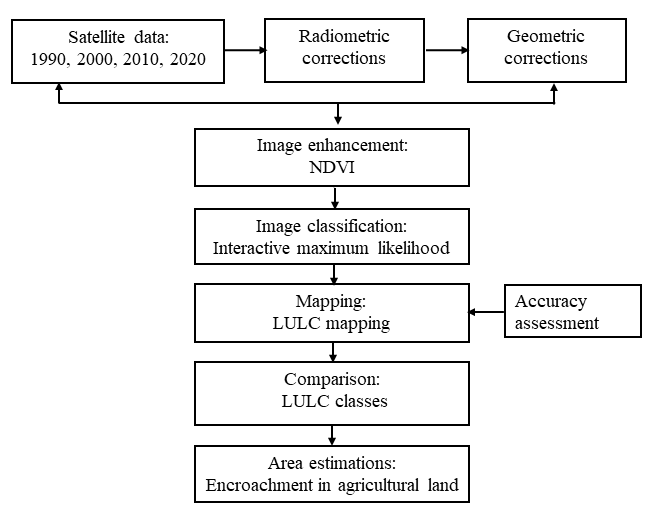
The methodology employed in this research presented in Figure 2. A remotely sensed data was procured from USGS for the period of 1990-2010; while 2020 was used as control data (Gigandet et al., 2005). Landsat multispectral scanner (MSS), Thematic Mapper (TM) and Enhanced Thematic Mapper plus (ETM+) downloaded from https://glovis.usgs.gov/ and used in evaluating the LULC changes over Minna, for the period under review. The criteria for the selection of Landsat imagery was influenced by the quality of the imagery defined by limited interference of cloud cover. The first step of data analysis, was to subject the acquired data to a data integrity test, in order to enhance the data quality and accuracy as proposed by Romero et al. (2015) and Gagniuc (2017). The images were geo-referenced and transformed into WGS 84 datum and UTM Minna, zone 31N projection system. The next step was the layer stacking to ortho-rectify the satellite imagery. Consequently, radiometric and geometric correction carried out on the spot image using ERDAS Imagine 2014, after converting to a Digital Number (DN) in remote sensing systems. A variable assigned to the remote sensing image pixel as reflectance values implemented. This procedure according to Halim et al. (2018), has potential to produce a highly optimized data with low degradation of results. Sequel to image correction, 400 randomly selected points over different LULC were collected as ground control points to perform image registration (Dewan and Yamaguchi, 2009a; Arfanuzzaman and Dahiya, 2019) of Minna and further track and evaluate accuracy of classified images using a global positioning system. The implemented control points used in the image registration dispersed on the image scene, producing a root mean square error (RMSE) of 0.5 per pixels. Prior to the image classification, geometric correction performed on all the images using Landsat-8 operational land imager/thermal infrared scanner (OLI/TIRS). In order to minimize conflict, temperature and reflective bands omitted (Dewan and Yamaguchi, 2009a; Yang et al., 2018; Arfanuzzaman and Dahiya, 2019). Geospatial data including survey, administrative, physical and municipal boundaries used to enhance land cover type analysis. Sequel to the implemented technique in data generation and corrections, reference data (Table 1) used in the selection of area of interest (AOI) and for the assessment of image classification accuracy. A high-resolution image of 0.5m and detail reconnaissance approach used to generate information for the analysis of the classified images. Due to the variability in the quality of the obtained images, false color composite was implemented using varying bands combination among the MSS and TM images while a false color composite of RGB 543 maintained on the ETM+ and OLI/TIRS images.
Table 1. Data sets
|
Data
|
Dates of acquisition
|
Resolutions
|
Azimuth
|
|
Landsat TM data
|
1990-01-29T16:24:59Z
|
30m
|
135.92
|
|
Landsat-7 ETM+ data
|
2000-12-11T21:26:05Z
2010-01-04T14:34:24Z
|
30m
|
143.34
|
|
Spot Image
|
2015
|
1m
|
|
|
Google Earth images
|
2018-03-28
|
6m
|
|
|
Street Guide map
|
1991
|
1.50,000
|
|
|
Landsat8 OLI/TIRS
|
2020-03-25T14:39:34Z
|
30m
|
115.25
|
|
Survey map of Niger State
|
1996
|
1:25,000
|
|
|
Geological map of Niger State
|
2012
|
1:25,000
|
|
|
Drainage map
|
2000
|
1:25,000
|
|
|
Digital Elevation Model
|
2021
|
10X10m
|
|
|
LULC map
|
2000
|
1:100,000
|
|
2.3 Image Enhancement Techniques
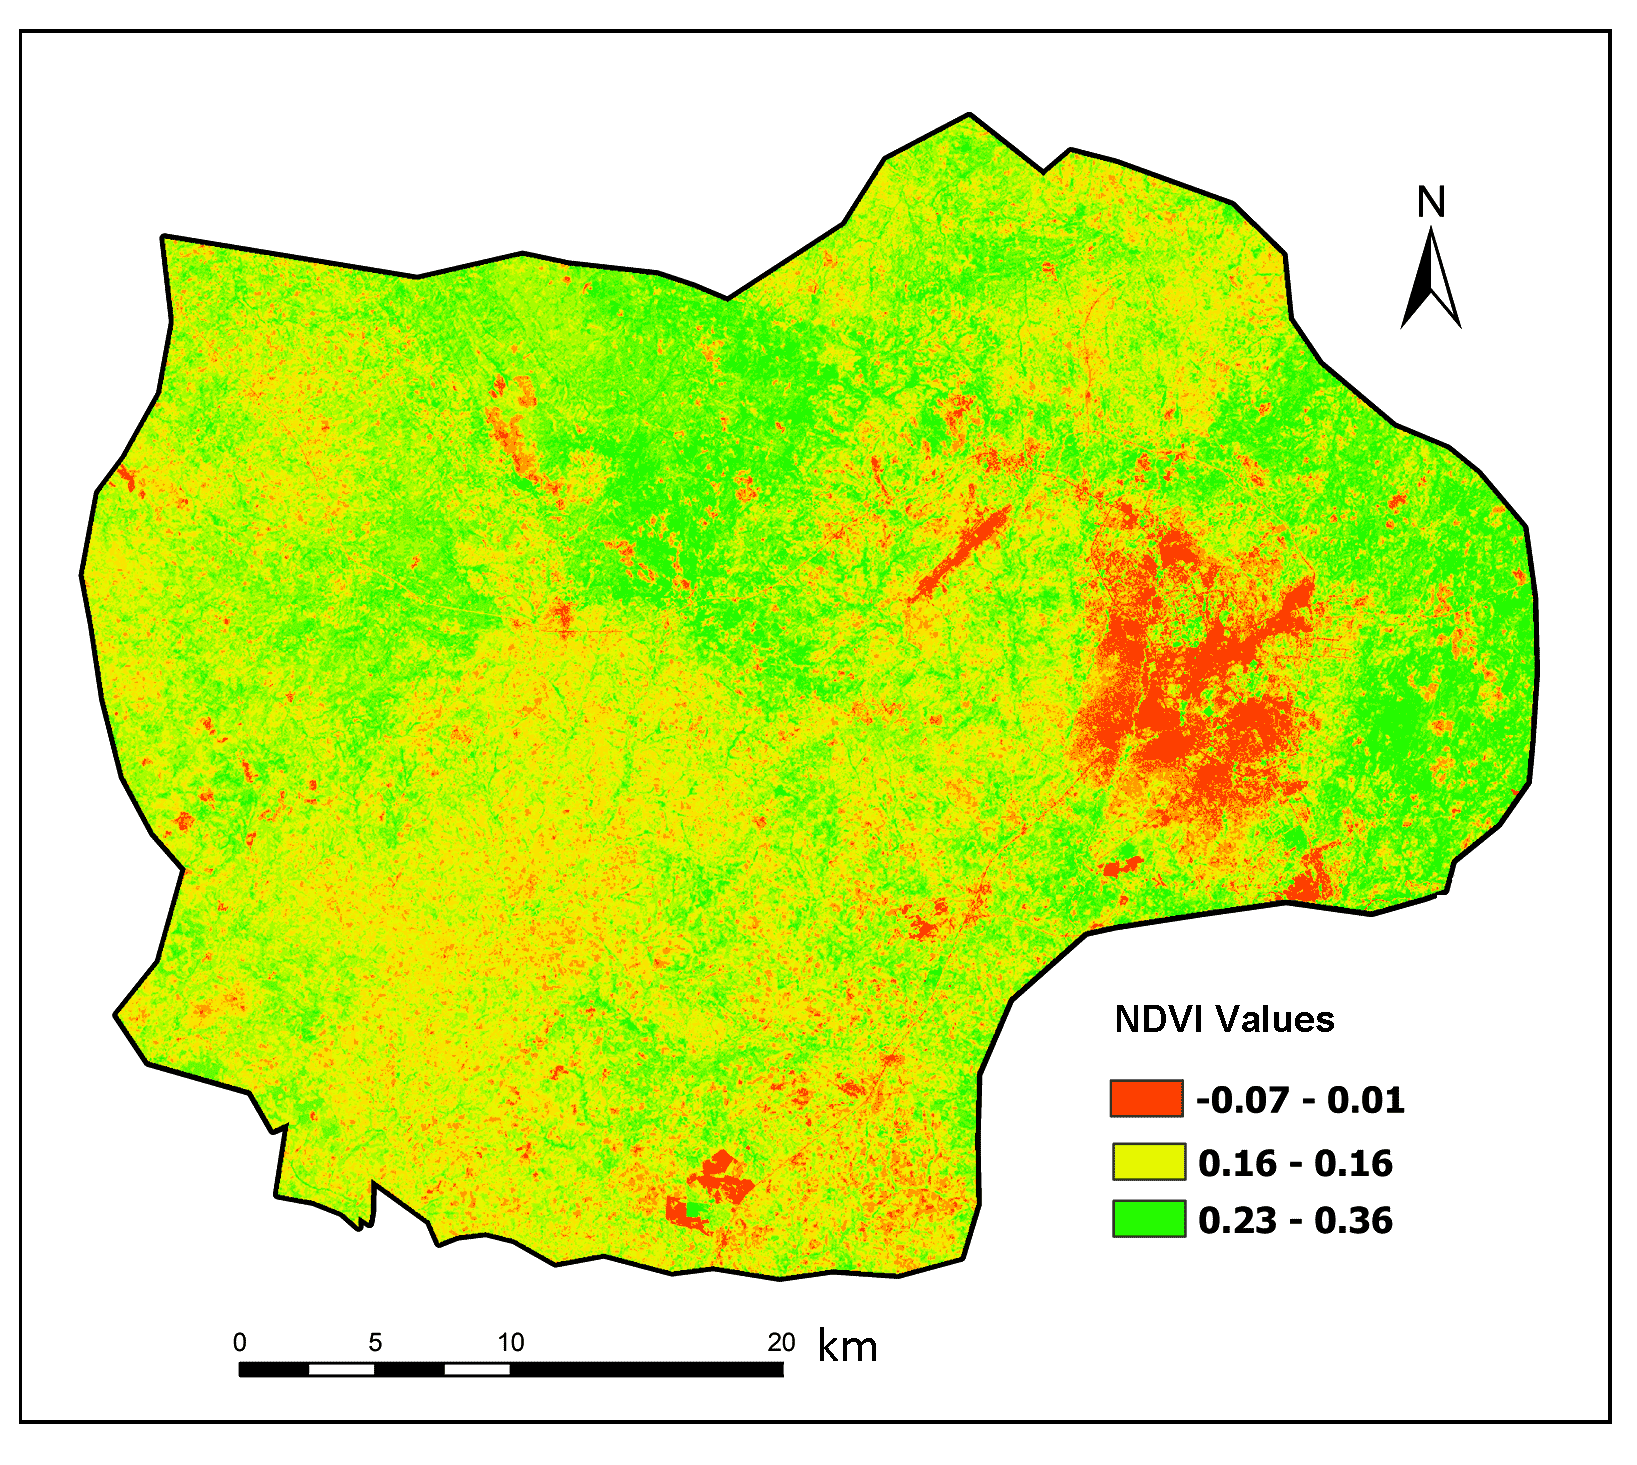
Image enhancement techniques are often used as a preprocessing approach aimed at improving the visual quality of an image prior to a higher level visual task such as feature recognition and classification (Sharma et al., 2018). Generally, Normalized Difference Vegetation Index (NDVI), removal of blur and poor contrast, noise reduction and Gaussian smoothening are among the different image enhancement techniques. NDVI however, is most suitable for the analysis of vegetation cover related analysis. The suitability of the NDVI arises from its capacity to estimate vegetation cover from the substantial difference in reflectance from near infrared (NIR) and the red (R) bands (Xiao and Moody, 2005; Berra et al., 2017). In addition, NDVI is more sensitive for the estimation of different vegetation cover conditions due to its ability to demarcate different classes of land cover within a given area of interest (Usman et al., 2015). Thus, the NDVI of the images were determined using 543 composites on the imagery before classification. By this procedure, areas of low and high vegetal cover between 0-1 were refined. Thus, providing an enhanced land used land cover characteristic inference of the study area.
2.4 Image Classification Technique
To ascertain the digital number and spatial reference of the different land use land cover categories, all satellite data, spatial and spectral profiles were evaluated prior to classification (Dewan and Yamaguchi, 2009a). Sequel to the spatial and profile evaluation is the selection of training samples from referenced data and other auxiliary data (Table 1). A total of two hundred to three hundred training sites selected at varying pixels per class for image training. A training sample of six classes (Table 2) selected and the sample was redefined, merged where necessary and deleted sequel to evaluation of the class histogram. A supervised maximum classification algorithm was then employed to obtain the best results, with each class having a Gaussian distribution (Keuchel et al., 2003; Oon et al., 2019) for each image. To improve the accuracy, the post-classification refinement technique employed as an effective method of increasing image classification in maximum likelihood classification approach. The heterogeneous nature of the study area resulted in misclassification due to the low resolution of the input data in the workflow. To overcome the environmental heterogeneity that could result from misclassification (Lyons et al., 2012), local knowledge, AOI, referenced survey data and visual recognition analysis were implemented. The use of these parameters in a maximum likelihood classification is capable of improving classification accuracy such that delineated feature classes are true representations of their classes (Dewan and Yamaguchi, 2009a; Otukei and Blaschke, 2010; Abd and Alnajjar, 2013; Chamling and Bera, 2020).
Table 2. LULC classification
|
Land-cover types
|
Descriptions
|
|
Built up area
|
It includes settlements, industrial areas, infrastructural network, road network, government buildings, schools, markets and energy station.
|
|
Water body
|
Water bodies are rivers, open water, water in ponds, canals, surface runoff and dams.
|
|
Vegetation
|
Vegetation includes shrubs trees, deciduous coniferous and mixed forest, herbs, climbers’ recreational areas, parks, playgrounds.
|
|
Agriculture
|
Agricultural land utilization for both animal and crop production on a small and large scale, it includes land used for; plantation, crop and animal production, ranches, palms, orchards, gardens, and irrigation farmlands
|
|
Outcrops
|
This comprises of rocks exposed to the surface either as a result of denudation activities or human activities.
|
|
Barren lands
|
These are sand excavated lands; and land areas without vegetation or grasses.
|
2.5 Accuracy Assessment
Accuracy assessment of classified images is a major prerequisite for ascertaining the true values of the classification result. The accuracy in this study assessed using reference data sets to match the schema. Thus, for remote sensing imagery classification purposes total of 150 pixels generated using a stratified random sampling procedure. Data on geographical features then generated from a topographical map of Minna, on a scale of 1:25,000 as sourced from the Survey Department of Niger State Ministry of Land and Housing. This was used for the accuracy assessment of classified images of the year 1990 and 2000. Fieldwork and refined data from a high-resolution SPOT image of Minna and Google Earth image at 5m resolution used to perform accuracy assessments for year 2010 and 2020 respectively. 190 and 210 reference data used in the assessment of 1990, 2000, 2010 and 2020. Producer and user accuracy for the different LULC class reports obtained for each decade (Table 3).
Table 3. Accuracy assessment
|
LULC Class
|
1990
|
2000
|
2010
|
2020
|
|
P (%)
|
U (%)
|
P (%)
|
U (%)
|
P (%)
|
U (%)
|
P (%)
|
U (%)
|
|
Agriculture
|
78.52
|
74.56
|
100
|
98.1
|
96.75
|
96.75
|
98.99
|
100
|
|
Barren lands
|
70.98
|
70.98
|
73.85
|
86.61
|
98.5
|
98.5
|
100
|
100
|
|
Built-up area
|
99
|
99.12
|
100
|
100
|
96.75
|
96.75
|
100
|
100
|
|
Outcrop
|
72.64
|
75
|
78.35
|
75.1
|
94.1
|
86.74
|
81.26
|
72.28
|
|
Vegetation
|
84.31
|
72.31
|
86.56
|
84.2
|
97.01
|
100
|
95.21
|
92.31
|
|
Water bodies
|
100
|
96.21
|
81.23
|
85.65
|
97.01
|
98.54
|
100
|
93.72
|
P= Producer’s accuracy, U= User’s accuracy
2.6 Change Detection
To determine the change in the land use cover types, a post-classification approach was employed, which has been described as highly efficient in the detection of change rate, nature and change location (Dewan and Yamaguchi, 2009a) with evidence of successful application in many urban environment research including (Hardin et al., 2007; Akbar et al., 2019; Kalhor and Emaminejad, 2019). Sequel to the post classification, an overlay procedure implemented using GIS to determine the spatial changes in LULC during the three decades under evaluation (1990, 2000, 2010 and 2020).
3 . RESULTS AND DISCUSSION
3.1 Normalized Difference Vegetation Index
NDVI according to Pettorelli et al. (2005) provides information regarding the spatial and temporal distribution of vegetation. Thus, the image enhancement is pertinent in the understanding of the variation in land surface conditions, such as the ability to differentiate between vegetation and agricultural lands. The overall NDVI results in Figure 3 ranges from -0.07 to 0.36. The lowest NDVI value of -0.07-0.01 conformed the developed areas where there exists no vegetation. The highly vegetated areas have NDVI value of 0.23 to 0.36. This result therefore, shows a strong correlation with vegetation quality and clearly able to delineate the agricultural lands with a NDVI of 0.16.to 0.18. The NDVI results optimized for the identification of land cover features amidst an array of features with similar spectral response patterns. Thus, the errors from mixed classifications minimized due to the enhancement performed on the imagery before classification.
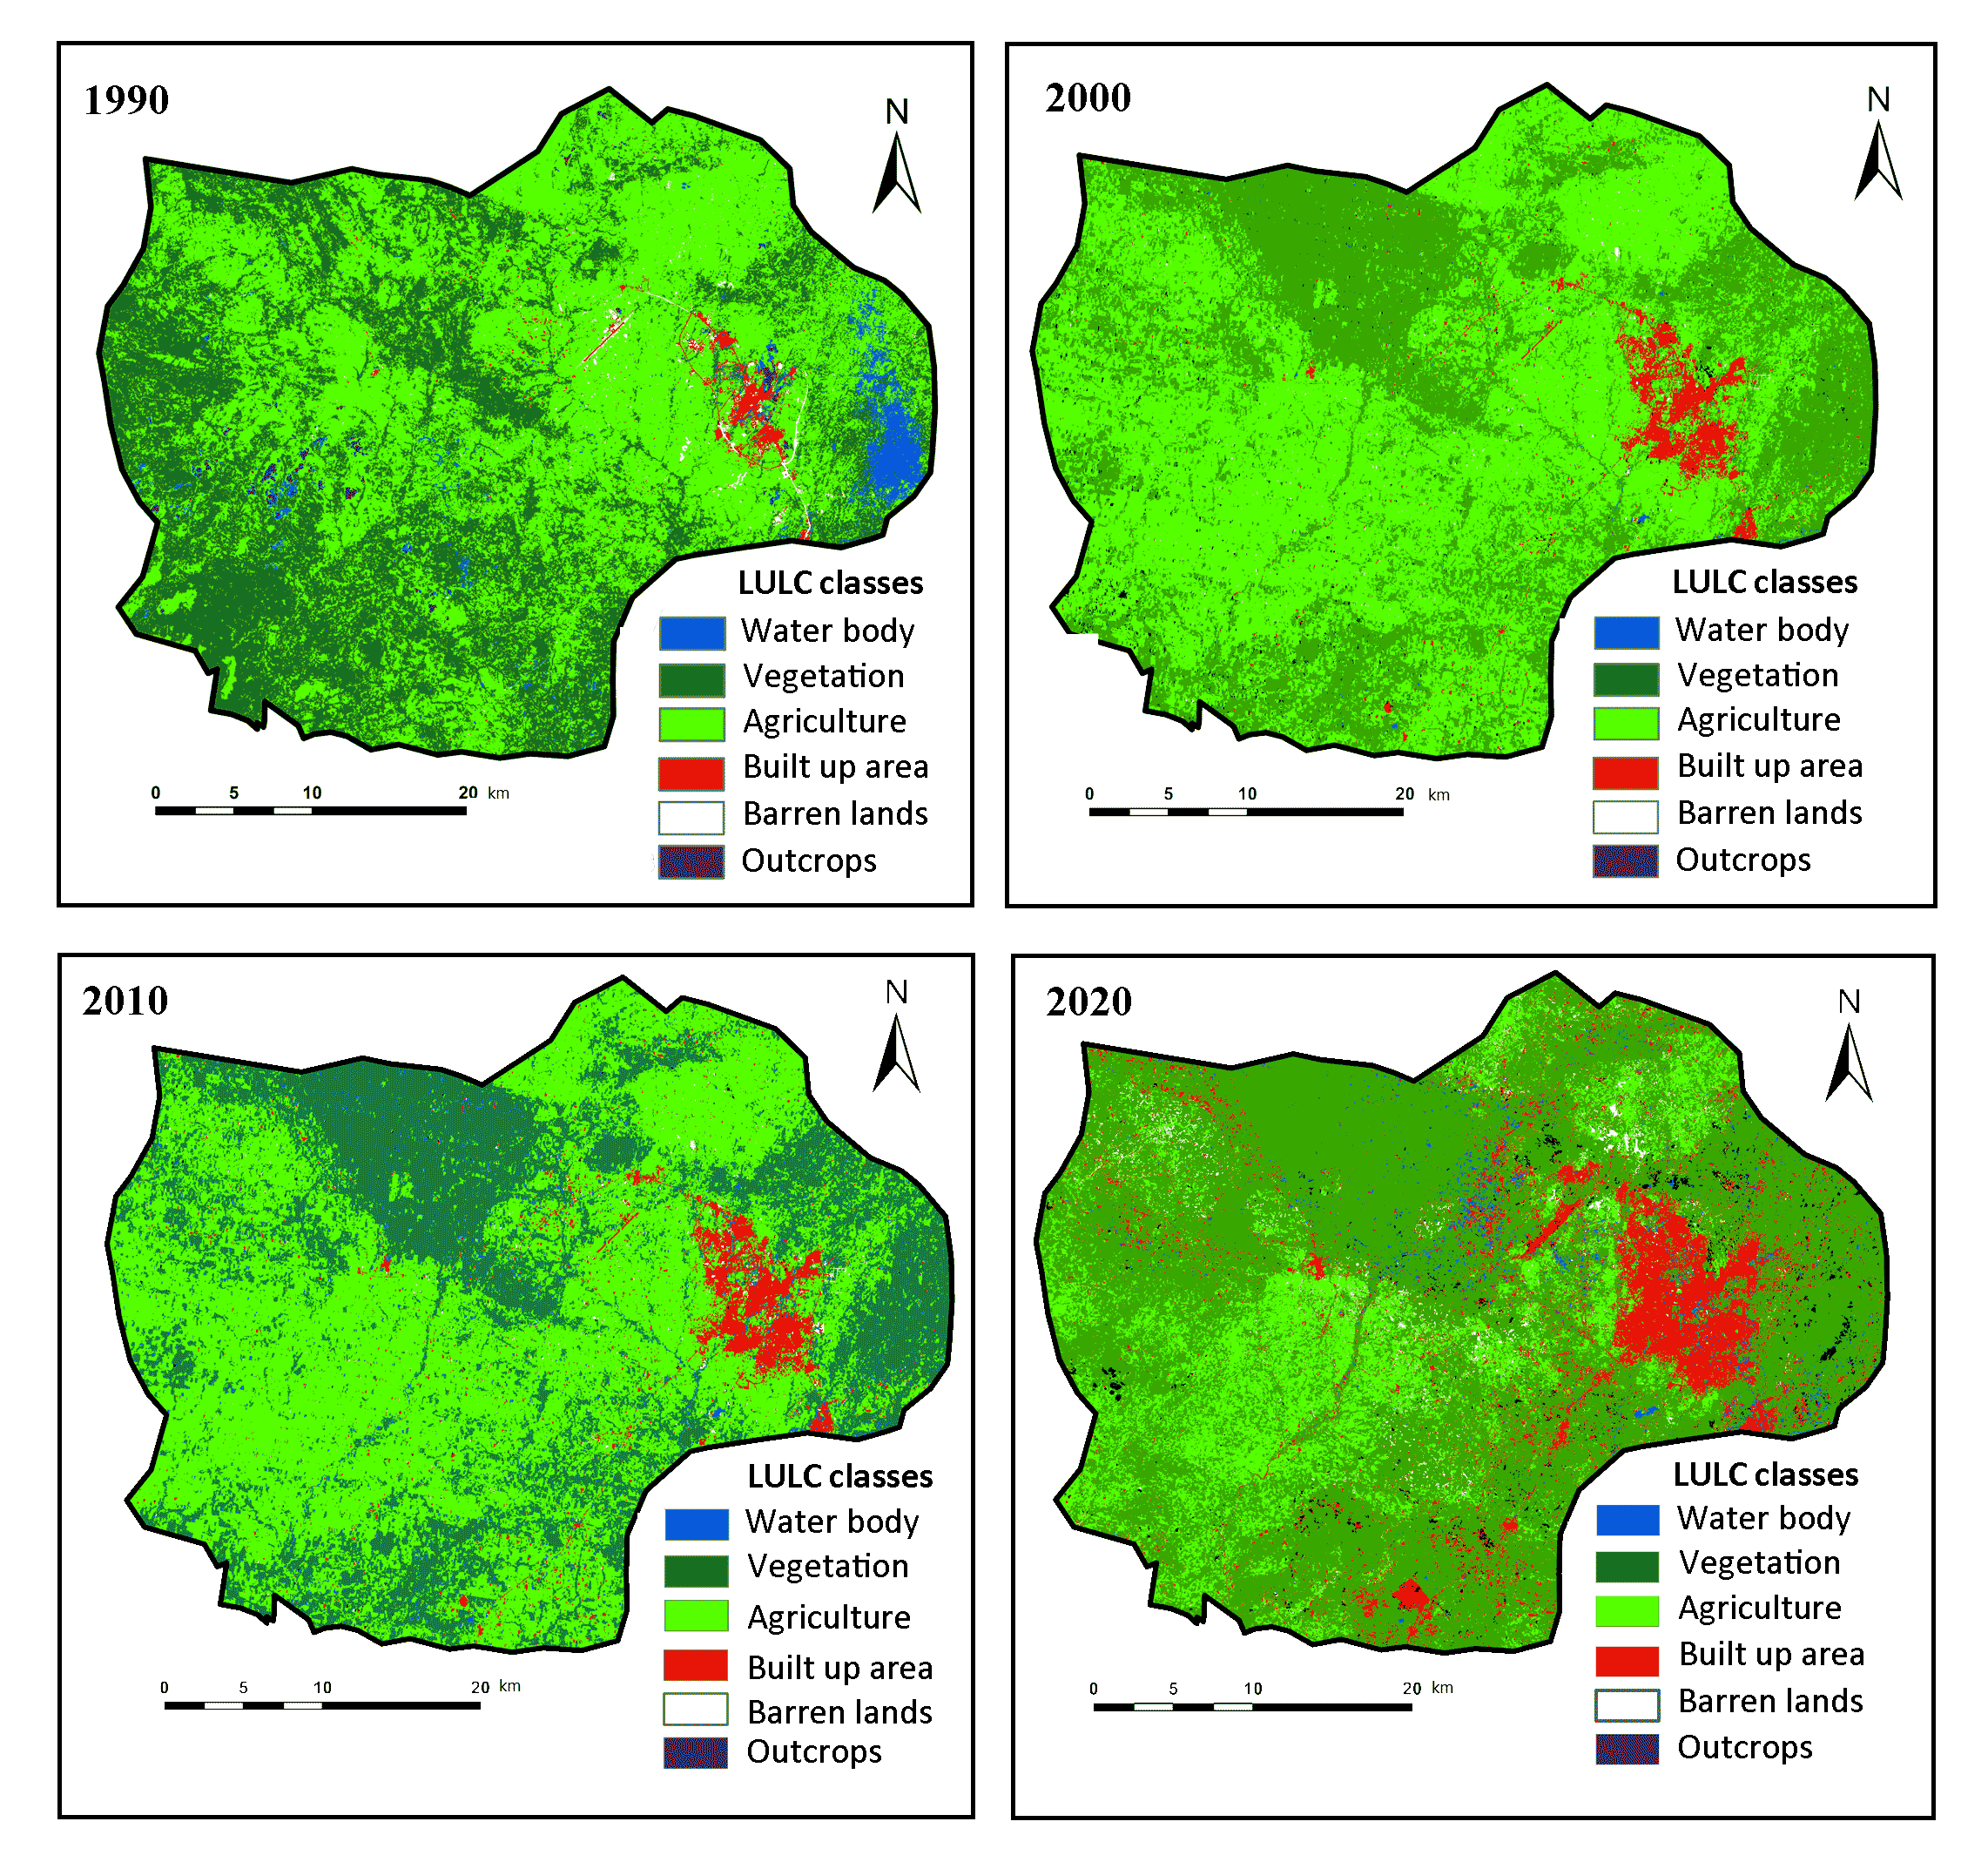
3.2 Spatial patterns of LULC
The Spatial distribution of LULC dynamics in the study area for years 1990, 2000, 2010 and 2020 presented in Figure 4. The result revealed a spatially distributed LULC of six classes across the study area. The six identified classes include agricultural lands, vegetation, water body, outcrops, barren and built up area. Each of these LU types showed a significant variation for the period under review. In 1990 (Figure 4), vegetation and agricultural lands were the most dominant land use types, while the built up area were more in the south west part of Minna. By year 2000, built up area and water bodies encroached in other forms of land use, thereby setting pressure on the available agricultural land. The reconnaissance visit along with the historical data indicates that rapid expansion of developed land took place during the era of Private Public Partnership (PPP) where private sector allowed for building and selling houses to civil servants and other public buyers. Between 2000 and 2010, when PPP projects had resulted in the development of many peri-urban areas, individuals began the development of the urban fringes. This led to encroachment which was more evident within cultivated land areas (Figure 4). In 2010, built up area has experienced rapid expansion in all directions within the study area at the expense of the other LU types. Consequently, agricultural lands declined remarkably, while barren lands became visible in the classified map (Figure 4) due to excavation activities required to feed infrastructural construction activities in the urban centers. In 2020, developed lands, barren lands, water bodies and outcrops have successfully suppressed other forms of land use in the study area.
Investigation into the rapid transformation of other land uses into built up area indicates the significant role of population growth, government policy, private and individual efforts and how they impacts land conversion in the study area. Much of the previously designated agricultural land utilized for agricultural purposes, which serve the urban areas with their produce began to decline as these lands gradually converted into built up area. A typical example of such land conversion is the MI Wushishi housing estate, Talban Housing Estate, Lawu estate and Air force base quarters. In addition, the construction of the Kure new ultra-modern market further encouraged rapid farmland encroachment along the eastern bypass affecting Nekamgpe village. Furthermore, the relocation of Federal University of Technology Minna, from Bosso to Gidan Kwano around 2005 has significantly altered the heterogeneity of the LULC types of Minna. More lands converted from agricultural lands to residential and commercial buildings to provide accommodation to the robust student population. In response to the increase in land demand for residential purposes among other land uses, the land speculation was observed as the major factor responsible for the increase in land prices. The land speculation scenario and growing demand for housing was a major determinant encroachment of agricultural lands in the peri-urban areas, thus posing potential threats to food security and livelihood.
3.3 Accuracy of Classified Maps
LULC accuracy assessment is a critical tool used in the quantitative evaluation of the effectiveness of sample pixels identified on the Landsat, SPOT and Google earth imagery. The accuracy assessment of the classified LULC performed using an error matrix for the period under review as shown in Table 3. The producer and user accuracy remained substantially high within the period under study. The lowest producer accuracy of 70.98% obtained over barren land cover in 1990 alongside the highest accuracy of 100% observed on water bodies. User accuracy on the other hand shows significant correlation with the producer accuracy where the lowest accuracy was over barren land and the highest accuracy observed over built up area. Producers’ accuracy over agricultural land and water bodies was 78.52% and 100% in 1990 and 2000. Producers’ accuracy of classification agricultural area increases significantly from 78.52% to 100% while accuracy of water bodies was 96.21%. The accuracy in the year 2010 and 2020 for agricultural lands was 96.75% and 98.99% while classification accuracy of water bodies was 97.01% and 100%, respectively. In the same vein, the users’ accuracy for built up area and barren land was 100 in the year 2000 and 2020, while agricultural lands recorded 96.75 accuracy in the year 2010. The overall assessment of 1990, 2000, 2010 and 2020 were 73.40%, 78.40%, 85.56% and 90.68%. In addition, the accuracy value of the classified Multispectral Scanner (MSS) imagery revealed relatively lower values due to the coarse nature of land cover. The coarse nature of the land cover resulted in mixed pixels during the selection of training samples. More so, the poor resolution associated with the MSS data resulted in spectral mixing (Dewan and Yamaguchi, 2009a, 2009b). Spectral mixing was responsible for the misclassification of vegetation and agricultural lands. There were also incidences of misclassification of barren lands with outcrops especially in the low-resolution remote sensing data.
3.4 LULC encroachments
The spatiotemporal analysis of LULC changes in the study area (Table 4) revealed a considerable amount of information regarding the direction of LULC encroachments. Over the study area, built up area has increased substantially over the period from 43.68km2 in 1990 and by 2000, it had grown to 104.34 km2, indicating an average increase of 60.66km2 over a period of 10 years. Subsequently, between 2000 to 2010, built up area has doubled in size and have grown to 190.49km2 compared to their size in year 2000. From 2010 to 2020 developed lands gained 86.15km2 and the net increase of the developed area over three decades was 272.16km2. Results from investigations into the urbanization drivers have pointed to demographic changes, physical conditions such as topography, economic growth, change in functions and availability of social, basic amenities and infrastructure. Water bodies on the other hand, have gained slightly from 11.85km2 in 1990, 31.70km2 in 2000, 50.34km2 in 2010 and 21.14km2 by 2020. This less increase rate of water body coverage in the study area is not due to preservation of available water resources, but it is due to the distortion of the drainage paths, which creates some isolated pools of water in a few streams that drain through the study area. In addition, the complete absence of municipal wastewater control has led to the exposure of many wastes water, draining across the surfaces, which sensed and interpreted as water bodies. Other contributions to the appearance of water bodies could be attributed to serious excavation for construction and artisanal mining activities at the fringes of the developed lands, which store water in the mined wells as revealed during reconnaissance. Vegetal cover during the four decades has shown a significant decline. In year 2000, the decline was more than half of its 1990 value (1090.83 km2). In subsequent years, only a fraction of the year 2000 value was lost and thus, by 2020, vegetation cover was only 511.89km2. The relative stability of vegetal cover for the period may not be unconnected with government policy of massive afforestation at the peri-urban area. These policies have involved the acquisition of government-imposed reserves where poaching and bush burning is highly regulated. Outcrops on the other hand constantly been exposed as development is taking place. In 1990, the land area covered by outcrops was 1.50km2, 3.82km2 in 2000, 14km2 in 2010 and by 2020, the study shows a growth of outcrops to 16.76km2. Similarly, agricultural land significantly declined for the period under review. Agricultural land area was 1010.18km2 in 1990, this decreased to 973.7km2 by 2000, 916.64km2 in 2010 and by 2020, it further depreciated to 777.33km2.
Table 4. LULC Changes
|
LULC
|
Area (1990)
|
Area 2000
|
Δ 1990-2000 (km2)
|
2010
|
Δ 2000-2010 (km2)
|
2020
|
Δ 2010-2020 (km2)
|
Δ 1990-2020 (km2)
|
|
km2
|
%
|
km2
|
%
|
km2
|
%
|
km2
|
%
|
|
Agriculture
|
1010
|
46.8
|
973.7
|
45.1
|
-36.47
|
916.63
|
42.5
|
-57.08
|
777.33
|
36.0
|
-139.30
|
-232.85
|
|
Barren lands
|
00.75
|
00.0
|
75.13
|
03.9
|
74.38
|
186.71
|
08.7
|
111.58
|
315.85
|
14.6
|
129.14
|
315.09
|
|
Built-up area
|
43.68
|
02.0
|
104.3
|
04.8
|
60.66
|
190.49
|
08.8
|
86.15
|
315.84
|
14.6
|
125.35
|
272.16
|
|
Outcrop
|
01.52
|
00.1
|
15.81
|
00.7
|
14.29
|
95.99
|
04.5
|
80.18
|
116.76
|
05.4
|
20.77
|
115.24
|
|
Vegetation
|
1091
|
50.5
|
958.1
|
44.4
|
-132.72
|
718.64
|
33.3
|
-239.47
|
611.89
|
28.3
|
-106.75
|
-478.94
|
|
Water bodies
|
11.9
|
00.5
|
31.70
|
01.5
|
19.85
|
50.34
|
02.3
|
18.64
|
21.14
|
01.0
|
-29.20
|
09.29
|
|
Total
|
2158
|
100
|
2158
|
100
|
|
2158
|
100
|
|
2158
|
100
|
|
|
The juxtaposition of post-classification change detection performed in the GIS environment shows a significant decline in agricultural land to an area of 232.85km2 within a span of 30 years (1990-2020). The declining rate of agricultural land indicates high continuity potential due to urbanization values. In addition, majority of the built up area were growing at the expense of agricultural land and other forms of LULC in the study area.
Uncoordinated development noticed especially at the peri-urban fringes of the study area. This pattern of land conversion needs to be further investigated in order to derive useful information required for sustainable decision making. Furthermore, as synonymous to many urbanizations especially among the third world countries, the magnitude of expansion has a direct correlation to the physical setting particularly the topography described to be gentle while sloping upwards in the Northeastern part of the study area.
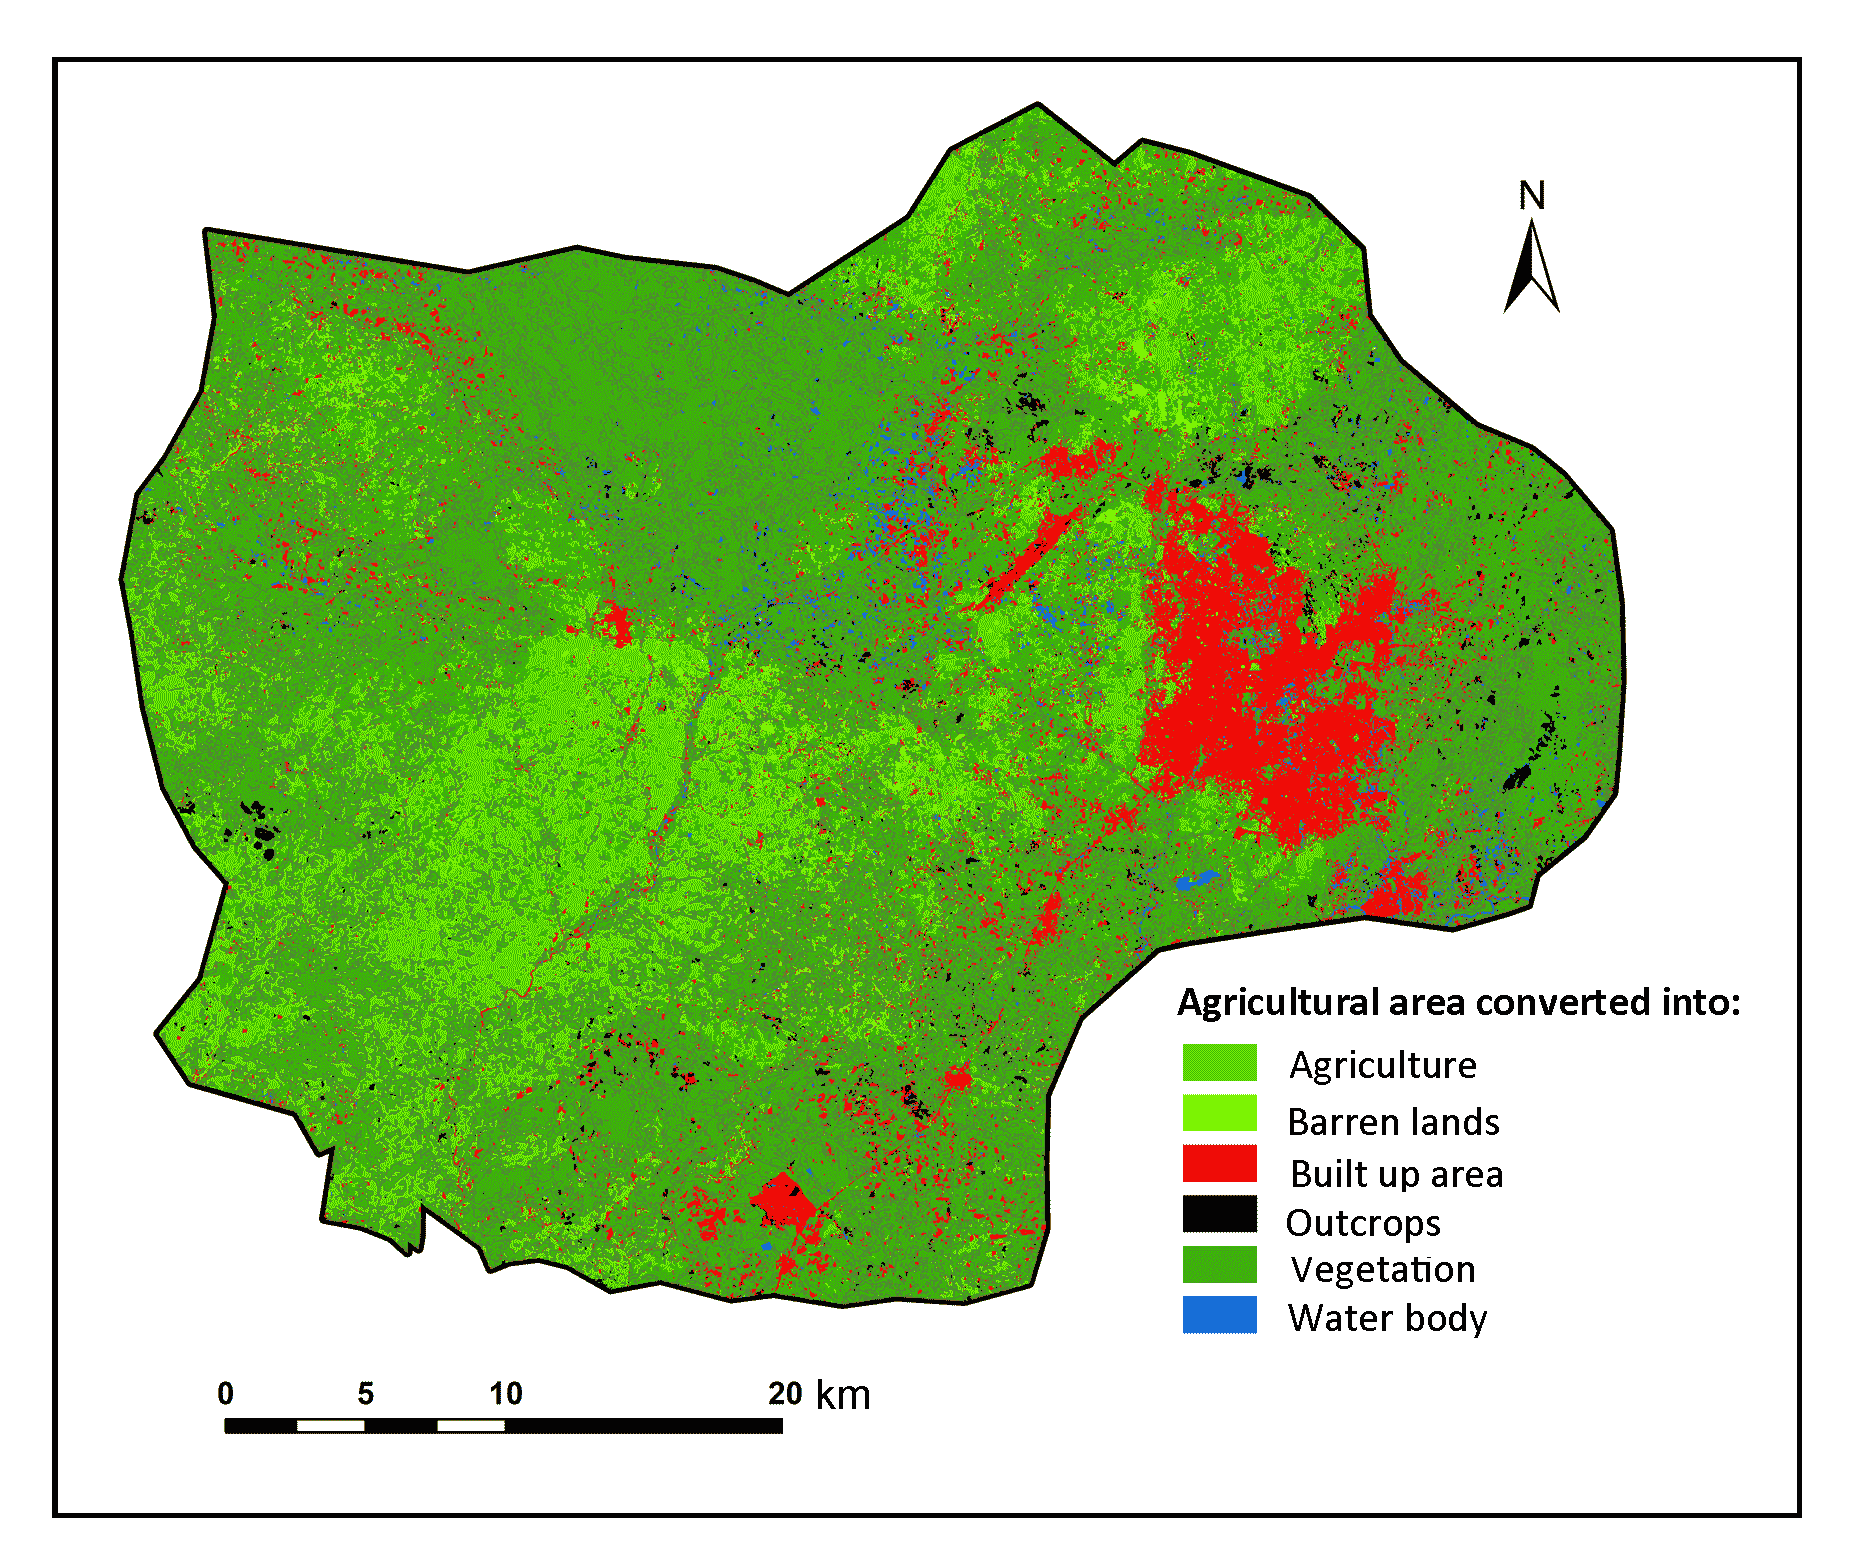
3.5 LULC Conversion (1990-2020)
Geospatial evaluation of LULC conversion map (Figure 5) and the change conversion (Table 5) revealed that 96.11km2 (11.30%) of agricultural land was converted to built up area between 1990 and 2020. Agricultural land on the other hand, revealed 184.34km2 representing 21.50% of the total land mass remained as agricultural land. Generally, three major factors were observed to have promoted loss of agricultural lands: first, increase in the urban economic activities as opined by the view of Dewan and Yamaguchi (2009a) secondly, construction of infrastructural activities at the urban centers which requires labor to work at the construction sites and thirdly the increase in population within the urban centers was linked to rural-urban migration as observed during the 2006 census (Akinyemi and Isiugo-Abanihe, 2014). Between 1999 and 2015, the state experienced urban reclassification and infrastructural development including the building of the new ultramodern market, Niger state Southwest development and the building of the state government housing estate- stirring massive development at the eastern part of Minna and the peri-urban area.
Table 5. Conversion of agricultural lands (1990-2020)
|
LULC classes
|
Area
|
|
Km2
|
%
|
|
Vegetation
|
545.11
|
63.58
|
|
Agriculture
|
184.34
|
21.50
|
|
Water body
|
12.83
|
1.50
|
|
Built up area
|
96.91
|
11.30
|
|
Barren lands
|
12.29
|
1.43
|
|
Outcrops
|
05.90
|
0.69
|
|
Total
|
857.38
|
100.00
|
The LULC conversion classification performed in the GIS environment also revealed that 12.83km2 land area which was originally occupied by agricultural land in year 1990 was converted to water bodies by 2020. This conversion from agricultural land to water bodies represents 1.50% of the total land mass. A large expanse of land area originally occupied by natural vegetation was lost to agricultural lands. A total of 545.11 km2 amounting to 63.58% indicated a high rate of vegetal cover decline over the period. An explicit change observed in agricultural land conversion to outcrop with a value of 5.9km2 representing 0.69% of the total land area. Scanty literature such as Guyer and Lambin (1993), Álvarez-Martínez et al. (2010) and Bashir et al. (2019) indicates that when dissimilar response patterns of classes are not effectively managed during classification, such a situation could lead to ambiguity or misclassification. However, as observed during ground truthing and fieldwork for this research, timing of the day and region at which scenes acquired often modified the spectral response pattern of a feature class. Thus, in a study area characterized by high solar intensity, agricultural land use especially cleared farm lands are likely to present spectral attributes similar to the outcrop especially after rainfall events (Anache et al., 2019).


 ,
Sallau Rachel Osesienemo 2
,
Sallau Rachel Osesienemo 2