The study was focussed on analysis of availability and distribution of public water supply in Aizawl city.
The primary household survey was conducted for data collection.
The water consumption is below the standards set by the Indian Bureau of Standards.
The traditional water sources are considered more reliable in view of quantity.
The scarcity of water has socioeconomic impact on the people of Aizawl.
Abstract
The present study aims to understand the availability and distribution of public water supply in Aizawl city of Mizoram state (India) among 15 out of 83 local councils. About 50 sample households selected from each of the sampled local councils are fifty households, thus data gathered via questionnaire administered to 750 respondents mainly female household heads. Most of the households depend on multiple water sources because their principal source is not fully reliable. A domestic water source for households was determined by the availability of water sources in their respective area and households’ economic. The water consumption in the study area is well below the standards set by the Indian Bureau of Standards.
Keywords
Water Source , Households , Consumption , Aizawl City
1 . INTRODUCTION
Water is an essential element of life (Topfer, 1998). All human history can be written in terms of the human need for water. Early civilizations were flourished in river valley where there was plenty of water to support life. The most famous cities in the modern world are located on a large rivers, harbours, estuaries, lagoons and beaches (Sonuga, 1984). However, about 500 million urban dwellers lack adequate access to water services or water shortages (USAID and PADCO, 2001). According to a World Bank (2001) report, 25% of the urban population in Latin America and 60% of the urban population in Africa are not connected to public services and rely on alternative water sources. Low-income families who build houses in the suburbs away from major highways to provide sufficient clean water will remain a major challenge for the city for decades to come (Howard and Batram, 2005).
The NCU [National Commission on Urbanisation] recommends that a water supply of 90 to 100 L of water per day necessary to maintain sanitary living conditions, and emphasizes that water supply should be available to all citizens (NCU, 1988). The figure adopted by the NCIWRD (1999) are 220 lpcd for class-I cities, 165 lpcd for 2025 and 220 lpcd for 2050 for non-class-I cities. Most of the households in the city of Aizawl consumed domestic water below the specified norms, but they are mostly show satisfied with their consumption level. Therefore, this paper aims to study the availability of domestic water sources and its consumption behavior in Aizawl city.
According to the 1998 NSSO data, approximately 70% of urban and 18.7% of rural households in India have access to tap water as their principal source of drinking water. About 41% had sole access to their principal source and the rest 59% have sharing public tap (NSSO, 1999). Between 69 to 74% of India’s rural population and between 91 to 93% of India’s urban population obtains drinking water from protected sources (WHO and UNICEF, 2001).
According to the Indian Bureau of Standards (IBS, 1972), cities with full drainage systems must provide at least 200 L/day for domestic use. For the low-income group (LIG) and the economically weaker sections (EWS) and small towns, the water supply can be reduced to 135 L/day (BIS, 1993). Ninth Plan (1997-2002) maintained the minimum requirements for water in urban areas equal to 125 L/day in cities with planned sewerage system, 70 L/day in cities without planned sewerage system and 40 L/day in cities that collect water from public taps. However, in the 10th Plan (2002-2007), cities with planned sewerage were divided into two groups according to population such as metropolitan and non-metropolitan cities. The recommended minimum water supply standard is 150 L/day in the first case and 135 L/day in the second (GOI, 1997, 2002).
Once upon a time depending on the copious rains harvested from sloping rooftops and tuikhur (i.e., water seepages accumulated in artificially fabricated reservoirs and springs water collected in artificial tanks) on the hill slope Aizawl City, the capital of Mizoram, is increasingly shifting towards piped water source from deep valleys resulting in colossal operation and maintenance cost (Ramhnehzauva, 2021). Rapid population growth, depletion of water resources and rising consumer demand has been leads to a dire situation. Therefore, the provision of adequate potable domestic water to residents of Aizawl obviously needs careful planning taking into account the City’s peculiar environmental setting, the rapid rate of population growth and haphazard expansion of the built-up-area. Water is clearly the single biggest crisis facing in the study area and the stress is very much revealing. In fact, from being a necessity, water has now become a luxury in the city. With pipes running empty, the city is turning into villages providing water by small services. People use a variety of water sources to meet their daily needs people adjusted their water use pattern with the availability of small quantity of water. The present study aims to investigate the various sources of domestic water supply at the households’ level with overall pattern of water consumption in Aizawl City.
2 . STUDY AREA
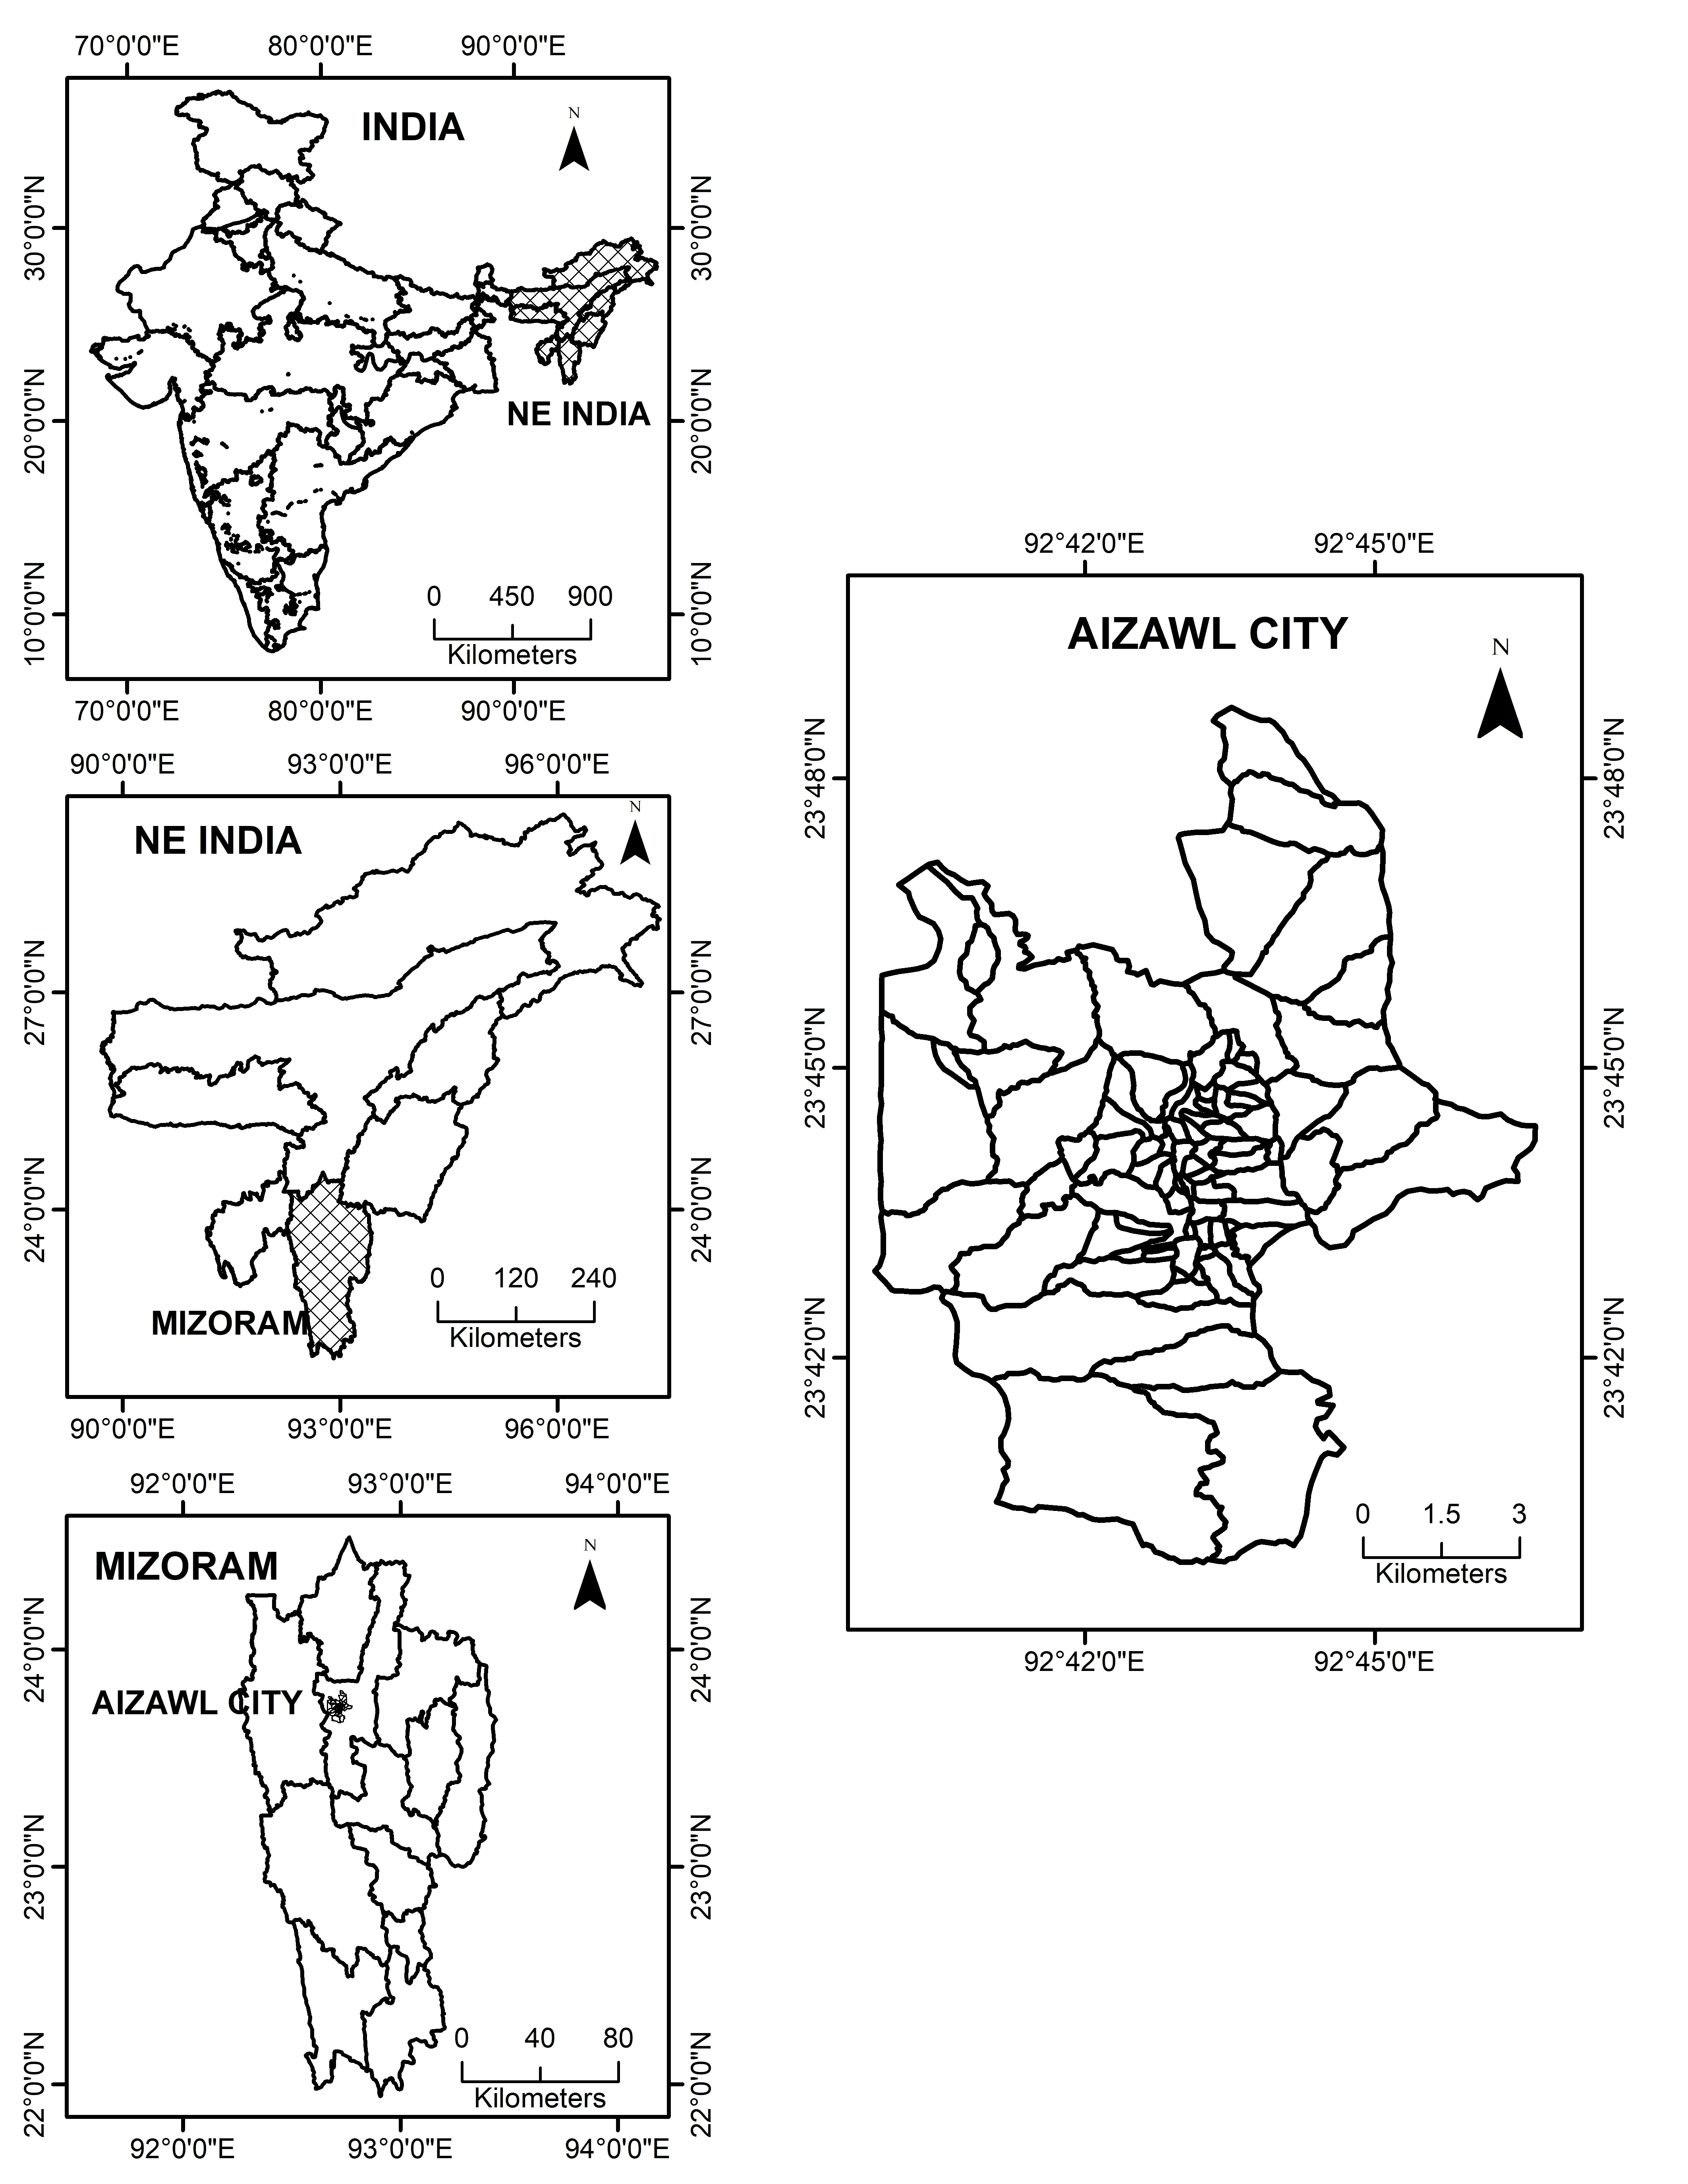
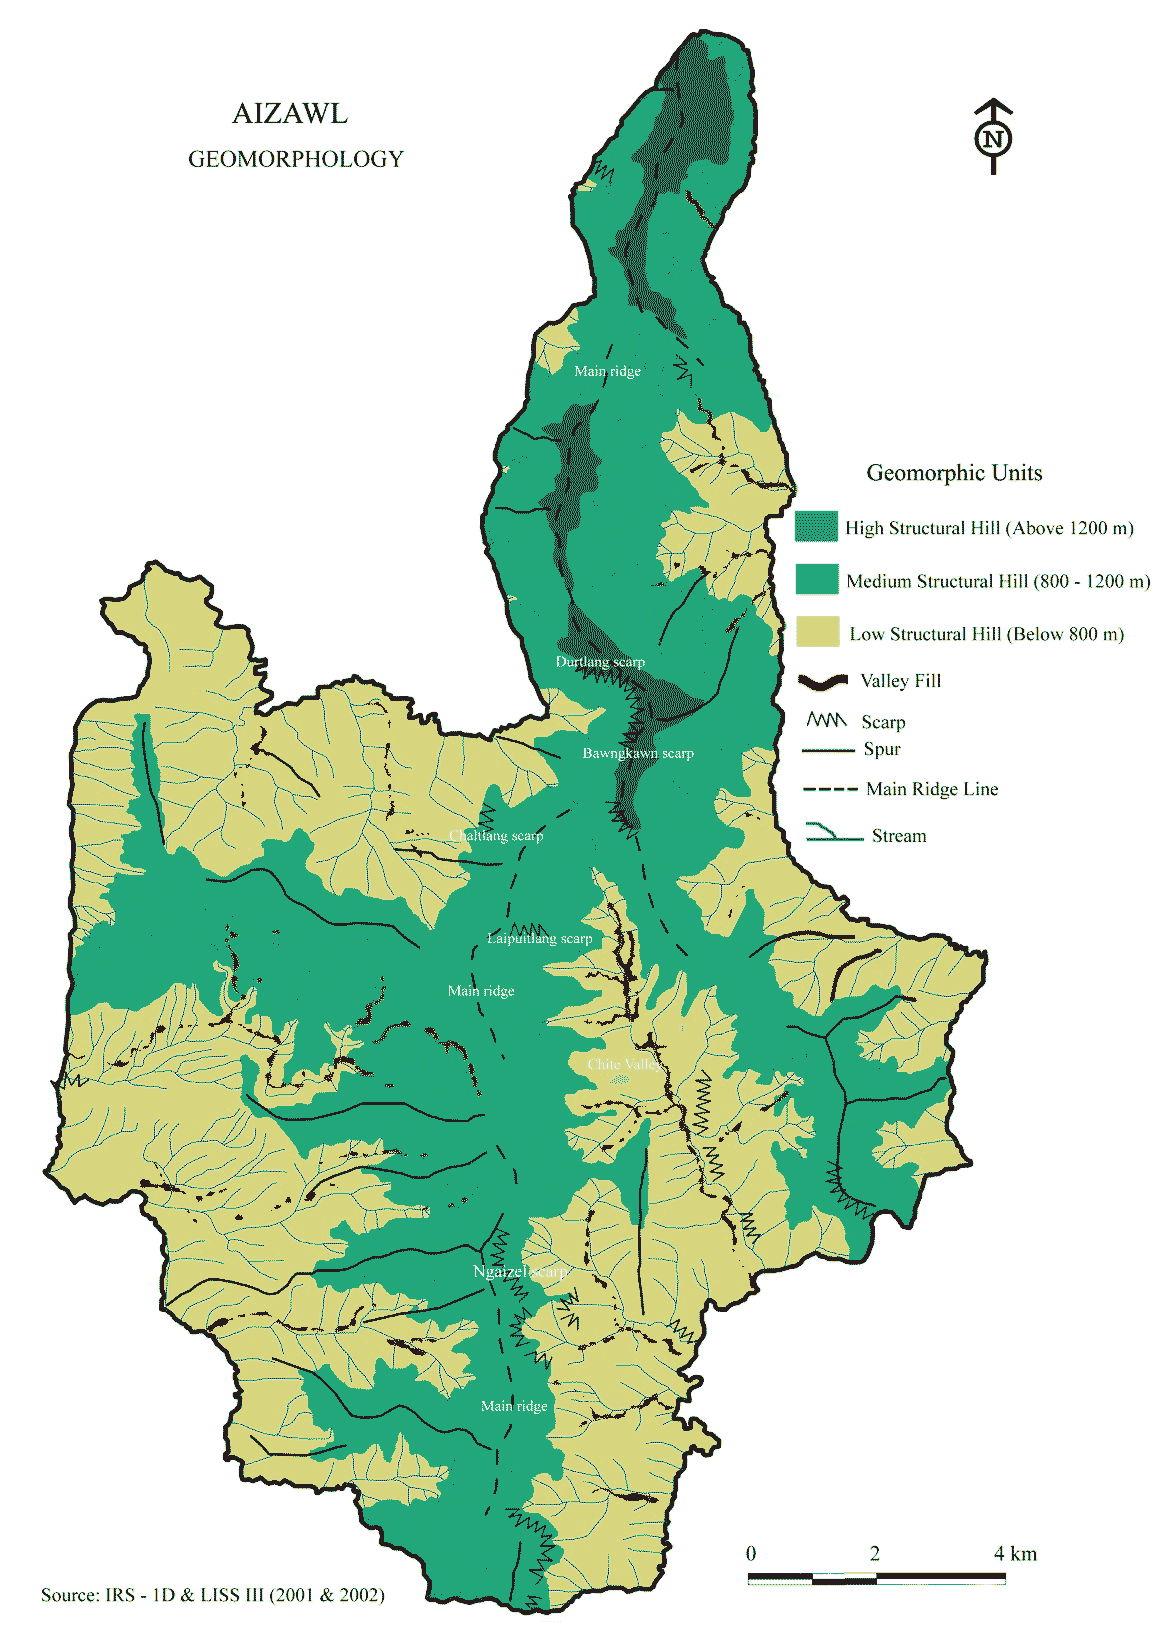
Aizawl, the capital of Mizoram state (Figure 1) situated on the hillcrests, steep slopes and small valleys (Figure 2). The altitude varies from 120 m to 1400m above mean sea level. It is located on north-south ridge that serves as a major hill with numerous small hills and valleys extending east and west direction. The terrain is high and very uneven. The unique physical attributes of this rugged land are marked by extreme fragility and frequent landslides, limited land space, steep slopes and lack of accessibility. The city reveals a rapid and uncontrolled growth pattern with multi-store settlements that has mushroomed unplanned on highly risk prone slopes. It covers an area of about 129km2, and as per Aizawl Municipal Corporation Report 2020, the population is 359829 persons. There are a number of streams in and around the Aizawl City, but none of them is dependable for providing adequate water. Only dependable source is river Tlawng located more than 1000m below the city.
Figure 1. Study area: Aizawl, the capital of Mizoram state (India)
Figure 2. Geomorphology
3 . DATA AND METHODS
This research is based on information collected from primary and secondary sources. The household survey was conducted in 15 (18%) out of 83 local councils in the city. Since the number of households drawn from the sample in each selected local council is 50 households and data were collected from 750 households. The sample households have a total population of 4454 persons, children account for 32.88% of the total population. The mean value of household size is 5.91, with a standard deviation of 0.90. About 69% of the sample households own their homes and 31% live in rented houses.
A stratified randomized design was used to select the local council for the study taking into account population share of individual piped water connection and geographical location. It is believed that it has provided an overview of every corner of the study. The surveyed households were selected at random and were considered sufficient representative of the households. A simple index is calculated to represent the economic status of the households. Self-reported total monthly income is used as the measure of households’ economic status. Hence, households were categorized into three different groups such as, high-income group (HIG), middle income group (MIG) and low-income group (LIG). A total monthly income less than the threshold level of Rs. 20000 are designated as LIG, between Rs. 20000 to Rs. 40000 are designated as MIG and more than Rs. 40000 are considered as HIG. About 40.66% belong to LIG, 38.80% to MIG, and 20.53% to HIG.
Water sources at household level have been classified into principal source of water and supplementary sources of water. Principal source of water means a source of water where the households have collected the larger volume of water and the other water sources referred as supplementary sources. Therefore, efforts have been made to collect data on a structured schedule and collect relevant information from those responsible for the collection and use of water. Responsible here belongs to the person who controls the water, not to the person who carries or collects it. Consequently, the female head of the family or any other female has chosen as respondent.
Estimates of average daily water consumption at household level are based on informants recollection of the number of pots and buckets used. Measure the volume of buckets/containers commonly used to store water and calculate number of buckets used for various activities in a day. These containers are generally but not always of two or three standard sizes. The quantity of water received through individual piped water connection is calculated from the size of the water tank, where they are directly connected to pipeline. Moreover, the information obtained is based not on actual observation but on recollection of the respondents. Average per-capita water consumption is obtained by dividing total amount of water consumption by the number of household inhabitants assuming that two children are equivalent to one adult unit.
Relevant secondary data also collected from various sources. The PHED, Government of Mizoram, is approached for collection of data on the quantum of water distribution through public supply, number of hand pump installed, number of stand post and number of house connection. Population data and number of households were collected from Aizawl Municipal Corporation (AMC), Sanitation Report, 2020.
4 . RESULTS AND DISCUSSION
4.1 Source of Water: Past and Present
Tuikhur has traditionally been an important source of drinking water in Aizawl. However, during the dry season most of the Tuikhur dry up or yield significantly decreases. People used to walk long distance to collect water at this time where the water sources have produced water. In 1900, the British constructed an underground reservoir with a capacity of 19 million gallon at Tuikhuahtlang on the hillside of Aizawl. A sloped galvanized corrugated iron roof is built around the reservoir to collect rainwater. However, the water collected in the reservoir is only distributed to some high-ranking officials, so there is still a shortage of water for the mass of the people. During 1953-54 another reservoir with a capacity of 18 million gallon underground reservoir was built on the northern part of Aizawl at Laipuitlang. That was the only water supply system of Aizawl till 1973. From this time roof-top harvesting of rains became an increasingly popular practice in the city. Water collected from Tuikhur combined with rainwater harvesting is still used as the main water supply system by a large number of people.
Harvesting of rainwater from the abundant rain was sought as the easiest solution to bring water to the residents. Rainfall naturally forms a rich resource as Aizawl enjoys an average annual rainfall of 2500mm and heavy rainfall pelts the city between May and mid-October. Traditionally Tuikhur and rainwater formed the prime drinking water sources for the city. Even today in many parts of the city where piped supply fails to bring in the required quantity, harvest water from their slanting rooftops with the help of gutters made of galvanized sheets is still prevalent. Rainwater storages along with Tuikhur had for long been fulfilling the day-to-day water requirements of the people of Aizawl.
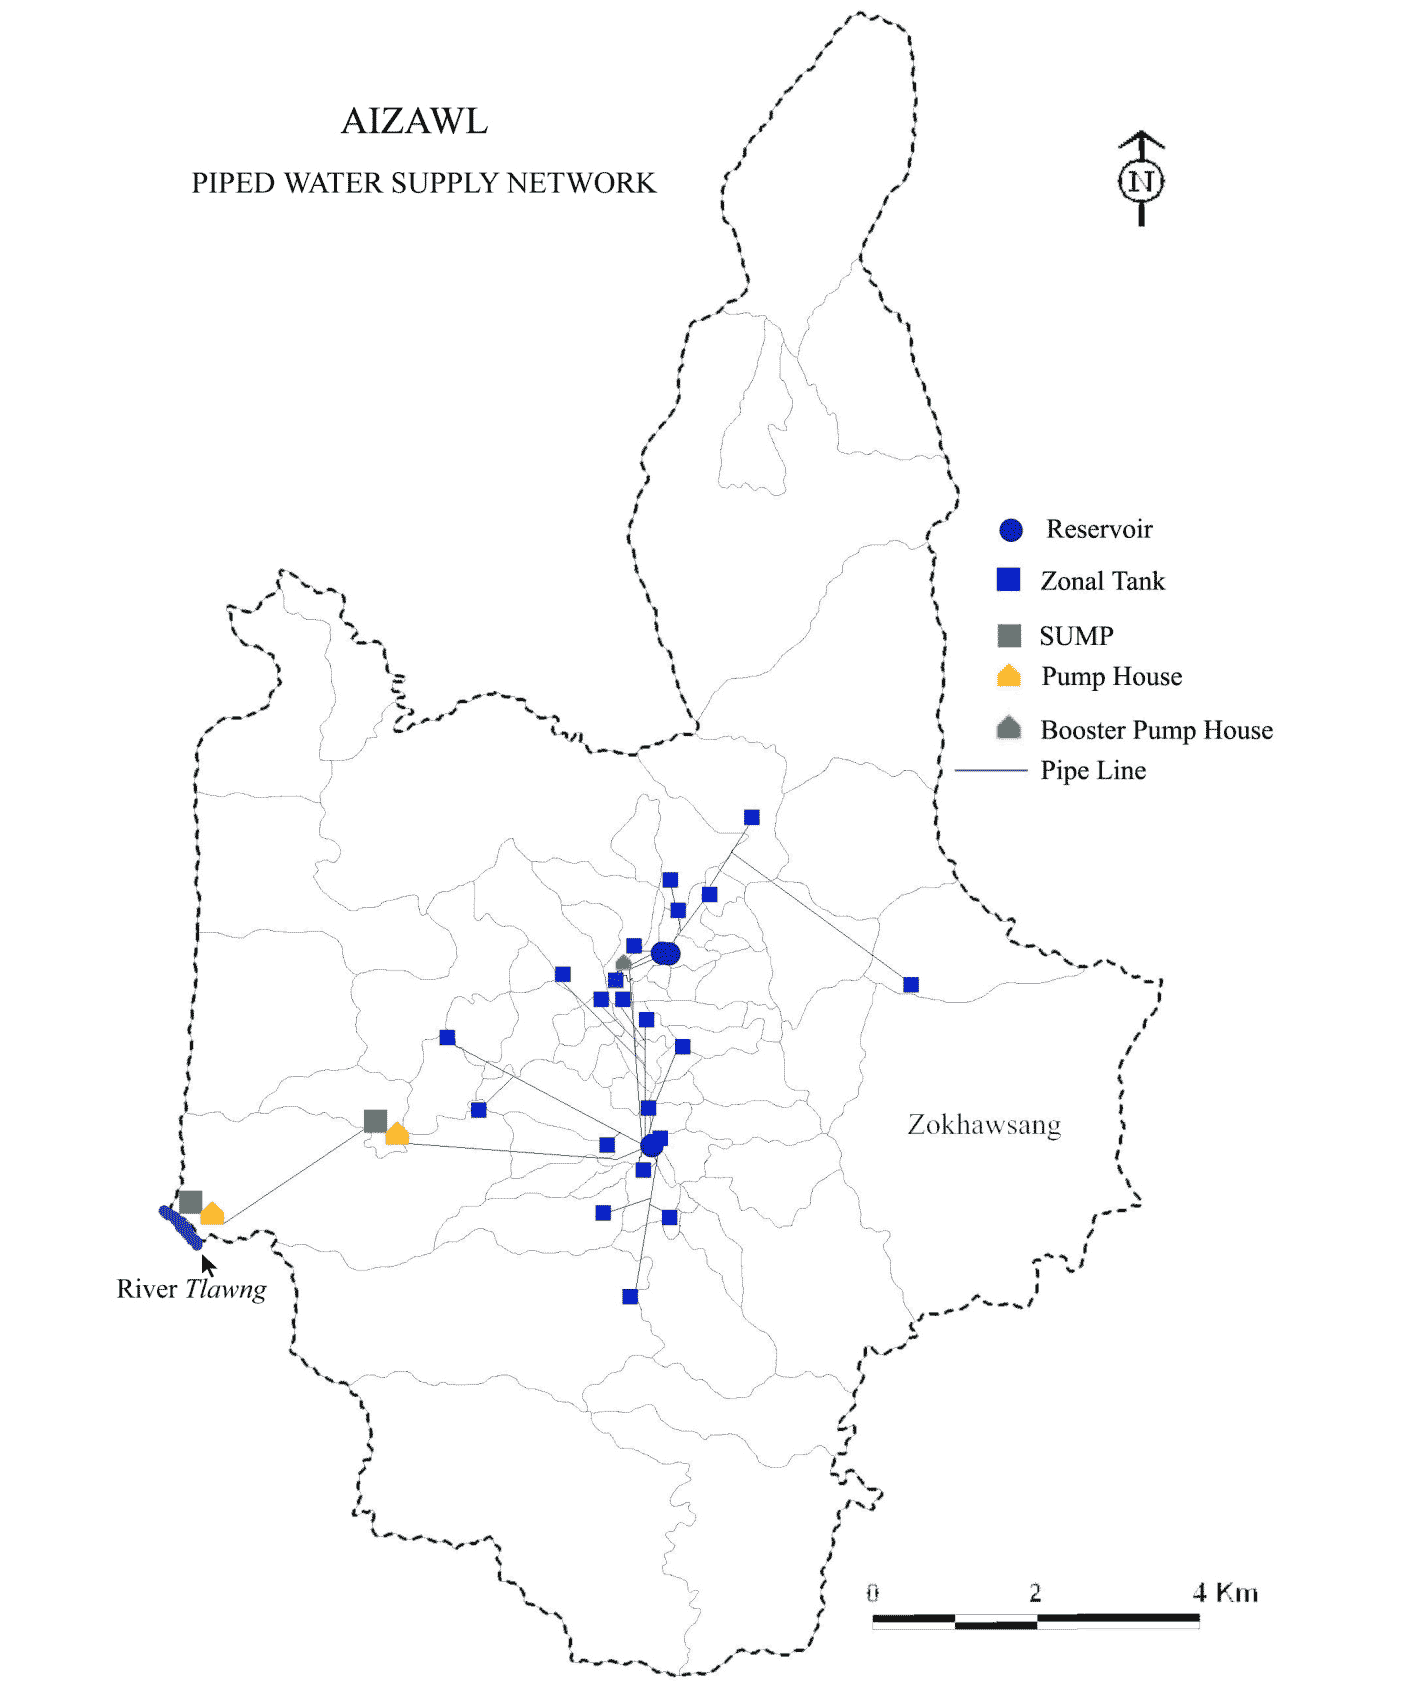
The glorious tradition of catching rain on rooftops and harvesting them in tanks started to die out when demand started outgrowing supply and the hunt for bigger sources began. The first piped water supply scheme for the city commenced in 1964 that aimed to supply 67.5 lpcd from the river Tlawng to a height of 1030m in Tuikhuahtlang reservoir through seven stages of pump-sets, located 18km due west below the city in a deep gorge with a minimum discharge of more than 100 cusecs. The project took nearly 6 years to complete. This piped water system still exists but augmentation of this scheme is taking place to fulfill the ever-increasing demand. The Phase- I of the Greater Aizawl Water Supply Project formulated in 1984 and completed in 1988, again aimed at supplying 10.8 million liters every day of water from the river Tlawng for a population of 80000. To supplement the Phase-I project, government has formulated another program Phase-II of the Greater Aizawl Water Supply Project in 1999, which aimed at supplying water 24.18 MLD [Million Liters Every Day] from river Tlawng for a population of 310000 and completed in 2018 (Figure 3). However, pumping water to a great height led to a prohibitively high operation and maintenance cost and the sustainability of the very project was put to question.
Figure 3. Piped water supply network
4.2 Water Demand
Although the CPHEEO [Central Public Health and Environmental Engineering Organization] norms suggest a water consumption level of 135 lpcd, the precipitous slopes and the multi-store buildings of the city fix the realizable water consumption level at 100 lpcd. Daily water demands are simply obtained by multiplying supply norms by the number of population. As per the present population of 359829 (Aizawl Municipal Corporation, 2020) and the consumption level of 100 lpcd, the water demand in the city works out as 35.98 MLD. The Public Health and Engineering Department (PHED) is responsible for supplying water to the city population.
4.3 Water Supply
Once hailed as an ideal model for urban rainwater harvesting practices, the city has not only spoiled its traditional practice but has attained the status of having the most impractical and exorbitantly expensive piped water service in the nation. Water supply system has been developed with total disregard to the ecology and geomorphology of the region.
The PHED makes available 22.99 MLD (PHED, 2021) against the demand of 35.98 MLD of water to the city residents. Comparing the estimated demand with the present installed capacity of 22.99 MLD then allows planners to conclude that there is a demand-supply gap of 12.99 MLD. There exist 62778 households piped connections (PHED, 2021) out of 78857 total households (AMC, 2020), this means that 79.66% of households have a piped connection. The percentage of households with piped connection is simply calculated by dividing the total number of households from the number of piped connection record. From the household survey, it is evident that most of the high income group households have more than one or two house connection. Besides there were 433 public stand post, 199 community hand-pump but only 121 hand-pump is working and 192 Tuikhur are also found in the city.
4.4 Water Sources at Household Level
Though, water is not strictly a public good, in most countries it has been a convention that water supply and provision is under the governments’ realm. In the study area too, this is the case. However, the public agency fails to satisfy the water demand of the residents. This situation creates water scarcity and forces residents to look for alternate sources or alternate arrangements to access water. Therefore, to meet their daily requirements people use different water sources.
Natural water sources are available on both the eastern and the western slopes of the study area. However, due to increasing population, natural sources of water became progressively inadequate to fulfill the daily water requirements of the people. In addition, most of the natural water sources are becoming seasonal or the yield reduced considerably due to the neglect of the recharge area. Thus, most of the families are subjected to heavy rationing of water for domestic purpose, especially during the dry winter season. This is a stress period where people have to queue up long hours to fetch water from limited water sources. Roughly, 50.66% of the households have access to public water supply; 21.46% have access to public taps; 75.06% collect the rainwater; 53.60% use tuikhur; 20.13% use hand pumps; 42.40% purchase water from the tankers, and 0.66% use dug wells (Table1). The fact that the number of water sources is nearly triple to the number of households shows that people depend on multiple sources for their water supply. This indicates that only a particular source is unable to cater the domestic water needs throughout the year (Ramhnehzauva, 2021).
Table 1. Access to water
Water Sources
Households (%)
Public water supply
50.66
Public tap
21.46
Rainwater
75.06
Tuikhur
53.6
Hand pump
20.13
Water tanker
42.4
Dug well
0.66
5 . PRINCIPAL SOURCE OF DOMESTIC WATER SUPPLY
Principal source of water refers to the water source that the households have been obtaining the largest amount of water. Even though there is widespread use of wide variety of water sources, people use only three water sources as their principal source of water, such as connection to public water supply, tuikhur and rainwater harvesting. About 50.66% of the households use house connection as their principal source of water supply (Table 2). Tuikhurs are by far the most prevalent alternative to house connection as they are used by 45.87% of the households as their principal source of water. Moreover, though the number of households collecting rainwater is high (75.06%), only 3.47% of the households use it as their principal source of water supply. The users of rainwater harvesting as principal source of water supply have been noticed from four Local Councils, all of them lie on the periphery of the study area (Ramhnehzauva, 2021).
Table 2. Water sources
Sources
Households (%)
Public water suply
50.66
Tuikhur
45.87
Rainwater
3.47
From the point of hydrological opportunities, roof top water harvesting appears to be one of the most convenient strategies for mitigating the growing domestic water crisis in the study area. At the same time, in hilly terrain that suffers from lack of natural storage of water, roof water harvesting systems can be economically viable proposition for supplementing conventional water supply systems.
Along with hydrological opportunities, what is also equally important is the physical feasibility of installing roof water harvesting for making it as the principal source of domestic water supply. The issue of scalability is directly linked to this. Roof top rainwater harvesting requires large under-ground or ground storage tanks. Nevertheless, housing stocks in the study area are not going to provide this kind of land area required for constructing such large tanks, which is necessary for storing the water for the lean season. It appears that the system will be unviable in the core area with high concentration of population and houses meanwhile it might be viable in the outer areas with scattered population and houses.
6 . DOMESTIC WATER CONSUMPTION
Water consumption in the study area is determined by supply, not demand. People try to adapt the amount of water that they obtained. In the 54th round NSSO [National Sample Survey Organization] data shows that 80% of the urban households in India have an adequate water supply while this research shows that only about 62.93% of households have an adequate or satisfactory water supply (Table 3). Surprisingly, even households receiving poor supply also considered their present water supply enough to satisfy their needs. In fact, this shows nothing but adjustment of people to the supply, this leads to hygiene and sanitation problems, with many health consequences.
Table 3. Satisfaction of households
Satisfactions
Households (%)
Satisfied
62.93
Not Satisfied
37.07
6.1 Per-capita Domestic Water Consumption
Table 4 shows per-household as well as per-capita consumption of water in the study area. The consumption (indication of availability) of water per-capita in the study area is much lower than what the Bureau of Indian Standards (1993) recommends, and the Tenth Five Year Plan recommendation. Moreover, it is even lower than Bureau of Indian Standard (1993) recommended level for Lower Income Group (LIG) colonies and weaker section households. The data is also an indication for the lower public hygiene and sanitation conditions in the study area. The per-capita daily domestic water consumption ranges from 33 lpcd to 70 lpcd. Therefore, the average per-capita domestic water consumption in the study area is estimated at 46 lpcd (STD: 8.77).
Table 4. Water consumption
Household (l/day)
Person (l/day)
Mean
STD
Mean
STD
236.5
69.50
46
8.77
The dispersion statistics (standard deviation) shows that wide variations in per-capita consumption of water exist in the study area. The overall average per-capita water consumption is lesser than the WHO (2003) prescribed for basic hygiene, which is 50 lpcd. Overall, in terms of per-capita consumption of water, the condition in the outer areas seems to be worst. In terms of international and national comparison, the study area has far less consumption of water.
Table 5 presents category-wise distribution of per-capita domestic water consumption. About 38.93% of the households consume water below 40 lpcd, 19.89% consume between 40 lpcd to 50 lpcd, and 41.20% consume water above 50 lpcd. There also exist wide variations in proportion of households consuming water above 50 lpcd in different local councils. Generally, the per-capita water consumption is high in the core areas, while it is least in the periphery of the study area. In fact, in the outer areas majority of the households consume water below 45 lpcd. Insufficient water supply in the study area is the rule not the exception. Even using 50 L of water per-person per-day as a criterion for assessing water scarcity and the adequacy of the household, 58.80% of the households remain water deficient.
Table 5. Category-wise water consumption
Water consumption (l)
Below 40
40-50
Above 50
Households (%)
38.93
19.86
41.2
6.2 Source-wise Water Consumption
Actual per-capita water consumption varies with the mode of water source in the study area. Table 6 reveals variation of per-capita water consumption according to principal source of water. The water consumption of households with house connections varies from 45 lpcd to 70 lpcd and their average water consumption is estimated at 53.85 lpcd (STD: 4.01). The water consumption of households using rainwater as principal source ranges from 40 lpcd to 50 lpcd, and their average consumption is calculated to 46.06 lpcd (STD: 2.72). The water consumption of the users of tuikhur as principal source varies from 33 lpcd to 48.75 lpcd and their average consumption is about 37.33 lpcd (STD: 2.52). The dispersion statistics shows that wide variations exist among the users of house connections. Comparing with the WHO and Gleick minimum norms of water consumption for basic hygiene (50 lpcd), only households getting water through connections to public water supply to meet required water.
Table 6. Source-wise water consumption
Source of water
Households
Consumption (l/household)
Consumption (l/person)
Mean
STD
Mean
STDT
Tuikhur
344
169
26.07
37
2.52
Rainwater
26
236
10.86
46
2.72
Public water supply
380
298
30.14
54
4.01
Moreover, comparison has been made again on water consumption between households with and without house connections. The average water consumption of households with house connections is estimated at 53.85 lpcd (STD: 4.01), whereas the water consumption of households without house connections is estimated at 37.94 lpcd (STD: 3.37) (Table 7). The difference between piped and un-piped water consumption at household level is about 15.91 lpcd. Hence, the average per-capita consumption of water is relatively high when it is pipe into the home, but decreases when water is supplied to un-piped. The finding is consistent with a study carried out at different sites in Uganda by Tumwine (2002). He found significant differences in average per-capita water consumption between households with and without household connections. The results of the study by Thomson et al. (2001) households with pipes connection consume on average almost three times more water per-capita than households without pipes connection.
Table 7. Water consumption with and without public water supply
Public water supply
Consumption (l/household)
Consumption (l/person)
Mean
STD
Mean
STD
Without
173.27
30.62
37.94
3.37
With
298.18
30.14
53.85
4.01
6.3 Income Group-wise Water Consumption
A much clearer pattern emerges when the levels of per-capita water consumption are classified by households’ monthly income (Table 8). Water consumption at household level clearly increases with increasing income. Low income families do use less water than middle and high income groups, but the difference is nowhere near as large as the literature and conventional wisdom would suggest. The average water consumption among the Low Income Group (LIG) is about 36.75 lpcd, while consumption level increases progressively to 51.01 lpcd in Middle Income Group (MIG). The difference between LIG and MIG water consumption is 14.26 lpcd. This is largely a reflection of the fact that MIG consume more for washing, bathing and toilets. In addition, the average water consumption among the High Income Group (HIG) is about 54.87 lpcd. The difference of LIG and HIG water consumption is 18.20 lpcd. The degree of variation of water use between LIG and MIG is higher than the variation between MIG and HIG.
Table 8. Income group-wise water consumption
Income categories
Households
Consumption (l/household)
Consumption (l/person)
Mean
STD
Mean
STD
Low income group
305
163.18
22.1
36.75
1.74
Middle income group
291
281.65
39.81
51.01
5.1
High income group
154
296.68
37.66
54.87
4.97
Therefore, HIG and MIG use about 1.5 times and 1.4 times, respectively more water than low income group water consumption. The dispersion statistics show that a significant variation of per-capita water consumption exist among the MIG and HIG, it is likely the result of uneven distribution of piped water supply in the study area. Asante (2003) found a statistically significant relationship between income and access to clean drinking water. The results of this study are also consistent with the data from Iskandarani (2002), who reported that household income is an important indicator of water demand and per-capita consumption.
Table 9 further highlights category-wise distribution of different income groups per-capita water consumption. Among the LIG, 12.8% consume water below 35 lpcd, and the rest 87.20% consume between 35 lpcd to 45 lpcd. Interestingly, no families of MIG and HIG use water below 35 lpcd. Only 17.20% of the households in MIG and 3.25% in HIG use water between 35 lpcd to 45 lpcd. Subsequently, 75.94% of households in MIG and 70.77% in HIG consume water between 45 lpcd to 55 lpcd, 6.86% of MIG and 25.98% of HIG use water between 55 lpcd to 65 lpcd, and 0.34% of the households in MIG and 7.8% in HIG use water above 65 lpcd.
Table 9. Category-wise water consumption
7 . FURTHER SCOPE
The present study, though complete in itself throw some light on the following issues for further study to have a comprehensive understanding of the water availability in different sources, amount of water collection at each household level, assessment of the gap between demand-supply, investigation of groundwater potential, and to improve surface and groundwater quality. Undoubtedly, water managers will be able to solve it because the total annual rainfall is surplus than the demand of water. If the rainwater were harvested properly in Aizawl, it would solve the increasing water problem of scarcity. If sincere efforts are made by the water managers and users in this regard, then future does not appear bleak to make available the right quantity of water in right quality at right time to the residents of Aizawl.
8 . CONCLUSION
Aizawl residents use both traditional and modern water sources to meet their household water needs. Half of the six types of water sources identified are traditional such as Tuikhur, rainwater harvesting and dug wells, and the other half is modern source of water: piped water supply, hand pump and water tanker. Of course, the commercial water tankers collect water from the natural sources only to supply water to the residents of Aizawl. In comparison to modern sources, the traditional ones are considered more reliable in view of quantity. The Greater Aizawl Water Supply Scheme (Phase I and II) is ridden with a number of problem and shortcoming. It is unable to cater the need of the daily water requirements of all the residents, all the area of the city and throughout the year. It means that it failed to supply water at desired level to all people, to all the areas and at all the time of the year. Highly intermittent supply is the rule in the study area, as water supply is available only once in a week for about an hour or so. In the event of inadequate piped water supply through either connection to public water supply or public tap, the residents of Aizawl city face acute shortage of domestic water that compelled them to meet their domestic water needs from either the traditional sources or water tankers, at the cost of time and money.
Due to the limitation of piped water supply, the residents of Aizawl are faced with the problem of water supply. Most of the residents received huge rations of domestic water supply. The scarcity of water has socioeconomic impact on the people of Aizawl. Although the people have adapted their water use behaviour to the availability of little water, most households use water below established standards, but most are satisfied with the water supply available. It can be said that water supply in Aizawl city will become a big problem in the near future. Rapid population growth, depletion of water resources and growing consumer demand will aggravate the problem. Therefore, the provision of adequate potable domestic water to residents of Aizawl obviously needs careful planning taking into account the city’s peculiar environmental setting, the rapid rate of population growth and haphazard expansion of the built-up-area, as well as the need to install facilities that will not only meet the present needs but the future needs of the city dwellers as well.
Tables
Figures
Conflict of Interest
The author declares that there is no conflict of interest.
Abbreviations
CPHEEO: Central Public Health and Environmental Engineering Organization; MLD: Million Liters per Day; NCU: National Commission on Urbanization; NSSO: National Sample Survey Organization; PHED: Public Health Engineering Department.
References
1.
AMC [Aizawl Municipal Corporation], 2020. Sanitation Report, 2020.
2.
Asante, F. A., 2003. Economic analysis of decentralization in rural Ghana. Development Economics and Policy, 32. Peter Lang, Frankfurtam Main.
3.
BIS [Bureau of Indian Standards] 1993. IS 1172-1993, Code of Basic Requirements for Water Supply, Drainage and Sanitation. Publication of Bureau of Indian Standards, New Delhi.
NCIWRDP [National Commission for Integrated Water Resources Development Plan], 1999. Report of the Working Group on Perspective of Water Requirements. Government of India, Ministry of Water Resources, New Delhi.
11.
NCU [National Commission on Urbanisation], 1988. Report of the National Commission on Urbanisation. II, Government of India, New Delhi, 293-301.
12.
NSSO [National Sample Survey Organisation], 1999. Drinking Water, Sanitation and Hygiene in India. National Sample Survey Organisation, 54th Round, Report No. 449. Government of India, New Delhi.
13.
PHED [Public Health Engineering Department], 2021. Present Physical and Financial Status of Greater Aizawl Water Supply Phase-I. Unpublished Report, Public Health Engineering Department, Monitoring Cell, Government of Mizoram, Aizawl.
14.
Ramhnehzauva, C, 2021. Domestic water sources at the households’ level in Aizawl City, Mizoram. International Journal of Creative Research Thought. 9(3),3713-3718.
15.
Sonuga, J. O., 1984. Keynote address. Proceedings of the International Seminar on Water Resources Management Practices, July 28-Aug. 4, Federal Ministry of Water Resources, Abuja, Nigeria, 5-7.
16.
Thompson, J., Porras, I. T., Tumwine, J. K., Mujwahuzi, M.R., Katui- Katua, M., Johnstone, N. and Wood, L., 2001. 30 Years of Change in Domestic Water Use and Environmental Health in East Africa. International Institute for Environment and Development. Russell Press, Nottingham.
Tumwine, J. K., 2002. Drawers of Water II: 30 Years of Change in Domestic Water Use and Environmental Health in East Africa, Uganda Country Study. International Institute for Environment and Development, London, 121-124.
WHO [World Health Organisation], 2001. Access to Improved Drinking Water Sources, India. Joint Monitoring Programme for Water Supply and Sanitation, Coverage Estimates 1980-2000, September 2001.
21.
WHO [World Health Organisation], 2003. The Right to Water. WHO, Geneva.
22.
World Bank, 2001. World Development Report 2000/2001: Attacking Poverty. Oxford University Press, New York, 321.
23.
World Bank, 2004. World Development Report 2004: Making Services Work for Poor People. Oxford University Press, New York, 268.