1 . INTRODUCTION
Ethiopia is referred as the “African Water Tower” because of its terrain and weather (Teshome and Halefom, 2020). The country receives a considerable quantity of rainwater resource, approximately 980 BMC [Billion Meter Cube] annually (Hussien et al., 2019). Agriculture is the backbone of economy with huge capacity of spreading irrigated agriculture in Ethiopia. However, irrigation infrastructures are still insufficient and contributing modestly to the expansion of agricultural sector. The country is primarily dependent on agriculture supported by rainfall alone (Shitu and Berhanu, 2020), which is extremely sensitive to rainfall variability and unpredictability, although few initiatives and legacies are being launched by the Ethiopian governments. The majority of Ethiopia’s population resides in the highlands, where 85% of the population is rural and depends on rain-fed agriculture (World Bank, 2006) with minimal inputs and output with little irrigation (Dawit et al., 2020). Agriculture is the main engine of Ethiopia’s growth in addition to directly sustaining the livelihoods of the society. Drought susceptibility is an increasing issue as a result of severe climate change, rapid growth in population, shrinking land holding size, rising landlessness, land degradation, subsistence farming and rain-fed agriculture (Aybehon and Tiku, 2022). There are frequent crop failures due to dry spells and droughts led to food insecurity frequently turns into famine (Gonfa et al., 2021). This has a particular impact on the rural poor of Ethiopia and their means of subsistence. Despite having an abundance of water resources, the country has historically experienced terrible droughts (Girma et al., 2020). As a result, the people of this great civilized country lived in poverty for many years.
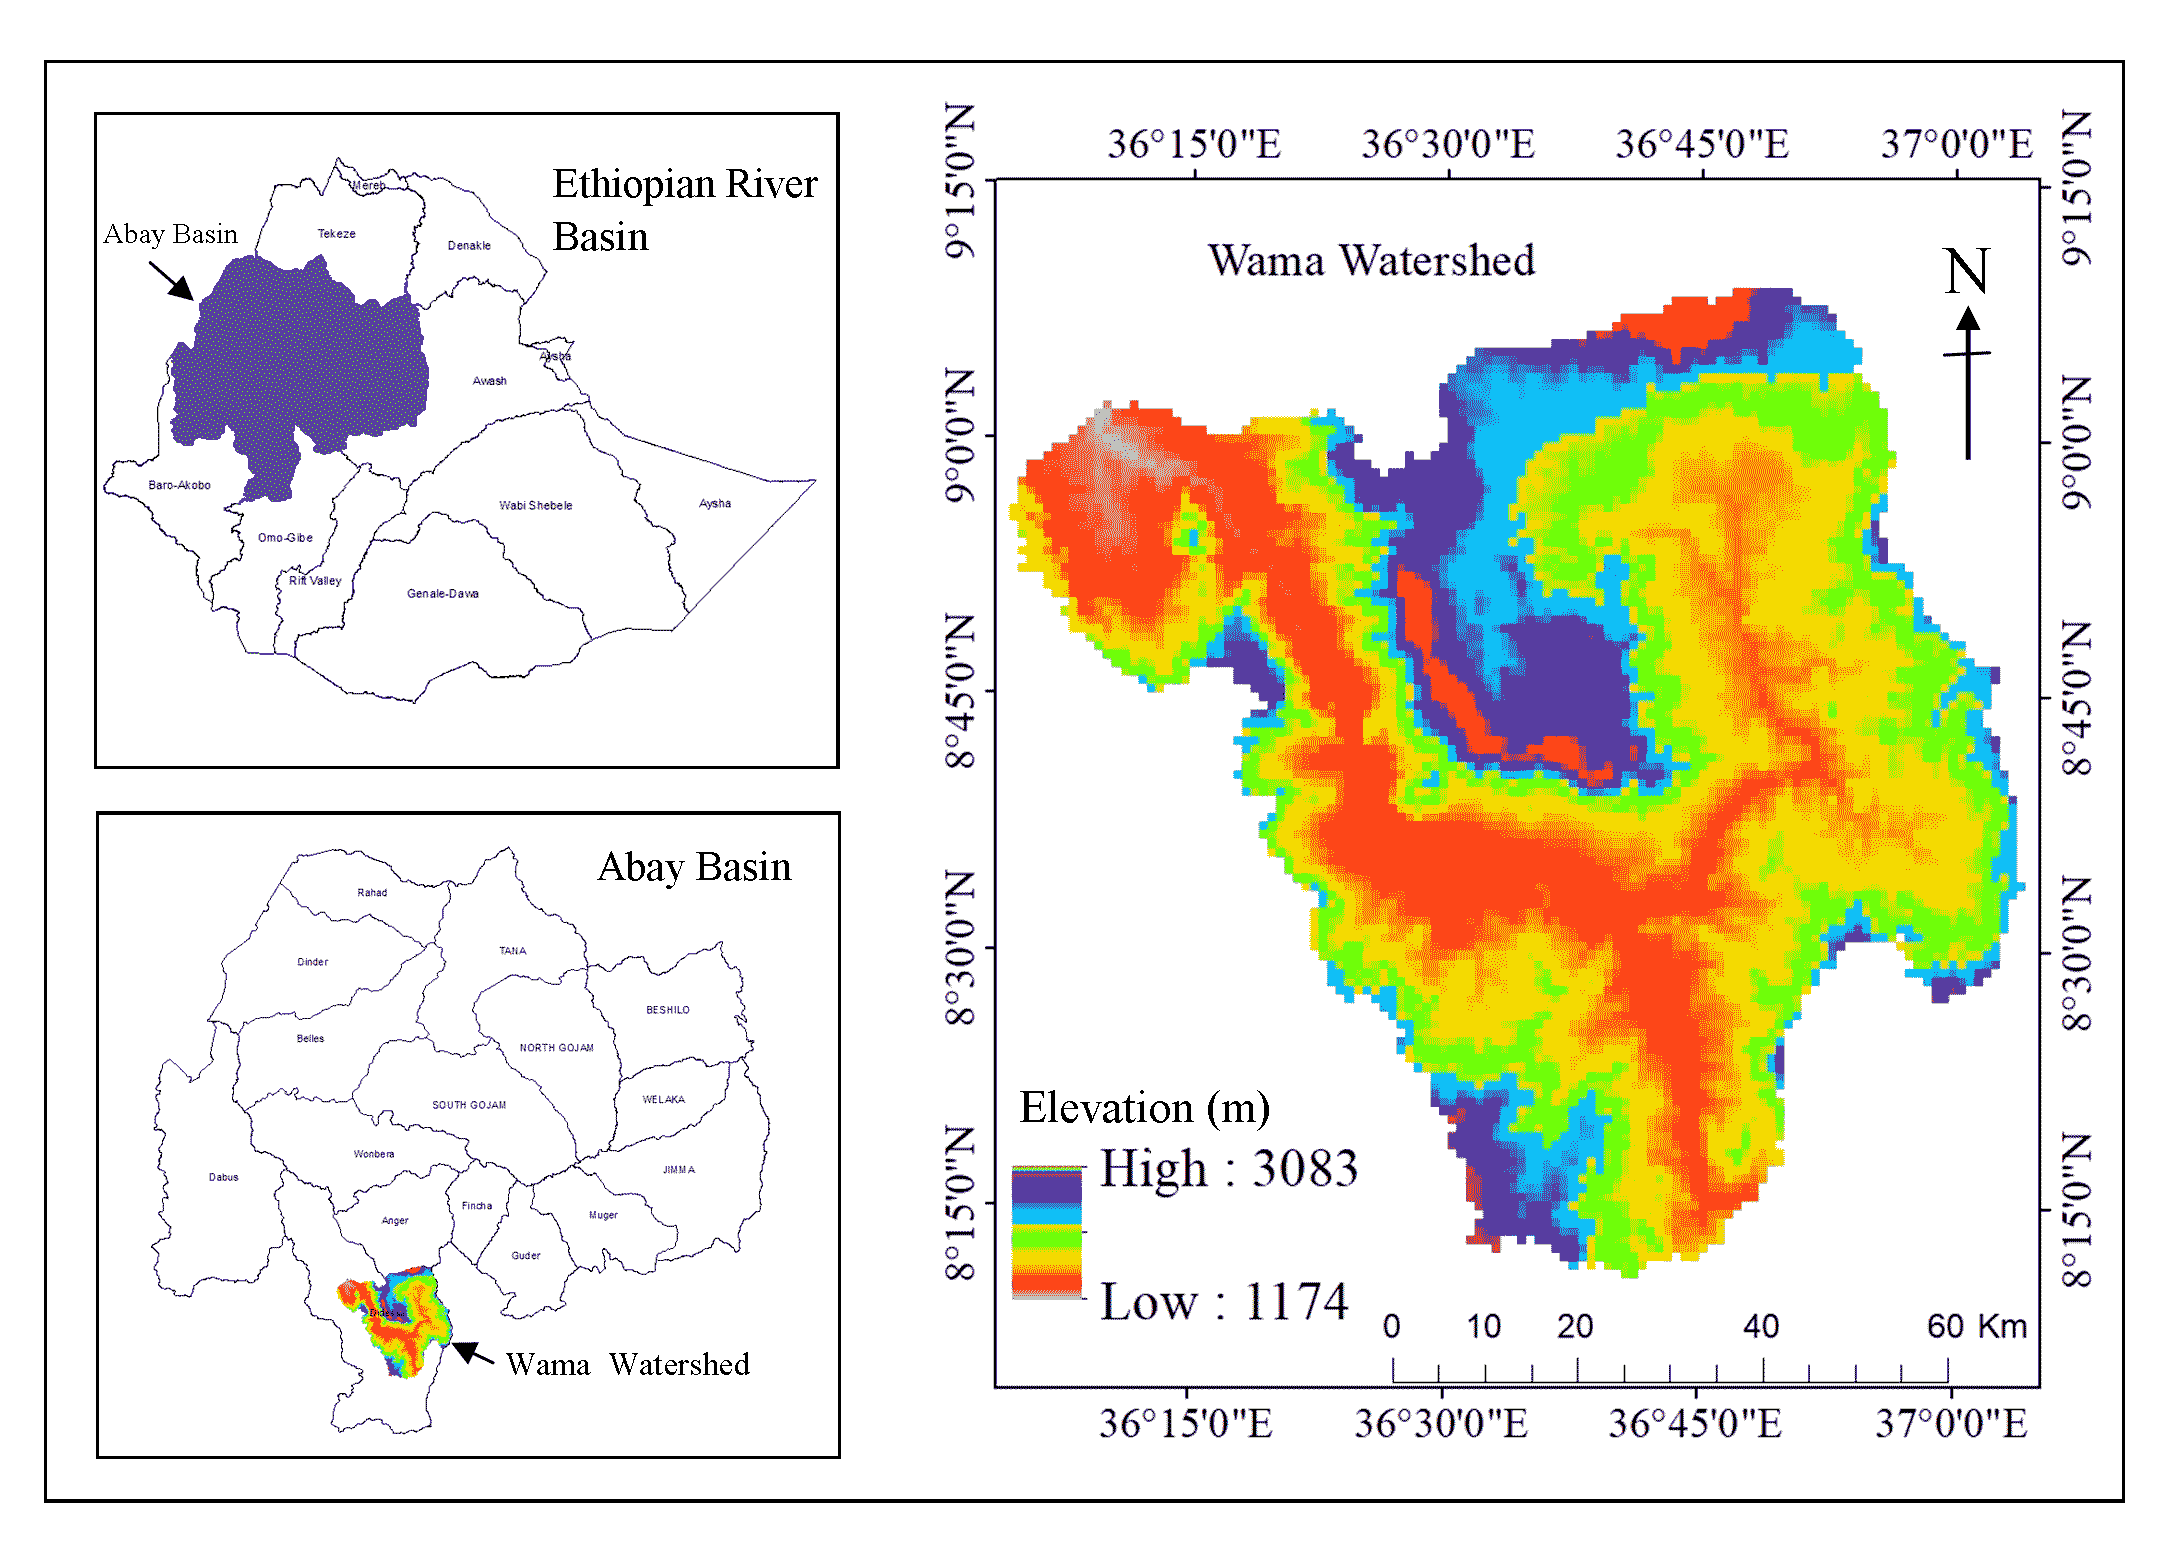
Due to heavily reliance on rain-fed agriculture and the unpredictable nature of rainfall, alternative strategies for boosting agricultural productivity must be developed in Ethiopia and the irrigation development should be maximized (Wubalem, 2021). Ethiopia is currently working to establish effective water resource management strategies and to take advantage of the potential irrigation in its river basin (Kassie, 2020). One of Ethiopia’s longest basins with the potential for surface water irrigation is the Upper Blue Nile River Basin (Teshome and Halefom, 2020; Dawit et al., 2020). However, there is a need for clear and flexible irrigation management. The river basin features in the Wama watershed are vital to know the entire potential of the land resources and available surface water for irrigation (Burayu, 2022). Growing irrigation demand combined with shifting land use patterns, population growth, climate change and variability is a serious problem for surface water irrigation in the Wama watershed. Irrigation is one of the solutions to the food shortage in the region where rain-fed agriculture practiced (Wubalem, 2021; Gonfa et al., 2021). It moves water from a source with plenty of water to fields with little water because of constructed structures. It can contribute to the reduction of destitution and the achievement of food self-sufficiency by giving farmers more income during the dry seasons (Kebede and Ademe, 2016).
In the Wama Watershed, rain-fed agriculture is the only practiced method for growing crops (Wubalem, 2021). Because of the region’s high level of regional and temporal rainfall variability, food insecurity is a prevalent problem (Nigussie et al., 2019). Uncertainty in rainfall distribution resulted in crop failure and droughts. As a result, in the face of even small setbacks, food insecurity can soon turn into famine, wreaking havoc on the existence of the poor rural community (Shitu and Berhanu, 2020). The most important strategy for transforming low-output rain-fed agriculture into the most effective and efficient irrigated agriculture is to use water to quadruple crop output during the arid season (Aybehon and Tiku, 2022; Negasa and Wakjira, 2021; Shitu and Berhanu, 2020). However, there hasn’t been any study done on-site appropriateness evaluations for surface irrigation (Burayu, 2022). To sustain rain-fed agriculture through irrigation, which will help to reduce poverty in the watershed, site suitability assessment for surface irrigation is essential in this area (Nigussie et al., 2019). A necessity for better land resource usage, which helps in the optimization and sustainability of these land resources’ production, is proper site suitability appraisal of the available land resources in the irrigation command area (Negasa and Wakjira, 2021). Access to irrigation influences both changes in land use and the adoption of intensive farming techniques. On the other hand, irrigation is not always appropriate for all regions (Teshome and Halefom, 2020). The AHP method is commonly employed (Saaty, 1980) to account a number of factors including land use, topography, and various soil properties (physical and chemical) for classifying surface irrigation sites according to their suitability as one of the crucial steps in planning for many objectives. The main goal of this study is to detect the suitable lands for surface irrigation in the Wama watershed using the AHP, RS and GIS techniques. This analysis will help in selecting appropriate sites for surface irrigation and planning and managing the land use.
4 . RESULTS AND DISCUSSION
4.1 Thematic layers
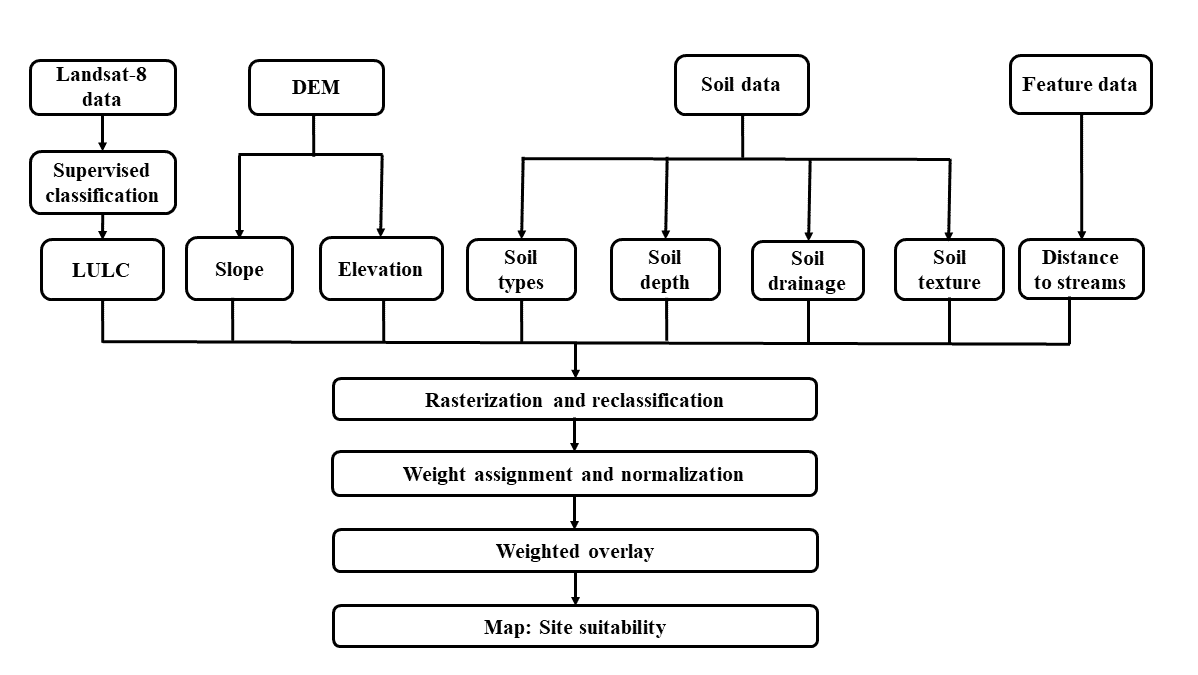
One of the crucial elements in a site suitability analysis for surface irrigation is the preparation of thematic layers. For this study, a single database for criteria maps was created. The characteristics were transformed into a projection system and equal resolution.
4.1.1 Slope
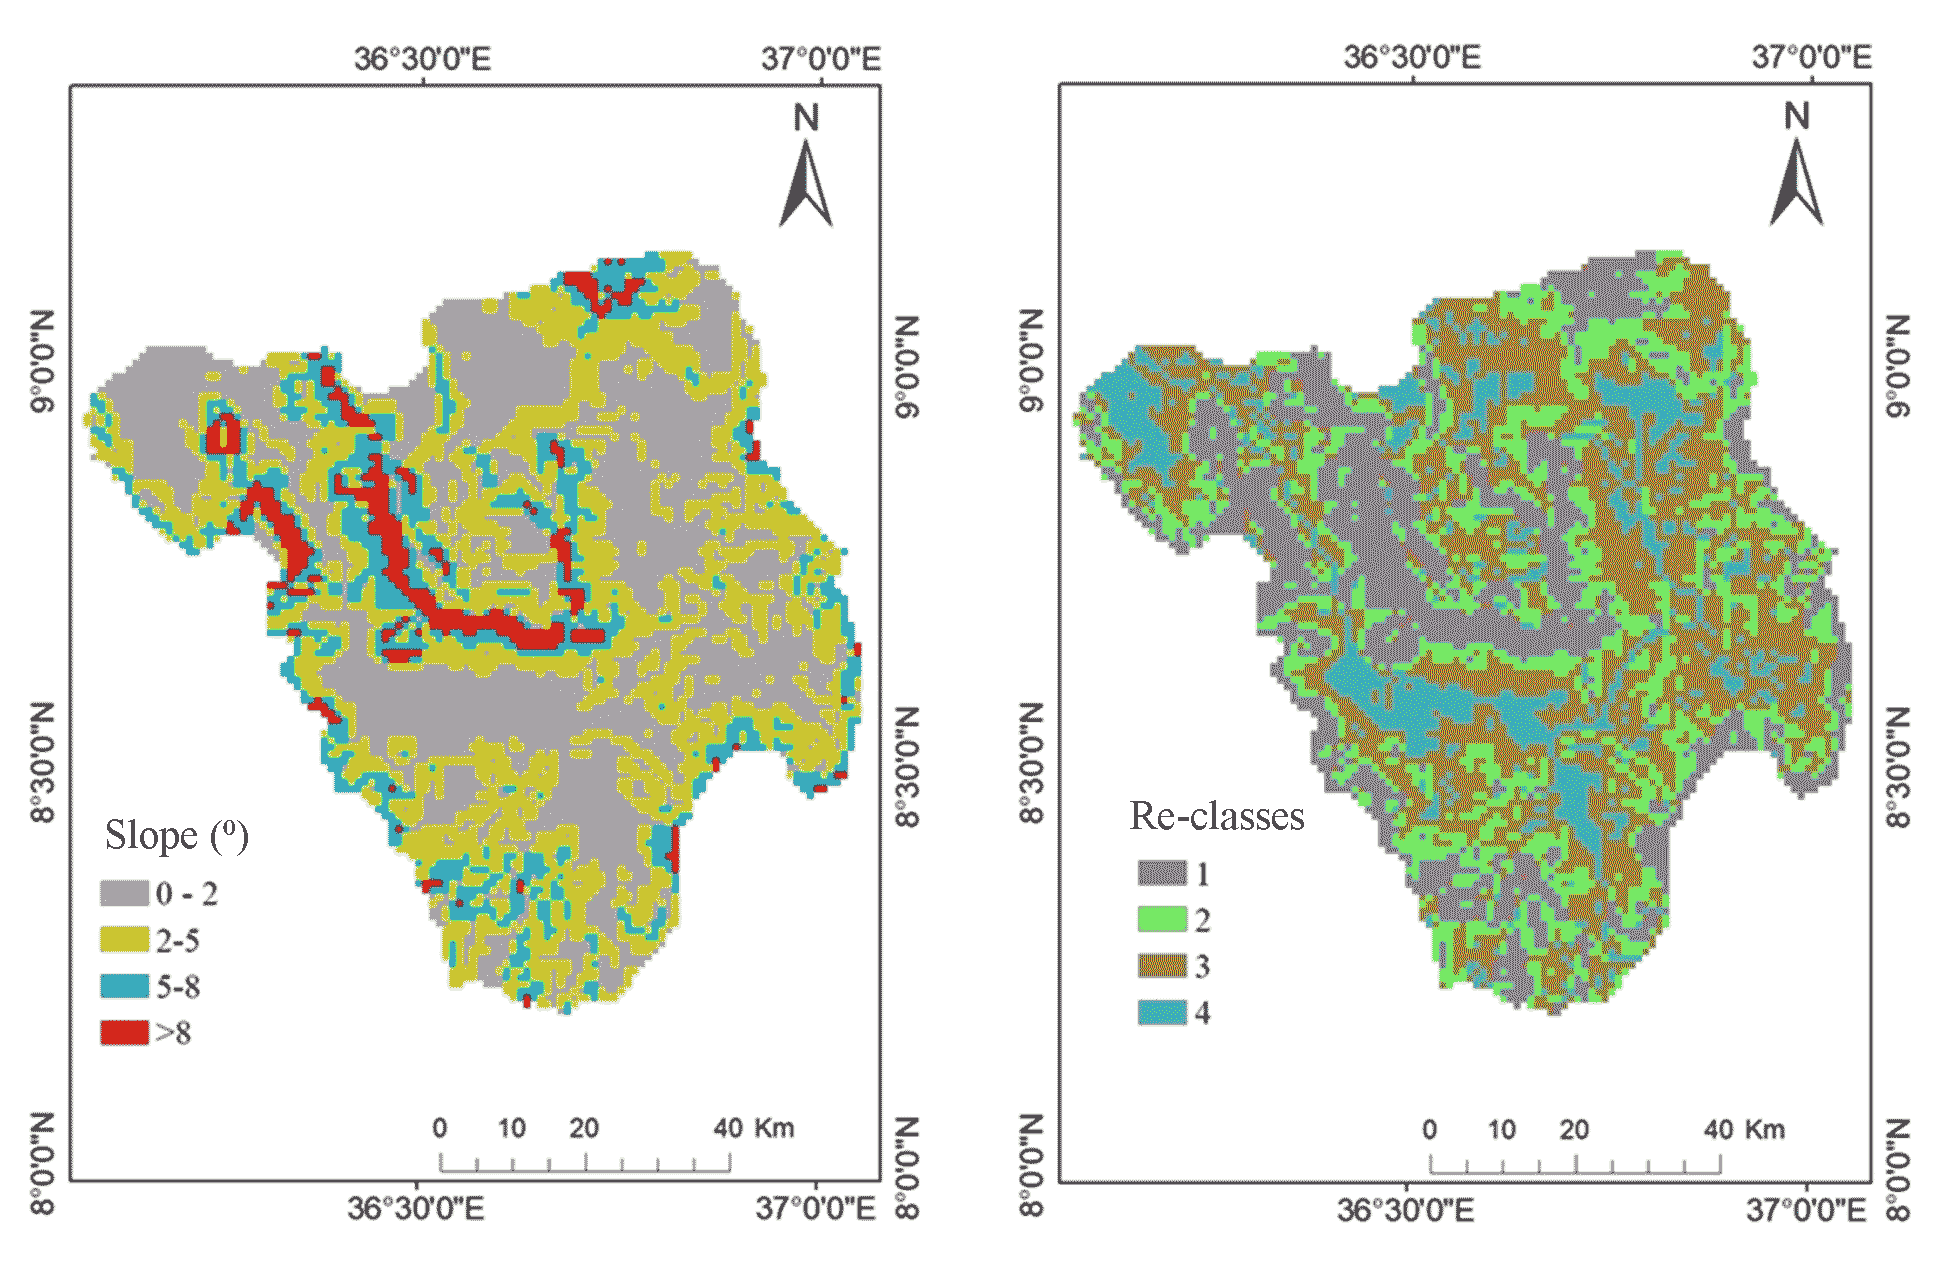
The slope, which is typically given in percent, is the inclination or gradient of a surface. Due to its impact on runoff, drainage, erosion, and crop selection, the slope is crucial for the creation and maintenance of soil. The gradient has a significant impact on duration of irrigation cycle, crop adaptation, erosion prevention and irrigation technique. As the gradient rises, the risk of erosion increases in surface irrigation. So, the water management is useful to reduce the length of irrigation runs and crop options. The irrigation management become more significant in steep sloped area. In general, steep gradients lead to reduce productivity and greater production costs. Therefore, slopes were derived using digital elevation model (DEM) with 30m resolution from the Shuttle Radar Topography Mission (SRTM) and used for this site suitability analysis for surface irrigation. The raster layer was classified into four groups with corresponding suitability ratings of 1 to 4: (4 = Highly suitable, 3 = Moderately suitable, 2 = Marginally suitable, and 1 = Unsuitable).The result obtained after reclassifying the slope map was that 15% (448.1km2) of the watershed was less than 2%, 39 % (1289km2) of the watershed, 2-5%, 23% (756.3km2), 5-8% and 24% (811.5km2) of the watershed is higher than 8% slope. This shows that 76% (2532.9km2) of the study area was revealed to be appropriate for surface irrigation.
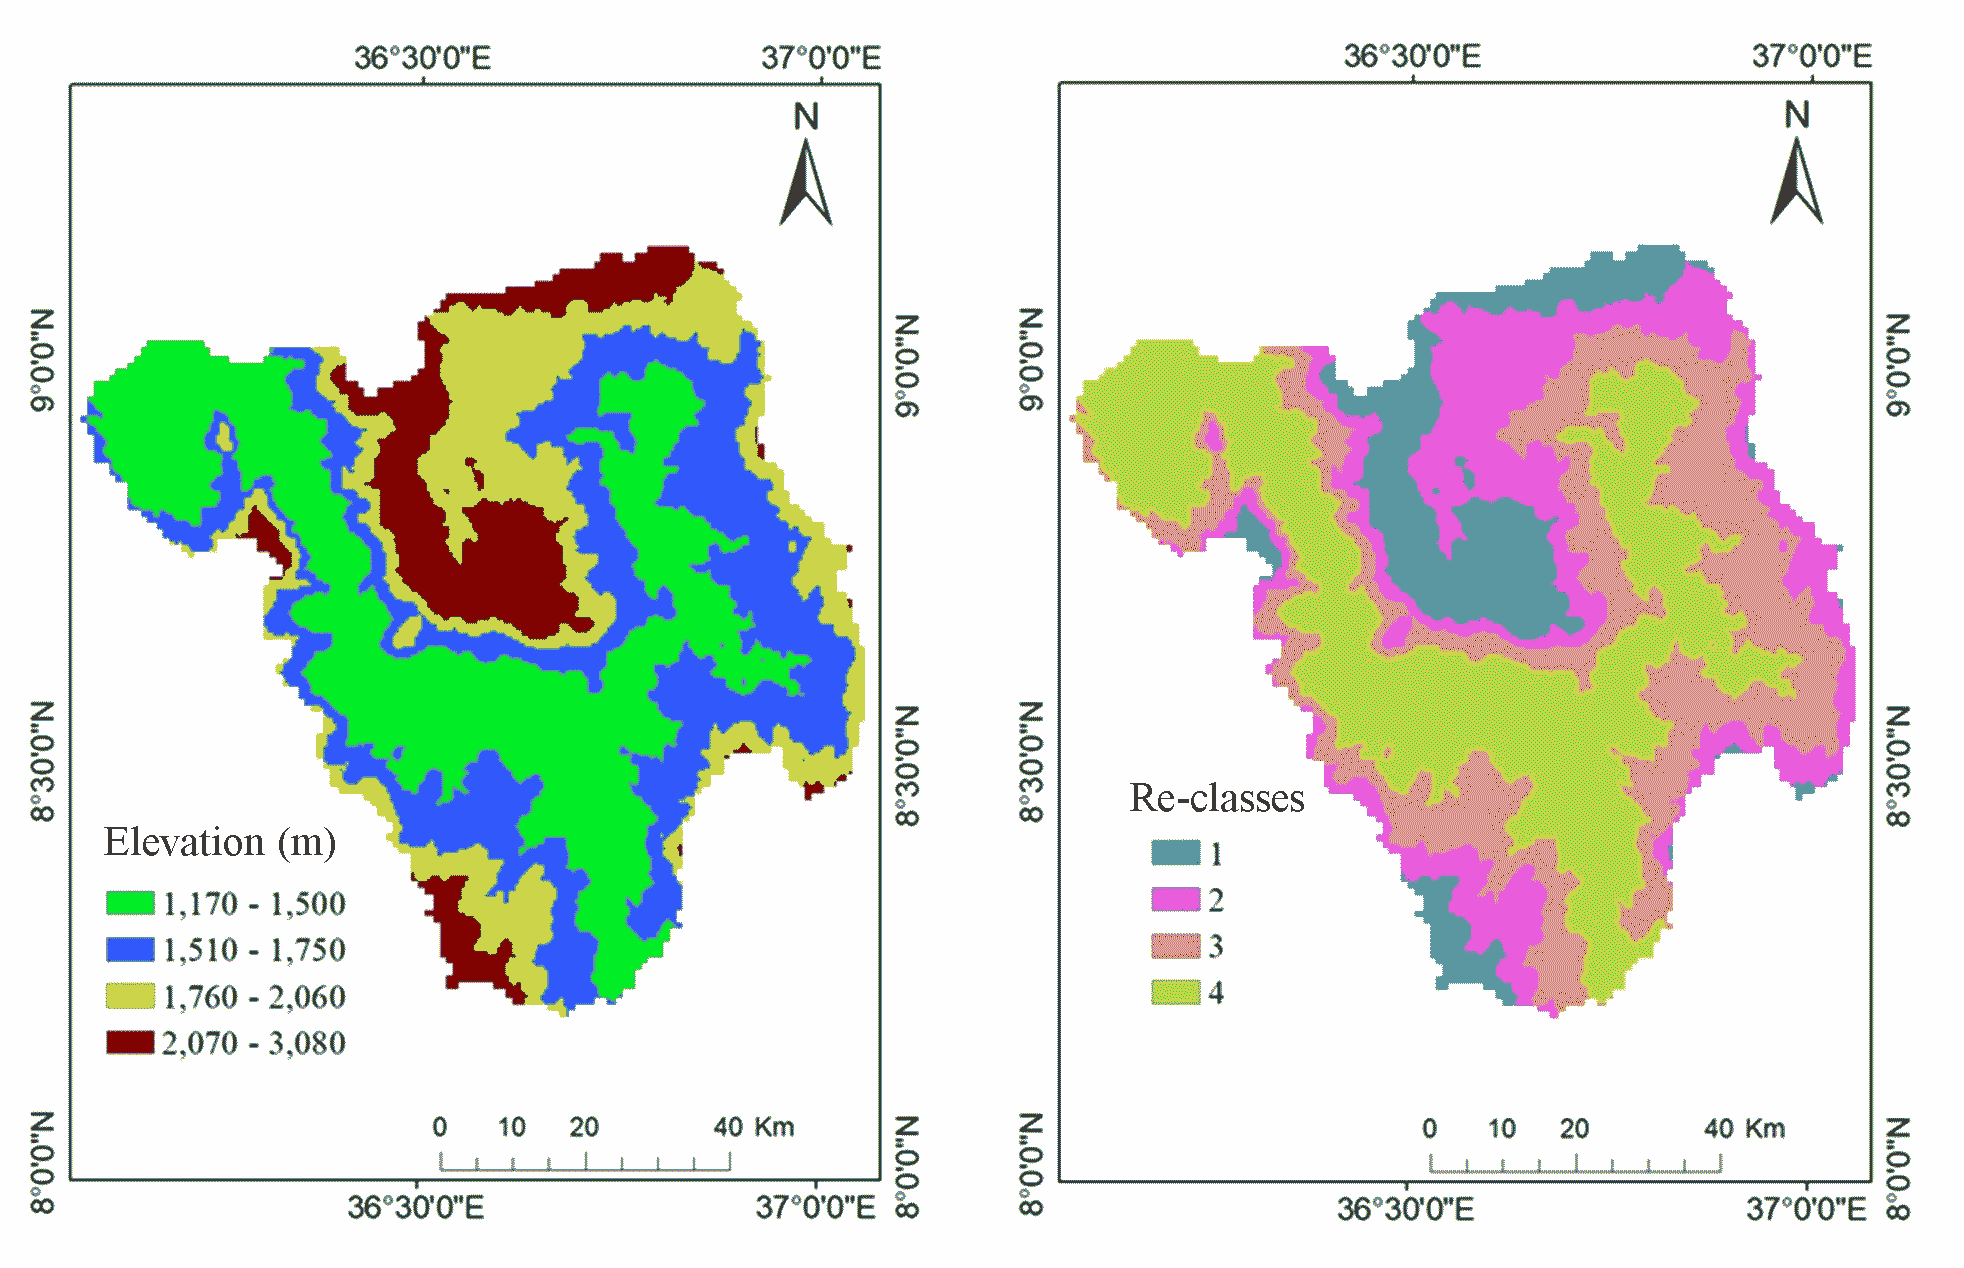
4.1.2 Elevation
The elevation was rescaled and classified into four classes: extremely suitable class (4) for elevation ranges from 1170m to 1500m, moderately suitable class (3) for elevation ranges from 1500m to 1750m, marginally suitable class (2) for elevation ranges from 1750m to 2060m, and unsuitable class (1) for elevation ranges from 2060m to 3080m. The highly suitable land class is covered by approximately 35% (1174km2), the moderately suitable land class (3) is covered by approximately 31% (1032km2), and the marginally suitable land class (2) is covered by approximately 21% (694km2), and the unsuitable land class (1) is covered by approximately 13% (174.2km2).
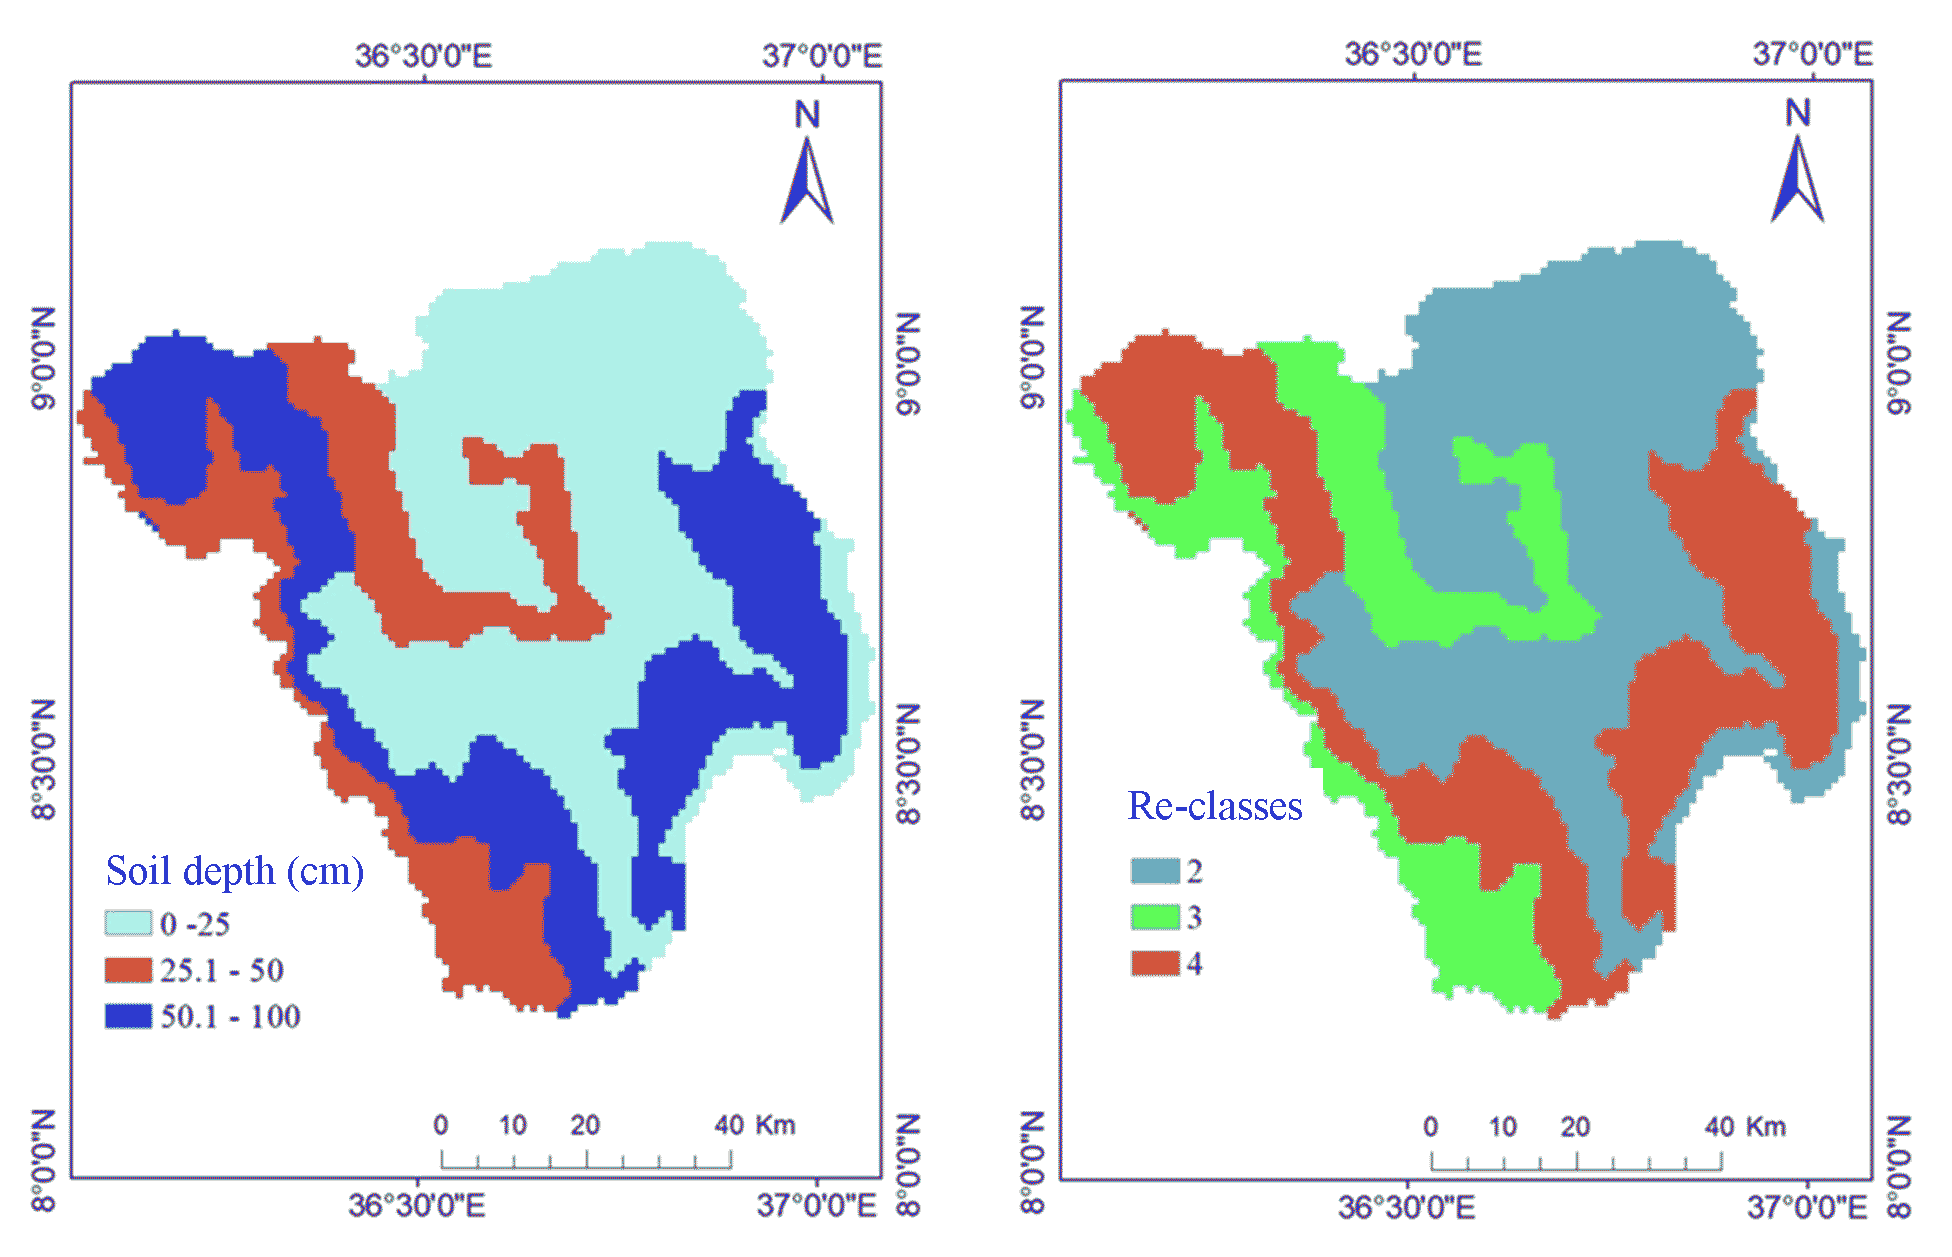
4.1.3 Soil Depth
Based on the required soil depth for the majority of common crops to have the option of surface irrigation, the soil depth was classified into acceptable classes. Rating parameters for soil depth were supplied and weighted to determine if the study area was suitable for surface (gravity) irrigation. Based on the suitability score assigned for each soil depth, a map showing the soil depth suitability after being converted to raster and divided into four categories with accompanying suitability scores of 1 to 4. According to the suitability map, 32% of the area (1078.5km2) is classified as highly appropriate, compared to 21% (691.1km2) for moderate suitability and 47% (1574.7km2) for marginal suitability.
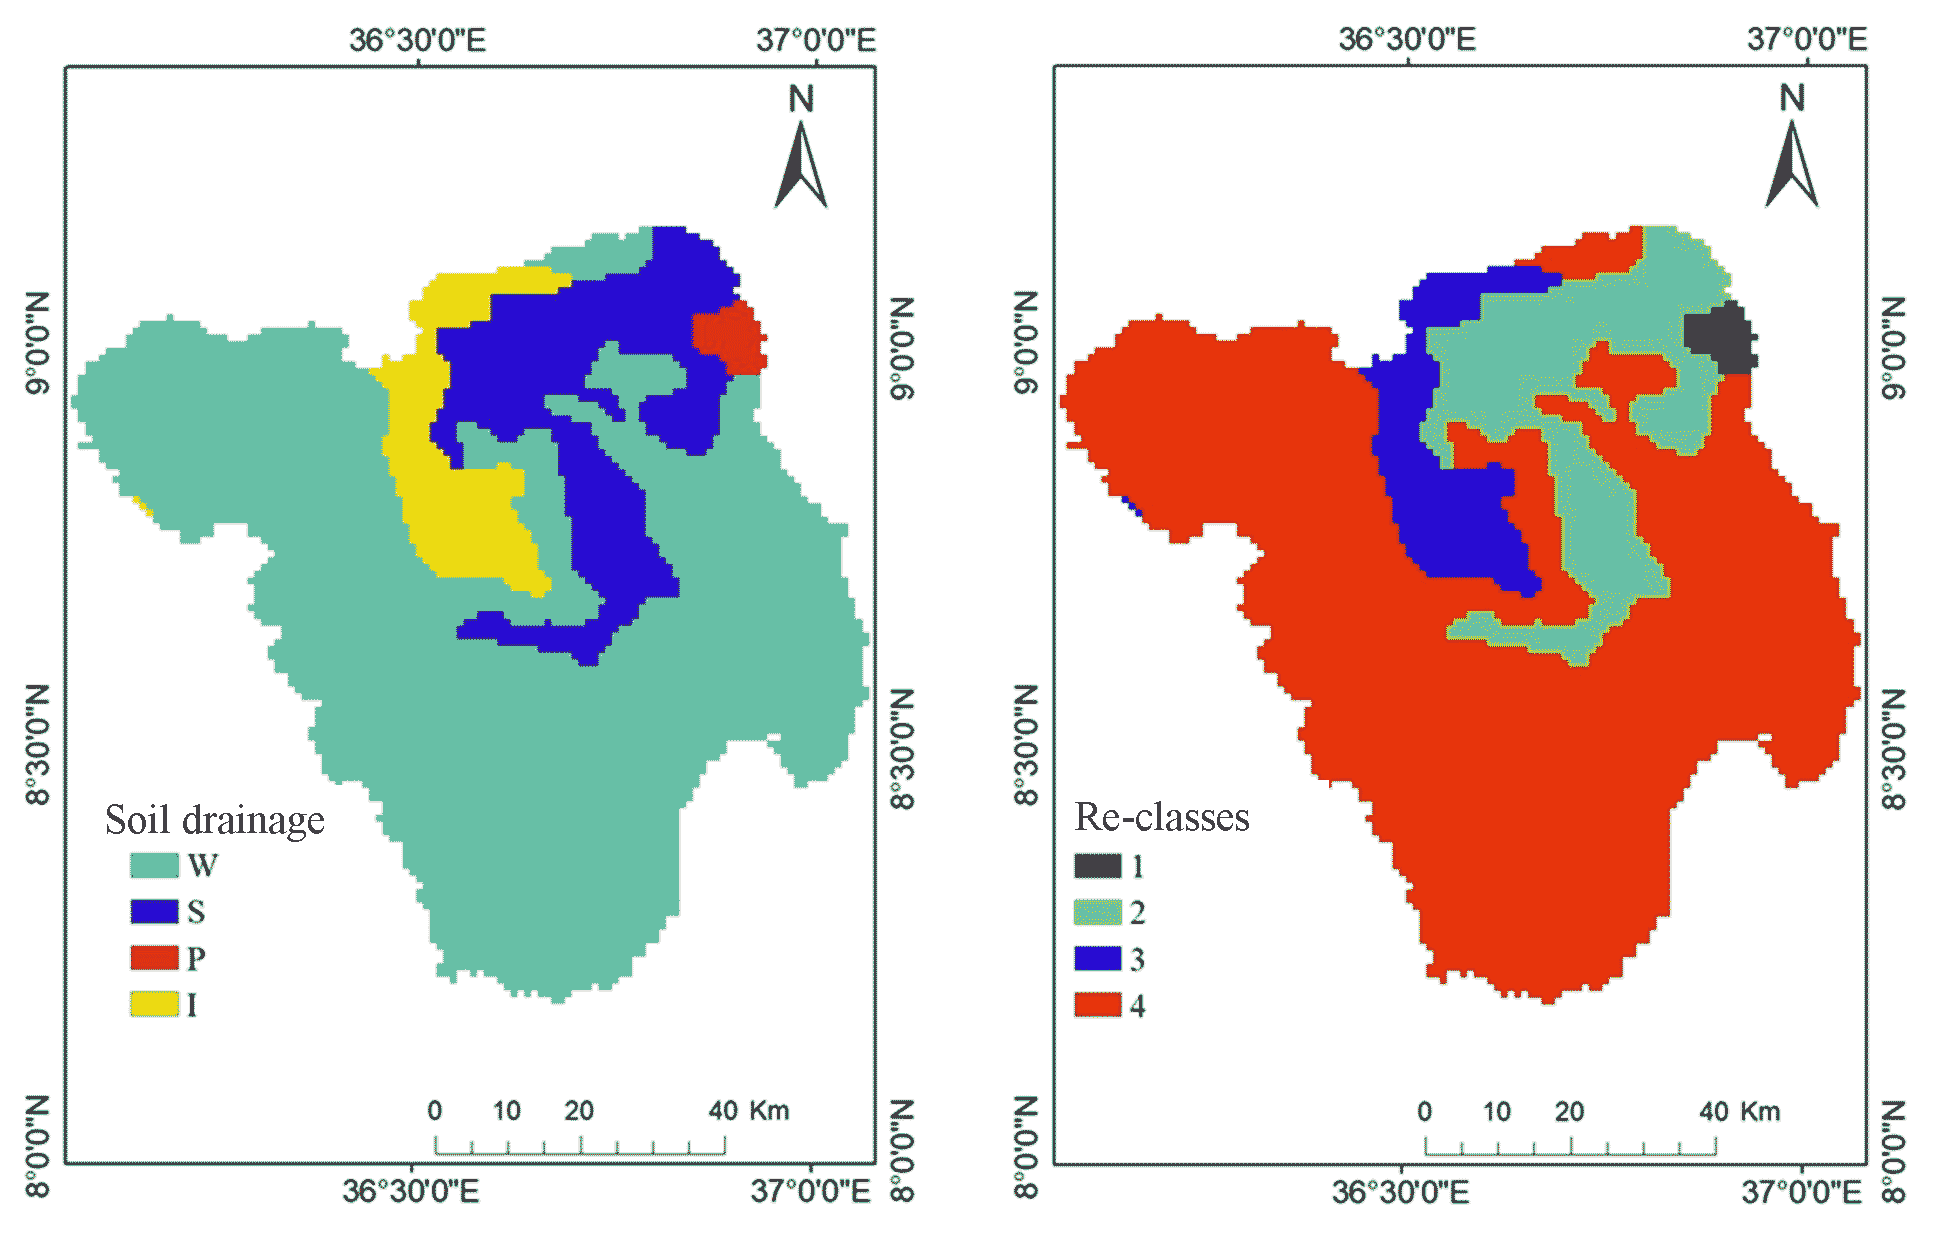
4.1.4 Soil Drainage
Normal plant development is possible due to soil drainage. Elevation of the soil drainage is important when choosing sites for surface irrigation, especially with diverse highland crops. Ample soil drainage is crucial to ensuring continued production and enabling productivity in agricultural operations. The efficient removal of the additional water and salts that irrigation contributes requires consideration of new irrigation facilities. A area with efficency of drainage may be classified as well-drained, moderately drained, imperfectly drained, severely drained, or extremely poorly drained depending on the techniques used to measure a permeability of soils. Therefore, the soil drainage properties were classified into well drained, moderately drained, imperfectly drained, and poorly drained. In our case, we give suitability class and score for each of the soil drainage classes as 4 (highly suitable), 3 (moderately suitable), 2 (marginally suitable), and 1 (unsuitable). We convert soil drainage map to raster and reclassify it to know area coverage of each soil drainage classes. From drainage suitability map, 75.4% (2522km2) is classified as 4 (highly suitable), 7.5 % (250km2) is 3 (moderately suitable), 16% (535.6km2) is 2 (marginally) and 1.1% (36.4km2) is unsuitable (Figure 6).
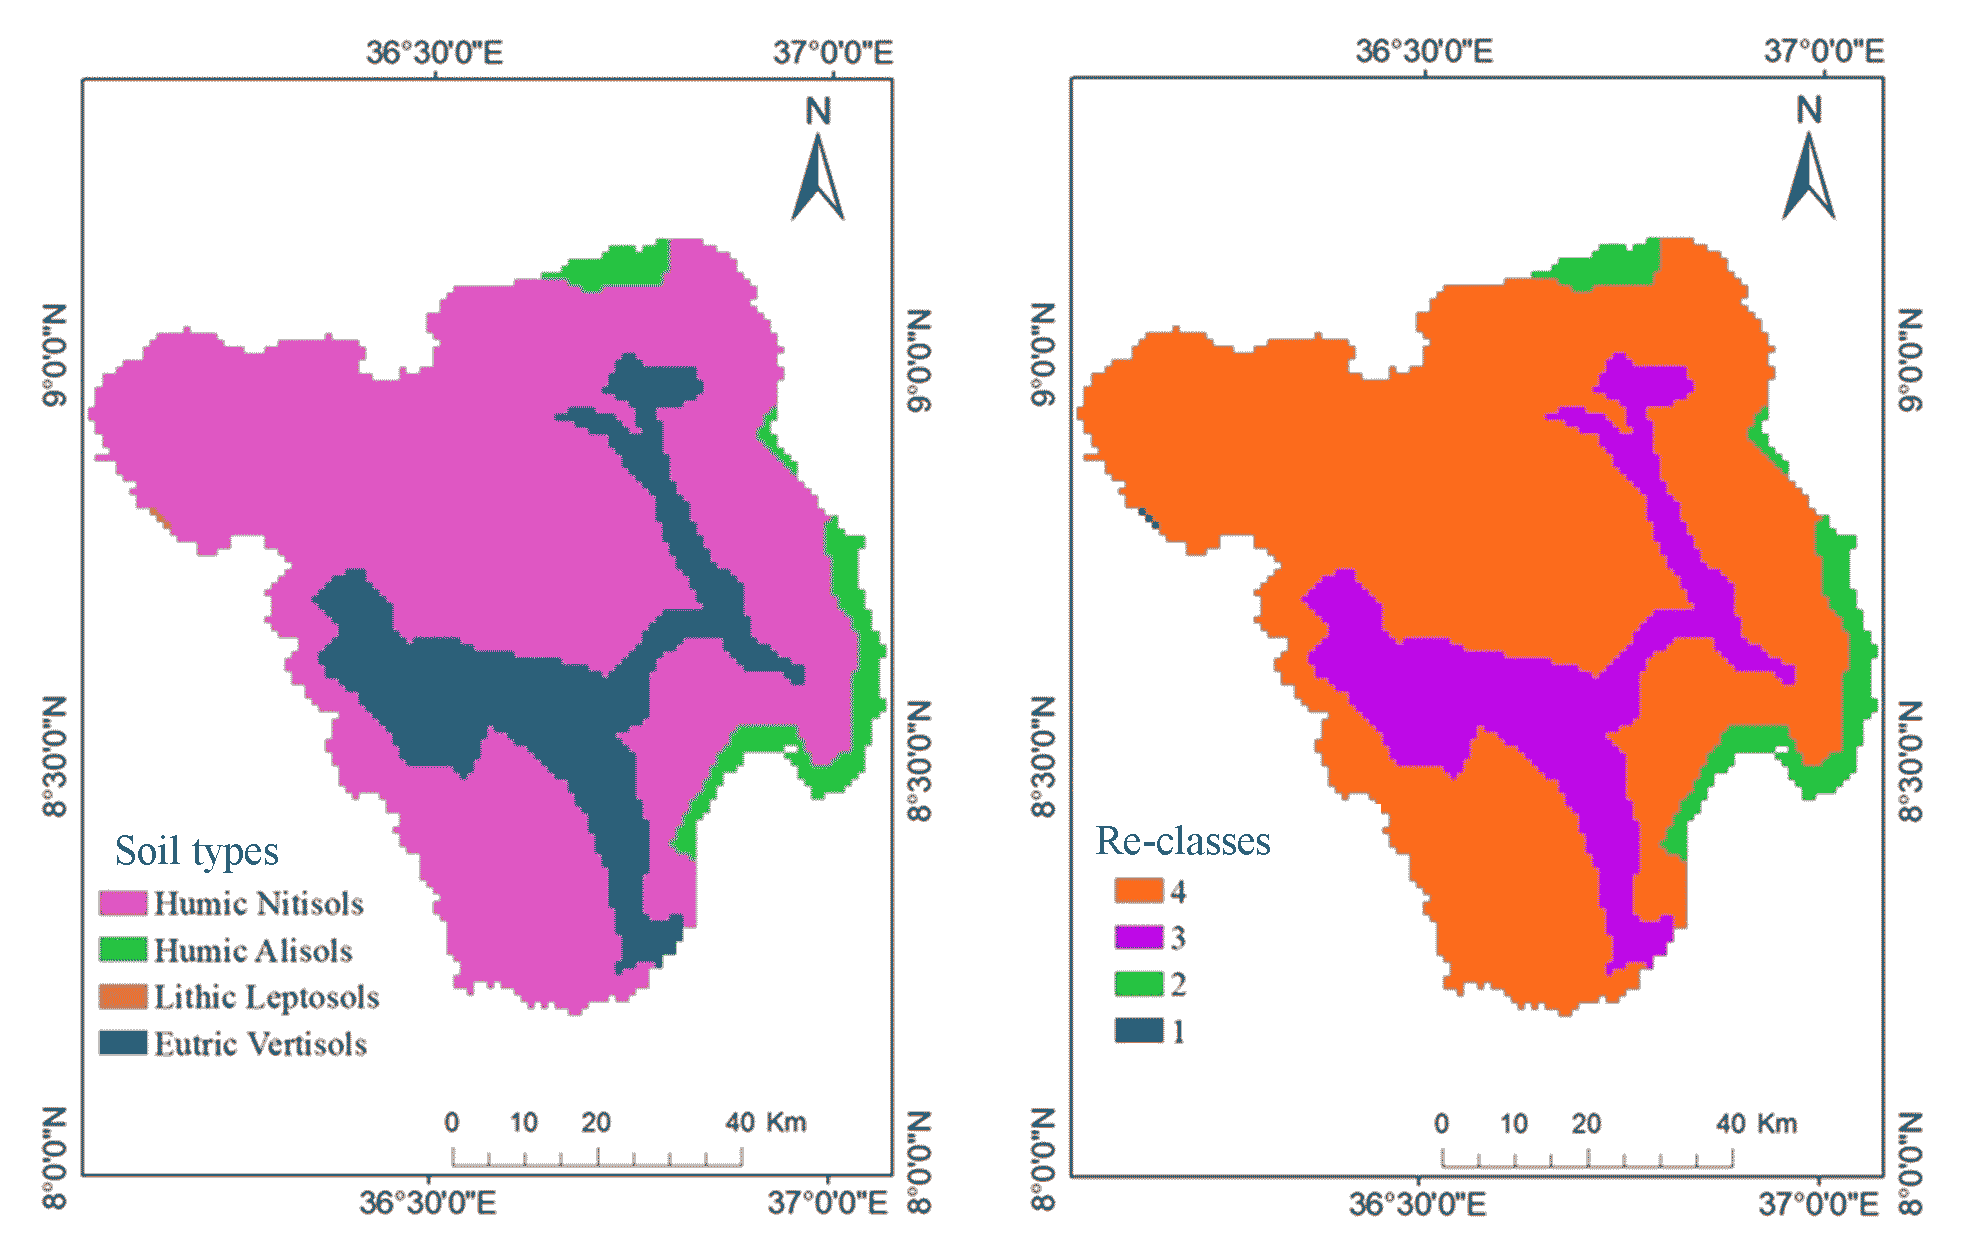
4.1.5 Soil Type
There are four types of soils observed in the Wama watershed: Humic Nitisols, Humic Alisols, Eutric Vertisols, and Lithic Leptosols. Most of the Wama watershed is covered by Humic Nitisols. The soil type mentioned above are standardized for land suitability assessment as Humic Nitisols are 4 (highly suitable), Eutric Vertisols are 3 (moderately suitable), Humic Alisols are 2 (marginally suitable) and lithic leptosols are 1 (unsuitable). We convert the soil type map to raster and reclassify it to know the area coverage of each soil type class. From soil type suitability map 77.24% (2583km2) (highly suitable), 17.93% (599.72km2) (moderately suitable), 4.79% (160.33km2) (marginally suitable) and the left 0.0004% ( 1.3km2) (unsuitable) (Figure 7).
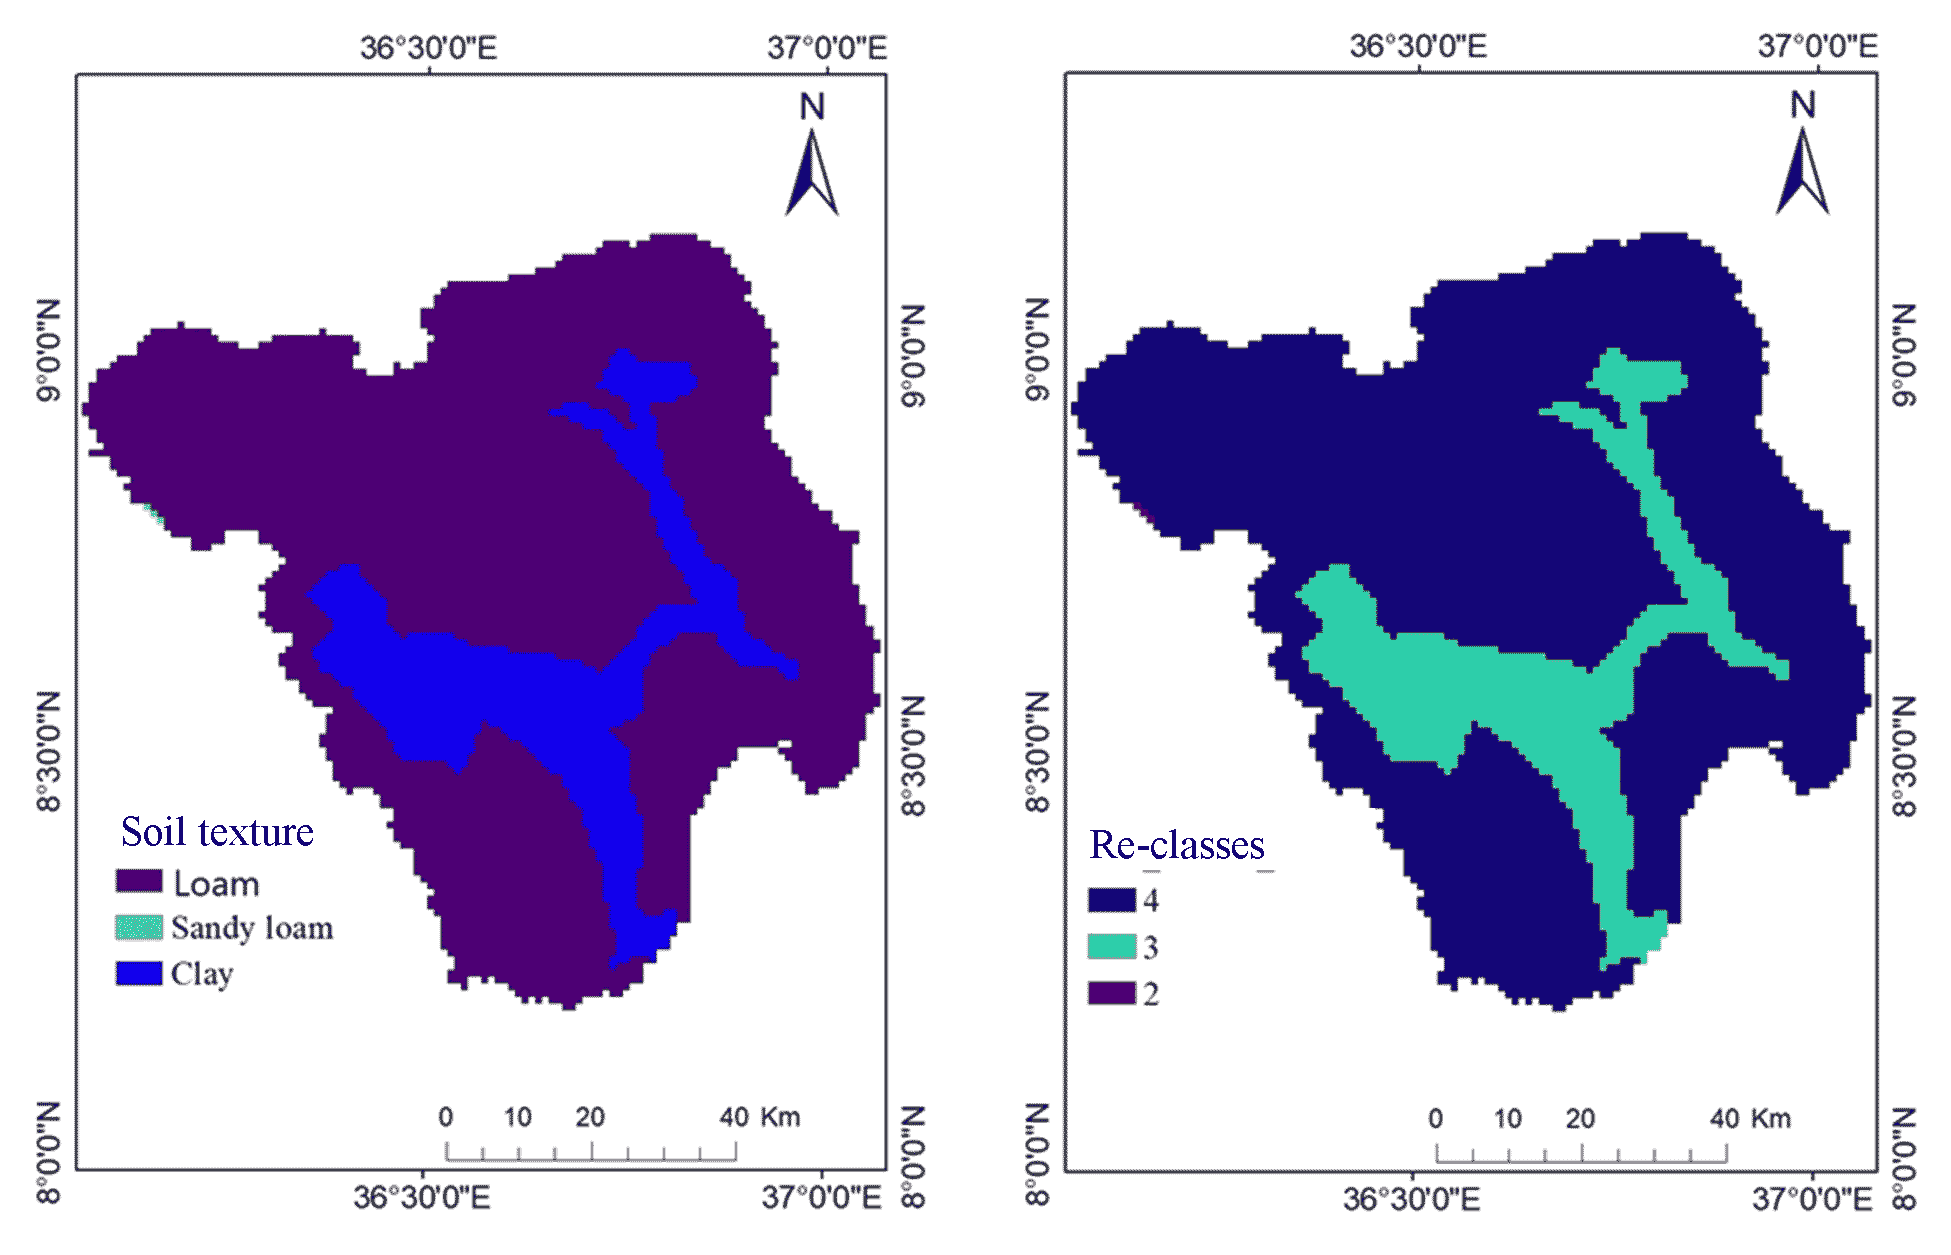
5.1.6 Soil Texture
According to the FAO (1985) guidelines for site suitability classification, soil textural classes like clay, clay loam, and loam soil were classified as highly suitable (4), silt and silty loam were classified as moderately suitable (3), and sandy loam soil texture was classified as marginally suitable (2) for surface irrigation with the restriction factor of high infiltration rate. The classes of soil texture in the study region were determined by the percentage of the soil hydrological group, which includes loam, clay loam, and clay. The soil texture classes and their respective suitability levels are highly suitable (4), clay soil is classified as moderately suitable (3) and sandy loam is as marginally suitable (2). From soil texture suitability map 82% (2743km2) (highly suitable), 17.93% (599.72km2) (moderately suitable), and 0.0004% (1.3km2) (marginally suitable) (Figure 8).
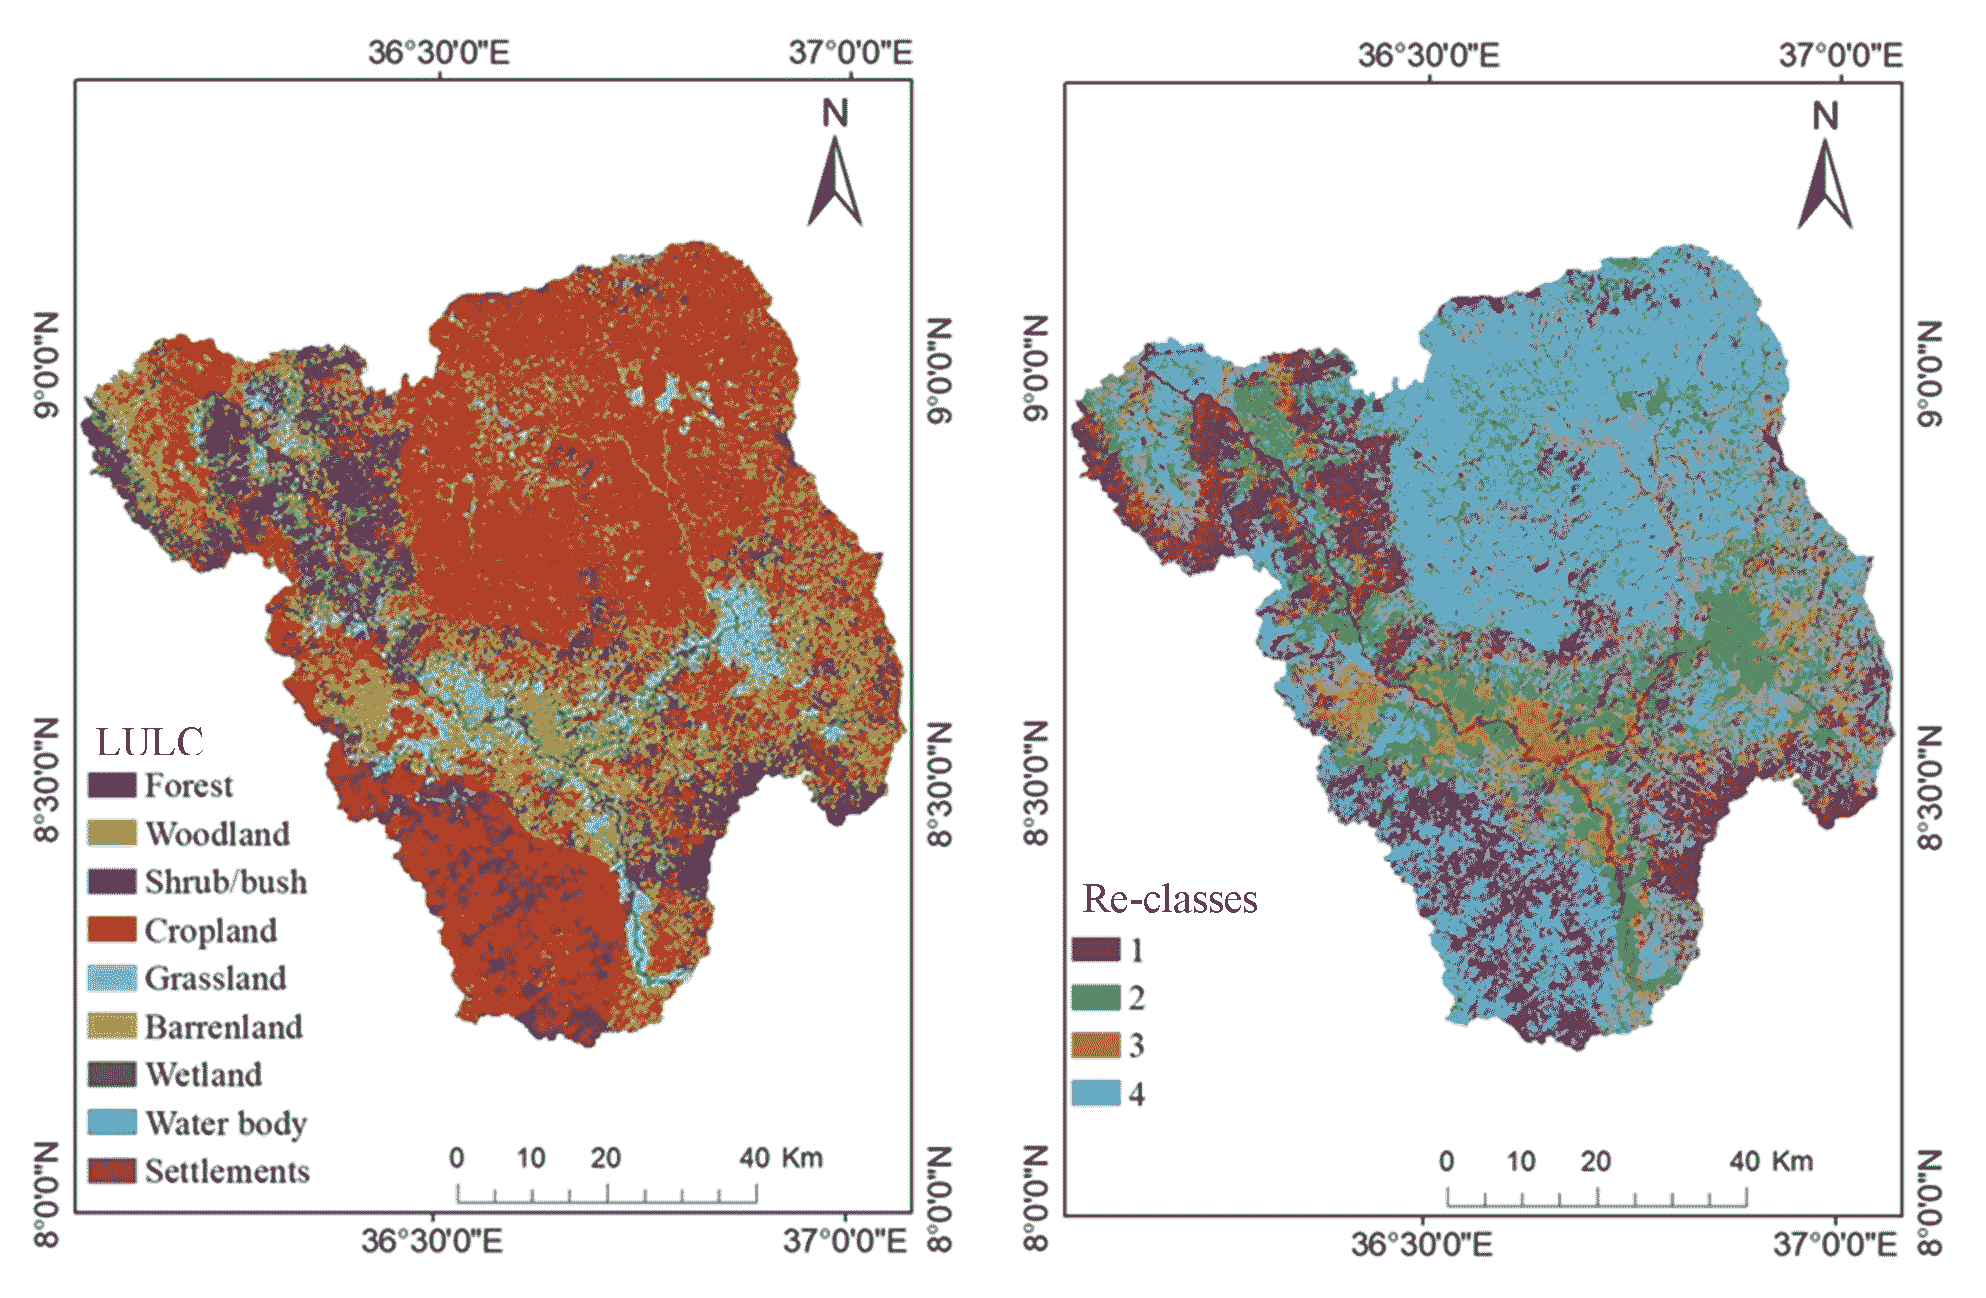
4.1.7 Land Use Land Cover
Another element used to assess the suitability of the area for irrigation is land use land cover (LULC). The Landsat 8 image was used to create the LULC map. It was categorized as very suitable (4), moderately suitable (3), marginally suitable (2), and not suitable (1). While grassland is rated as somewhat suitable (3), cropland was categorized as highly suitable (4). Due to the initial land investment required, woodland, shrub, and bush were rated as only slightly acceptable (2). The classification of the forest, barren land, water body, and settlements is unsuitable (1) (Figure 9). LULC categorized under highly suitable class covers 47% (1582.4km2), moderately suitable 15% (500km2), marginally suitable class 15% (500km2) and 23% (775km2) is under unsuitable class.
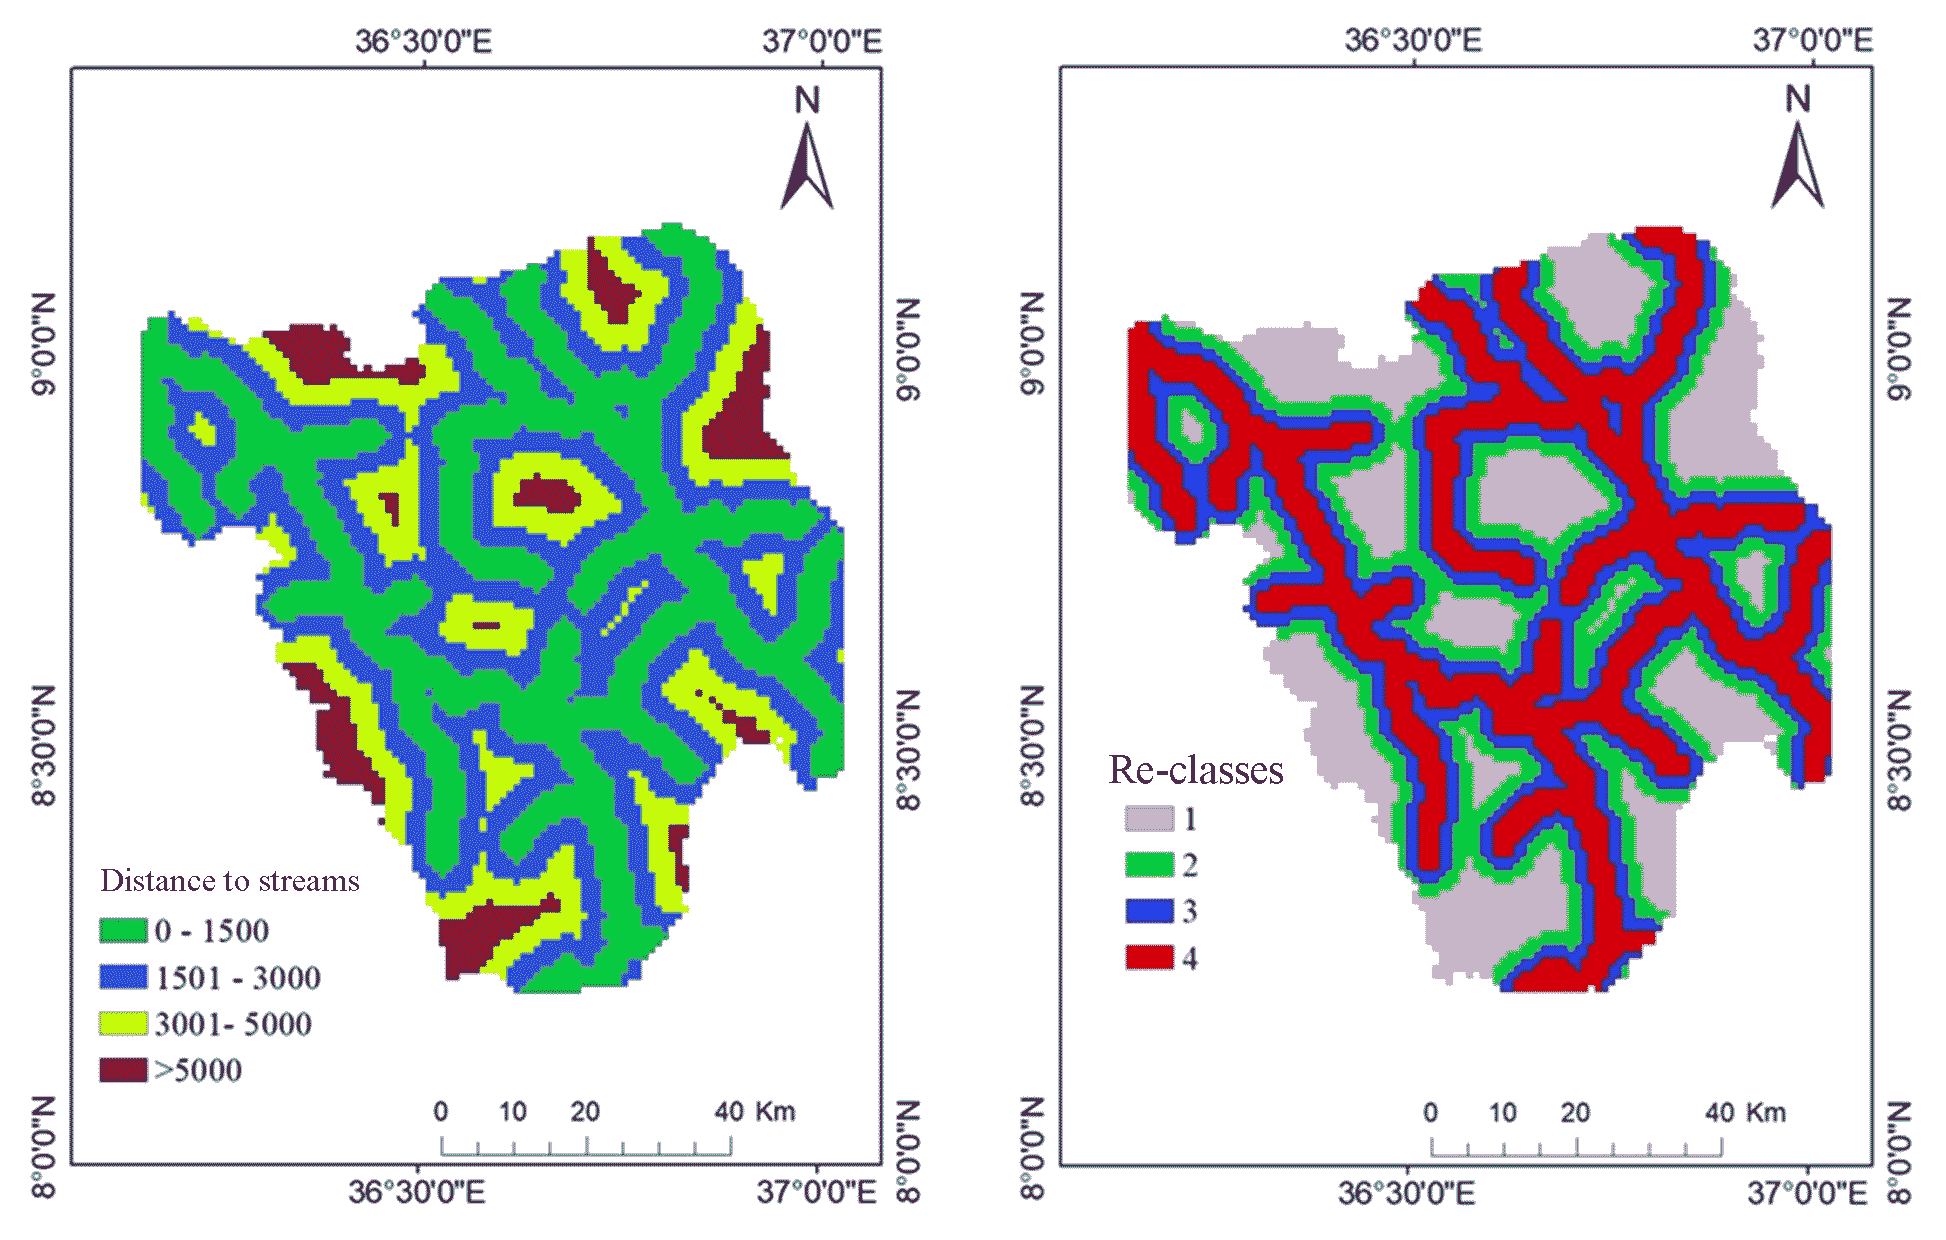
4.1.8 Distance to Streams
One of the most crucial aspects of site suitability evaluations for surface irrigation is the assessment and determination of the distance to the water source. Euclidean distance in ArcGIS was used to calculate the distance from the water source, which was then categorized into four categories: 0-1.5km (very suitable, 4), 1.5-3km (moderately suitable, 3), 3-5km (marginally suitable, 2), and >5km (unsuitable, 1) (Figure 10). Distance to streams categorized under highly suitable class covers 30.7% (1026.6km2), moderately suitable 24.6% (823.46km2), marginally suitable class 19.5% (652km2) and 25.2% (842.25km2) is under unsuitable class.
4.2 Weighting and Combining
The parameters used to generate the rasterized and categorized surface irrigation site suitability maps have been weighted. Saaty’s approaches were used in this study for each map and a pairwise comparison was prepared using 9-point significance scale in AHP. AHP is a multi-criteria decision-making strategy that offers a logical way of assessing and taking into consideration the consequences of numerous issues by connecting various level-dependent, qualitative and quantitative information. It was a method for accurately estimating the pairwise comparison-based qualified significance of a set of performances. Prioritizing the relative importance of each element that was qualified for a particular factor was done using weighting procedures. The weighted overlay element is more significant concerning other factors the higher the burden. A consistency ratio of 0.1 was considered acceptable. The calculated consistency ratio of 0.099 was accepted to demonstrate a certain matched weight (Saaty, 1978). The slope, elevation, soil texture, soil drainage, soil depth, LULC, and soil types all receive substantial weights in the pairwise evaluation, but the distance to the stream is assigned the largest weight (Saaty, 2004). The effectiveness of careful effect on the origin of contribution requirements is explained by numerical algorithms, and this influence is mutually influenced by various mathematical or logical methods of assessing disagreement. In this method, the influence value range of 1 to 9 was assigned to each aspect, and relationship outcomes were replicated by professionals. Using the weighted linear combination technique, each map layer was a critical step in the AHP. On a scale from 1 to 1/9, map was stacked in GIS spatial assessment for an appropriate site zone imitation (Burayu, 2022). The pairwise comparison matrix was prepared to estimate the relative importance of the elements (Saaty, 1980). The relationship between a value and intensity of less importance was as follows: 1= equal importance, 1/3 = moderate, 1/5 = strong, 1/7 = very strong, 1/9= extremely at the contrary, high significant variables were rated between 1 and 9. Each map layer was piled in a final GIS spatial assessment for suitable site zone imitation using the weighted linear combination technique.
4.3 Suitable Site Mapping for Surface Irrigation
Analyzing the suitability of a site is crucial to identifying the best locations for surface irrigation in light of numerous considerations. The goal of the current study was to identify the likely viable farmlands for surface irrigation within the Wama watershed. In this work, the association between soil physical characteristics, topography (slope and elevation), and LULC determinants on the appropriateness of locations for surface irrigation was assessed using an AHP method with GIS. An 8x8 pairwise comparison matrix was used to establish the relationship between governing criteria and site suitability (Table 1). Eight governing characteristics, including topographic factors (slope and elevation), land use, physical factors (soil texture, drainage, type, and depth), and distance to water source were taken into account for this study. Eight important factors were compared one to at least one in the pairwise comparison matrix, and the Saaty’s scale was used to score the results (Saaty, 1980). The normalized weights for each parameter were calculated using the matrix’s average row sum (Table 3). An overview of the relative significance of each parameter is given in Table 4. The distance from streams (44%), slope (18%), elevation (13%), LULC (13%), and soil drainage (5%) are the most important parameters in evaluating ideal sites for surface irrigation (Table 4). Soil depth (4%), soil type (3%), and soil texture (3%) are the next three factors (2%). Weighted overlay analysis (WOA) is carried out in an ArcGIS environment following the generation of weights for each raster layer using AHP. During suitability analysis, the weighted overlay is created by intersecting standardized and variably weighted layers. The weights quantify the relative weights of the taken into account appropriateness criteria. The suitability scores assigned for the sub-criteria inside each criteria layer were multiplied by the weights assigned for each criterion to create the final suitability map using the WOA approach.
Table 2. Pairwise comparison matrix
|
Criteria
|
Distance to streams
|
Slope
|
Elevation
|
LULC
|
Soil drainage
|
Soil depth
|
Soil type
|
Soil texture
|
|
Distance to streams
|
1
|
5
|
7
|
9
|
9
|
9
|
9
|
9
|
|
Slope
|
0.2
|
1
|
3
|
2
|
5
|
7
|
7
|
7
|
|
Elevation
|
0.14
|
0.33
|
1
|
2
|
7
|
5
|
5
|
5
|
|
LULC
|
0.11
|
0.5
|
0.5
|
1
|
5
|
7
|
7
|
7
|
|
Soil drainage
|
0.11
|
0.2
|
0.14
|
0.2
|
1
|
1
|
2
|
5
|
|
Soil depth
|
0.11
|
0.14
|
0.2
|
0.14
|
1
|
1
|
2
|
2
|
|
Soil type
|
0.11
|
0.14
|
0.2
|
0.14
|
0.5
|
0.5
|
1
|
2
|
|
Soil texture
|
0.11
|
0.14
|
0.2
|
0.14
|
0.2
|
0.5
|
0.5
|
1
|
|
Sum
|
1.9
|
7.46
|
12.24
|
14.63
|
28.7
|
31
|
33.5
|
38
|
Table 3. Normalized pairwise matrix
|
Criteria
|
Distance to streams
|
Slope
|
Elevation
|
LULC
|
Soil drainage
|
Soil depth
|
Soil type
|
Soil texture
|
|
Distance to streams
|
0.5
|
0.67
|
0.57
|
0.61
|
0.31
|
0.29
|
0.27
|
0.24
|
|
Slope
|
0.1
|
0.13
|
0.25
|
0.13
|
0.17
|
0.23
|
0.21
|
0.18
|
|
Elevation
|
0.1
|
0.04
|
0.08
|
0.13
|
0.24
|
0.16
|
0.15
|
0.13
|
|
LULC
|
0.1
|
0.07
|
0.04
|
0.07
|
0.17
|
0.23
|
0.21
|
0.18
|
|
Soil drainage
|
0.1
|
0.03
|
0.01
|
0.01
|
0.03
|
0.03
|
0.06
|
0.13
|
|
Soil depth
|
0.1
|
0.02
|
0.02
|
0.01
|
0.03
|
0.03
|
0.06
|
0.05
|
|
Soil type
|
0.1
|
0.02
|
0.02
|
0.01
|
0.02
|
0.02
|
0.03
|
0.05
|
|
Soil texture
|
0.1
|
0.02
|
0.02
|
0.01
|
0.01
|
0.02
|
0.01
|
0.03
|
|
Sum
|
1
|
1
|
1
|
1
|
1
|
1
|
1
|
1
|
Table 4. Relative weights
|
Criteria
|
Distance to streams
|
Slope
|
Elevation
|
LULC
|
Soil drainage
|
Soil depth
|
Soil type
|
Soil texture
|
Weight
|
W (%)
|
|
Distance to streams
|
0.5
|
0.67
|
0.57
|
0.61
|
0.31
|
0.29
|
0.27
|
0.24
|
0.437
|
43.7
|
|
Slope
|
0.1
|
0.13
|
0.25
|
0.13
|
0.17
|
0.23
|
0.21
|
0.18
|
0.177
|
17.7
|
|
Elevation
|
0.1
|
0.04
|
0.08
|
0.13
|
0.24
|
0.16
|
0.15
|
0.13
|
0.128
|
12.8
|
|
LULC
|
0.1
|
0.07
|
0.04
|
0.07
|
0.17
|
0.23
|
0.21
|
0.18
|
0.128
|
12.8
|
|
Soil drainage
|
0.1
|
0.03
|
0.01
|
0.01
|
0.03
|
0.03
|
0.06
|
0.13
|
0.046
|
4.61
|
|
Soil depth
|
0.1
|
0.02
|
0.02
|
0.01
|
0.03
|
0.03
|
0.06
|
0.05
|
0.035
|
3.54
|
|
Soil type
|
0.1
|
0.02
|
0.02
|
0.01
|
0.02
|
0.02
|
0.03
|
0.05
|
0.027
|
2.75
|
|
Soil texture
|
0.1
|
0.02
|
0.02
|
0.01
|
0.01
|
0.02
|
0.01
|
0.03
|
0.021
|
2.1
|
|
Sum
|
1
|
1
|
1
|
1
|
1
|
1
|
1
|
1
|
1
|
100
|
Table 5. Rating and weightages
|
Criteria
|
Classes
|
Suitability classes
|
Rating
|
Weightage (%)
|
|
Distance to streams
|
0 - 1500
1501 - 3000
3001- 5000
>5000
|
Highly suitable
Moderately suitable
Marginally suitable
Not suitable
|
4
3
2
1
|
43.7
|
|
Slope
|
0 - 2
2 - 5
5 - 8
>8
|
Highly suitable
Moderately suitable
Marginally suitable
Not suitable
|
4
3
2
1
|
17.7
|
|
Elevation
|
1170 - 1500
1500 - 1750
1750 - 2060
2060 - 3080
|
Highly suitable
Moderately suitable
Marginally suitable
Not suitable
|
4
3
2
1
|
12.8
|
|
Soil texture
|
Sandy loam
Clay
Loam
|
Marginally suitable
Moderately suitable
Highly suitable
|
2
3
4
|
12.8
|
|
Soil drainage
|
Well drained
Moderately well drained
Imperfectly poor drained
Poorly drained
|
Highly suitable
Moderately suitable
Marginally suitable
Not suitable
|
4
3
2
1
|
4.61
|
|
Soil depth
|
0-25
25.1 - 50
50.1 - 100
|
Marginally suitable
Moderately suitable
Highly suitable
|
2
3
4
|
3.54
|
|
LULC
|
Forest/water body/settlements
Shrub/bush/grassland
Woodland/barrenland/wetland
Cropland
|
Not suitable
Marginally suitable
Moderate suitable
Highly suitable
|
1
2
3
4
|
2.75
|
|
Soil type
|
Lithic leptosols
Humic alisols
Eutric vertisols
Humic nitisols
|
Not suitable
Marginally suitable
Moderate suitable
Highly suitable
|
1
2
3
4
|
2.1
|
\(S= { \sum_{i=1}^n Wi \ Xi}\)
where, S is the overall suitability score, Wi is the weight allocated to the layer of suitability criterion that was chosen, Xi is the sub-criteria score that was assigned to layer i of suitability criteria, and n is the total number of suitability criteria.
\(S=0.437×[Distance \ to \ stream]+0.177×[Slope]+0.128×[Elevation]\)
\(+0.128×[LULC]+0.0461×[Soil \ drainage]+0.0354×[Soil \ depth]\)
\(+0.0275×[Soil \ types]+0.021×[Soil \ texture]\)
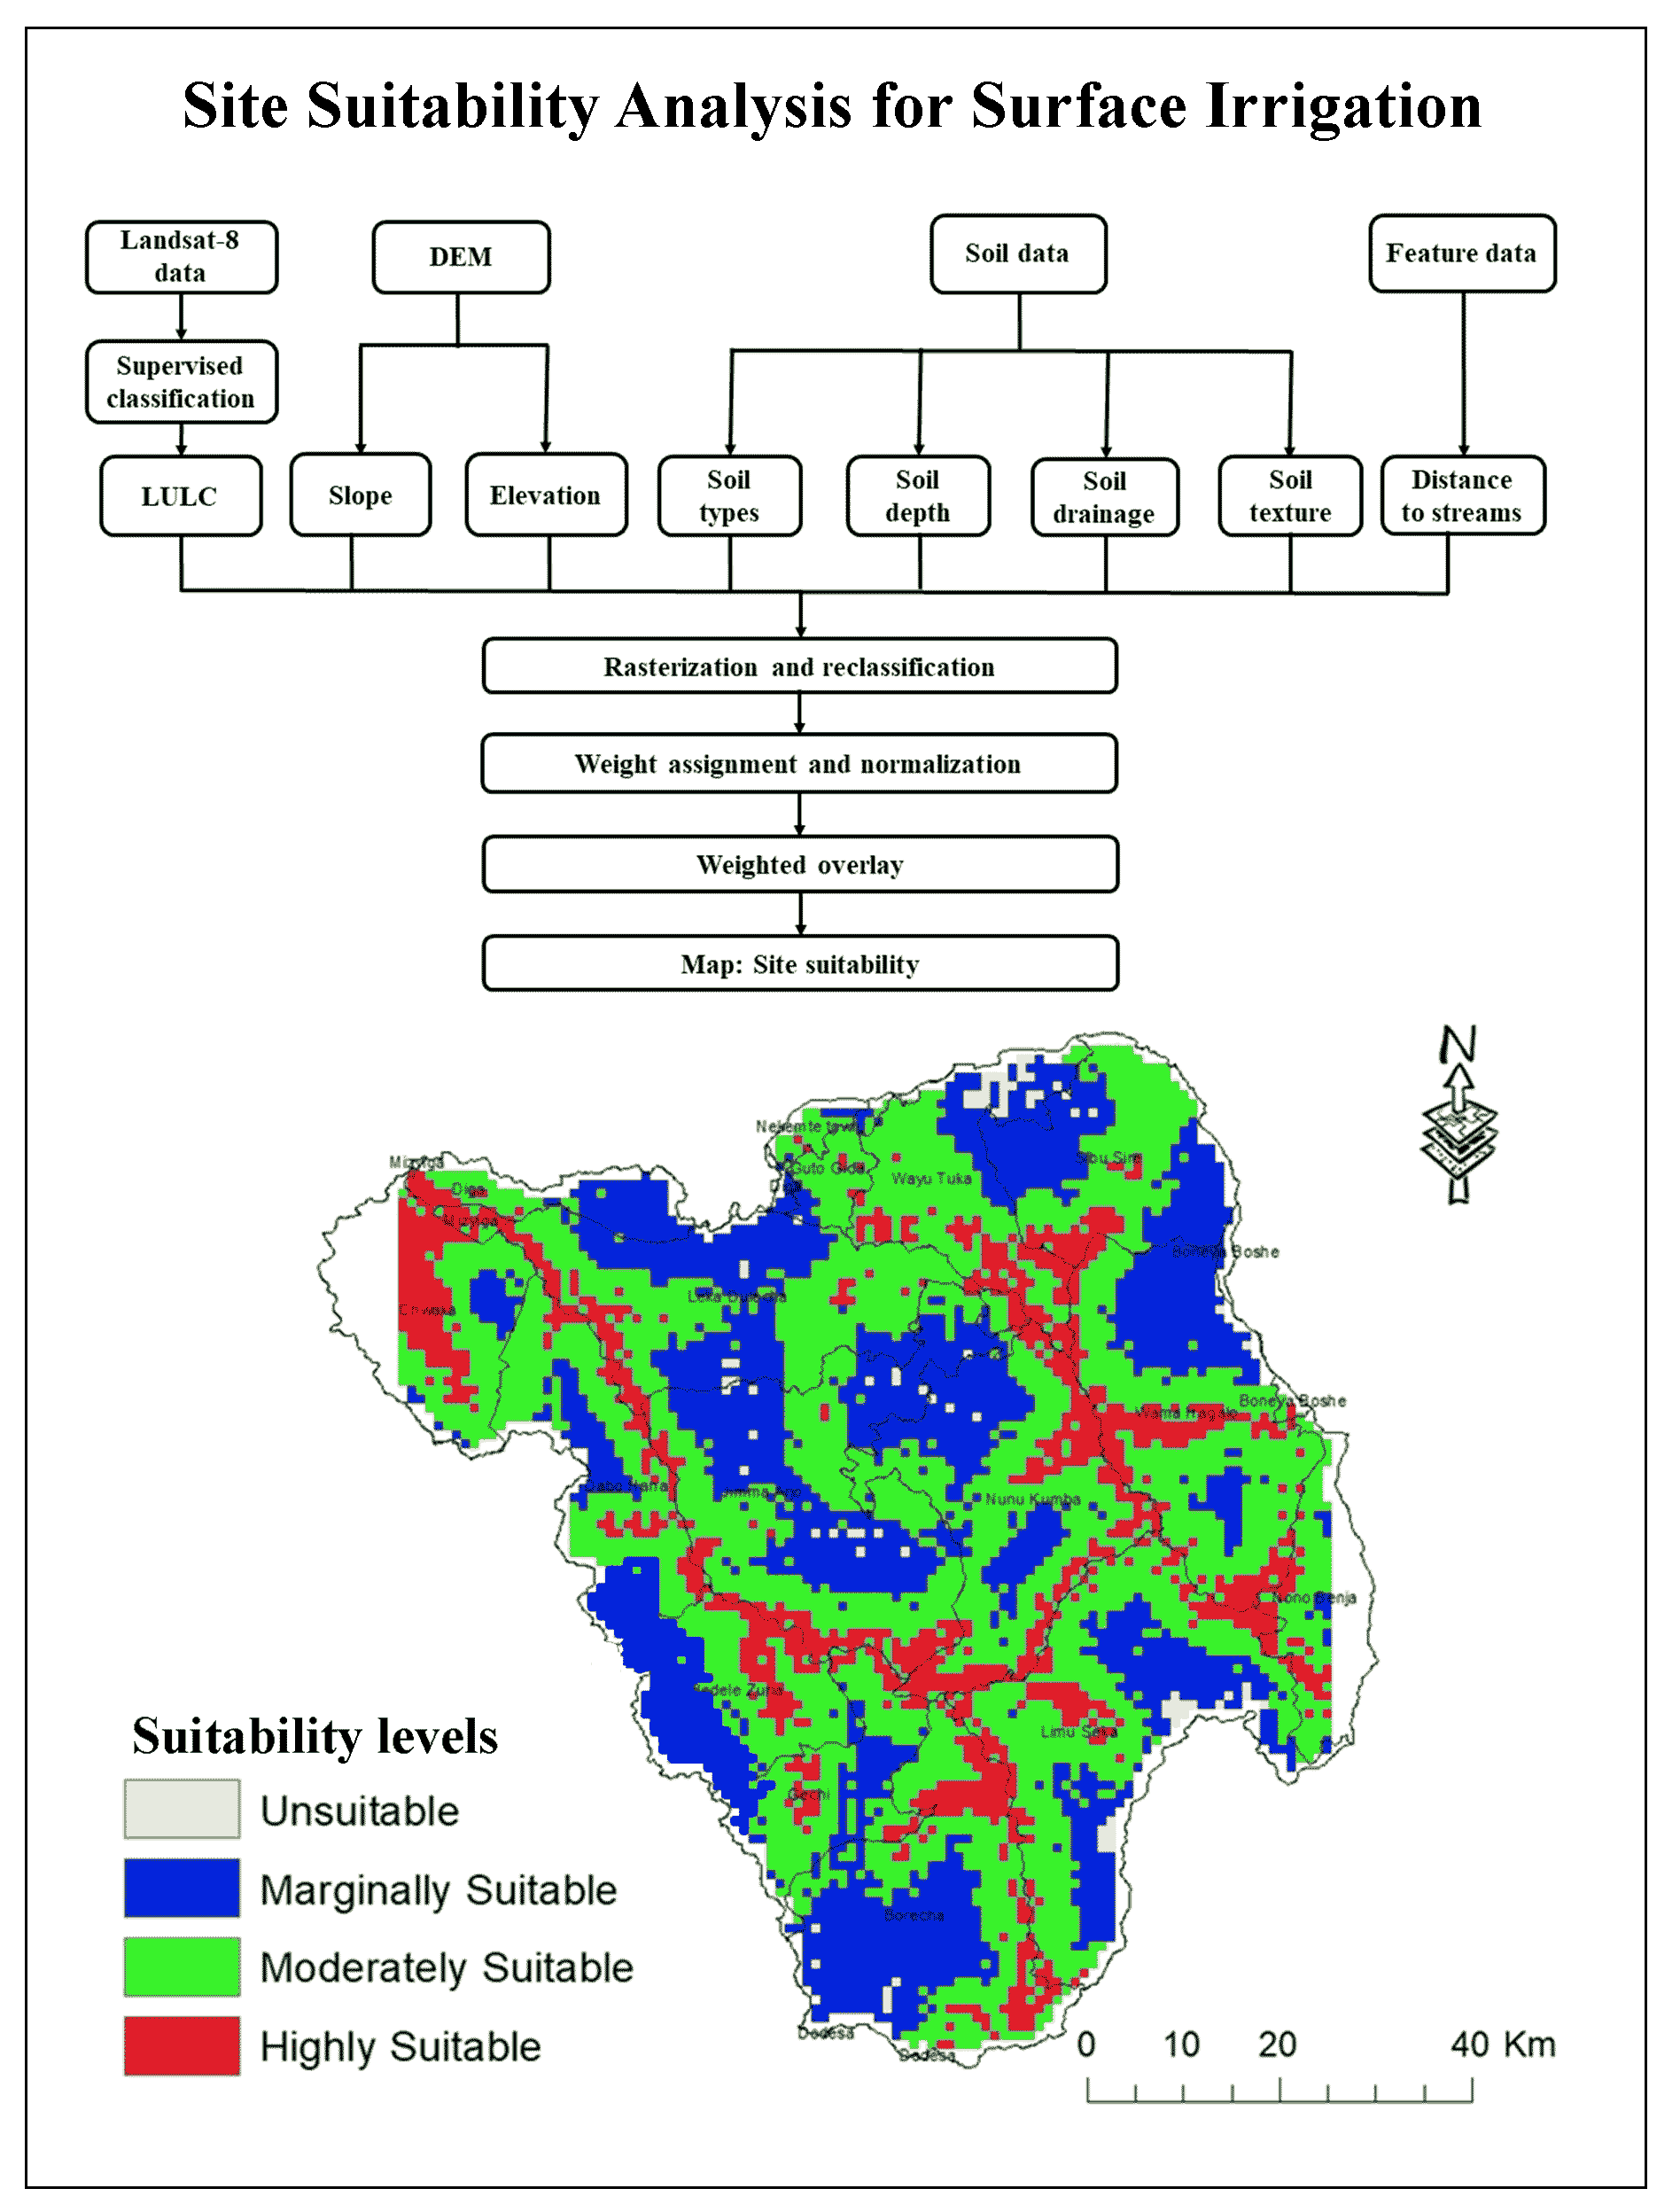
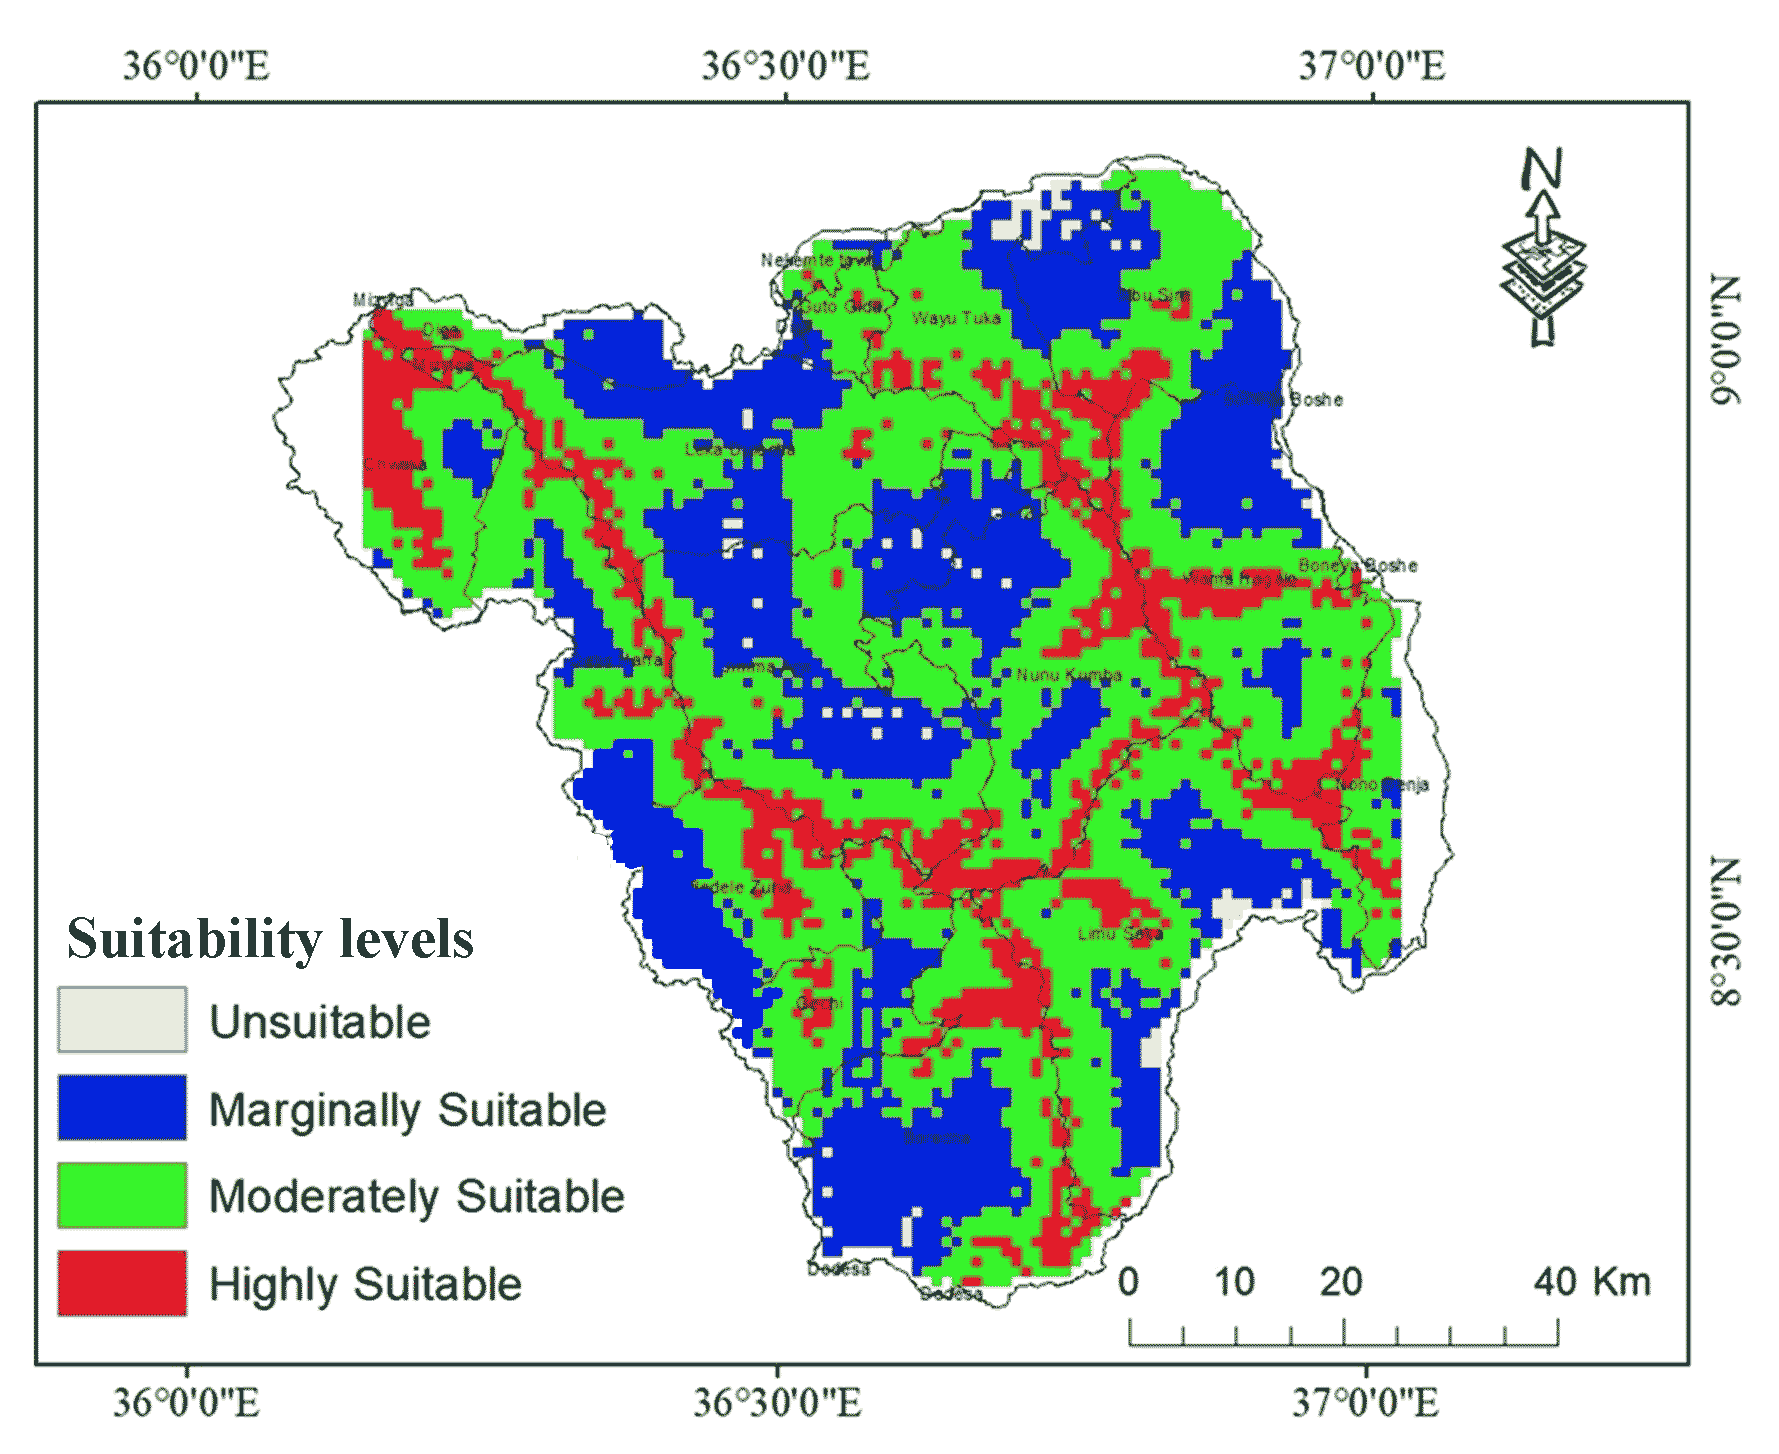
A combined suitability map was produced by the weighted overlay analysis that was done utilizing the factors that were taken into consideration and their relative weights. The final map of suitability displayed the geographic distribution of the land types that were appropriate for surface irrigation (Figure 11). According to the surface irrigation suitability map, 16% (530km2) of the area is inappropriate, 49% (1648km2) is moderately acceptable, 34% (1128km2) is marginally suitable, and 16% (530 km2) is severely unsuitable. From the total study, area 1% (39km2) of the study area is covered by a not suitable area. According to the study, this is frequently caused by being far from the source of water, a steep gradient, excessive drainage, minimal soil depth, high elevation, settlements, forests, water bodies, leptosols, and poor drainage which is consistent with the work of (Aybehon and Tiku, 2022; Hussien et al., 2019). The 34% (1128km2) area was covered by a marginally suitable class (2). Because of its uneven soil drainage, moderate elevation, location just on the edge of a water body, sandy loam soil type, relatively shallow soil depth, and bush land, this region is consistent with the work of (Aybehon and Tiku, 2022; Wubalem, 2021; Hussien et al., 2019). Approximately, 49% (1648 km2) of the overall research region is covered by a class that is just somewhat appropriate (3). Due to the existence of grassland, nitisols, somewhat deep soil, and soil mass that is moderately drained, which is consistent with the study of (Hussien et al., 2019; Negasa and Wakjira, 2021; Wubalem, 2021). Due to the existence of well-draining soil, nitisols type, low raised land, closest to water sources, clay soil texture, and already cultivated lands, the highly suitable class (4) is covered by roughly 16% (530 km2), which is consistent with the work of (Aybehon and Tiku, 2022; Negasa and Wakjira, 2021; Hussien et al., 2019). The overall findings demonstrated that the feasibility of land for surface irrigation within the study region was significantly influenced by physical characteristics including slope, soil depth, soil drainage, soil texture, soil type and altitude.


 ,
Kitesa Merga 2
,
Kitesa Merga 2