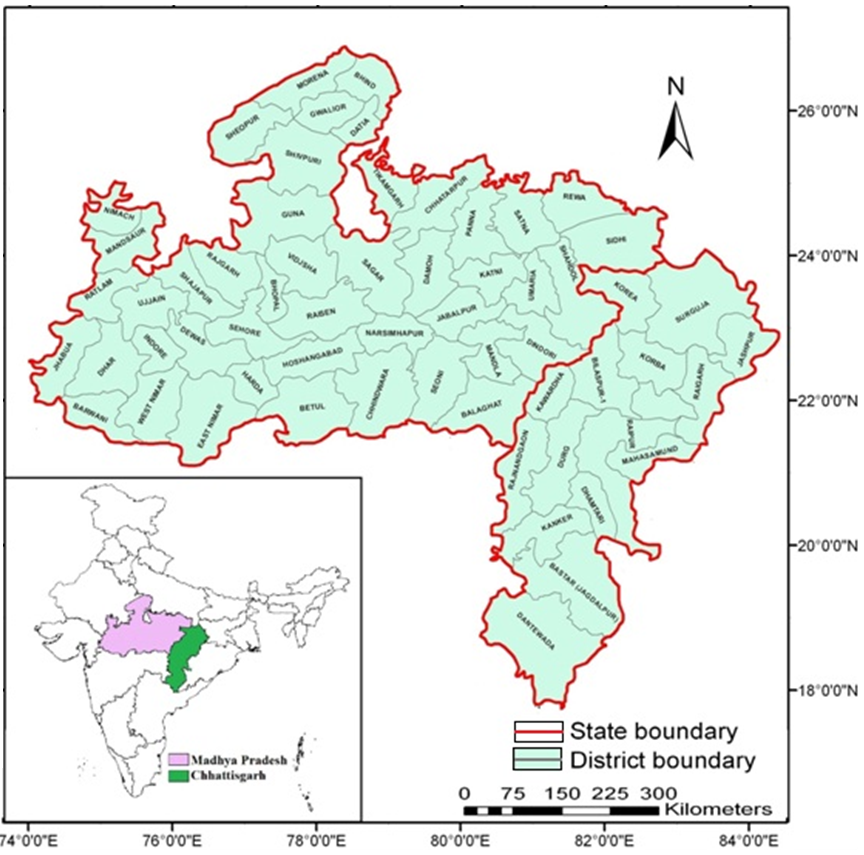
2.1 Study area
Madhya Pradesh is situated in the central part of India (Figure 1) with an area of 305.3 thousand km2 of which forest covers about 31% of the total land area. Chhattisgarh is comparatively smaller state with an area of 135,194 km2 of which 45% is under forest cover. The climate of the region is characterized by a hot summer (March-June), monsoon/rainy seasons (July-October) and a cool/autumn seasons (November-February). The area receives good annual rainfall which ranges between 1400 to 2000 mm.
Malaria in this region is transmitted by two efficient vectors i.e. Anopheles culicifacies and An. fluviatilis. In Madhya Pradesh (MP) and Chhattisgarh districts having more than 25% tribal population have been brought under Enhanced Malaria Control Project (EMCP). The gravity of the problem can be assessed
by the fact that in MP (population 63,668,000), 19% population of the 15 districts of state is under EMCP which contribute 53% malaria and 71.5% P. falciparum cases. Similarly Chhaittisgarh has a total population of 23,070,000 of which 41% are under EMCP, which contribute 91% of malaria and 96% of P. falciparum cases in the state.
2.2 Datasets and Climatic Indicators
District wise meteorological data for 2008 was used for the present study. 2008 was characterized by nearly normal distribution of precipitation (98% of its long period average) over most parts of the country during SW monsoon, normal NW monsoon activity over south peninsula, and comparatively smaller positive temperature anomaly than the previous years (IMD). Previous studies (Gill, 1938; Russel et al., 1946) have considered the influence of temperature and humidity on mosquito to be inseparable. Therefore, temperature and relative humidity were selected as the two indicators for malaria transmission suitability analysis.
2.3 Suitability Mapping Framework
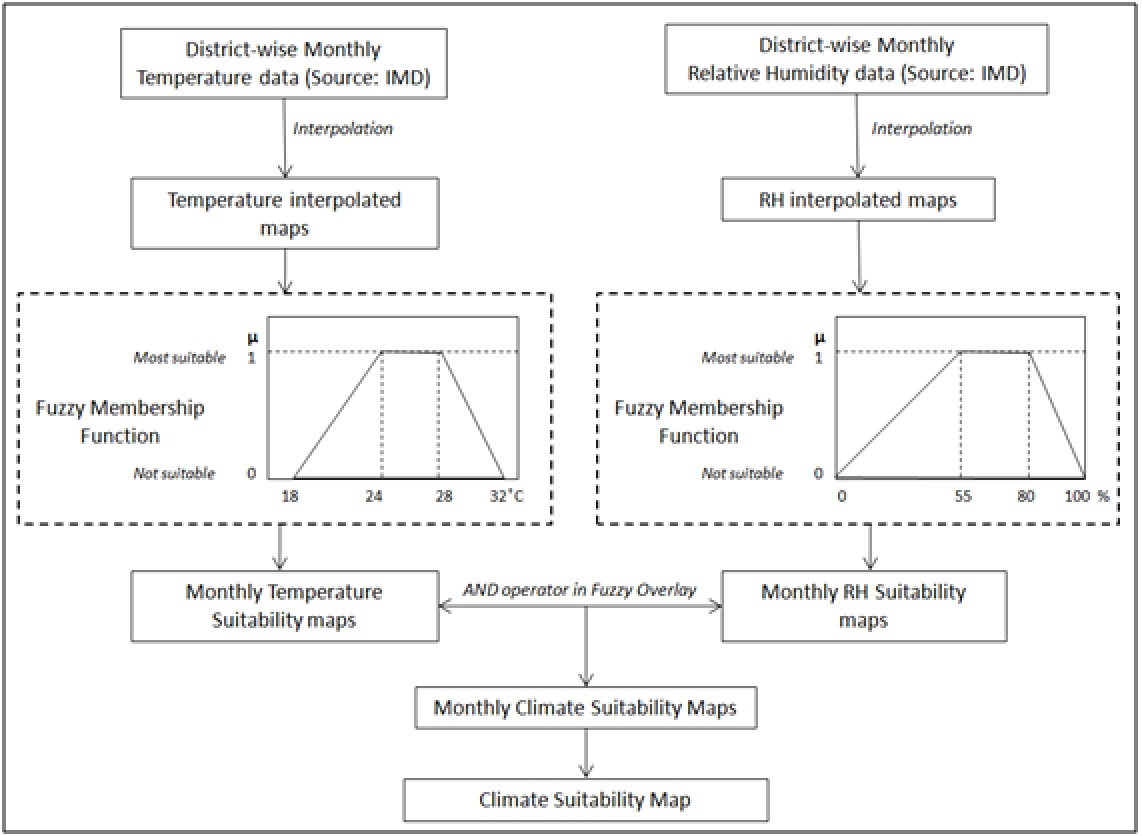
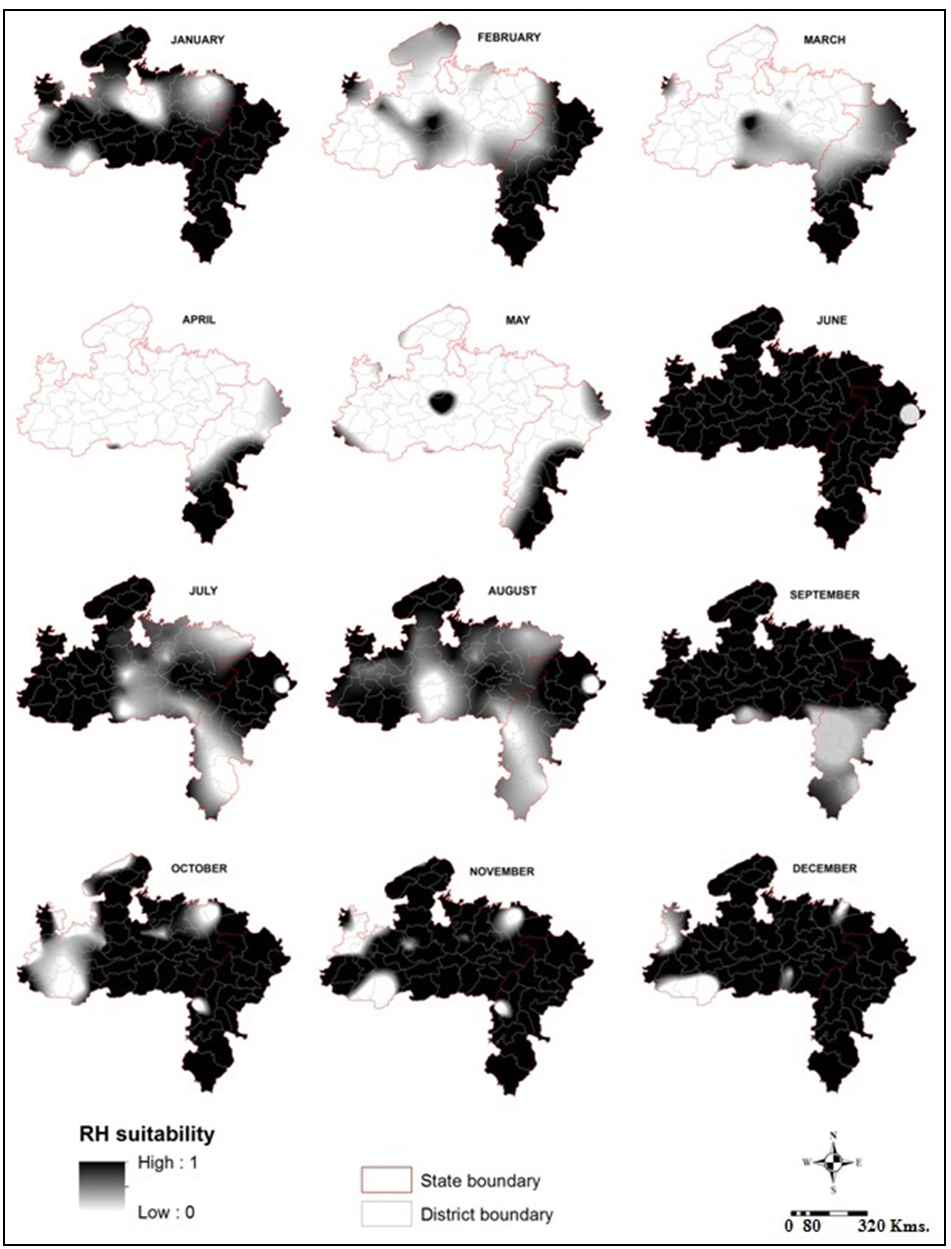
Monthly temperature and relative humidity interpolation maps were generated using ‘Natural Neighbor’ interpolation algorithm. This method allows the creation of highly accurate and smooth surface models from very sparsely distributed datasets (Harman and Johns, 2008). The generated interpolated maps were later classified into fuzzy subsets by fuzzy membership functions. Previous studies have shown that temperature ranging between 18°C and 32°C, and relative humidity between 55 and 80 percent are suitable for malaria transmission (Bhattacharya et al., 2006). However, vector survival is least at humidity less than 40 (Bayoh, 2001; Yamana and Eltahir, 2013). For both the indicators trapezoidal membership function was selected. Arc GIS software and its FUZZY tool were used for the whole methodology. There are various membership functions available in the software: fuzzy Gaussian, fuzzy linear, fuzzy near, fuzzy more, fuzzy MS more, fuzzy small, and fuzzy MS small. Since present study used trapezoidal function, Raster Calculator (with conditional function) was used for fuzzification of the monthly temperature and relative humidity (RH) interpolated maps under trapezoidal membership function, whereby datasets were converted to fractions between 0 (Not suitable) and 1 (Most suitable). For temperature index, ‘a’ represents the lower threshold (18°C), ‘d’ represents the upper threshold (32°C) beyond which the membership function is 0; whereas, ‘b’ and ‘c’ represents 24°C and 28°C respectively, since this range has been identified as most suitable range for malaria transmission (Bhattacharya et al., 2006; Mordecai et al., 2013), the membership function is 1. Similarly for RH scalar parameters a, b, c and d are 40, 55, 80 and 100 respectively, where the membership function for range 55% and 80% is 1, and as the value moves away from the range towards 40 or 100, the membership function decreases to 0 representing ‘not suitable’. Therefore the selected trapezoidal membership functions for temperature (equation 1) and humidity (equation 2).
\(f(x;18,24,28,32) = \begin{cases} \,\,\,\,\,\,\,\,\,\,\,\,\,\, 0,x \leq 18 \\ \frac {x-18}{24-18}, 18 \leq x \leq 24 \\ 1,24 \leq x \leq 28 \\ \frac {32-x}{32-28}, 28 \leq x \leq 32 \\ \,\,\,\,\,\,\,\,\,\,\,\,\,\, 0,x \geq 32 \end{cases} \) (1)
\(f(x;40,55,80,100) = \begin{cases} \,\,\,\,\,\,\,\,\,\,\,\,\,\, 0,x \leq 40 \\ \frac {x-40}{55-40}, 40 \leq x \leq 55 \\ 1,55 \leq x \leq 80 \\ \frac {100-x}{100-80}, 80 \leq x \leq 100 \\ \,\,\,\,\,\,\,\,\,\,\,\,\,\, 0,x \geq 100 \end{cases} \) (2)
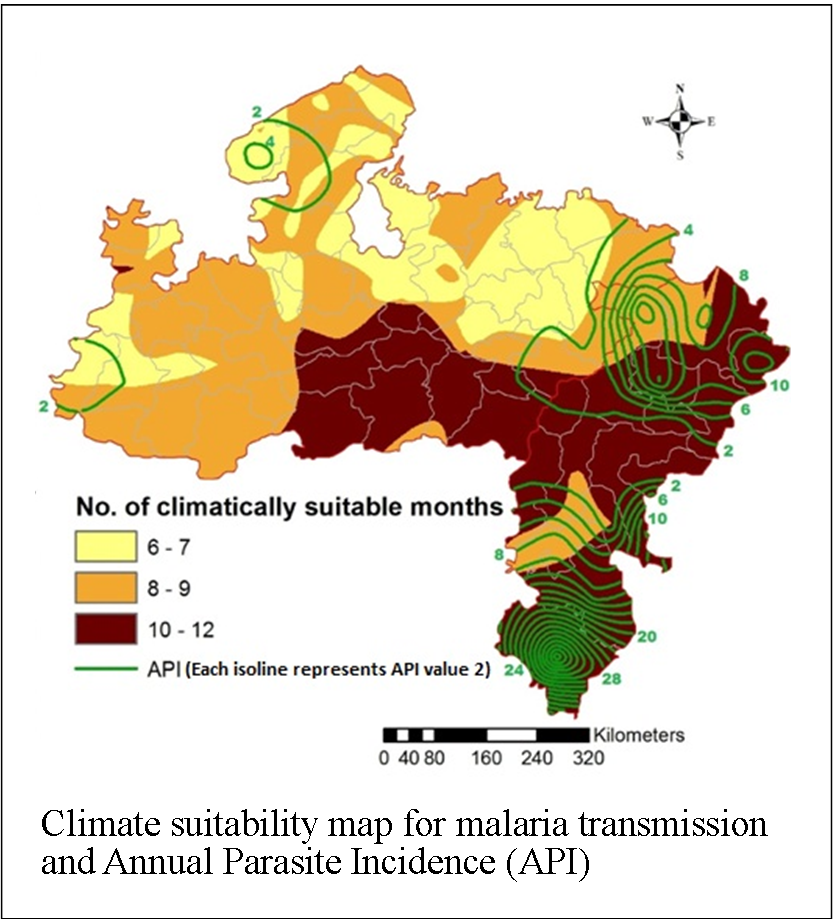
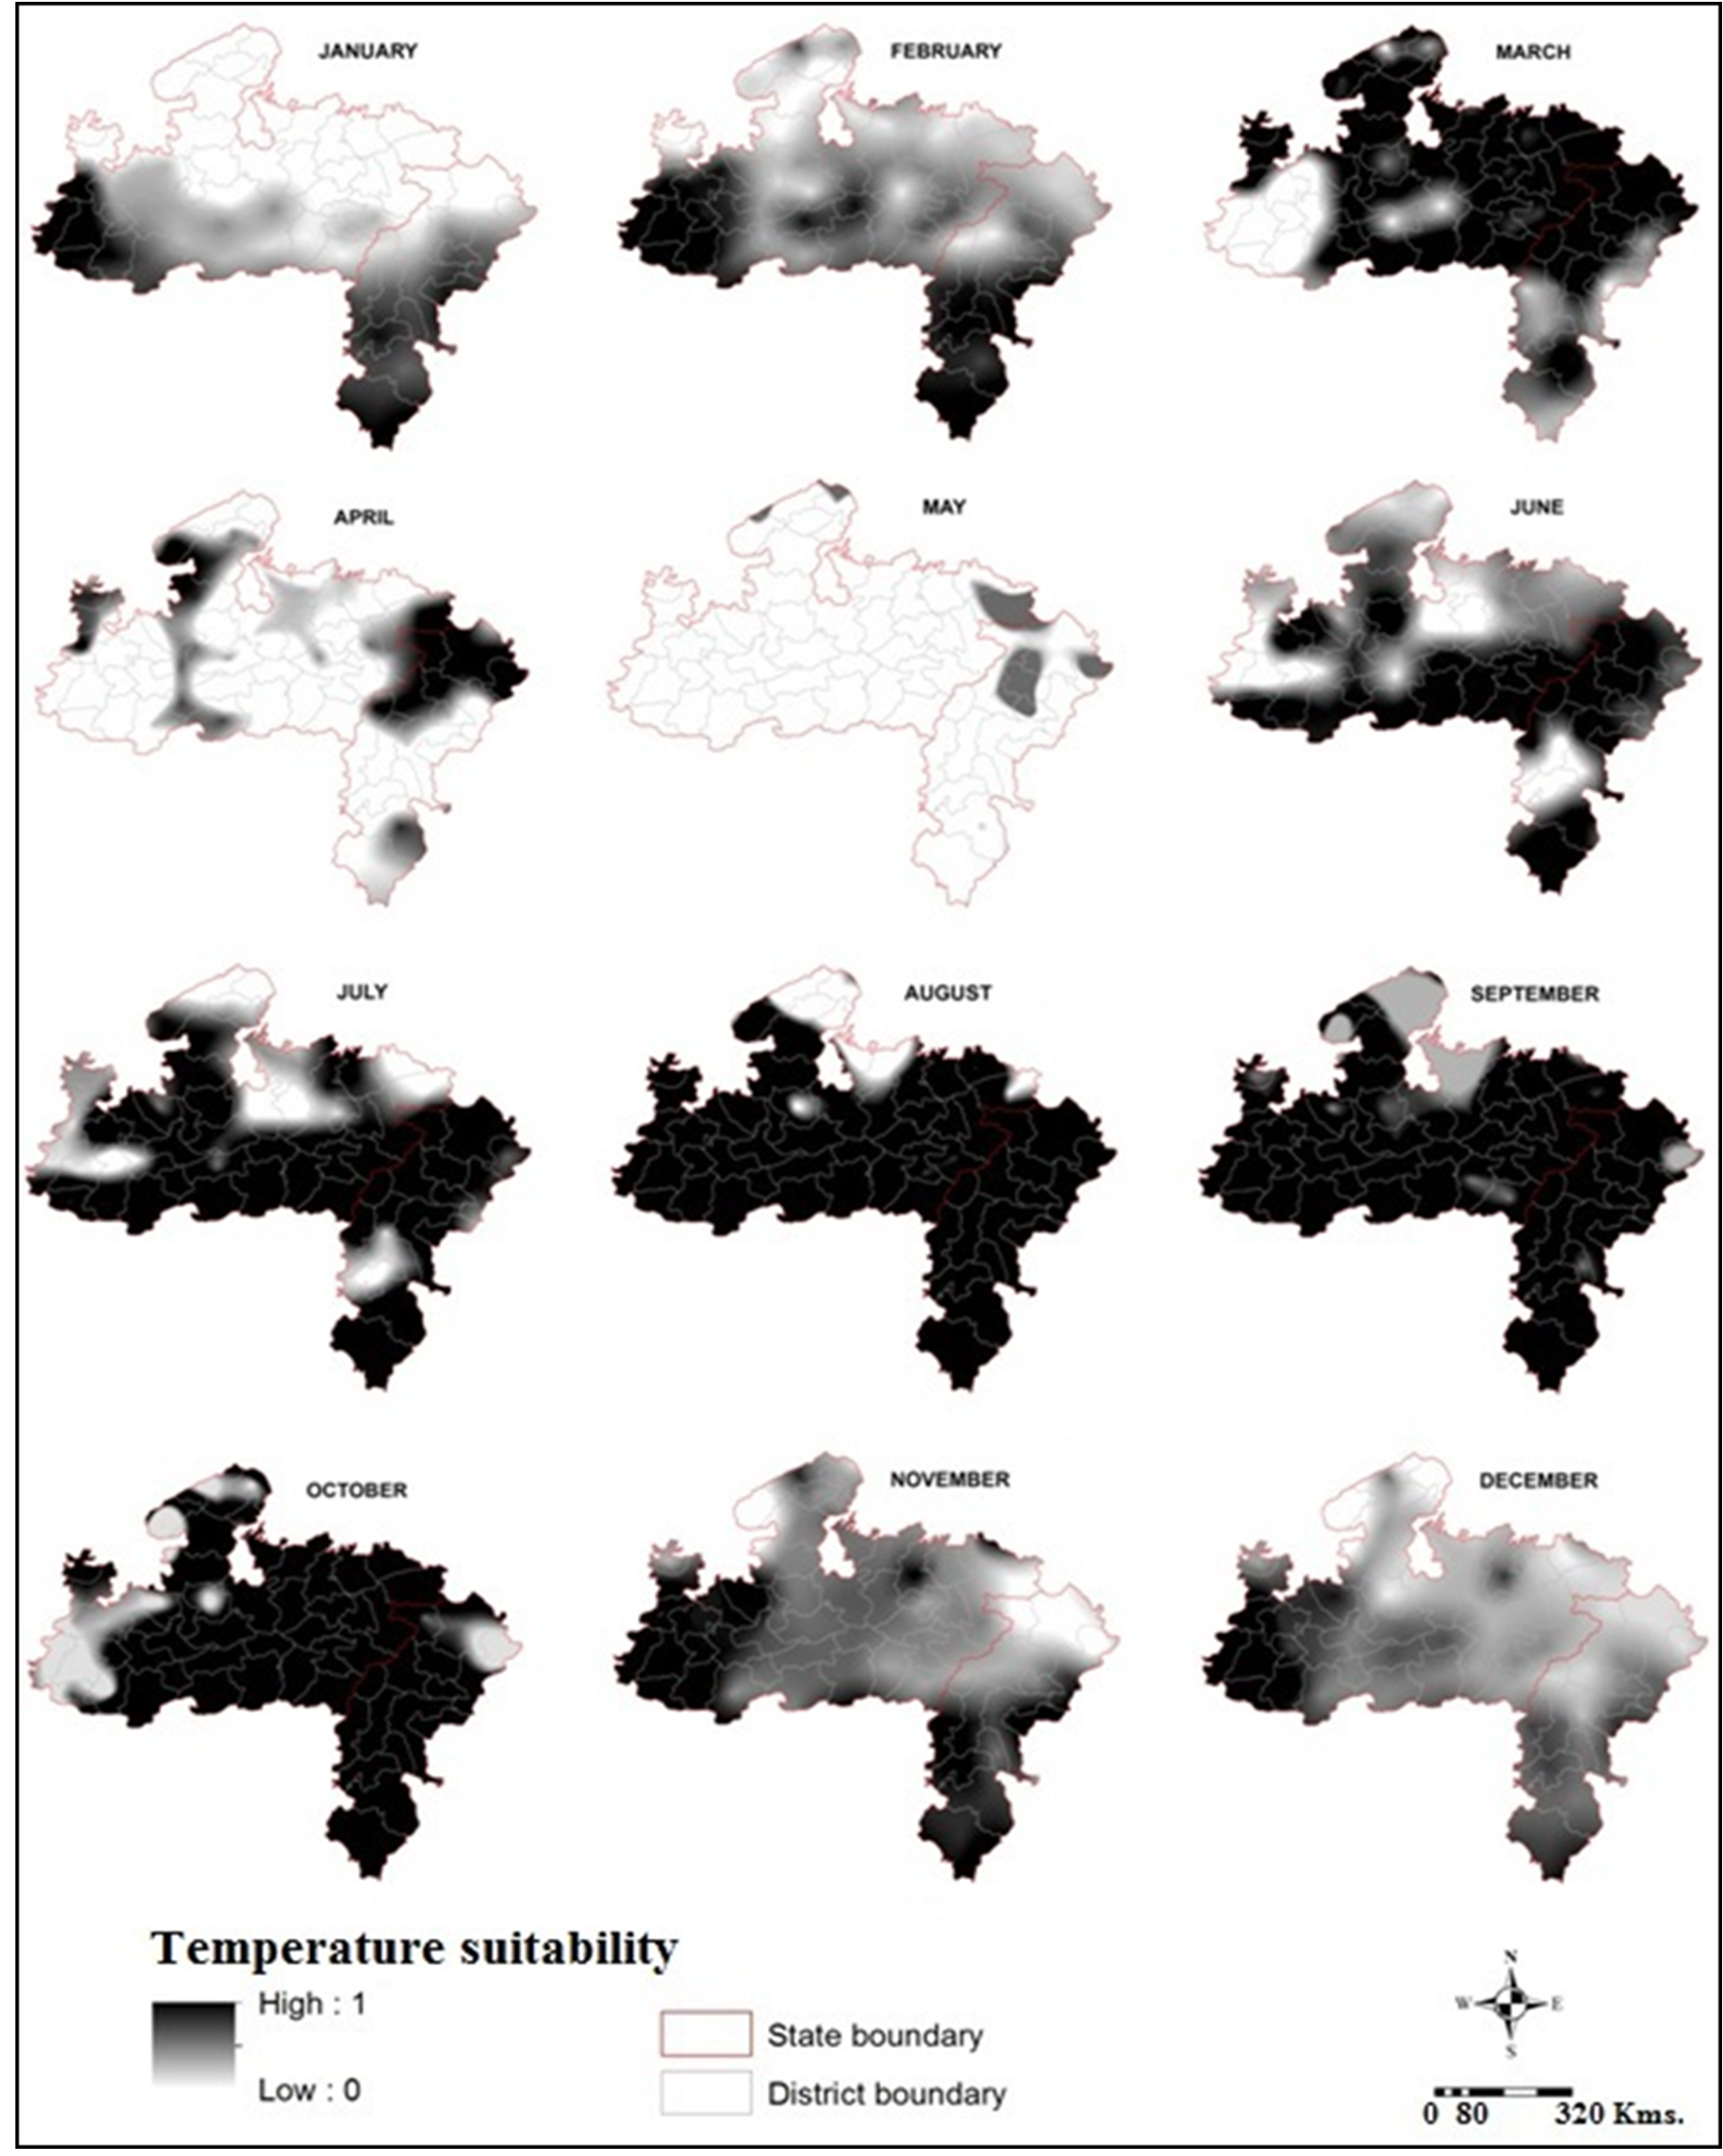
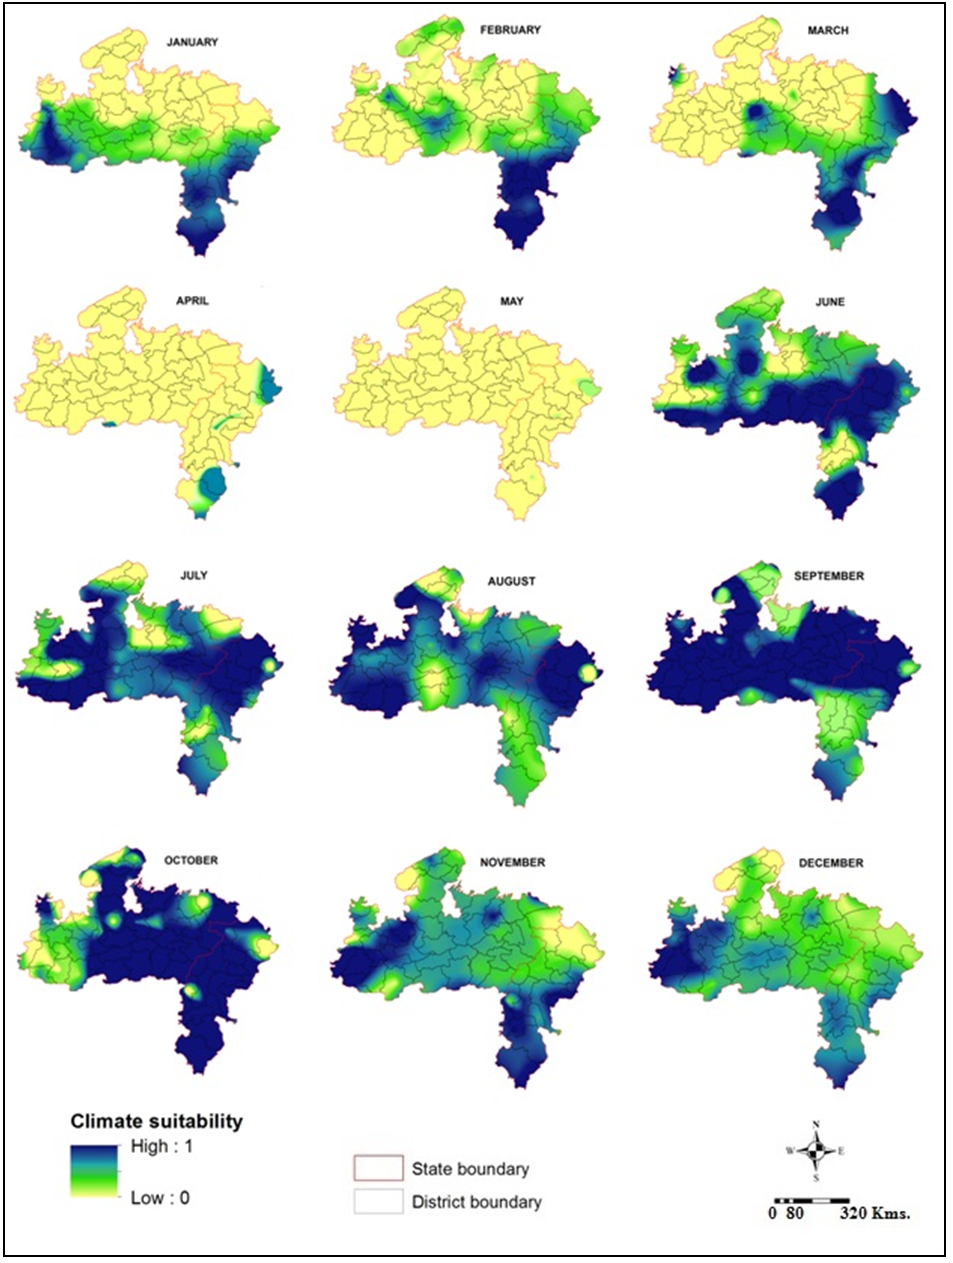
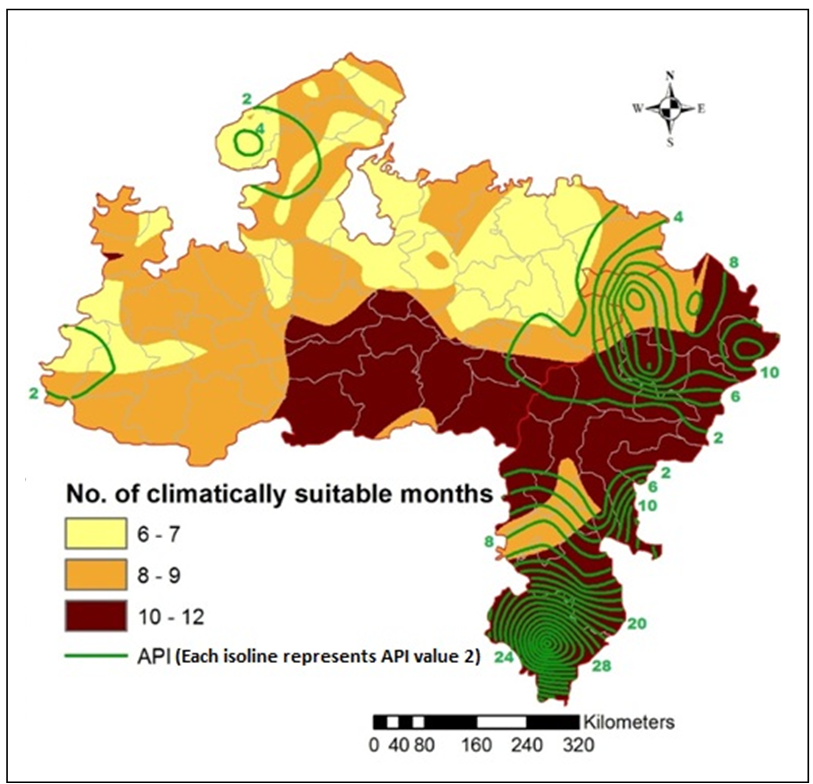
Fuzzy classified monthly temperature maps and relative humidity maps were overlaid through fuzzy intersection based AND operator to generate monthly climate suitability maps. Monthly suitability maps were further aggregated using raster calculator to generate the final ‘Climate Suitability Map’ representing length of transmission windows for 2008 (Figure 2). Further, to analyze relevance of the climate suitability with the malaria cases distributions, 2008 climate suitability map was overlain by the region’s Annual Parasite Incidence (API).


 ,
Soma Sarkar 2
,
Soma Sarkar 2