1 . INTRODUCTION
Poverty is described as a state of deprivation in one’s well-being, and it manifests itself in numerous ways. Low income and the inability to get necessities for a dignified livelihood are two examples. Low levels of health care and education, as well as low productivity, limited access to safe drinking water and sanitation, inadequate physical security, and a lack of capacity and desire to enhance one’s life are all factors (World Bank, 1990). The elimination of poverty in rural areas has been a serious worry for planners and policymakers in emerging countries. Due to the limited collection of policy instruments typically accessible in developing countries’ rural areas, even the most well-intentioned poverty reduction strategy will have imperfect inclusion of poor and leakage to non-poor. Integrating self-selection incentives into the strategy is one way to more effectively reach the disadvantaged. Rural public work projects that require a lot of labor could reach out to the poor and protect them, as well as build and maintain rural infrastructure (Ravellion, 1991). Public welfare schemes, particularly in rural areas, have been identified as effective policy instruments for poverty alleviation and job creation. The self-targeting nature of rural work schemes strengthens the case for them. On the impact of public work programs on poverty alleviation, there is a developing theoretical and empirical literature (Dreze and Sen, 1989; Dreze, 1990; Besley and Coate, 1992). In industrialized countries, self-employment is usually associated with highly educated, risk-taking, wealthy entrepreneurs, whereas in developing countries, it is more closely associated with ‘disguised unemployment’ (Mandelman and Montes-Rojas, 2000). Pigou (1936) has recommended governments to create jobs by engaging on trench-digging and-filling initiatives, which would place purchasing power in the hands of people, which is vital for economic growth. Rural public works could play a significant part in poverty alleviation in such a scenario. As a result, the relevance of interventions through employment schemes in helping the poor break away from the vicious poverty cycle cannot be underestimated (Zaman, 2011). Therefore, large numbers of centrally sponsored schemes were launched to tackle the problems of unemployment and poverty in India. Yesudian (2007) has categorized these programs into wage employment, self-employment, food security and social security schemes. However, previous schemes launched before 1990’s, failed to meet their objectives due to non-utilization of funds (Gopal and Ramula, 1989), complex procedures (Paul, 1984), fragile planning (Hirway, 1985), absence of inter-sectorial links (Government of India, 1985), engrossment of middle men (Ramraddy and Hargopal, 1985), geographic disparity in the disbursement of money (Rao and Rangaswamy, 1988), decreased interest from civil servants (Desai, 1987), engagement of inexperienced and incompetent workers at various levels (Bagchee, 1987) and delayed schemes execution (Saxena, 1987). However, following the 1990s, when the economic liberalization and decentralization processes commenced, poverty alleviation schemes saw a massive spike in employment and asset creation in rural areas. Several research studies (Basant and Kumar, 1989; Chadha, 1997; Chadha, 2003; Mukhopadhyay and Raajaraman, 2007; Kumar et al., 2011; Harish et al., 2011; Bhalla and Singh, 2013) on the diversification of rural employment stated that percentage of employment in the non-farm sector has increased significantly with time and the ability of the agricultural industry to take on more labor force is nearly reached at its peak. Therefore, government sponsored employment schemes like Mahatma Gandhi National Rural Employment Guarantee Act (MGNREGA), Prime Minister's Employment Generation Programme (PMEGP), National Rural Livelihood Mission (NRLM), etc. have to absorb the additional labor force in order to cope up the worsening situation of unemployment and poverty.
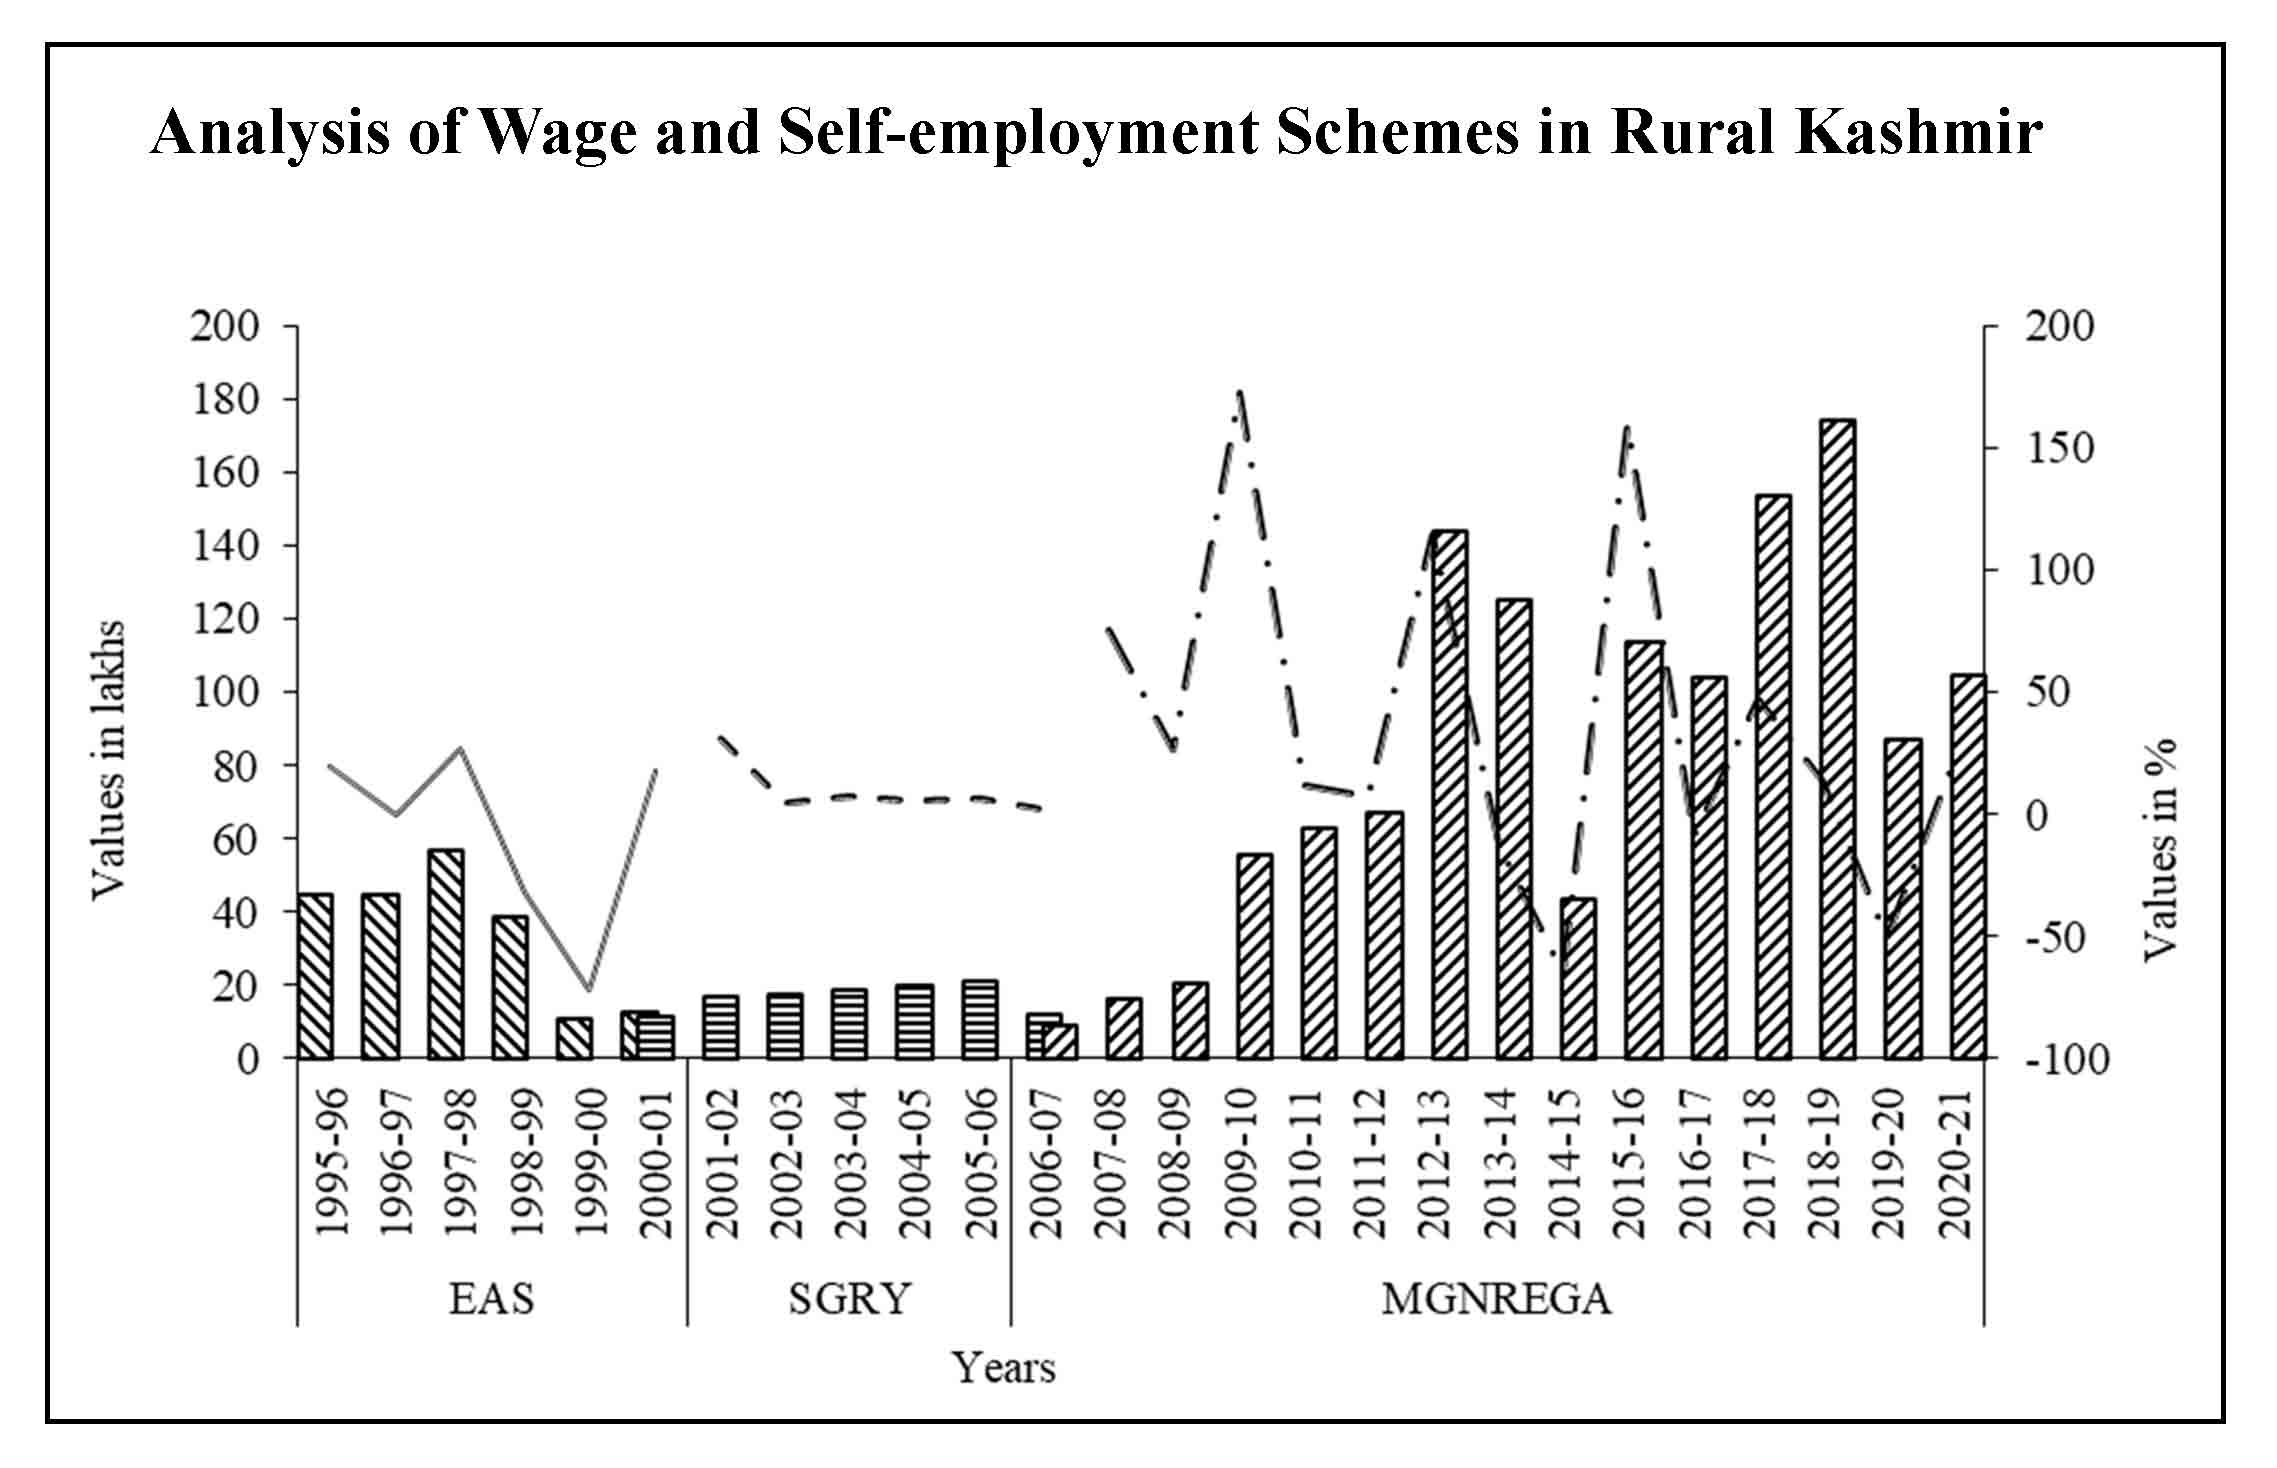
Mahatma Gandhi National Rural Employment Guarantee Act (MGNREGA) is an example of a program that employs millions of people in India each year. In Kashmir, the introduction of the foregoing schemes has manifested in visible improvements in people’s lives, in addition to curbing stress migration and offering work possibilities at their door steps (Economic Survey, 2017). It is now universally accepted that offering job opportunities at regular intervals could be one of the most short-term remedies to poverty. It has been noted that centrally financed poverty alleviation schemes have contributed a crucial impact on the creation of employment in Kashmir’s provisional regions, however; the data reveals fluctuating trends in number of employment days and growth rate. In the Kashmir division of Jammu and Kashmir UT, the Employment Assurance Scheme (EAS) generated 28.19 lakh person days of employment on average from 1994-95 to 2001-02, 16.22lakh by the Sampoorna Grameen Rozgar Yojana (SGRY) from 2000-01 to 2006-07, and 1.05 crore person days by MGNREGA from 2010-11 to 2020-21 (Directorate of Rural Development, Srinagar, Jammu and Kashmir, 2021). Even though poverty alleviation programmes in rural Kashmir have created short-term jobs, they have not been carried out in an honest framework. These schemes must be streamlined so that the benefits reach the intended recipients and rural prosperity can be achieved. The adoption of employment schemes such as MGNREGA has aided both human resource and economic growth (Rajamohan and Dhanabalan, 2013).
According to the Centre for Motorizing Indian Economy (CMIE, 2021) report, the Jammu and Kashmir unemployment rate of 22.2% is much higher than India’s national average of 7.1%. In addition to this 70% of the population live in the rural areas and heavily relies on agricultural jobs. Farmers occupy small and marginal land holdings and the agricultural system is predominantly subsistence in character. The varied topographic features compelled with harsh climatic conditions leave rural people jobless especially during long winters. The preponderance of the rural poor that do not have access to land compelled to rely on agricultural employment, which has extended seasonal downtimes. In such a circumstance, public works and self-employment enterprises in rural locations can play a powerful and essential role in lifting people out of poverty. Therefore, the present study wants to assess the trends of major employment generation schemes and their impact on economic upliftment of rural people. Furthermore, the study identified the various loopholes associated with these schemes and suggested remedial measures in Kashmir valley.
2 . STUDY AREA
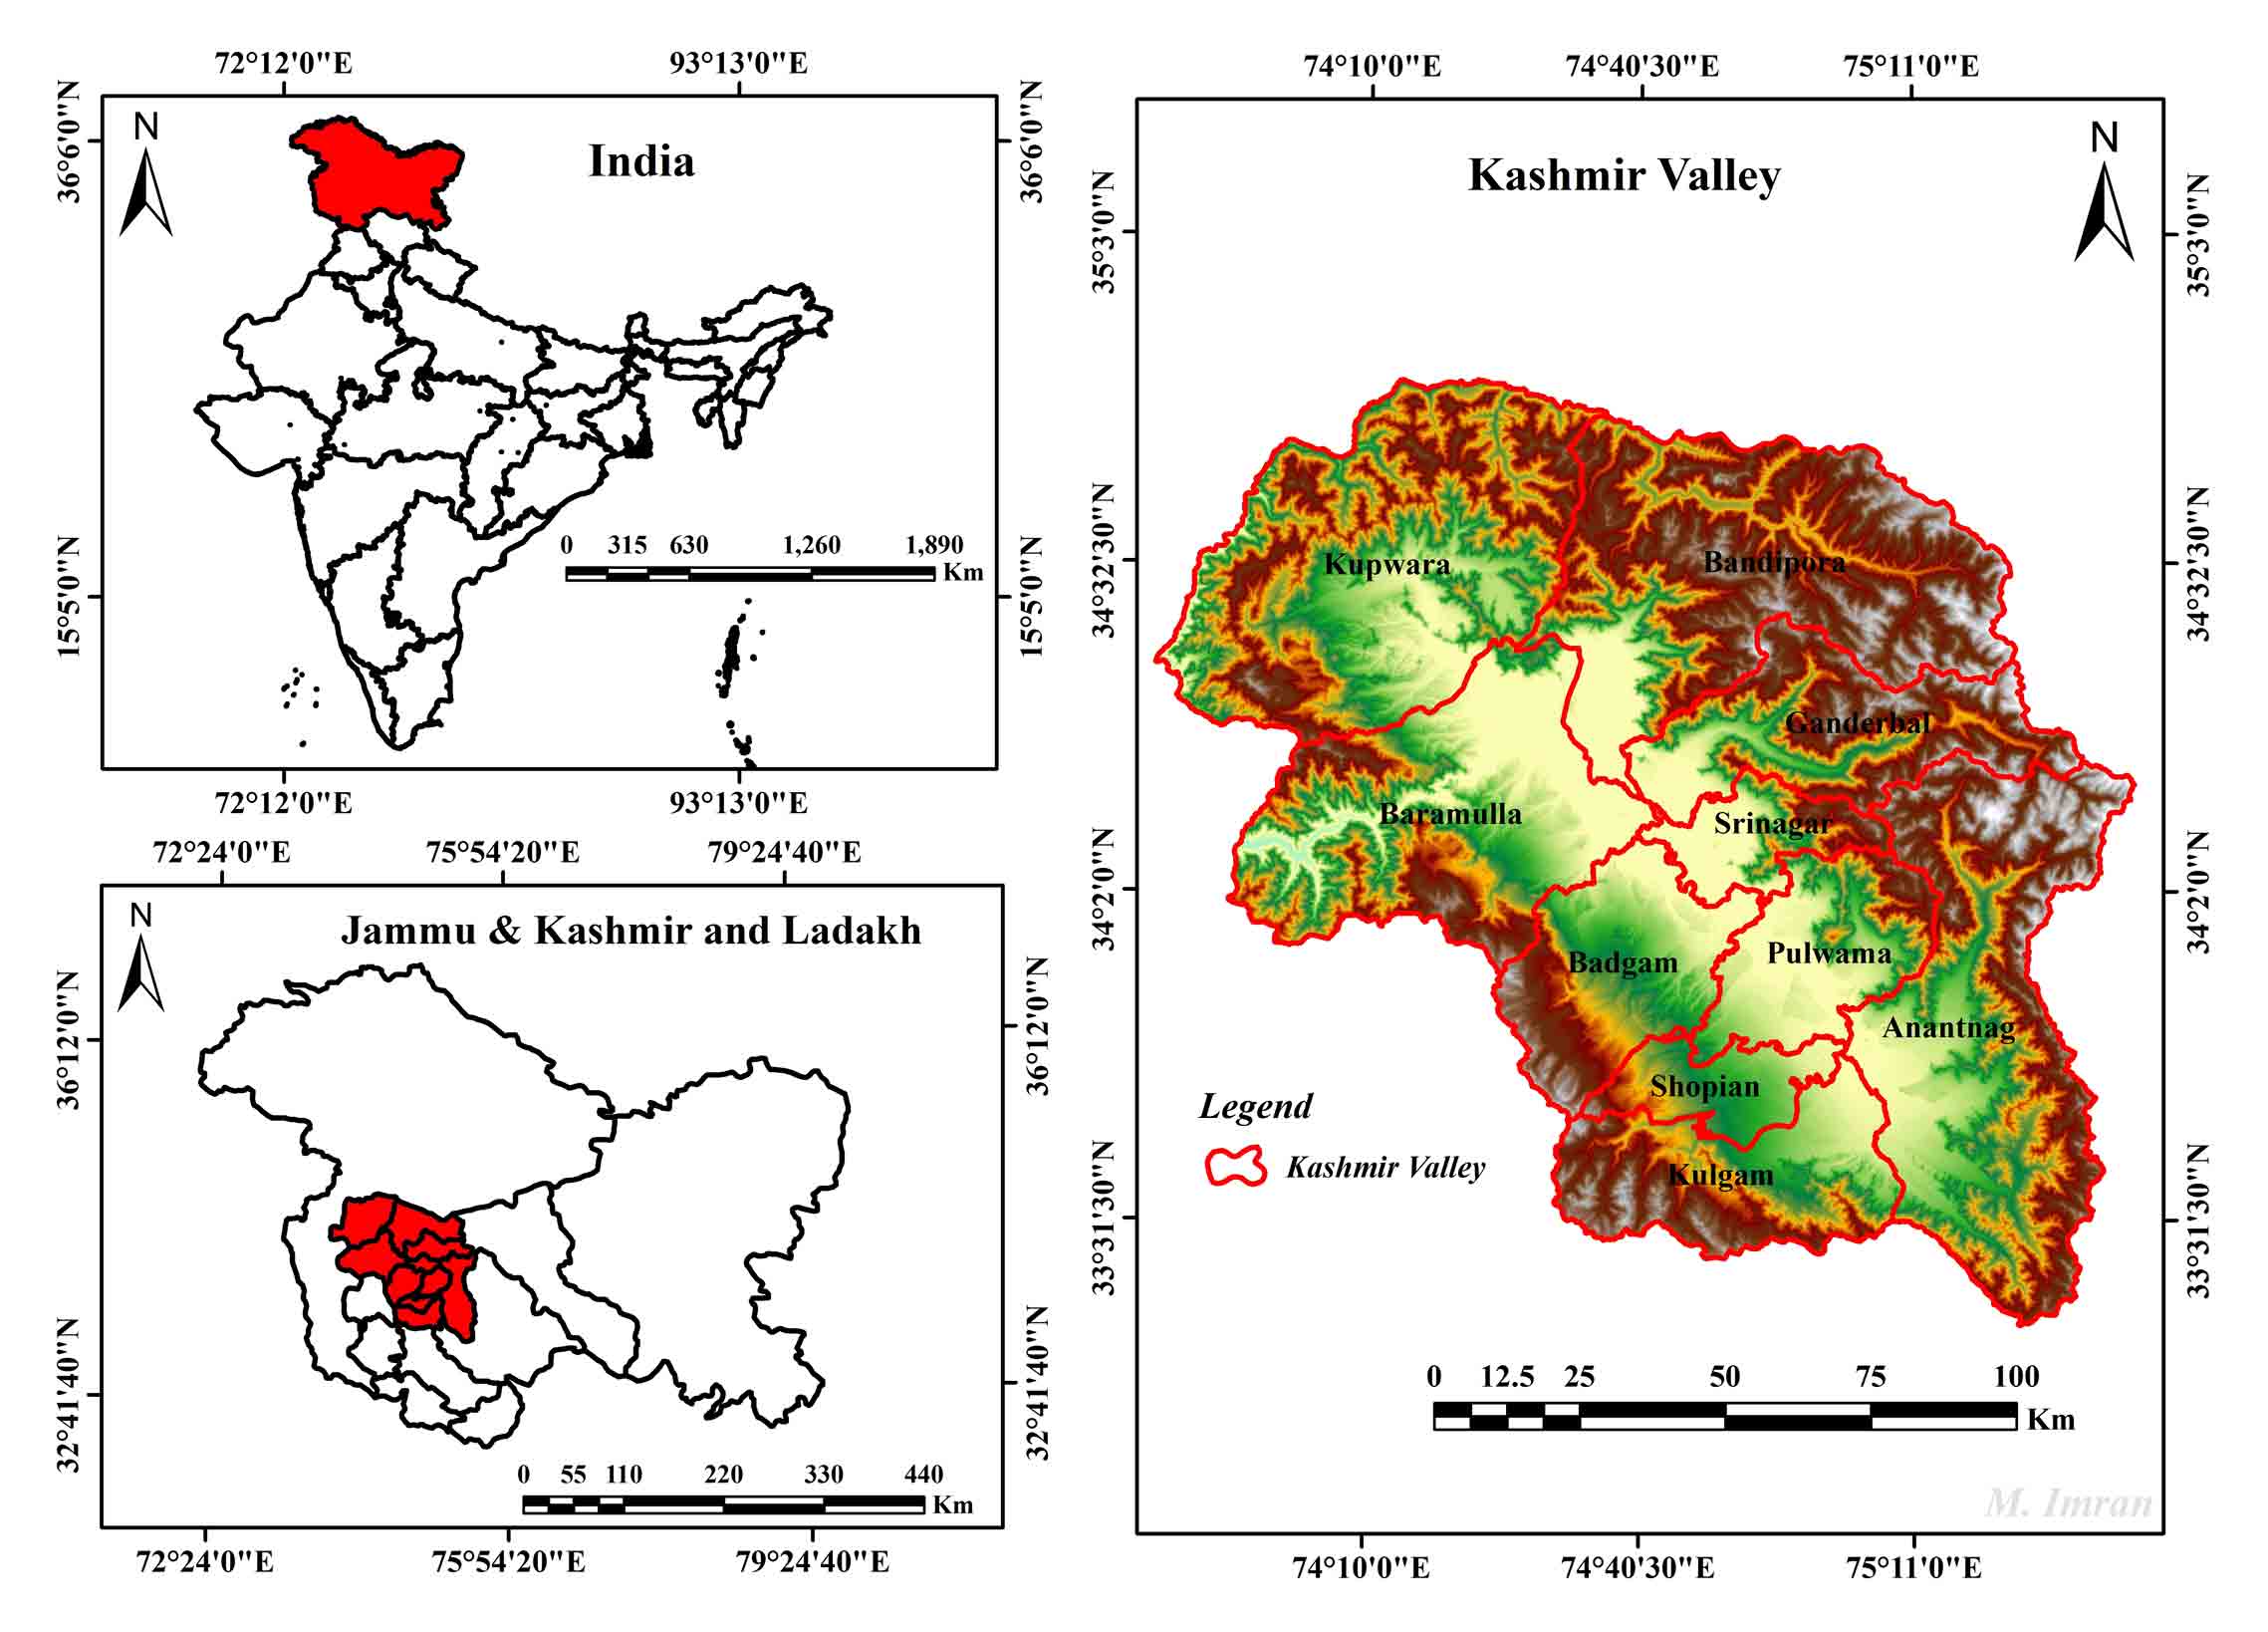
The Kashmir valley is a geographically distinct entity (Figure 1). It is one of the three meso-regions (Jammu, Kashmir and Ladakh) of the erstwhile state of Jammu and Kashmir (Lone et al., 2022). It is a newly formed union territory in India’s far northwestern corner. A total of 15,853 km2 is covered by the oval-shaped valley, which extends between 33°30' and 34°40'N and 73°45' and 75°35'E (Lone et al., 2022). The Kashmir valley, a geological intermountain basin, is bounded by the Greater Himalayas to the northeast and the lesser Himalayas (Pir-Panjal range) to the southwest (Burbank and Johnson, 1983; Lone et al., 2022a). The Kashmir Valley stretches 140kms North to South and 45 kms East to West in 10 districts. The valley is a significant relief feature that defines the region’s natural and cultural environment (Lone et al., 2022). The valley has a temperate climate (Kaul, 2001). As per the 2011 census, the population of Kashmir valley is 69.1 lakh. The rural population is more than 70% (Ghuman and Singh, 2018). People rely heavily on agriculture and horticulture-related activities (Lone et al., 2022a; Ganaie et al. 2022). Moreover, the tourism industry contributes a significant proportion of people’s income (Singh and Unjum, 2016).
4 . METHODS
Karl Pearson’s correlation, Regression technique, knowledge index and weighted average have been used to analyze the data.
4.1 Regression
The log-linear model has been used to find out the casual relationship between the employment generated and funds utilized. In the log-linear regression with a single independent variable, it is the same as the square of the correlation between dependent and independent variable. As a result, the regression equation displays the percentage of variation in employment generation due to variations in fund utilization. We chose the log-linear model based on the coefficient of determination (R2) and t values. The log-linear model has the advantage that the co-efficient of the log-linear model gives the respective elasticity value. The mathematical representation of log-linear regression model used in the study is given by the following equation (Tofallis, 2009).
LnY = a + blnX
where, X is the fund utilization (independent variable) and Y is the employment generated (dependent variable). The slope of the line is b (beta) is regression coefficient, and a (alpha is constant) is the intercept (the value of y when x = 0).
4.2 Correlation
The correlation refers to the statistical relationship between the two entities. It measures the extent to which two variables are linearly related. The correlation coefficient (r) is a measure of linear correlation between two sets of data. Karl Pearson’s correlation coefficient has been calculated by using the formula (Gujarati and Porter, 2009).
\(r_{xy} = {n \sum XY-\sum X \sum Y \over \sqrt {[n\sum X^2-(\sum X)^2] [n\sum Y^2-(\sum Y)^2]}}\)
The variables used for correlation analysis are given in Table 5 where X represents increase in income and Y represents the other variables (household expenditure, hospital and medical expenses, education of the children and savings) used for analysis.
4.3 Knowledge Index
Based on the response of participants, Total Knowledge Score (TKS) and Knowledge Index (KI) was generated which was used for identifying the levels of awareness among respondents about self and wage employment schemes.
The TKS was calculated by using the following formula:
\(TKS =[\sum Y - \sum N] = (100 \leq TKS \leq -100)\)
The KI was calculated using the following formula
\(KI =\sum TKS/100 = (+1 \leq KI \leq -1)\)
The TKS value ranges from -1 to + 1 where a negative value was classified as inelastic knowledge and the positive value as elastic knowledge. In summation, if the number of positive respondents is more than the negative responses, the knowledge of the respondents about Centrally Sponsored Schemes (CSS) would be deemed to be elastic and vice versa. A low and negative knowledge index indicates that the scheme is least known by the respondents; whereas a high and positive index indicates that the knowledge of respondents is high for that scheme. Previous application of the indices can be found for Construction Managers (CM-RII) in Chileshe et al. (2005a) (2005b) and Love et al. (2001).
4.4 Weighted Average
An arithmetic average known as a weighted average is one in which some components of the data set are given greater weight than others. In other words, the mean average is determined after each number that has to be averaged is given a certain weight. In this study, weighted average was calculated by multiplying each number by its weight and the results were added. Subsequently the variable which recorded maximum value was ranked at number 1 and vice versa.
5 . RESULTS AND DISCUSSIONS
5.1 Wage Employment Schemes
The wage employment schemes like MGNREGA and SGRY helps in creation of food security, stop distress migration and construct long-lasting economic assets in the rural areas. Besides, 100 days of wage employment are provided annually to each rural household registered in these schemes. Wage employment schemes serve dual purpose. On one hand, absolute poverty measured in terms of head count ratio is addressed by providing employment directly to the individuals and on the other hand, the problems of relative poverty are being solved by the construction of long term assets and infrastructure in the rural areas. A large number of wage employment schemes were launched in India since independence but the success rate of the schemes were low that most of the schemes were discontinued or reformed. The most essential among the wage employment schemes were Food for Work Programme (FWP), National Rural Employment Programme (NREP), Rural Landless Employment Guarantee Programme (RLEGP), Jawahar Rozgar Yujana (JRY), Employment Assurance Programme (EAS), Swarozgar Grameen Rozgar Yojana (SGRY), and Mahatma Gandhi National Rural Employment Guarantee Act (MGNREGA). Among the aforesaid mentioned schemes, MGNREGA has achieved a significant success towards the generation of employment in the rural areas.
One of the significant schemes towards this direction was Employment Assurance Scheme (EAS) which was the modified version of Jawahar Rozgar Yojana (JRY). The mandate of the scheme was not only to provide wage employment but also to supplement food grains among the beneficiaries of the scheme.
On an average, 34.66 lakh of employment days were supplemented to the rural poor with the maximum in 1997-98 and minimum in 1999-00 in rural Kashmir (Figure 2). The scheme was reformed into SGRY scheme in 2000-01. Under SGRY scheme, on an average, 16.31 lakh person days of employment were generated annually, and 1609.22 lakh of Funds were utilized annually in the Kashmir division of the erstwhile state. The maximum number of employment days were generated in 2005-06 and minimum in 2001-02.
Owing to its low performance, SGRY was reorganized and MGNREGA came into existence in 2006. In the first phase, 200 regressive districts were selected under this scheme and on April 1, 2008, all the rural districts were covered in the country under this flagship program. In Jammu and Kashmir, Kupwara and Doda district were covered in the first phase in 2006 and subsequently other districts were covered from April 2008. MGNREGA has achieved a tremendous success in terms of employment creation and construction of long-lasting assets allover rural India.
Table 1 illustrates the achievements of MGNREGA scheme in the Kashmir Division of Jammu and Kashmir. A total number of 552384 job cards had been issued under this scheme since its inception in Kashmir Division of Jammu and Kashmir. On an average 221614.18 households work annually under MGNREGA since 2010 which accounting for more than 25% of the total households of the region with maximum number of 296656 households (HH) in 2018-19 and minimum number of 113746 HH in 2010-11. MGNREGA absorbs a sufficient amount of unskilled rural labor pool of the valley with an average 353252 persons being employed annually under this act since its inception with the maximum number of (493289) persons recorded in 2018-19. The success of MGNREGA scheme can be highlighted from the fact that on an average, 11.64 crore of person days of employment have been generated since 2011 which is seven times more than employment generated under EAS/SGRY scheme. Despite the fact that MGNREGA offers 100 days of employment for every HH who demand it but so far; on an average, 46.36 days per HH of employment have been generated under this act with the maximum 59 days recorded in 2018-19 and lowest recorded in 2014-15. MGNREGA program has performed effectively well since its beginning barring the financial years of 2014-15, 2016-17 and 2019-20 which witnessed political turbulence and the outbreak of COVID-19 pandemic. Providing employment or employment allowance to job card rural households during the COVID-19 has been the striking feature of MGNREGA program. There is virtually no question that the MNREGA is an innovative measure of legislation with no equivalent scheme anywhere in the world. However, several points must be made in order to understand the true motivation of wage employment programmes (Hajam et al., 2021).
Table 1. Achievements of MGNREGA Program
|
Years
|
Job cards distributed (105)
|
(HH) worked (105)
|
Total persons employed (105)
|
Average employed days (PHH)
|
Employment days generated (105)
|
|
2010-11
|
2.36
|
1.13
|
1.78
|
41.41
|
471.06
|
|
2011-12
|
3.09
|
1.45
|
2.29
|
46.22
|
670.57
|
|
2012-13
|
4.25
|
2.54
|
4.40
|
56.51
|
1437.28
|
|
2013-14
|
4.64
|
2.62
|
4.01
|
47.69
|
1253.69
|
|
2014-15
|
5.04
|
1.32
|
1.87
|
33.09
|
437.76
|
|
2015-16
|
5.38
|
2.59
|
4.13
|
43.8
|
1136.46
|
|
2016-17
|
5.16
|
2.30
|
3.69
|
45.12
|
1039.53
|
|
2017-18
|
5.22
|
2.89
|
4.72
|
52.86
|
1532.62
|
|
2018-19
|
5.40
|
2.96
|
4.93
|
58.85
|
1742.68
|
|
2019-20
|
5.46
|
2.19
|
3.40
|
39.55
|
867.82
|
|
2020-21
|
5.52
|
2.33
|
3.57
|
44.9
|
1047.77
|
Source: Directorate of Rural Development Office, Srinagar, Jammu and Kashmir.
5.2 Self-employment Schemes
Along with the wage employment schemes, self-employment schemes were also introduced from time to time to provide financial support in the form of loan and subsidy to the beneficiaries both individuals and self-help groups to set up their own businesses with the view to bring out the supported beneficiaries out of poverty. The major schemes of such nature include Integrated Rural Development Programme (IRDP), Swaranjayanti Gram Swarojgar Yojana (SGSY), Prime Minister’s Employment Generation Programme (PMEGP) and National Rural Livelihood Mission (NRLM). In Jammu and Kashmir, Under SGSY, 7622 Self- Help Groups were formed during 2001 to 2007 with the maximum in Anantnag and minimum in Kupwara. Women self-help groups accounted 16% of the total. These SHG’s were mostly engaged in the primary activities as more than 50% of the subsidy and credit were paid for the primary sector. Most of the groups ceased to work soon after their formation as most of the groups were formed for the sake (PCR, 2011). NRLM was introduced in 2010 as a hybrid model with the objective to provide self and wage employment. Total number of 25883 SHG’s have been created under this scheme with a maximum in Baramulla (5386) followed by Kupwara (4772) and minimum in Srinagar (489) followed by Shopian (659) district of Kashmir Valley. The geographical coverage of the scheme has been enormous covering 10 districts, 54 blocks, 1910 Gram Panchayats, 3885 villages and 220932 Households in the provisional areas of the valley. Furthermore, NRLM program has developed 8447 resource persons and 2715 women members were covered under agro-ecological practice interventions.
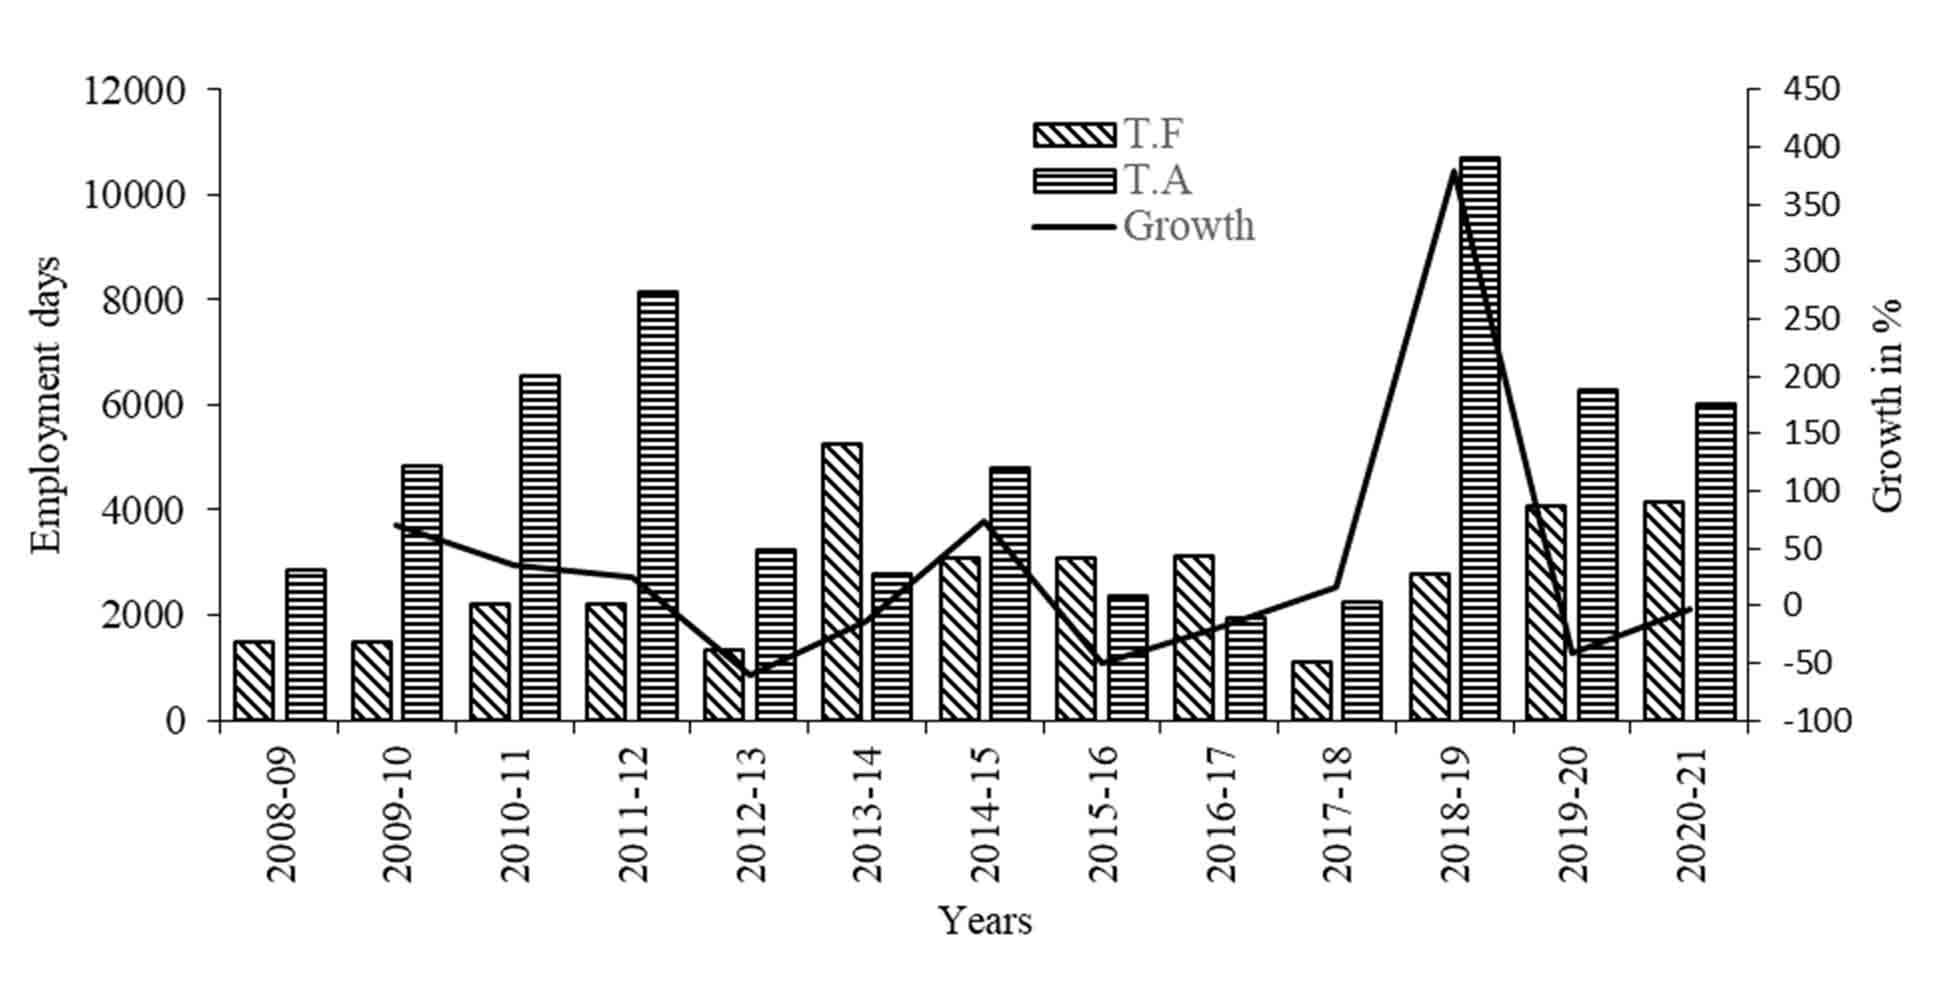
Figure 3 illustrates the performance of PMEGP program in rural areas of Kashmir. The temporal data shows fluctuations in terms of employment generated through PMEGP. On an average, 5237 persons were employed during the reference period with the highest number recorded in the financial year of 2018-19 followed by 8149 persons in 2010-11. The lowest number of 1960 persons was recorded in 2016-17 followed by 2113 persons in financial year of 2014-15. The year (2014-15) shows a considerable reduction due to the September 2014 floods and the escalating political turmoil in the valley.
Growth curve shows the fluctuating trend in employment generation for all the selected schemes during the reference period in the Kashmir valley (Figure 2 and 3). In case of SSGY scheme, growth of (46.1%) was recorded during the initial year (2001-02) of implementation which decreased to (5.41%) in 2004-05 and in the following years (2005-06, 2006-07) negative growth of (-13.55, -29.31) was recorded. The highest growth of (378%) in case of PMEGP scheme was recorded during the financial year of 2018-19 while as lowest growth (-48.27%) was recorded in 2019-20 showing the significant impact of Covid-19. On the other hand, MGNREGA program reflects positive growth in employment generation for most of the financial years with (120%) in 2015-16 followed by (91.55%) in 2011-12. We can conclude that selected centrally sponsored poverty alleviation schemes has shown positive growth in employment generation during the chosen reference period except in the financial years marked by disastrous floods (in 2014) and political unrest, and covid-19 pandemic happened in the valley.
H01: There is no significant relation between the amount of funds utilized and the generation of employment under these schemes.
Table 2 displays the values of log-linear regression i.e., regression coefficient, R2, computed t-value, degrees of freedom and schemes model of three employment generation schemes selected for the study. In simple log-linear regression analysis, the magnitude of the coefficient for each independent variable indicates the extent of the effect on the dependent variable, and the sign of the coefficient (positive or negative) indicates the direction of the effect. All three programs, funds utilization have a significant impact on employment creation (Table 2). The values of regression coefficient (r) in all the three schemes are positive: 0.52 in case of MGNREGA, 0.71 in SGSY, and 0.62 in PMEGP which employs 100% rise in funds utilization will lead to increase in employment generation by 52% in MGNREGA scheme, 715% in SGSY scheme and 62% in PMEGP scheme. A high value of R2 in all the selected schemes infers that the models explanatory power is good.
Table 2. Results of log-linear regression
|
Schemes
|
MGNREGA
|
SGSY
|
PMEGP
|
|
R2
|
0.9148
|
0.6952
|
0.7721
|
|
T-value
|
11.18
|
4.52
|
8.65
|
|
constant/intercept
|
10.15
|
4.32
|
7.29
|
|
Coefficient
|
0.52
|
0.71
|
0.62
|
|
Degrees of Freedom (df)
|
9
|
6
|
10
|
|
Correlation
|
0.93
|
0.73
|
0.87
|
|
Scheme Model
|
lnEG= 10.15 + 0.52 lnFU
|
lnEG= 4.32+ 0.71 lnFU
|
lnEG= 7.26 + 0.62 lnFU
|
Note: df = 6 significant at 5% confidence interval; EG=Employment Generation; FU= Funds Utilization
The correlation between funds utilization and employment generated was determined to be satisfactory, with a high degree of positive correlation. The coefficient of correlation in case of MGNREGA is (r=0.93), SGSY (r=0.73) and PMEGP is (r=0.87) indicating strong positive correlation between the two variables used in the scheme. Furthermore, t-value of all three schemes viz. MGNREGA (11.18), SGSY (4.52) and PMEGP (8.65) is found to be statistically significant so our null hypothesis stands rejected. As a result, we concluded that our findings validate the alternative hypothesis, which states that any change in fund utilization leads to a change in employment generation.
5.3 Socio-Demographic Profile of Respondents
Out of the total respondents, 71% are male while as 29% are female and 82.5% were married and 17.5% were unmarried (Table 3). More than 45% of the respondents were in the age group of 45-60, followed by 27.5% in the age group of 30-45. The lowest number of respondents (12%) is recorded in the age group of 15-30 followed by 15% in the age group of 60 and above, implying that low age group and higher age group respondents participate less in wage and self-employment schemes. More than 1/3rd of the respondents are either illiterate (37.5%) or have attained education up to primary level (33%). On the other hand, 17.5% of the respondents have attained education up to middle class and only 12% of the respondents have attained education up to 12th standard and above. 86% of the respondents were partially dependent employing that self and wage employment schemes from their source of livelihood in addition to their personal income. Besides 14% of the respondents were wholly dependent on wage and self-employment schemes as they consider these schemes as the main source of their income. About 39% of the respondents were seasonal laborers, 22.5% farmers, 16% engaged in household industry, and 12.5% were having their own business respectively (Table 3).
Table 3. Socio-demographic characteristics of respondents
|
Socio-demographic variables
|
Category
|
N
|
(%)
|
|
Age (in years) (N= 200)
|
15-30
|
24
|
12
|
| |
30-45
|
55
|
27.5
|
| |
45-60
|
91
|
45.5
|
| |
60 and above
|
30
|
15
|
|
Gender (N= 200)
|
Male
|
142
|
71
|
| |
Female
|
58
|
29
|
|
Educational level (N= 200)
|
Illiterate
|
75
|
37.5
|
| |
Primary
|
66
|
33
|
| |
Middle
|
35
|
17.5
|
| |
Secondary and above
|
24
|
12
|
|
Marital status (N= 200)
|
Married
|
165
|
82.5
|
| |
Unmarried
|
35
|
17.5
|
|
Economical dependency status (N= 200)
|
Dependent
|
28
|
14
|
| |
Partially dependent
|
172
|
86
|
|
Main occupation (N= 200)
|
Seasonal labors
|
78
|
39
|
| |
Farmers
|
45
|
22.5
|
| |
Household industry
|
32
|
16
|
| |
Petty business
|
25
|
12.5
|
| |
Others
|
20
|
10
|
5.4 Awareness Level of Respondents
A respondent was considered aware about the government sponsored employment scheme if he knew the name of that scheme. Table 4 reveals the awareness level of respondents towards employment schemes. The positive values of Knowledge Index (KI) and Total Knowledge Score (TKS) specify that respondents have elastic knowledge towards wage and self-employment schemes while as negative values of KI and TKS
indicates that respondents have inelastic knowledge towards employment schemes. Table 3 clearly reveals that most of the respondents are aware about the MGNREGA scheme followed by IAY, NRLM, PMEGP and EAS scheme. On the other side, the awareness level among the respondent’s decreases for the schemes (IRDP, SGRY, JRY, PMKVY, NREP and SGRY). Among the self-employment schemes, National Rural Livelihood Mission (NRLM) (KI= 0.42 and TKS= 42) is most favored by the respondents while as MGNREGA scheme (0.85 KI and 85 TKS) is mostly preferred by respondents among the wage employment schemes. The maximum TKS and KI was recorded (0.85 KI and 85 TKS) in case of MGNREGA indicating that respondents are well aware about MGNREGA scheme. On the other hand, SGSY scheme recorded the lowest negative value of (KI = 0.16) implying that the participants were less aware about SGSY. Most of the schemes where the negative knowledge index values were recorded are not currently in operation and were stopped or reorganized. One of the main reasons of low awareness of IRDP, SGRY, JRY, NREP and SGRY among respondents is that these schemes were operational before the financial year of 2000-01. The schemes like MGNREGA, IAY, PMEGP and NRLM remained active for a longer period of time and are still operating; hence most of the participants are well aware about these schemes.
Table 4. Awareness level of respondents towards employment schemes
|
Name of Scheme
|
Aware about scheme
|
|
Total Knowledge Score (TKS)
|
Knowledge Index
|
|
Yes
|
NO
|
Yes (%)
|
NO (%)
|
|
Jowhar Rozgar Yojana (JRY)
|
72
|
128
|
36
|
64
|
-28
|
-0.28
|
|
Indra Awaas Yojana (IAY)
|
144
|
56
|
72
|
28
|
44
|
0.44
|
|
National Rural Employment Programme (NREP)
|
64
|
136
|
32
|
68
|
-36
|
-0.36
|
|
Sampoorna Grameen Rozgar Yojana (SGRY)
|
65
|
135
|
32.5
|
67.5
|
-35
|
-0.35
|
|
Employment Assurance Scheme (EAS)
|
102
|
98
|
51
|
49
|
2
|
0.02
|
|
Swarnjayanti Gram Swarozgar Yojana (SGSY)
|
84
|
116
|
42
|
58
|
-16
|
-0.16
|
|
Mahatma Gandhi National Rural Employment Guarantee Act (MGNREGA)
|
185
|
15
|
92.5
|
7.5
|
85
|
0.85
|
|
Prime Minister’s Employment Generation Programme (PMEGP)
|
126
|
74
|
63
|
37
|
26
|
0.26
|
|
National Rural Livelihood Mission (NRLM)
|
142
|
58
|
71
|
29
|
42
|
0.42
|
|
Prime Minister’s Kuashal Vikas Yojana (PMKVY)
|
72
|
128
|
36
|
64
|
-28
|
-0.28
|
|
Integrated Rural Development Programme (IRDP)
|
57
|
143
|
28.5
|
71.5
|
-43
|
-0.43
|
5.5 Socioeconomic Impact of Employment Schemes
Out of the total respondents in the study, 57% of the respondents have utilized wage employment schemes while as 23% of the respondents have utilized self-employment programs. The remaining 20% have utilized both wage and self-employment schemes. Most of the households registered an increase in income after working under wage and self-employment schemes. The increase in income was very low in case of wage employment schemes. More than 65% of the respondents working under wage employment schemes recorded an increase of (05-09%) in their monthly income while the rest 35% of the workers recorded 12-15% increase in their monthly income. On the other side, the respondents benefitted through self-employment registered a satisfying increase in their incomes. Out of the total respondents utilizing self-employment schemes, 45% have shown an increase of 15-20% in their annual incomes and 55% of the respondents registered an increase of more than 20% in their annual income. Most of the respondents who received benefits from self-employment schemes have set up their own business/services and hence are now less reliant on employment schemes. The relationship between the income increase and the expenditure level of the respondents are depicted in table 3.
The table 5 depicting the correlation results indicate that increase in income i.e. economic upliftment of the beneficiaries has a significant positive correlation with the household expenditure (r=0.87), p< 0.00), hospital and medical expenses (0.73, p< 0.00), children’s education (r =0.63, p<0.00) and money savings in the bank (r = 0.58, p< 0.00). Therefore, the hypothesis that there is no significant relationship between the income increase of beneficiary households working under employment schemes and household expenditure, hospital and medical expenses, education of the children and savings among the beneficiary households is rejected at 5% level of significance. Therefore, it is concluded that increase in income of the beneficiary households working under employment schemes has a positive relationship with household expenditure, hospital and medical expenses, education of the children and savings.
Table 5. Correlation with the economic upliftment of beneficiaries
|
Variables
|
Increase in income
|
Daily household expenditure
|
Spend on children education
|
Assets creation
|
Savings
|
Purchased land
|
Spent on jewelry
|
Hospital and Medical charges
|
|
Increase in income
|
1
|
|
|
|
|
|
|
|
|
Daily household expenditure
|
0.873
(0.000)
|
1
|
|
|
|
|
|
|
|
Spend on children education
|
0.637
(0.000)
|
0.582
(0.000)
|
1
|
|
|
|
|
|
|
Assets creation
|
0.173
(0.197)
|
0.142
(0.161)
|
0.225
(0.221)
|
1
|
|
|
|
|
|
Savings
|
0.582
(0.000)
|
0.521
(0.023)
|
0.731
(0.000)
|
0.325
(0.435)
|
1
|
|
|
|
|
Purchased land
|
0.235
(0.225)
|
0.119
(0.273)
|
0.112
(0.327)
|
0.138
(0.351)
|
0.172
(0.395)
|
1
|
|
|
|
Spent on jewelry
|
0.352
(.196)
|
0.286
(0.241)
|
0.203
.184
|
0.121
(0.093)
|
0.347
(0.321)
|
0.093
(0.073)
|
1
|
|
|
Hospital and medical charges
|
0.731
(0.000)
|
0.673
(0.000)
|
0.353
(0.213)
|
0.253
(0.127)
|
0.621
(0.000)
|
0.012
(0.273)
|
0.172
(0.198)
|
1
|
Values significant at 0.05 (2-tailed), values in parenthesis denote p-values
5.6 Problems of Employment Schemes and Suggestions for Improvement
From the available literature, there is an ample evidence that current government sponsored employment programmes have shown a favourable influence towards the employment generation in the rural areas of Kashmir. Though laudable, these programmes have not been fully successful in achieving their objectives. The growth rates of employment schemes are showing fluctuating trends which is always a matter of concern. In addition to this, these schemes have not been able to meet the required demand of employment in rural areas of Kashmir. The secondary data reveals that on an average, 46 days of employment are provided to every rural household working under MGNREGA scheme as the scheme guarantees 100 days of employment. Similarly, on an average, only 5000 persons are being covered under PMEGP scheme which is very low number, keeping in consideration the bulk of unemployment men and women residing in the rural areas of Kashmir. Hence a large number of issues are related with the wage and self-employment schemes, some of the key loopholes were identified during the primary survey and have been documented in table 6. Weighted average method was used and subsequently ranks were given to the problems as per the responses of respondents. The variable which scored highest weighted average was given rank 1 and vice versa.
Table 6. Problems associated with employment schemes
|
Problems
|
SA
|
A
|
UD
|
D
|
SD
|
Total (N)
|
WA
|
Rank
|
|
Long procedures for registration
|
42
|
114
|
4
|
27
|
13
|
200
|
49.67
|
4
|
|
Low wage rates
|
115
|
55
|
0
|
23
|
7
|
200
|
56.53
|
1
|
|
Fake Job cards
|
39
|
78
|
34
|
43
|
6
|
200
|
46.73
|
6
|
|
Involvement of middle man/contractors
|
85
|
55
|
21
|
35
|
4
|
200
|
52.13
|
3
|
|
Lack of funds
|
38
|
68
|
18
|
55
|
21
|
200
|
43.13
|
8
|
|
Long delays in payments
|
85
|
92
|
2
|
12
|
9
|
200
|
55.47
|
2
|
|
Dominant role of Panch/Sarpanch
|
45
|
62
|
0
|
58
|
35
|
200
|
41.60
|
11
|
|
Shortage of staff
|
41
|
45
|
25
|
52
|
37
|
200
|
40.07
|
12
|
|
Corruption
|
48
|
80
|
18
|
35
|
19
|
200
|
46.87
|
5
|
|
Low subsidy in case of self-employment schemes
|
30
|
65
|
42
|
38
|
25
|
200
|
42.47
|
9
|
|
Long procedures for getting loan
|
30
|
62
|
45
|
30
|
33
|
200
|
41.73
|
10
|
|
Improper selection of beneficiaries
|
45
|
80
|
14
|
44
|
17
|
200
|
46.13
|
7
|
SA= Strongly agree, A= Agree, UD= Undecided, D= Disagree, SD= Strongly disagree, WA=Weighted average
Table 6 elucidates that low wage rates and long delays in disbursement of payments are the highly rated problems associated with these schemes. The low wage rates and long delays in payments demotivates the workers which in turn migrate to urban areas for high wage rates and sustained employment. Involvement of middlemen and contractors has been persisting problem especially in wage employment schemes. Despite the efforts of government, employment schemes continue to be in the hands of contractors which lead to corruption. The corruption (rank 5) still persists, even if the linkage between the contractors and officials has changed to one between the Sarpanch (village head) and the contractor. The fake job cards connected with these schemes leads to improper selection of beneficiaries with the result the real beneficiaries get excluded. Besides this, long procedures for availing loans and low subsidy are the major loopholes associated with the self-employment schemes. Shortage of funds and official staff are the other determinants halting the performance of self and wage employment schemes.
In order to address these problems, the implementing agencies should rethink and review the employment schemes as these schemes have an enormous potential to benefit the rural poor and could sustain their livelihoods. In addition to timely payment of wages, the workers should be supplemented with employment bonuses which would motivate them to work under these schemes. Besides this, implementing agencies has to activate its regulations for the payment of unemployment benefits and reimbursement for late payments, establish an independent social audit unit, create rules for transparency and establish grievance redressal system. They must respond to complaints, penalize officials and functionaries who violate the law, and improve programme monitoring. The problem of low wage rates must be addressed and effort should be made to provide the wages in accordance with the market wages which would decrease the distress migration. In case of self-employment schemes, government should not only increase the amount of loan and subsidy rates but also long procedures for registration and disbursements of payments should be eased. Furthermore, sustainable employment in rural areas is dependent on the restoration of its healthy environment, which is impossible to achieve as long as people’s needs are neglected. Therefore, the policymakers and planners should involve local people in the planning and implementation of schemes.
6 . CONCLUSION
The erstwhile state of Jammu and Kashmir is a hilly region and more than 70% of the population resides in provisional zones. The topographic difficulties and harsh climatic conditions force the people to stay at their houses during difficult periods. Furthermore, people’s reliance on agricultural labor results in seasonal employment, which leads to distress migrations. Therefore, wage-employment and self-employment schemes have a tremendous potential to generate employment and to provide credit facilities in the hands of rural people, leading to socio-economic transformation both at micro-individual and macro-societal level. The present study inferred that fund utilization has a significant impact on the employment generation which in turn increases the income of the rural poor and results in improved economic empowerment. The study concluded that participation in the employment schemes resulted in the overall improvement in the welfare of the rural people like spending more on household expenditure, hospital and medical charges, children’s education and facilitates those savings in banks. The study revealed that 11.64 crore employment days were created through MGNREGA scheme since 2011 which is 07 times more than generated under EAS/SGRY scheme. Though MGNREGA guarantees 100 days of employment for every household who demand it but so far; on an average, 46.36 are being provided, which has been the major drawback of the scheme. On the other hand, geographical coverage of NRLM, a self-employment scheme has been enormous covering 10 districts, 54 blocks, 1910 Gram Panchayats, 3885 villages and 220932 households in the provisional areas of Kashmir. We can conclude that the ongoing employment schemes have the tremendous potential which could eliminate the rural backwardness if implemented properly. Finally the study suggested that awareness campaigns, proper implementation, timely payment of wages, increase in employment days per household and generation of credit through self-employment schemes could be the better policy measures which the state should focus so that true and real potential of the employment schemes could be harnessed.


 ,
Shahbaz Rashid 1
,
Shahbaz Rashid 1