1 . INTRODUCTION
The continuous increase in population exerts pressure on land and water resources (Singh and Narayanan, 2015; Wang et al., 2016). However, limited and their rampant use is crucial, particularly for developing countries like India (Pandey et al., 2011; Kadam et al., 2012; Yadav et al., 2014). For the appropriate scheduling and management of natural resources, watershed characterization and identification of suitable soil and water conservation (SWC) sites are indispensable tasks and entail high precision data input (Patel et al., 2013; Aher et al., 2014; Krois and Schulte, 2014; Patil et al., 2014; Jaiswal et al., 2015; Alvarado et al., 2016). Many studies have been adopted for rainwater harvesting to augment the water resources in a watershed (Napoli et al., 2014; Ammar et al., 2016) as well as soil conservation for increasing crop productivity, reduce the soil erosion rate and controlling high nutrients in soil (Adgo et al., 2013; Zhao et al., 2013; Adimassu et al., 2016).
Various methods have been used to obtain direct or indirect information about soil water conservation and its potential occurrence, within that hydrogeological and geospatial analysis are commonly used and seems to be popular. Geospatial and hydrogeological analysis include several spatial layers of topographies that affect the soil water conservation structures (slope, soil, drainage, land use and lineament) (Kadam et al., 2012; Napoli, et al. 2014; Mahmoud and Alazba, 2016). The present study aims to identify the possible soil-water conservation sites with a new approach of hydrospatial information along with the geospatial analysis.
To study the SWC sites suitability, Shivganga watershed has been selected as a representative of semi-arid, basaltic region of Western India, showing high rainfall-runoff potential. The available surface runoff has to be harvested in respective structures and to be utilized during the water scarce period for drinking, domestic and agricultural purposes. This warrants the potential soil erosion arresting and rainwater harvesting at suitable locations and will definitely help to retain soil cover and water availability.
With this intent, Shivganga watershed is selected with the objectives to (1) understand the runoff and recharge potential of an area, (2) identify potential soil water conservation sites for rainwater infiltration and reduction of soil erosion and (3) appraise the derived SWC site with field survey to measure accuracy of method adopted in the study.
2 . STUDY AREA
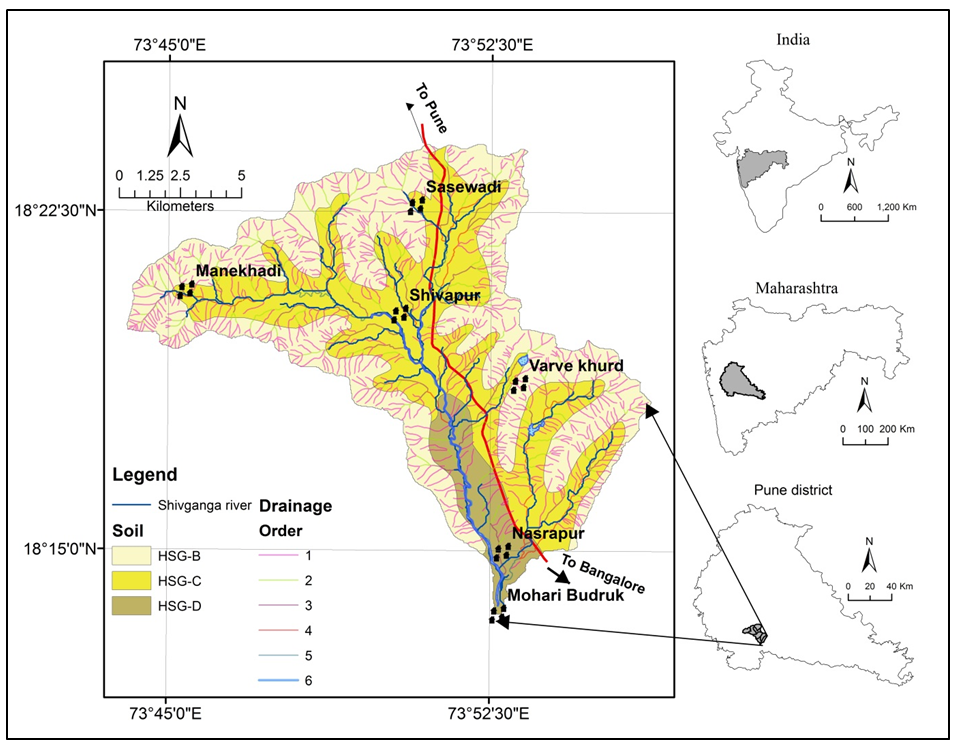
The study area is the source region of Nira River, covering the high hills and middle order stream network. The areal extent of Shivganga watershed is (Figure 1) 173.93 km2 and is the part of Pune district, Maharashtra, India. Area bounds between 73° 44' 1.13" E to 73° 56' 17.94" E longitudes and 18°13' 36.05" N to 18° 24' 7.46" N latitude. The study area is drained by river Shivganga that originates at the foothills of Sinhagad fort and meets Gunjawani River near Mohari Budrukh village. The topography of the study area shows high relief and relatively steep slope. The elevation ranges from 1264 m in Western part to 590 m in the Eastern most part of the watershed. The basin relief is 674 m. The area is characterized by semi-arid climatic conditions with moderate to high runoff potential and high evapotranspiration. The area receives an average annual rainfall of 960 mm from NW monsoon in June through September (IMD, 2015).
The soil plays an important role characterizing watershed, as the runoff potential of the soil is determined by its infiltration rate and texture (Kadam et al., 2012) map available with National Bureau of Soil Science and Land Use Planning (NBSSLUP, 1996) is used as a reference map to delineate the soil classes of the study area, which is classified using United States Department of Agriculture (USDA) soil system (USDA, 2007) (Figure 1). The parent lithology demonstrates soil breakdown characteristics (physical and chemical). This fine-grained basaltic soil is suitable for green growth. The hydrological soil groups (HSG) of the study area are B, C and D. The HSG-B is fairly deep to deep, fairly well too well-worn out soils with moderately fine to moderately coarse textures covering 49.63% area. HSG-C is 42.37% of the total area having moderately fine to fine texture, soils with a clay layer at or near the surface and shallow soils over nearly impervious material are HSG-D (8.01%) (Kadam et al., 2012).
3 . MATERIALS AND METHODOLOGY
In this study, different thematic layers such as drainage, land use, soil, slope and derived layers like runoff and infiltration zone were generated using geospatial technique and conventional field data. The land use/land cover map was prepared using IRS P6 LISS-IV (2014) dataset for the winter season. The drainage, contour and watershed boundary wereprepared using toposheets from Survey of India. The soil map was prepared using NBSSLUP, Nagpur and the reclassified into HSG soil type. The slope map was derived from the contour and ASTER-DEM. The derived layer such as surface runoff and infiltration was estimated using modified SCS-CN method and Allen (2008) method.
The rainfall data acquired from India Meteorological Department (IMD) for Bhor rain gauge station for the period from 1998 to 2014 were used for surface runoff study. The variations in antecedent moisture conditions (AMC) could not be measured because only Bhor station is available for rainfall data. Therefore, AMC II is applicable to the given study area for the calculation (Table 1).
Table 1. Imperviousness coefficient (Allen, 2008)
|
Class
|
Imperviousness*
|
|
Crop Land
|
0
|
|
Deciduous Forest
|
0
|
|
Fallow Land
|
40
|
|
River
|
0
|
|
Rural
|
15
|
|
Scrub Forest
|
0
|
|
Stony Waste
|
100
|
|
Urban High Density
|
70
|
|
Urban Low Density
|
35
|
3.1 Runoff Calculation by SCS-CN Method
The SCS-CN is a most widely used method, that uses of soil type (HSG), land use/land cover data, rainfall, AMC and the curve number for rainfall-runoff calculation of a watershed (Geetha et al., 2007; Rallison, 1980; SCS, 1985; Singh et al., 2015).
AMC defines the storage of soil moisture before the rainstorm in a watershed. Since the single weather station data used for calculation, curve numbers were evaluated for AMC II condition only (Geetha et al., 2007; Kadam et al., 2012).
\(Runoff = {(Rainfall-0.2\ S)^2 \over Rainfall-0.8 \ S} if \ Rainfall > 0.2 \ S\) (1)
\(Runoff = 0 \ if \ Rainfall \leq 0.2 \ S\)
\(S = ({25400 \over CN})-254\) (2)
Where, P >Ia
Ia*= 0.1S, for Black Soil Region; AMC-II
Ia= 0.2S, for all other Regions
*Suggested by CWCRTI (ICAR), Dehradun for Indian conditions.
In the present study, curve numbers values were calculated using following equation (3):
\(CNw= \Sigma{(CNi \times Ai) \over A}\) (3)
Where,
\(CNw\) - weighted curve number
\(CNi\) - curve number from 1 to any number N
\(Ai\) - area with curve number CNi
\(A\) - total area of watershed
The ArcCN-Runoff tool is used for determination of surface runoff, the intersected land-soil layer of any shape facilitate better runoff prediction. The resultant layer was assigned a suitable CN depending on hydrologic soil group with the help of the standard table of the SCS, USDA (Singh et al., 2012).
3.2 Delineation of Water Infiltration Zones
The infiltration is the function of land use/cover, soil type (HSG) and slope of the parcel. The land use map was re-classed into imperviousness coefficient based on the Table 1 value (Allen, 2008). The slope was reclassified into very low, low, moderate and high and corresponding infiltration values were assigned (Table 2).
Table 2. HSG property
|
HSG code
|
Soil type
|
Water Infiltration
Capacity
|
Water Infiltration
Rate (mm/hr)
|
|
A
|
Sandy, Loamy Sand, Sandy Loam
|
High
|
> 25
|
|
B
|
Silt Loam or Loam
|
Moderate
|
12.5- 25
|
|
C
|
Sandy Clay Loam
|
Low
|
2.5 – 12.5
|
|
D
|
Clay Loam, Sandy Clay, Silt Clay
|
Very low
|
< 2.5
|
The infiltration values from these three inputs were used for demarcation of potential infiltration sites diagonally in the area under consideration. The final map was prepared using raster calculator based on the equation (4):
Infiltration = (Slope × 0.33) + (Land use × 0.34) + (HSG × 0.33) (Allen, 2008) (4)
3.3 Identification of Potential Soil Water Conservation Sites
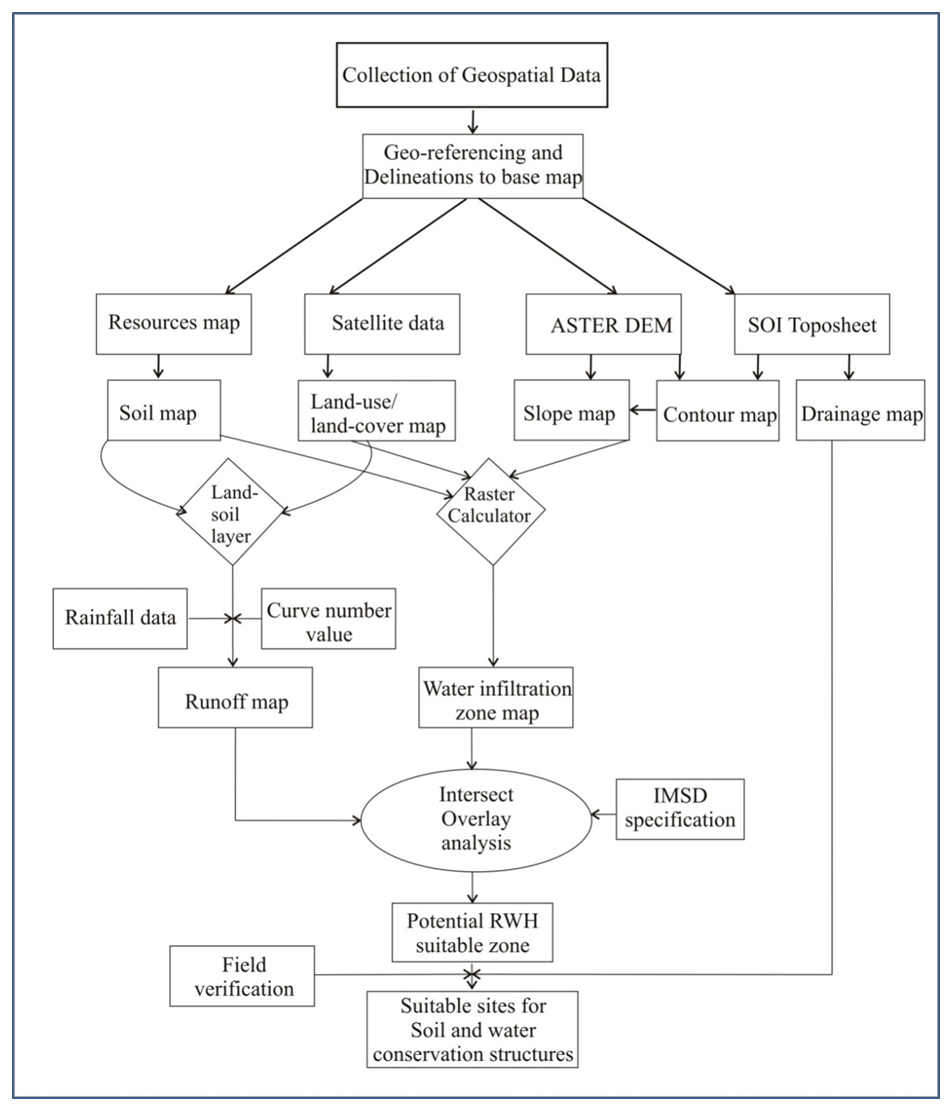
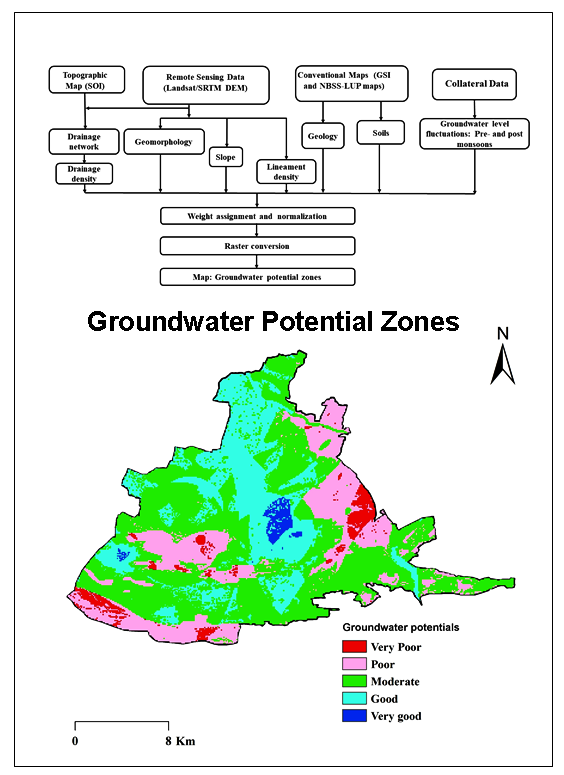
In the present study, integrated mission for sustainable development specification (IMSD), Department of Space, Government of India was used for identification of potential soil water conservation sites (Table 3). The intersect overlay analysis was performed on thematic layer land use/land cover, slope, soil and runoff potential, infiltration zone based on IMSD specification. The potential site was cross-checked by overlaying drainage and for accuracy assessment, the ground truth data was used to validate the identified structure. Figure 2 depicts a detailed illustration of the methodology.
Table 3. Adopted specifications for potential soil water conservation sites
|
Parameter
|
Slope (%)
|
Porosity and permeability
|
Land use/ land cover
|
Soil type (HSG)
|
Runoff
potential
|
Stream
order
|
Catchment area (ha)
|
|
Check dam
|
<15
|
Low
|
Scrub land/ River bed
|
Sandy clay loam
|
Medium/high
|
1-4
|
> 25
|
|
Percolation pond
|
<10
|
High
|
Waste land
|
Clay
|
Low
|
1-4
|
25-40
|
4 . RESULTS AND DISCUSSION
4.1 Land Use /Land Cover
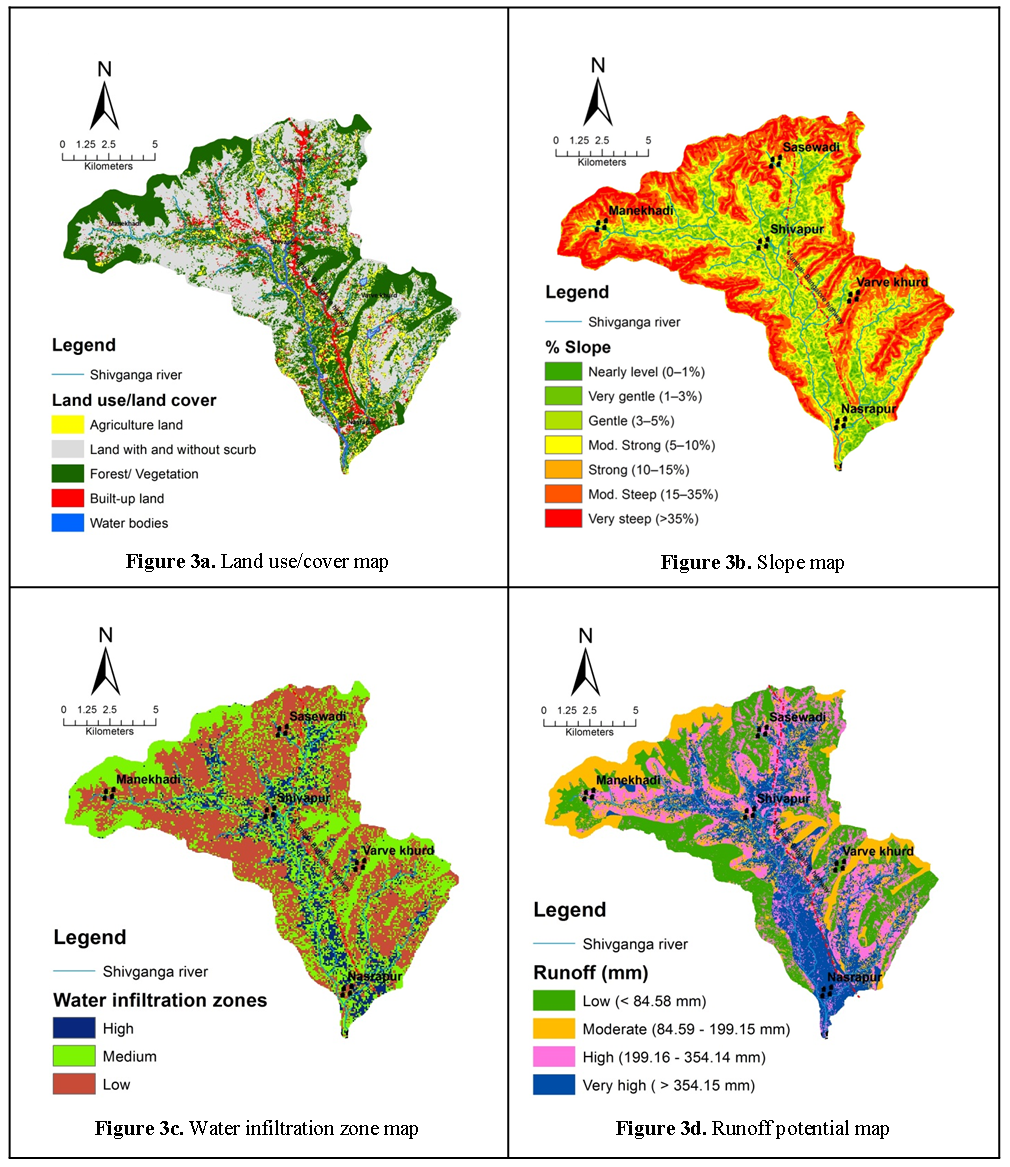
Majority of the study area is occupied by seasonal grassland and single crop non-irrigated agricultural land (87%) and perennial agriculture is about 11% (Figure 3a). Land use describes the generation of surface-runoff, soil erosion and identifying rainwater harvesting structure (Kadam et al., 2012; Jha et al., 2014; Singh et al., 2017). The land use/land cover map of the study area is depicted in Table 4 and Figure 3a. The classification accuracy of the classified map was calculated using confusion or error matrix, showed 80% user and 85% producer’s accuracy respectively.
Table 4. Land use/land cover
|
Land use/land cover class
|
Area (km2)
|
% Area
|
Possible structure
|
|
Agriculture land
|
18.55
|
10.87
|
Percolation tank, Check dam
|
|
Forest/Vegetation
|
73.67
|
43.18
|
Check dam
|
|
Land with and without scrub
|
73.94
|
43.34
|
Percolation tank, Check dam
|
|
Built-up land
|
3.43
|
2.01
|
-
|
|
Waterbody
|
1.02
|
0.60
|
-
|
The major portion of the study area is covered by wasteland and sparse forest at the periphery of study area demands construction percolation tanks and check dams respectively for sustainable watershed development. Further, agriculture land is good for construction percolation tank, check dam; there are ample scope and good accessibility, observed at the time of field visit.
4.2 Slope
The slope is considered as an important criterion for selection and execution of SWC site (Agarwal et al., 2013). Slope plays a key role in groundwater occurrence as infiltration is inversely correlated to the slope. Disposition of slopes within watershed is influencing the topographical conditions and drainage network. Slope also important for the study of runoff and soil erosion. The peripheral areas of watersheds show moderate-steep to steep slope having dominated class (Table 5, Figure 3b), result in high surface runoff and low to moderate infiltration in the study area. The middle part of study area shows moderate slope class represents moderate surface runoff and infiltration, suitable for SWC structure.
Table 5. Slope classes of study area
|
% Slope
|
% Area
|
Significance
|
|
Nearly level
|
1.81
|
Low surface runoff / High infiltration
|
|
Very gentle
|
9.30
|
Low surface runoff / High infiltration
|
|
Gentle
|
15.31
|
Low surface runoff / High infiltration
|
|
Moderate
|
21.88
|
Moderate surface runoff / Moderate infiltration
|
|
Strong
|
11.10
|
Moderatesurface runoff / Moderate infiltration
|
|
Moderately steep
|
25.74
|
High surface runoff / Low infiltration
|
|
Very steep
|
14.87
|
High surface runoff / Low infiltration
|
4.3 Potential Water Infiltration Zone
Infiltration zone provides a favourable zone for natural subsurface recharge of rainfall. The infiltration zone map has been classified into three categories of high infiltration (10.52%), moderate infiltration (43.81%) and low infiltration (45.67%), respectively (Table 6 and Figure 3c). The study area mainly shows basaltic lithology and thin soil covers represent moderate to low infiltration zone.
Table 6. Water infiltration zone of study area
|
Infiltration zone
|
% Area
|
Possible structure
|
|
High
|
10.52
|
Percolation tank,
|
|
Moderate
|
43.81
|
Percolation tank, Check dam
|
|
Low
|
45.67
|
Check dam
|
Figure 3c shows that major portion of the study area can be categorized under moderate to low category and remaining area falls under high categories. Thus, SWC structures are proposed to construct in order to enhance both sub-surface and surface storage.
4.4 Runoff Potential
The surface runoff potential map is shown in Figure 3d, highlighting the soil group C or D having water body as a land cover shows very high runoff (958.89 mm). The periphery part of study area shows reserved forest with soil group B revealing least runoff potential (30.42 mm). The runoff potential map was classified into four classes based on natural breaks (Jenks) classification method. However, 40.29% of the area is dominated by moderate runoff potential zones, whereas very high runoff potential zone covered an area of 29.51% (Figure 3d). Very high runoff area is not suitable for construction of SWC sites, while high to moderate runoff potential zones were suitable for potential SWC structures. The middle part of study area shows maximum runoff as well as lower reaches of study area experience same because of presence HSG-D soil type (Figure 3d).
4.5 Site Selection for SWC Structure
The site selection for SWC structure using geospatial analysis uses thematic layer such as land use/land cover, soil, slope, runoff and infiltration were integrated as per IMSD specification for check demand percolation tanks.
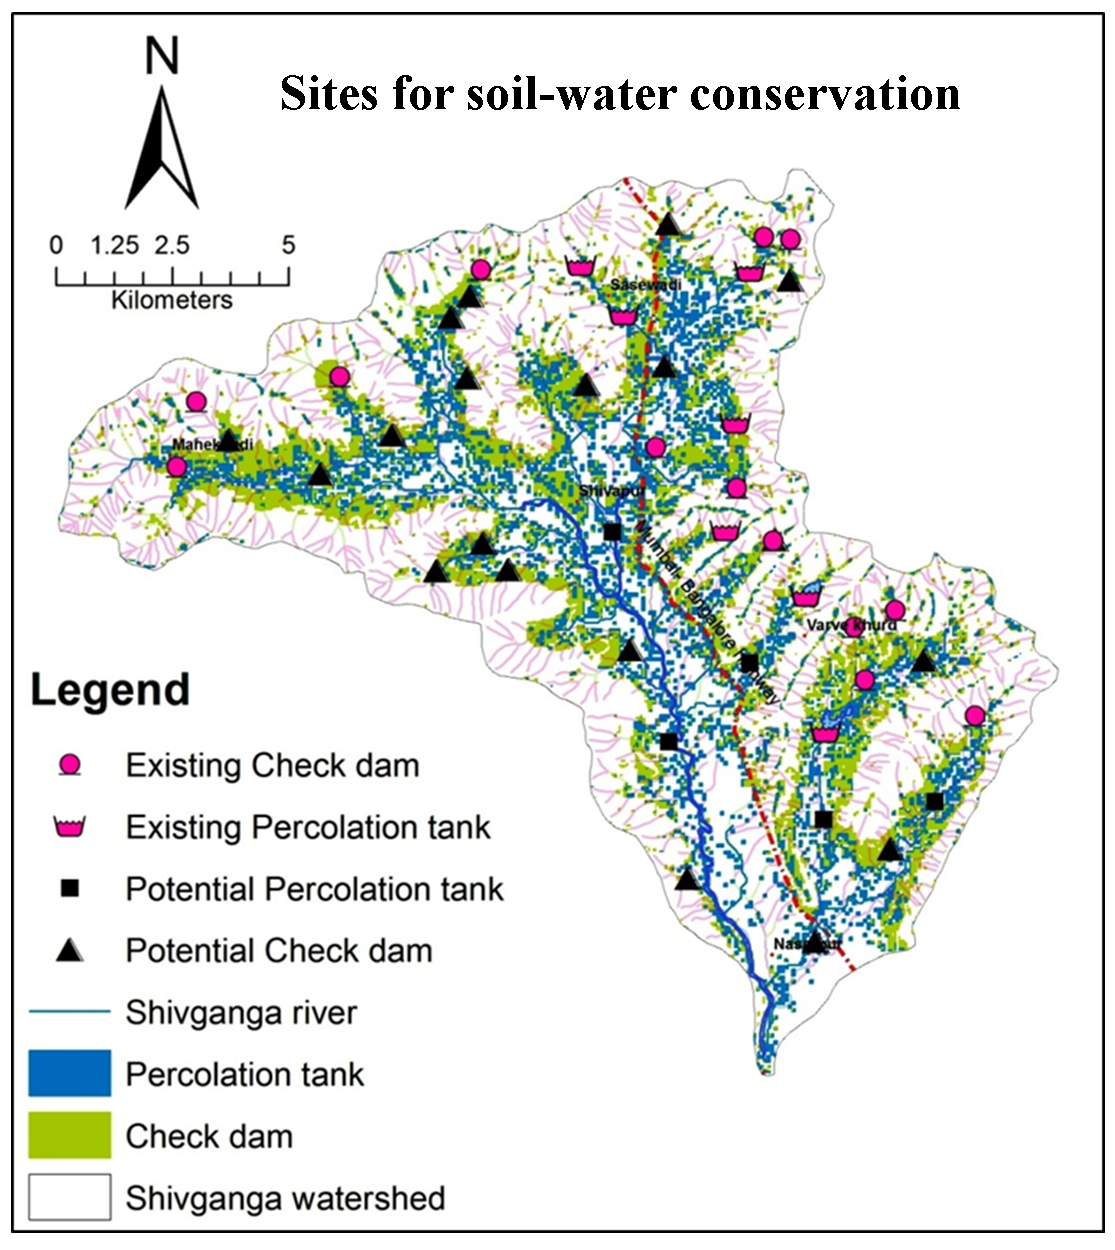
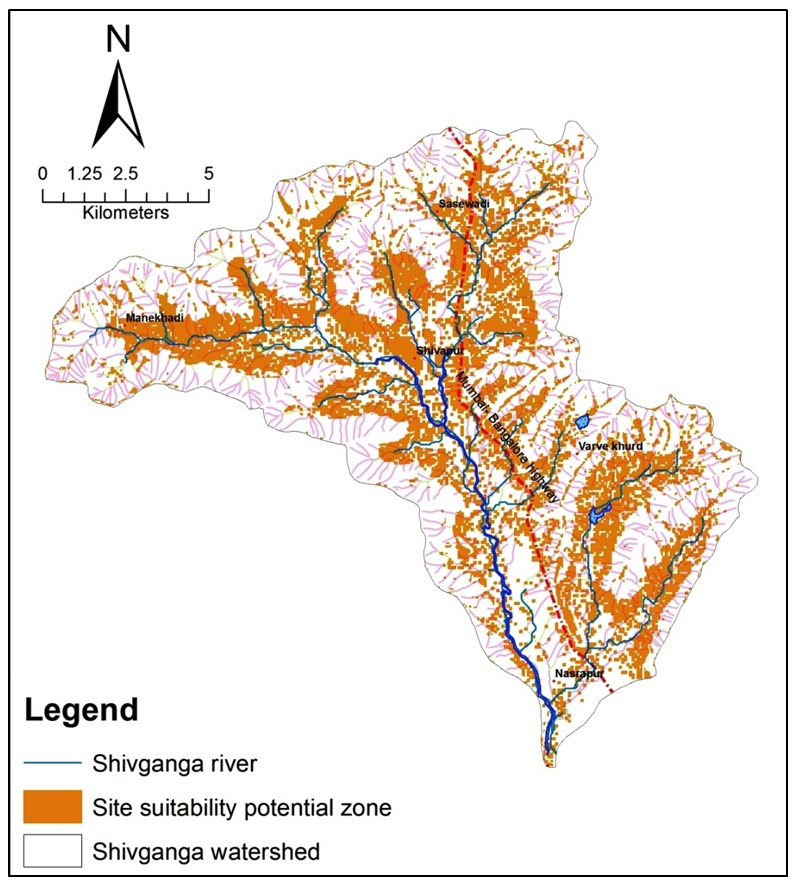
The site suitability map depicts the spatial distribution of potential location suited for various SWC structures (Figure 4). Out of the total, 28% of the area (Figure 4) is suitable for constructing SWC structures, whereas the remaining area of the watershed is incompatible with SWC site.
The site suitability map depicts the spatial distribution of potential location suited for various SWC structures (Figure 4). Out of the total, 28% of the area (Figure 4) is suitable for constructing SWC structures, whereas the remaining area of the watershed is incompatible with SWC site.
Area suitable for check dam construction is present in the source and middle part of the watershed, however, the area suitable for percolation tanks are present at lower reaches of the watershed. Hence, there is ample scope for construction of SWC structure in the study area. The potential zones for recharge structures such as percolation tanks and check dams were identified as presented in Figure 4.
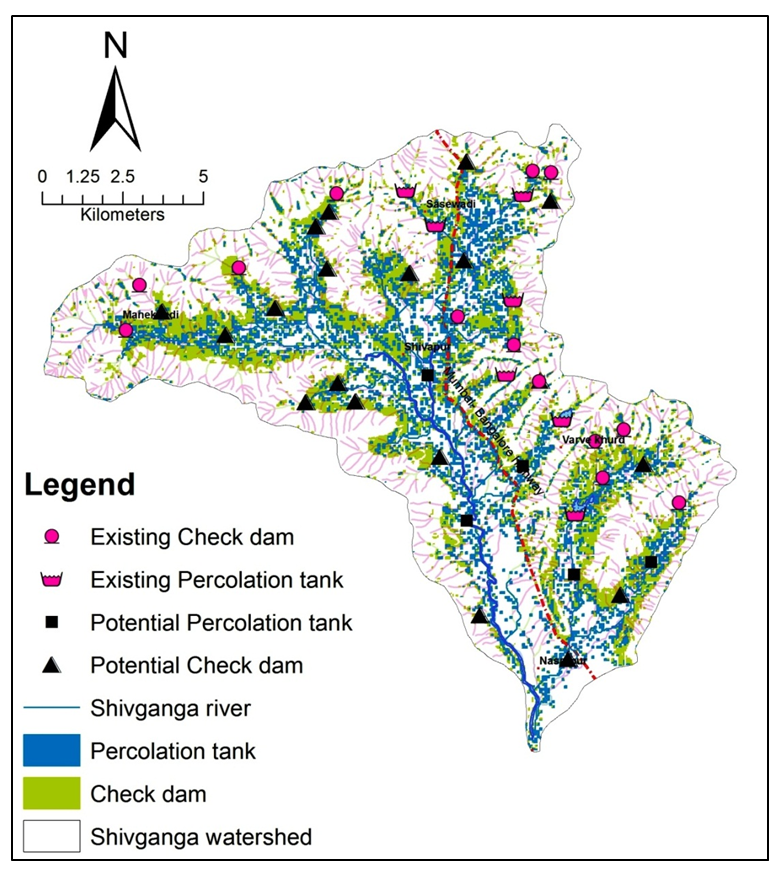
Subsequently, the drainage network was combined with the SWC site suitable area map that resulted in the potential 45 probable sites for taking up check dams and percolation tanks along the streams (Figure 5). This also considers choosing site 500 m away from the settlement for safety purpose.
The extensive field study has been done to verify potential identified sites in order to check the accuracy and precision of the applied modified method. In the present study, 2nd and 4th order streams are considered for soil and water conservation structures. Check dams and percolation tank identified by present method were superimposed with existing sites shows 80% and 100% accuracy, respectively.
Accuracy assessment was carried out by overlaying the existing structure over the identified structure and located during the field visits on the map of derived potential SWC sites. Total twenty-two sites were identified, among that seven already existed and fifteen are the potential sites for percolation tank.
5 . CONCLUSION
Identification of suitable sites in the field is a crucial task which demands the verification of ground-based aspects. The present study demonstrates the modified method by using the infiltration zone along with conventional layers that provided identification of SWC sites with higher accuracy level.
The result shows that though only 26% of area suitable for SWC structures, the overall accuracy of a method was 80-90% for identified and possible SWC site. The planning of watersheds is mainly done to increase infiltration, increase surface and groundwater availability as well as for preventing of soil erosion. In addition to this, field investigations of soil type and depth are also prerequisite to authenticate the sites suitable for soil and water conservation structures. In conclusion, this modified method SCS-CN of runoff along with infiltration zone is efficiently demonstrated as a superior method, which requires less data, higher precision and capability of handling extensive data set as well as a larger geographical area to identify preliminarily SWC sites.


 ,
Sanjay Kale 1
,
Sanjay Kale 1