Higher educated women were more likely to participate in decision-making in all the three outcome measures.
Employed women were more likely to have autonomy than unemployed women.
The age of the women got as a vital factor in the enhancement of decision-making autonomy.
Their wealth status and place of residence influence the autonomy outcomes of the women.
The women from the rural area had limited autonomy related to physical movement than urban area.
Abstract
The socioeconomic variables have a strong impact on the decision-making and physical movement of women, worldwide studies suggest the same. In this study, we have tried to know the various determinants of women’s autonomy. We have taken the data from the fourth round National Family Health Survey (NFHS) (2015-16), published by the International Institution on Population Sciences (IIPS). For the statistical analysis, we used basic descriptive statistics and cross-tabulation between the socioeconomic variables and autonomy responses. Later to predict the occurrence of various autonomy aspects, binary logistic regression has been used with various socioeconomic variables. After getting the results, it has come to know that women’s decision-making and freedom of movement-related autonomy are largely influenced by socioeconomic variables. Major findings stated that with increasing age of women, autonomy increases. Women who belong to the rural setup have a low level of autonomy. From a religious perspective, women from the Muslim community have lower autonomy. Apart from these women have higher education, employed and in rich households have a higher likelihood of autonomy. Based on the outcomes, it is clear to us that women’s autonomy is largely influenced by their socioeconomic condition.
Keywords
Women , Physical Movement , NFHS , India , Autonomy
1 . INTRODUCTION
Women’s autonomy simply means the ability of personal fulfillment and active participation in the family decision-making process. To improve maternal health and child health outcomes, in the year 1994 International Conference on Population and Development (ICPD) organized in Cairo gave more consideration to the role of women’s empowerment in influencing reproductive behaviour and women’s autonomy in healthcare. The concept of women’s autonomy is broad and multi-dimensional which means control over resources and ideologies (Pradhan, 2003). Therefore, women’s autonomy largely emphasizes the ability to decide their actions, the ability to sustain their requirements such as material or financial resources and their ability to move without restraint in the community (Abadian, 1996). Women’s decision-making right is also affected by restrictions on women’s physical, sexual, social, economic and political autonomy, several effective programs have played very significant role in enhancing the decision-making autonomy of women (Dyson and Moore, 1983). Autonomy can be measured by a combination of several dimensions of autonomy and power including decision-making abilities, controlling power over finances and also the liberty of mobility (Haque et al., 2012; Kabir et al., 2005; Rahman, 2012). Women’s autonomy in health care decisions is largely determined by various factors such as age, education, place of residence and wealth index. The higher educated women and urban rich or employed women have more autonomy compared to rural women (Senarath and Gunawardena, 2009). Women’s education, occupation and income have a significant effect on the household decision-making power (Sultana, 2011).
The evidence from developing countries illustrates that women’s age and family structure are important determinants of women’s ability in decision-making. Elderly women and women in nuclear households are more likely to take part in family decisions than women who live in joint families (Sathar and Kazi, 2000). Some studies in developing countries also revealed that women’s household decision-making autonomy is significantly associated with the current use of modern contraceptives and also highlighted the household organization and socioeconomic status of the women. It is also noted that the women’s involvement in household decision-making autonomy are essential determinants for the contraception use and also long-term fertility reduction (Rahman et al., 2014; Bogale et al., 2011). Women’s autonomy is strongly associated with the utilization of maternal health care services. Women who are participating in different social and economic activities have more autonomy. However, women’s autonomy is also determined by the educational background and economic status of the households (Haider et al., 2017).
Different studies show that the decision-making autonomy of women determines the utilization of healthcare services. Decision-making autonomy particularly in healthcare is strongly associated with the utilization of maternal healthcare services (Adegoke and Broek, 2009; Dangal and Bhandari, 2014). A study based in Africa indicates that ethnicity has a major role in determining women’s decision-making autonomy and it is a significant determinant among other individual-level characteristics (Kritz and Makinwa-Adebusoye, 1999). Another study highlighted the women’s decision-making determinants where it is clear that educated and employed women are more likely to participate in the household decision-making process. Another important fact also found that husbands’ reports on decision-making power are higher as compared to wives’ reports on the household decision (Becker et al., 2006). The result of developing countries also reflects that women’s decision-making ability is largely determined by their age, education, employment status, region, wealth index and the number of living children (Acharya et al., 2010). Ethnicity, deprivation level, rural and urban classification, education and the number of living children are strongly associated with women’s decision-making process (Kabeer, 1999). The previous study of five Asian countries shows that women’s autonomy is also highly associated with whether the wives or husbands are respondents as it looks like the categories of response do not have similar semantic meanings for men and women (Ghuman et al., 2006). It has been also noted the women’s level of knowledge determined the women’s decision-making autonomy (Jan and Akhtar, 2018). Previous studies on developing countries highlighted that patriarchal rules or norms have a great influence on women’s decision-making process (Sultana, 2010) and women’s age and the structure of the family also have a great influence on women’s decision-making autonomy (Sathar and Kazi, 2000). The various numbers of socioeconomic and demographic determinants associated with women’s autonomy at the household level. So, the main objective of the present study is to examine the different factors that affect women’s decision-making power at the household level.
2 . METHODOLOGY
2.1 Data Source
This study has been conducted by the fourth round of the National Family Health Survey (NFHS) (2015-16) published by the International Institution of Population Sciences (IIPS) under the monitoring of the Ministry of Health and Family Welfare (MoHFW), Government of India. It is a large-scale survey under which all the states and Union Territories have been selected. It provides the data in keeping mind various issues on maternal health, child health, women’s characteristics, child immunization, various sexual behaviors, etc. NFHS conducted a nationwide survey of about 601509 households with a response rate of 98% and also women aged 15-49 years with a 97% response rate with a total number of 699686. The survey was conducted with a two-stage stratified random sampling design. In the first stage, a total of 28586 clusters were selected using the Probability Proportional Size (PPS) model. Although during fieldwork 28522 clusters of responses were taken. In the second stage, household mapping and listing operations were carried out from the selected clusters and 22 households were selected randomly from the clusters. A detailed discussion of the sample design and survey procedure has been given in the National Family Health Survey report (International Institution for Population Sciences and ICF, 2017).
2.2 Study Participants
In NFHS-4, a total of 259627 under-five children have been surveyed. Our aim of the study is to know the autonomy status of the mothers of under-five children, so 11884 children were excluded as they died. Later women variables like decision-making and freedom of movement-related variables, have been taken into consideration. As the availability of the data set total of 38338 mothers and child pairs has been finalized for the study.
2.3 Outcome Variables
Women’s various decision-making autonomy is our main outcome variable, here Autonomy variables like basic household decision-making (decision on health care, large household purchase and decision on visiting family and friends) and physical movement (visiting market, health care center and visiting outside of the village) related autonomy have considered as a major variable of our study. The decision-making capacity of women has been divided into two categories, women who have taken decisions or moved outside alone or with someone are considered autonomous. While who were not taken the decision, not at all allowed to move outside were considered less autonomous women. These responses of the women were coded as ‘0’ if women have less autonomy and ‘1’ if they have higher autonomy.
2.4 Predictor Variables
Various socioeconomic variables of the mother of the under-five children have been considered as the predictor variable. The selected predictor variables are like age of the women (15-24, 25-35 and 36-49 years), place of residence (urban and rural), religion (Hindu, Muslim, Christian and other), level of education (no education, primary education, secondary education and higher education), number of living children (1, 2, 3, 4, more than 5), occupational status (non-working and working), wealth quintile (poor, poorer, middle, rich, richer) and region (north, central, east, north-east, west and south).
2.5 Statistical Analysis
We used basic descriptive statistical analyses to show the pattern of the variables selected in our study. Then cross tabulation has been performed to show the percentage of occurrence of decision-making and physical movement related to the autonomy of the women with other socioeconomic variables. Later to predict the autonomy outcomes of the women, by socioeconomic variables binary logistic regression models have been used. It is a statistical technique to test the statistical significance level. It is a very helpful technique to know the relationship between the independent variable and the targeted categorical variable. It is used to predict the dependent variable (women’s decision-making autonomy) with the help of independent variables (socioeconomic variables) (Peter, 2015). In the first model (Table 5) associations between women’s decision-making autonomy with socioeconomic variables have been performed with a crude and adjusted odds ratio (OR) and in model two (Table 6) associations have been made between women’s physical movement-related autonomy and socioeconomic variables. All of the statistical analyses have been performed with STATA software version 12.1 (Stata Corp LP, College Station, TX, USA).
3 . RESULTS
In Table 1, decision-making autonomy of ever-married women between the age group of 15-49 years is taken into consideration. Here three autonomy, visiting family and friends’ houses, decisions on large household purchases and going to the health facility center were considered for the discussion. It is found that in India 69.37% of women were allowed to make decisions on visiting friends and family houses. In Uttar Pradesh, women have the least decision on visiting family and friends’ houses. The states like Andhra Pradesh, Gujarat, Haryana, Madhya Pradesh, Delhi, Rajasthan and Uttar Pradesh women have very poor decision-making on visiting family and friend’s houses (Table 1 and Figure 1).
Figure 1. Women’s decision to visit family and friends’ house
Among the state’s decision on large household goods purchasing capacity of women, Haryana performed as the worst state. Along with Haryana states like Bihar, Telangana and Andhra Pradesh have shown poor autonomy status of women in making decisions regarding purchasing large household items (Table 1 and Figure 2).
Figure 2. Women’s decision on large household purchase
Table 1. Percentage distribution of decision-making autonomy of women aged (15-49 years) in India
States/Union Territories
Decision on visiting family and friends’ house
Decision on large household purchase
Decisions ongoing for the healthcare
Andaman and Nicobar Island
78.62
76.67
75.97
Andhra Pradesh
65.64
63.43
60.15
Arunachal Pradesh
82.15
79.12
78.67
Assam
75.99
77.24
75.73
Bihar
58.18
60.39
62.72
Chandigarh
80.29
82.26
95.33
Chhattisgarh
75.6
75.83
75.7
Dadra and Nagar Havel
55.31
49.34
68.01
Daman and Diu
76.16
69.97
64.71
Goa
89.19
87.46
89.65
Gujarat
68.48
64.2
67.65
Haryana
59.54
54.92
64.77
Himachal Pradesh
72.32
69.6
79.42
Jammu and Kashmir
69.87
66
71.13
Jharkhand
78.63
78.28
80.15
Karnataka
66.29
65.37
64.7
Kerala
80.16
78.1
80.32
Lakshadweep
69.2
65.45
60.64
Madhya Pradesh
67.56
66.39
67.75
Maharashtra
79.12
70.61
78.62
Manipur
87.46
82.05
89.73
Meghalaya
87.67
85.26
83.11
Mizoram
88.73
89.81
89.34
Nagaland
94.88
92.76
94.22
Delhi
62.84
60.45
66.34
Odisha
69.69
70.97
70.5
Puducherry
76.05
78.05
82.62
Punjab
75.79
69.57
77.49
Rajasthan
66.17
64.3
69.32
Sikkim
91.75
88.21
90.82
Tamil Nadu
74.62
72.09
73.17
Tripura
85.36
83.83
83.88
Uttar Pradesh
65.61
67.23
69.65
Uttarakhand
76.96
76.36
78.71
West Bengal
77.56
79.53
81.79
Telangana
67.98
63.83
62.37
India
69.37
68.27
70.82
Mean
74.93
72.91
75.69
Standard Deviation
9.68
10.11
9.87
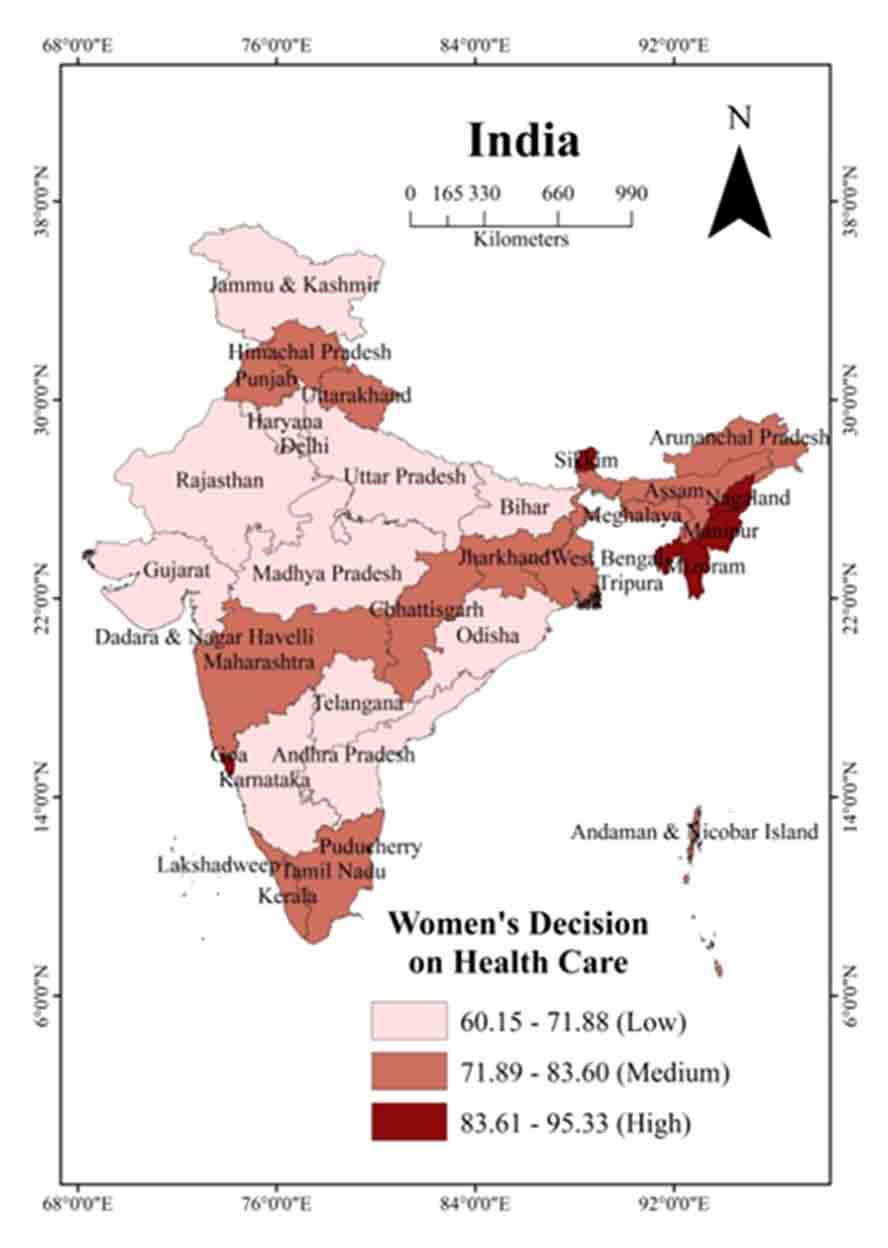
In India, around 70.82% of women are making their decision on health care. In Andhra Pradesh, women have less say in health decision-making. States like Goa, Gujarat, Haryana, Karnataka, Madhya Pradesh, Delhi, Odisha, Rajasthan, Uttar Pradesh and Telangana have Shown poor performance compared to the national average (Table 1 and Figure 3).
Figure 3. Women’s decision on health care
Table 2 depicts the physical movement-related autonomy of women. Here three basic movements, going to the market, going to the health facility and going outside of the village were considered for the discussion. In India, around 86.72 % of women are allowed to go to the market alone or with someone. Among the states/UT women from Kerala (66.84%) have the lowest autonomy to go to market.
Table 2. Percentage distribution of decision-making autonomy of women aged (15-49 years) in India
States/Union Territories
Allow to go to the health facility
Allow to go outside of village
Allow to go to the market
Andaman and Nicobar Island
98.56
96.85
98.56
Andhra Pradesh
79.1
77.44
78.41
Arunachal Pradesh
96.71
95.77
95.18
Assam
93.14
93.12
88.67
Bihar
85.19
77.86
81.94
Chandigarh
100
100
100
Chhattisgarh
93.59
91.4
87.08
Dadra and Nagar Havel
94.19
84.9
96.97
Daman and Diu
100
100
100
Goa
94
91.09
92.29
Gujarat
95.17
93.71
94.61
Haryana
90.38
83.18
89.58
Himachal Pradesh
99
98.58
98.28
Jammu and Kashmir
99.02
98.21
97.97
Jharkhand
91.93
89.19
86.83
Karnataka
90.56
89.09
88.44
Kerala
98.1
97.79
66.84
Lakshadweep
97.76
95.54
79.13
Madhya Pradesh
90.29
88.62
87.73
Maharashtra
93.54
91.19
89.09
Manipur
98.44
96.35
97.38
Meghalaya
98.77
96.92
98.14
Mizoram
96.95
95.82
96.85
Nagaland
95.46
92.9
92.5
Delhi
95.55
92.09
95.61
Odisha
96.65
92.68
90.13
Pondicherry
88.19
78.06
80.57
Punjab
96.52
95.01
96.71
Rajasthan
94.88
92.14
93.85
Sikkim
99.17
99.17
98.62
Tamil Nadu
90.13
84.69
86.79
Tripura
98.61
98.8
96.81
Uttar Pradesh
89.33
84.44
84.21
Uttarakhand
92.1
90.08
90.31
West Bengal
93.13
89.17
86.28
Telangana
81.17
77.78
76.34
India
90.91
87.28
86.72
Mean
94.04
91.38
90.52
Standard Deviation
5.02
6.63
7.75
In comparison to the nation poor-performing states/UTs are Telangana, West Bengal, Uttar Pradesh, Tamil Nadu, Pondicherry, Lakshadweep, Kerala, Chhattisgarh and Bihar and Andhra Pradesh. While the women from Kerala and Telangana have low autonomy to go to the market (Figure 4). Around 90.91% of women in India can go to health centers alone or with someone in India. Poor performing states/UTs are, Telangana, Uttar Pradesh, Tamil Nadu, Pondicherry, Madhya Pradesh, Karnataka, Haryana, Bihar and Andhra Pradesh (Table 2).
Figure 4. Women are allowed to go to market
Around 87.28% of women in India are allowed to go outside of the village. In comparison to India, poor-performing States/UT’s are Telangana, Uttar Pradesh, Tamil Nadu, Pondicherry, Haryana, Dadra and Nagar Haveli and Bihar and Andhra Pradesh. Among them once again in Andhra Pradesh (77.44 %), women have the lowest autonomy related to going outside of the village (Table 2 and Figure 6).
Figure 5. Women are allowed to go to health facility
Figure 6. Women are allowed to go outside the village
Table 3 represents the percentage (weighted) distribution of women’s autonomy in decision-making (15-49 years) by various socioeconomic characteristics. The result shows that the percentage of women aged 35-49 years are more likely to participate in health care decisions, large household purchases and decisions on visiting family or friends than the younger women. It is found that with increasing age autonomy among the women in decision-making also increased. So it may be said that the relationship between age and women’s autonomy is significantly associated (p = 0.000). Place of residence also affects women’s autonomy to make their own decisions (p=0.000). Rural women are less likely to have autonomy in decision-making in all three outcome measures than the women from urban counterparts. Women of other and Christian religions are more likely to have autonomy in decision-making compared to Muslim and Hindu women. Education shows a positive association with women’s autonomy in decision-making (p=0.000). Here it is found that with increasing education levels, women are found to be more autonomous in decision-making compared to those who have primary or secondary or no formal education. There is a negative relationship between the increasing number of living children and women’s autonomy in decision-making. Women with 1 child are more likely to participate in decision-making in all three outcome measures than women who have more than 5 children. The occupational status of the women shows a significant relationship with the three outcome measures (p=0.000). Employed women are more likely to participate in health care decision-making, large household purchases and the decision to visit their family or friends than those who are not employed. Interestingly it is found that the wealth quintile is positively associated with the women’s ability to take part in the decision-making process like health care, large household purchases and a visit to family or friends (p=0.000). With increasing wealth status, autonomy in decision-making also increased and the richest women are more likely to be autonomous than the poorest women. Compared to all other regions, the likelihood of autonomy in decision-making like health care, large household purchases and a visit to family or friends is high among the women who are from the northeastern region (p=0.000).
Table 3. Descriptive statistics and proportion of women in decision-making with various socioeconomic characteristics
Variables
Frequency (Percentage)
Decision on healthcare
Large household purchase
Decision on visiting family or friends
Respondent alone or Jointly
P-Value
Respondent alone or Jointly
P-Value
Respondent alone or Jointly
P-Value
Age of the women in years
15-24
11943(34.34)
69.83
0.000
66.39
0.000
68.32
0.000
25-34
22512 (57.39)
73.38
71.04
71.94
35-49
3883(8.27)
76
74.5
73.55
Place of residence
Urban
9383(28.54)
74.11
0.0000
72.92
0.000
74.59
0.000
Rural
28955(71.46)
72.03
68.98
70.04
Religion
Hindu
27699(78.73)
71.33
0.000
68.72
0.000
69.74
0.000
Muslim
6360(16.56)
68.99
66.49
67.2
Christian
3853(4.13)
85.54
83.05
86.3
Others
426(0.59)
86.62
82.39
85.68
Level of education
No education
11250(28.16)
67.58
0.000
65.32
0.000
65.17
0.000
Primary
5385(13.32)
71.42
69.47
70.27
Secondary
17842(47.27)
74.26
71.05
73
Higher
3861(11.24)
80.57
78.94
81.3
Number of living children
1
9755(26.51)
73.38
0.060
70.4
0.613
72.06
0.000
2
14650(40.12)
72.99
69.95
71.62
3
7632(18.97)
71.76
69.51
70.3
4
3489(8.19)
71.65
70.22
70.97
More than 5
2812(6.20)
70.48
69.13
68.21
Occupational status
Non-working
31810(83.67)
71.69
0.000
69.32
0.000
70.57
0.000
Working
6528(16.33)
76.67
72.96
74.02
Wealth Quintile
Poorest
9338(23.64)
70.55
0.000
67.65
0.000
67.35
0.000
Poorer
8849(21.71)
71
69.13
70.35
Middle
7872(20.64)
72.6
70.66
71.81
Richer
6588(18.21)
73.63
70.78
72.78
Richest
5641(15.80)
76.9
73.07
75.94
Region
North
7850(13.27)
72.1
0.000
66.27
0.000
69.39
0.000
Central
10496(25.81)
70.16
68.12
67.79
East
7578(24.48)
70.45
68.91
67.29
North East
4979(03.35)
83.81
82.97
84.72
West
3226(13.69)
73.22
67.95
73.9
South
4209(19.41)
69.19
69.33
71.68
Table 4 shows the percentage (weighted) distribution of women’s physical movement (15-49 years) by various socioeconomic characteristics. It is observed that age and women’s autonomy regarding physical movement are positively associated (p = 0.000). The women aged 35-49 years are found to be more autonomous in physical movement like visiting the market, receiving health facilities and visiting outside of the village than the younger women. Rural women are less likely to have autonomy in physical movement in all three outcome measures than the women from urban counterparts (p=0.000). Women of other religions are more likely to have autonomy compared to Muslim and Hindu women. Education shows a positive association with women’s autonomy regarding physical movement (p=0.000). As far as increasing education level, women are found to be more autonomous compared to those who have primary or secondary or no formal education. It is observed that women who have 2 children are more likely to have autonomy regarding visiting the market and receiving health facilities. In contrast, women with 5+ children have more autonomy to visit outside of the village compared to others. The occupational status of the women shows a significant relationship with the three outcome measures (p=0.000). Employed women are more likely to visit the market, receive health facilities and visit outside of the village than those who were not employed. The wealth quintile is also positively associated with women’s autonomy in physical movement (p=0.000). The richest women are more likely to be autonomous than the poorest women. Women from northeastern regions are more likely to have autonomy in decision-making regarding physical movement in all three outcome measures (p=0.000).
Table 4. Descriptive statistics and proportion of women by physical movements and various socioeconomic characteristics
Variables
Frequency (Percentage)
Visiting market
Health facility
Visiting outside of the village
Alone or with someone
P-Value
Alone or with someone
P-Value
Alone or with someone
P-Value
Age of the women in years
15-24
11943(34.34)
86.63
0.000
91.1
0.000
87.05
0.000
25-34
22512 (57.39)
90.2
93.24
90.2
35-49
3883(8.27)
91.92
94.41
92.76
Place of residence
Urban
9383(28.54)
91.6
0.000
94.07
0.000
91.23
0.000
Rural
28955(71.46)
88.5
92.24
88.91
Religion
Hindu
27699(78.73)
88.82
0.000
92.21
0.000
88.45
0.000
Muslim
6360(16.56)
87.19
91.95
89.86
Christian
3853(4.13)
94.96
96.76
95.25
Others
426(0.59)
97.65
97.65
98.36
Level of education
No education
11250(28.16)
88.2
0.000
91.53
0.000
88.27
0.000
Primary
5385(13.32)
89.95
93.18
90.4
Secondary
17842(47.27)
88.89
92.74
89.48
Higher
3861(11.24)
93.11
95.13
91.71
Number of living children
1
9755(26.51)
88.44
0.030
92.17
0.050
88.81
0.050
2
14650(40.12)
89.69
93.17
89.61
3
7632(18.97)
89.41
92.52
89.41
4
3489(8.19)
89.6
92.58
90.26
More than 5
2812(6.20)
89.05
92.53
90.33
Occupational status
Non-working
31810(83.67)
88.89
0.000
92.03
0.000
88.95
0.000
Working
6528(16.33)
91.05
93.93
92.03
Wealth Quintile
Poorest
9338(23.64)
87
0.000
91.16
0.000
87.65
0.000
Poorer
8849(21.71)
88.16
92.54
89.23
Middle
7872(20.64)
90
92.99
90.04
Richer
6588(18.21)
90.51
93.03
89.86
Richest
5641(15.80)
92.25
94.63
91.67
Region
North
7850(13.27)
94.75
0.000
95.38
0.000
93.29
0.000
Central
10496(25.81)
86.9
90.85
87.3
East
7578(24.48)
85.35
90.31
84.78
North East
4979(03.35)
94.96
96.99
95.84
West
3226(13.69)
91.79
94.45
92.03
South
4209(19.41)
83.27
90.07
86.77
Table 5 depicts the result of unadjusted and adjusted logistic regression analysis assessing the factors associated with different socioeconomic characteristics and women’s decision-making autonomy. The result shows that age has a positive relationship with women’s decision-making autonomy. The older women (35-49 years) are more likely to participate in health care decisions [UOR 1.367, 95% CI:1.258-1.486, p <0.001] [AOR 1.403, 95% CI: 1.271-1.548, p < 0.001], large household purchase [UOR 1.795, 95% CI: 1.362-1.604, p <0.001] [AOR 1.479, 95% CI: 1.344-1.627, p <0.001] and decision on visiting family or friends [UOR 1.417, 95% CI: 1.305-1.539, p <0.001] [AOR 1.458, 95% CI: 1.321-1.608, p < 0.001] compared to the younger women. Place of residence also plays a significant role in decision-making autonomy among women. The women who live in rural areas are less likely to be autonomous in deciding on health care, large household purchases and visiting family or friends than the women from urban counterparts. Women from Muslim communities are found a lower level of autonomy than others. Higher-educated women are more likely to participate in decision-making in all three outcome measures and freedom of movement-related outcomes. The more children women have, the less likely they participate in deciding on health care, large household purchases and the decision on visiting their family or friends. Employed women are more likely to make decisions on health care [UOR 1.29, 95% CI: 1.219-1.381, p <0.001] [AOR 1.252, 95% CI: 1.175-1.336, p <0.001] and other decisions. Women who belong to richer households participated more in basic decision-making. Women from the northeastern region are more likely to be autonomous in deciding on health care, large household purchases and visiting family or friends compared to other regions.
Table 5. Unadjusted and adjusted logistic regression analysis assessing the factors associated with different socioeconomic characteristics and women's decision-making autonomy
Variables
Decision on healthcare
Large household purchase
Decision on visiting family or friends
Crude
Adjusted
Crude
Adjusted
Crude
Adjusted
Age of the women in years
15-24
®
®
®
®
®
®
25-34
1.19***
(1.133-1.25)
1.198***
(1.13-1.266)
1.107***
(1.183-1.301)
1.242***
(1.177-1.310)
1.882***
(1.132-1.247)
1.184***
(1.122-1.250)
35-49
1.367***
(1.258-1.486)
1.403***
(1.271-1.548)
1.795***
(1.362-1.604)
1.479***
(1.344-1.627)
1.417***
(1.305-1.539)
1.458***
(1.321-1.608)
Place of residence
Urban
®
®
®
®
®
®
Rural
0.899***
(0.853-0.948)
0.968
(0.911-1.029)
0.825***
(0.784-0.869)
0.868***
(0.817-0.922)
0.796***
(0.755-0.839)
0.870***
(0.819-0.925)
Religion
Hindu
®
®
®
®
®
®
Muslim
0.894***
(0.843-0.949)
0.918**
(0.863-0.977)
0.903***
(0.852-0.957)
0.915***
(0.862-0.973)
0.889***
(0.838-0.942)
0.900***
(0.846-0.957)
Christian
2.378***
(2.166-2.611)
1.707***
(1.533-1.900)
2.231***
(2.042-2.435)
1.547***
(1.398-1.712)
2.733***
(2.484-3.006)
1.837***
(1.648-2.048)
Others
2.602***
(1.966-3.443)
2.062***
(1.549-2.74)
2.130***
(1.657-2.736)
1.572***
(1.216-2.032)
2.597***
(1.977 -3.409)
2.076***
(1.571-2.744)
Level of education
No education
®
®
®
®
®
®
Primary
1.198***
(0.843-0.949)
1.165***
(1.083-1.255)
1.207***
(1.126-1.295)
1.174***
(1.092-1.263)
1.263***
(1.177-1.354)
1.184***
(1.100-1.275)
Secondary
1.384***
(2.166-2.611)
1.38***
(1.296-1.470)
1.301***
(1.238-1.370)
1.299
(1.222-1.382)
1.445***
(1.373-1.520)
1.368***
(1.285-1.456)
Higher
1.989***
(1.966-3.443)
1.921***
(1.725-2.141)
1.990***
(1.825-2.170)
1.973***
(1.777-2.192)
2.323***
(2.123-2.541)
2.173***
(1.951-2.422)
Number of living children
1
®
®
®
®
®
®
2
0.98
(0.925-1.038)
1.009
(0.950-1.072)
0.978
(0.925-1.034)
1.004
(0.946-1.064)
0.978
(0.924-1.035)
1.022
(0.963-1.086)
3
0.922***
(0.862-0.986)
0.962
(0.893-1.037)
0.958
(0.897-1.022)
0.983
(0.914-1.058)
0.918***
(0.859-0.980)
0.996
(0.925-1.073)
4
0.917***
(0.841-0.999)
0.957
(0.868-1.055)
0.991
(0.910-1.078)
1.007
(0.915-1.108)
0.947
(0.870-1.032)
1.044
(0.947-1.151)
More than 5
0.866***
(0.789 -0.950)
0.855***
(0.764-0.958)
0.941
(0.859-1.031)
0.900*
(0.806-1.001)
0.832***
(0.759-0.911)
0.859***
(0.769-0.961)
Occupational status
Non-working
®
®
®
®
®
®
Working
1.29***
(1.219-1.381)
1.252***
(1.175-1.336)
1.194***
(1.125-1.267)
1.140***
(1.071-1.212)
1.188***
(1.118-1.262)
1.128***
(1.060-1.202)
Wealth Quintile
Poorest
®
®
®
®
®
®
Poorer
1.022
(0.958-1.089)
0.924**
(0.864-0.988)
1.071***
(1.005-1.139)
0.990
(0.927-1.058)
1.149***
(1.079-1.224)
1.003
(0.939-1.073)
Middle
1.106***
(1.034-1.182)
0.963
(0.893-1.039)
1.151***
(1.078-1.228)
1.038
(0.963-1.117)
1.235***
(1.156-1.318)
1.01
(0.936-1.086)
Richer
1.166***
(1.086-1.251)
0.957
(0.878-1.044)
1.158***
(1.081-1.240)
0.972
(0.89-1.057)
1.296***
(1.209-1.389)
0.963
(0.884-1.048)
Richest
1.389***
(1.287-1.499)
1.006
(0.907-1.115)
1.297***
(1.206-1.395)
0.955
(0.865-1.055)
1.53
(1.420-1.649)
0.971
(0.878-1.075)
Region
North
®
®
®
®
®
®
Central
0.909***
(0.852-0.970)
0.981
(0.916-1.050)
1.087***
(1.022-1.157)
1.162***
(1.088-1.241)
0.928***
1.002
(0.938-1.072)
East
0.923***
(0.860-0.989)
1.009
(0.936)
1.128***
(1.054-1.207)
1.238***
(1.151-1.333)
0.907***
(0.847-0.971)
0.998
(0.927-1.075)
North East
2.003***
(1.830-2.192)
1.561***
(1.411-1.729)
2.479***
(2.272 -2.706)
2.012***
(1.823-2.221)
2.445***
(2.232-2.677)
1.850***
(1.671-2.049)
West
1.057
(0.964-1.159)
1.031
(0.938-1.134)
1.079**
(0.988-1.177)
1.056
(0.965-1.156)
1.249***
(1.139-1.369)
1.217***
(1.107-1.338)
South
0.868***
(0.800-0.942)
0.789***
(0.725-0.861)
1.150***
(1.061-1.247)
1.049
(0.965-1.141)
1.116***
(1.028-1.212)
1.004
(0.921-1.093)
Data is presented as odds ratio (OR) [95% confidence interval] ***p <0.01,**p <0.05, *P <0.10, ® = Reference category.
Table 6 represents the result of the unadjusted and adjusted logistic regression analysis assessing the factors associated with different socioeconomic characteristics and women’s physical movement-related autonomy. The result shows that age has a positive relationship with women’s physical movement-related autonomy. The older women (35-49 years) are more likely to have the autonomy to visit the market, go to health facilities and visit outside of the village than the younger women. Place of residence also plays a significant role in decision-making autonomy regarding physical movement among women. The women from the rural areas have limited autonomy related to physical movement like visiting the market, going to health facilities and visiting outside of the village compared to the women who were urban counterparts. Muslim women have enjoyed less autonomy compared to others. Higher educated women are more likely to participate in decision-making in all three outcome measures i.e. visiting market [UOR 1.807, 95% CI: 1.575-2.072, p <0.001] [AOR 1.432, 95% CI: 1.216-1.687, p <0.001], going for health facility [UOR 1.808, 95% CI: 1.539-2.123, p <0.001] [AOR 1.541, 95% CI: 1.272-1.867, p <0.001] and visiting outside of village [UOR 1.471, 95% CI<1.294-1.671, p <0.001] [AOR 1.308, 95% CI:1.119-1.523, p <0.001]. The more children women have, the less likely they participate in making decisions on physical movement like visiting the market [UOR 1.063, 95% CI: 0.930-1.214] [AOR 0.940, 95% CI: 0.798-1.106], going for health facility and visiting outside of the village. Employed women are more likely to have autonomy whether visiting the market, going to the health facility, or visiting outside of the village compared to unemployed women. The richest women are more likely to take their own decision to visit market [UOR 1.778, 95% CI: 1.585-1.994, p<0.001], go to health facility [UOR 1.701, 95% CI: 1.491-1.957, p<0.001] [AOR 1.078, 95% CI: 0.901-1.291] and visit outside of village [UOR 1.549, 95% CI: 1.384-1.734, p<0.001]. Women from the north-eastern region are more likely to be autonomous in deciding on visiting the market [UOR 1.043, 95% CI: 0.888-1.225], going to a health facility [UOR 1.561, 95% CI: 1.286-1.894, p <0.001] [AOR 1.329, 95% CI: 0.075-1.642, p<0.001] and visiting outside of village compared to all other regions.
Table 6. Unadjusted and adjusted logistic regression analysis assessing the factors associated with different socioeconomic characteristics and women’s physical movement-related autonomy
Visiting market
Go for a health facility
visiting outside of the village
Crude
Adjusted
Crude
Adjusted
Crude
Adjusted
Age of the women in years
15-24
®
®
®
®
®
®
25-34
1.420***
(1.326-1.521)
1.301***
(1.203-1.406)
1.348***
(1.242-1.462)
1.283***
(1170-1.407)
1.368***
(1.276-1.466)
1.289***
(1.192-1.393)
35-49
1.754***
(1.545-1.991)
1.603***
(1.380-1.862)
1.655***
(1.421-1.921)
1.572***
(1.317-1.875)
1.906***
(1.669-2.176)
1.714***
(1.469-1.999)
Place of residence
Urban
®
®
®
®
®
®
Rural
0.705***
(0.650-0.765)
0.706***
(0.642-0.775)
0.748***
(0.679-0.823)
0.765***
(0.686-0.855)
0.771***
(0.711-0.835)
0.787***
(0.718-0.864)
Religion
Hindu
®
®
®
®
®
®
Muslim
0.856***
(0.788-0.930)
0.693***
(0.635-0.757)
0.965
(0.872-1.066)
0.843***
(0.758-0.936)
1.156***
(2.247-3.051)
1.011
(0.920-1.110)
Christian
2.375***
(2.046-2.757)
1.299***
(1.096-1.541)
2.518***
(2.096-3.026)
1.360***
(1.106-1.673)
2.618***
(2.247-3.051)
1.369***
(1.151-1.623)
Others
5.238***
( 2.794-9.819)
4.452***
(2.363-8.389)
3.513***
(1.873-6.587)
2.800***
(1.488-5.284)
7.815***
(3.699-16.51015)
6.560***
(3.091-13.92)
Level of education
No education
®
®
®
®
®
®
Primary
1.197***
(1.077-1.331)
1.092
(0.977-1.219)
1.265***
(1.116-1.434)
1.171**
(1.028-1.334)
1.252***
(1.124-1.393)
1.173***
(1.049-1.312)
Secondary
1.069***
(0.993-1.151)
0.961
(0.878-1.053)
1.182***
(1.082-1.289)
1.098*
(0.987-1.222)
1.131***(
1.049-1.218)
1.087*
(0.993-1.191)
Higher
1.807***
(1.575-2.072)
1.432***
(1.216-1.687)
1.808***
(1.539-2.123)
1.541***
(1.272-1.867)
1.471***
(1.294-1.671)
1.308***
(1.119-1.523)
Number of living children
1
®
®
®
®
®
®
2
1.138***
(1.048-1.234)
1.145***
(1.051-1.248)
1.159**
(1.051-1.279)
1.169***
(1.056-1.294)
1.087**
(1.001-1.180)
1.068
(0.979-1.164)
3
1.104**
(1.003-1.215)
1.085
(0.974-1.201)
1.051
(0.938-1.176)
1.039
( 0.914-1.178)
1.065
(0.966-1.172)
1.006
(0.904-1.121)
4
1.126**
(0.993-1.276)
1.069
(0.927-1.232)
1.059
(0.915-1.226)
1.025
(0.868-1.210)
1.167**
(1.026-1.327)
1.064
(0.921-1.2310
More than 5
1.063
(0.930-1.214)
0.940
(0.798-1.106)
1.053
(0.898-1.234)
0.946
(0.780-1.147)
1.177**
(1.023-1.353)
0.948
(0.801-1.1230
Occupational status
Non-working
®
®
®
®
®
®
Working
1.27***
(1.160-1.394)
1.221***
(1.111-1.342)
1.268***
(1.136-1.415)
1.218***
(1.089-1.364)
1.437***
(1.303-1.579)
1.358***
(1.231-1.498)
Wealth Quintile
Poorest
®
®
®
®
®
®
Poorer
1.112**
(1.017-1.214)
1.019
(0.928-1.119)
1.203***
(1.081-1.338)
1.060
(0.947-1.186)
1.167***
(1.065-1.278)
1.007
(0.915-1.109)
Middle
1.344***(
1.222-1.478)
1.210***
(1.086-1.349)
1.286***
(1.149-1.438)
1.076
(0.947-1.223)
1.273***
(1.156-1.401)
1.037
(0.929-1.157)
Richer
1.425***
(1.286-1.578)
1.188***
(1.048-1.347)
1.295***
(1.150-1.458)
0.994
(0.859-1.150)
1.248***
(1.128-1.380)
0.930
(0.823-1.053)
Richest
1.778***
(1.585-1.994)
1.158**
(0.994-1.348)
1.701***
(1.491-1.957)
1.078
(0.901-1.291)
1.549***
(1.384-1.734)
0.985
(0.846-1.145)
Region
North
®
®
®
®
®
®
Central
0.367***
(0.327-0.411)
0.374***
(0.332-0.421)
0.482***
(0.425-0.545)
0.497***
(0.437-0.566)
0.495***
(0.445-0.549)
0.507***
(0.455-0.566)
East
0.322***
(0.286-0.363)
0.349***
(0.308-0.396)
0.452***
(0.396-0.514)
0.488***
(0.424-0.561)
0.401***
(0.359-0.446)
0.419***
(0.373-0.471)
North East
1.043
(0.888-1.225)
0.920
(0.493-1.097)
1.561***
(1.286-1.894)
1.329***
(1.075-1.642)
1.659***
(1.406-1.956)
1.359***
(1.135-1.628)
West
0.619***
(0.527-0.726)
0.580***
(0.493-0.683)
0.825**
(0.686-0.991)
0.793**
(0.658-0.957)
0.832***
(0.711-0.970)
0.820**
(0.701-0.961)
South
0.276***
(0.242-0.313)
0.243***
(0.213-0.2778)
0.439***
(0 .380-0.508)
0.402***
(0.346-0.467)
0.472***
(0.416-0.534)
0.453***
(0.398-0.516)
Data is presented as odds ratio (OR) [95% confidence interval] ***p <0.01,**p <0.05, *P <0.10, ® = Reference category.
4 . DISCUSSION
In this research work, we have tried to find out how various socioeconomic factors play an important role in women’s autonomy. At first, we have seen that with the increasing age of women, higher levels of autonomy have been seen among women. The result of cross-tabulation and bivariate and multivariate analyses suggest a similar result. One of the studies in Nepal showed a similar kind of outcome (Acharya et al., 2010). A multi-country study in India, Bangladesh and Nepal also indicates that women in higher age groups are more likely to participate decision making (Senarath and Gunawardena, 2009). Even a study in Bangladesh also indicates that women’s age is a very important factor, as with the increasing age of women they can enjoy more autonomy and empowerment (Tareque, 2011). Women with increasing age have fewer security issues and demand for fulfillment and also lost contact with their natal kin. It makes women independent in their decisions (Weerasinghe, 2005). Apart from the age of women, their place of residence also plays an important role in their decision-making capacity. Our study indicates that women from rural areas have less level of autonomy. This finding is indicating similar results with this previous work (Tareque, 2011; Woldemicael, 2010). Place of residence is widely taken as an important parameter of the decision-making of women, as many pre-existing conditions in rural areas induce poverty and access to resources. All these things are related to the poor decision-making capacity of a woman. Many studies conducted in South Asian countries also indicate similar kinds of outcomes (Acharya et al., 2010; Senarath and Gunawardena, 2009; Young, 1999).
An interesting thing has been found in the study that a woman from the Muslim community enjoys less autonomy in decision-making compared to women who belong to other religious groups. A cross-sectional study between Muslim and non-Muslims found that Muslim women had less autonomy, which resulted in a higher rate of fertility among Muslims (Morgan et al., 2002). The level of education of women is a very important indicator for the enhancement of women’s autonomy. It is always found that women’s higher level of education makes them more empowered. With increasing their level of education, they participated more in household decision-making. Similar evidence has been found in a multi-country in South America (Peru, Nicaragua, Bolivia), where it found that the education of women is an important indicator for the enhancement of women’s autonomy (Heaton et al., 2005). It also enhances their freedom of movement. Studies conducted in South Asia stated that if women were educated they enjoyed more autonomy in their decisions (Acharya et al., 2010; Tareque, 2011). A comparative analysis between Eritrea and Ethiopia implies in both countries educated women have more autonomy in their household decision-making (Woldemicael, 2010). Interestingly we came to know in our study those women who have more living children have less autonomy in household decision-making making but in some cases, women have more physical movement related if they have more living children. But another study made in Nepal stated that if women have more living children then they have more autonomy in their decisions (Acharya et al., 2010; Senarath and Gunawardena, 2009).
As to the expectation of women who are working, they enjoy more autonomy in family decisions and movement compared to non-working women. A study conducted in rural areas in India mentioned that women in South India have more autonomy than the Northern part, because of their higher education and employment (Singh, 2010). Studies stated that women engaged in paid work apart from household work have more autonomy rest of the non-working women (Acharya et al., 2010; Becker et al., 2006; Heaton et al., 2005; Woldemicael, 2010). A study in three South Asian countries stated that women who earn cash have a strong opinion on household decisions (Schwefel, 1986; Senarath and Gunawardena, 2009). The study implies that the wealth quintile has a strong impact on the empowerment outcomes of women. Women from richer and richer households have a higher occupancy of empowered women than poor women. Evidence from multi-country analyses revealed that women from the less-income group countries have a lower level of autonomy in comparison with the high-income group countries (Osamor and Grady, 2016). An India-level study based on National Family Health Survey-2 found that women from higher livelihood families in India have more decision-making capacity than other women (Gupta and Yesudian, 2006). Even a demographic study conducted in Nepal also suggested that women from richer households have more autonomy than those from poor households (Acharya et al., 2010). A very recent study conducted in Senegal related that women’s autonomy in family planning had similar outcomes, as women from the rich and richer households have more decision-making autonomy (Sougou et al., 2020).
5 . CONCLUSION
In the literature section, we come to know that women’s autonomy is a multi-dimensional aspect, which is indicated by their various decision-making and physical movement-related aspects. We also come to know that the various aspects of women’s autonomy are also largely influenced by the various socioeconomic aspects, such as their age, level of education, place of residence, occupational status and wealth status of the household. Our study also got a similar outcome. The age of the women is a vital factor in the enhancement of decision-making autonomy and freedom of movement for women. Among the other variables, their level of education also plays a critical role in the improvement of women’s status. Especially those women who are employed have more participation in decision-making. Also, these results validate a statistically significant association. Among other socioeconomic factors, their wealth status and place of residence influence the autonomy outcomes of the women. As per the results of the study and the supporting results it is clear to us that these socioeconomic aspects need to be taken very carefully by the policy makers. Among the socioeconomic variables, women’s level of education needs to be increased by proper policies so that it induces their level of autonomy. At the same time if women engage in any employment then also it will be helpful for the enhancement of their autonomy. Finally, women from the wealthy family have a higher level of autonomy so it is clear to us that if somehow we enhance the overall economic profile of the household, then it is possible to make women more autonomous. By this, we can deal with other social problems like child marriage, maternal mortality, child health and nutritional outcomes. By knowing the importance of these issues United Nations places gender equality and women empowerment as their major goals to achieve. So policymakers need to give more focus on the enhancement of women’s autonomy.
Tables
Figures
Conflict of Interest
The authors declare that there is no conflict of interest.
Acknowledgements
We are grateful to IIPS, Mumbai for proving us with the dataset.
Abbreviations
AOR: Adjusted Odds Ratio; IIPS: International Institution of Population Sciences; MOHFW: Ministry of Health and Family Welfare; NFHS: National Family Health Survey; OR: Odds Ratio; UOR: Unadjusted Odds Ratio.
Akindele, I. T., 2020. The role of gender and religion on women participation in Statistics have shown that women constitute about half of the Nigeria population and are.
Jeffery, R. and Basu, A. M., 1996. Girls' Schooling, Women's Autonomy and Fertility Change in South Asia. Sage Publications Inc., 2455 Teller Road, Thousand Oaks, CA 91320.
Kabir, M. A., Khan, M. M. H., Kabir, M., Rahman, M. M. and Patwary, M. F. K., 2005. Impact of woman's status on fertility and contraceptive use in Bangladesh: Evidence from Bangladesh Demographic and Health Survey, 1999-2000. Journal of Family Welfare, 51(1).
Tareque, I., 2011. Women empowerment or autonomy : A comparative view in Bangladesh Women empowerment or autonomy : A comparative view in Bangladesh context. Bangladesh E-Journal of Sociology, 8(2), 17-30.
23.
Osamor, P. E. and Grady, C., 2016. Women’s autonomy in health care decision- making in developing countries : A synthesis of the literature. 191-202.
24.
Peter, R., 2015. Child health and care giving practices in the slums of Hyderabad : role of women ’ s autonomy. Tata Institute Of Social Sciences.
Sultana, A. M., 2011. Factors effect on women autonomy and decision-making power within the household in rural communities. Journal of Applied Sciences Research, 7(1), 18-22.
36.
Weerasinghe, M. C., 2005. Health seeking behaviour pattern in a rural population in a district of Sri Lanka (Doctoral dissertation).


 ,
SABBIR MANDAL 1
,
SABBIR MANDAL 1