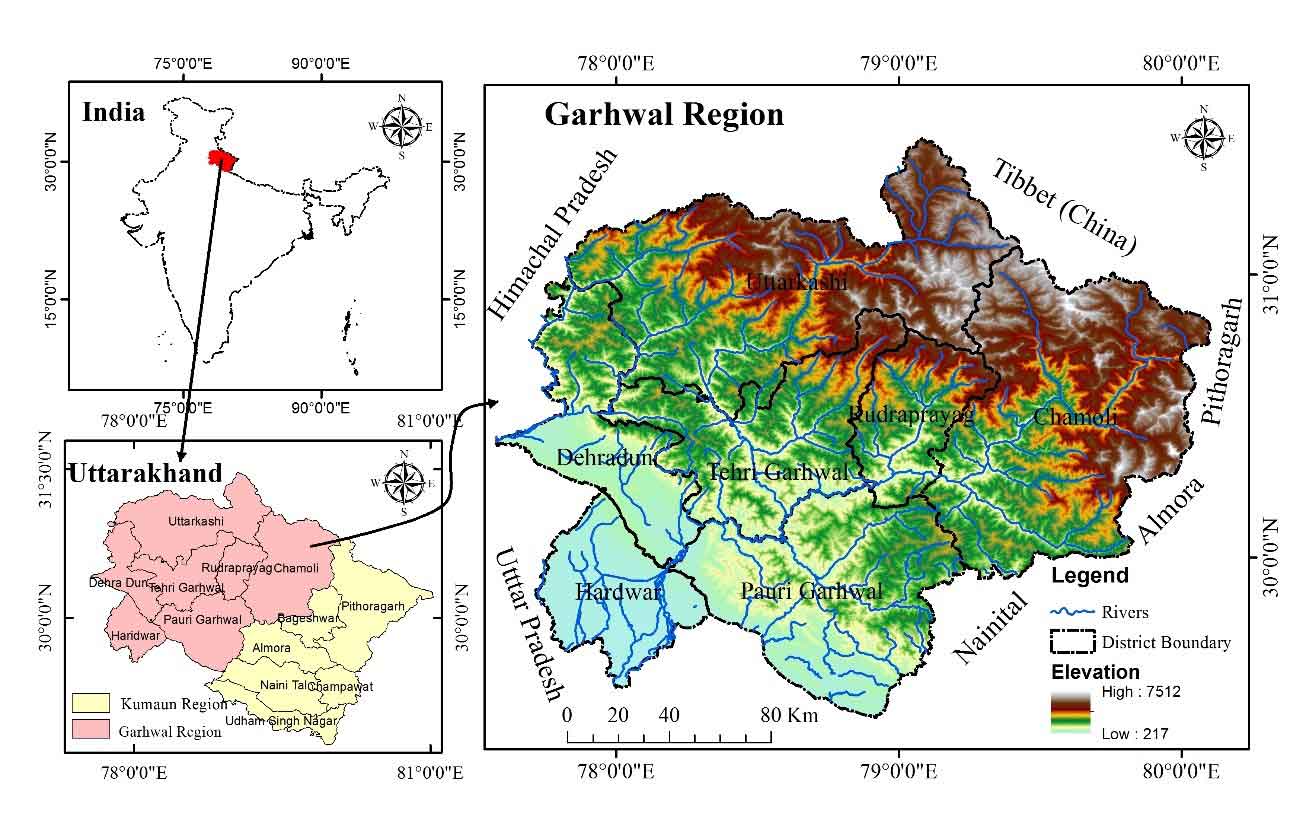
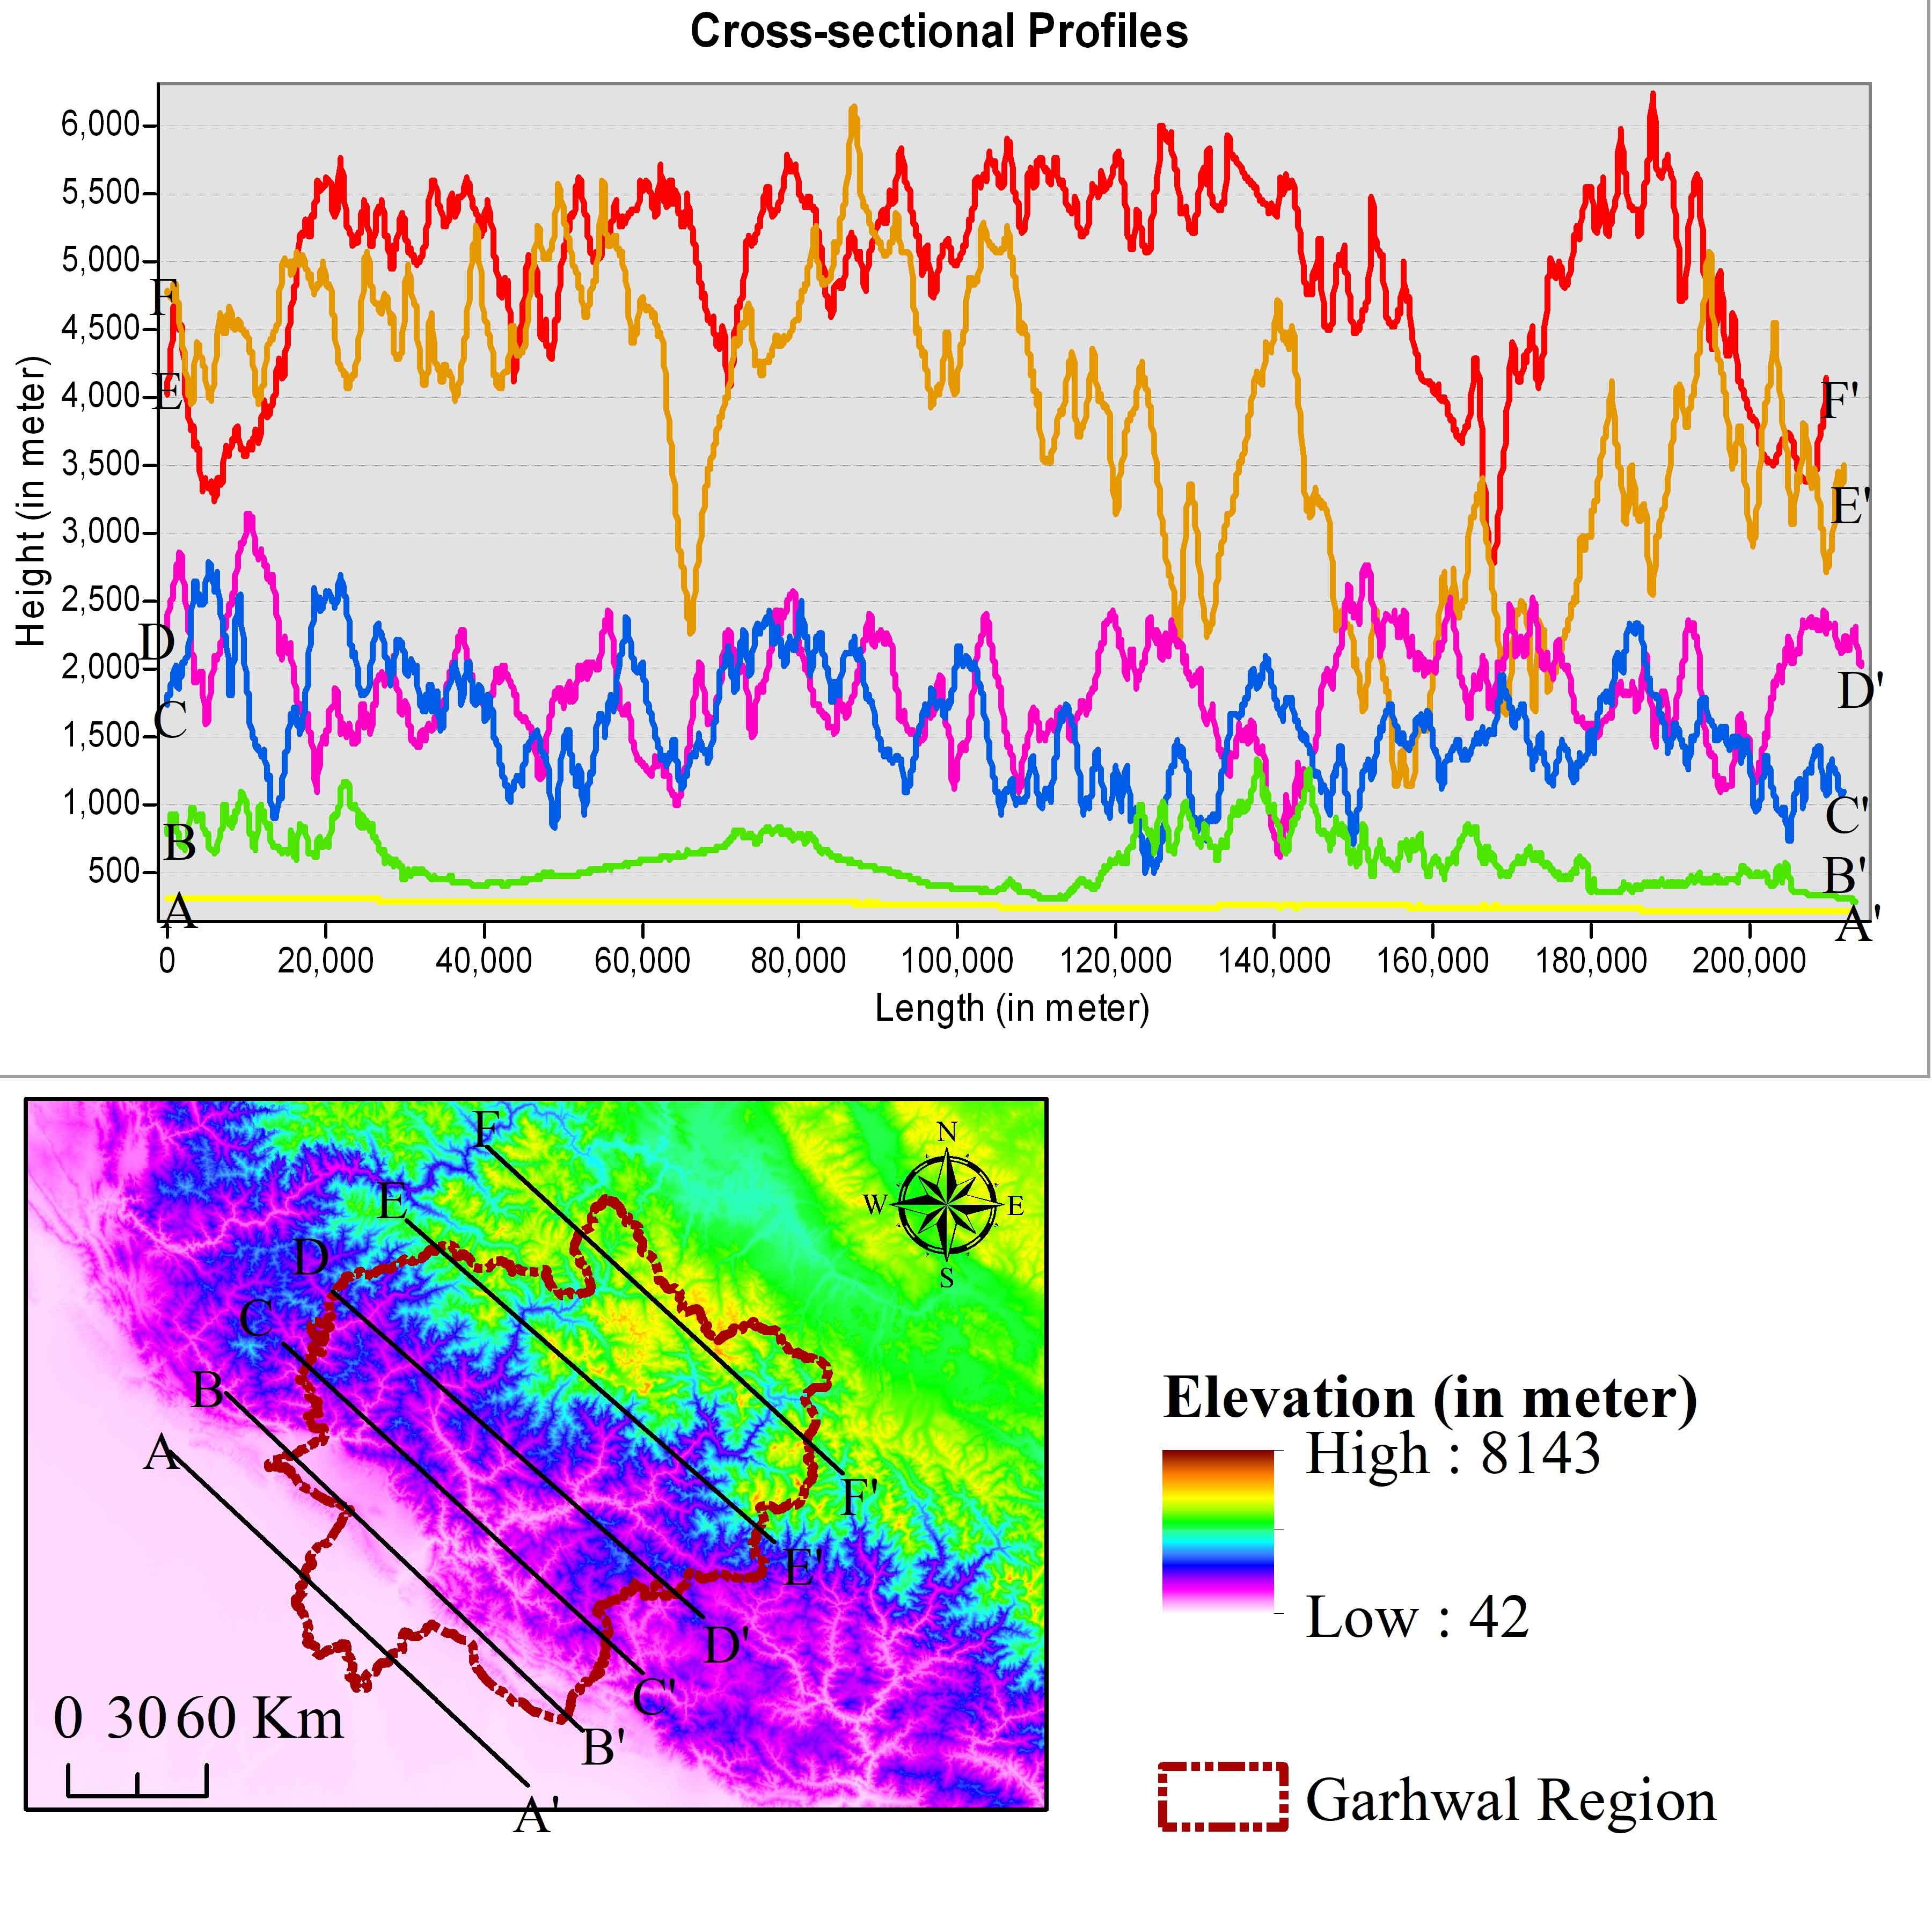
The Garhwal Himalayan region is the most dissected terrain characteristics compared to the other parts of northern India. It is due to the proximity and existence of numerous faults and thrusts. Some majors are MCT, MBT and HFF, which separates it into the four major physiographic zones: the Greater Himalayan range, the Lesser Himalayan range, the Shiwalik Himalayan range, and Ganges Great plains (Valdia, 1979; Valdiya, 1988; Mandal et al., 2023). The Garhwal region's absolute relief ranges from 145m to 7799m, shown in the figure 1. The relative relief indicates the regional/local relief range is classified by applying the ‘Z’ score standardised method into five relative relief categories shown in figure 8 (Table 2). The maximum area falls in the two major categories moderately high relief surface (40.49%), high relief, and steep slope surface (37.49%), whereas plain surface occupies 9.31%. Low relief surface 8.47 % area of the region, only 4.25% area remains in the very high relief surface in upper ridges of Greater Himalayan ranges (Figure 3).
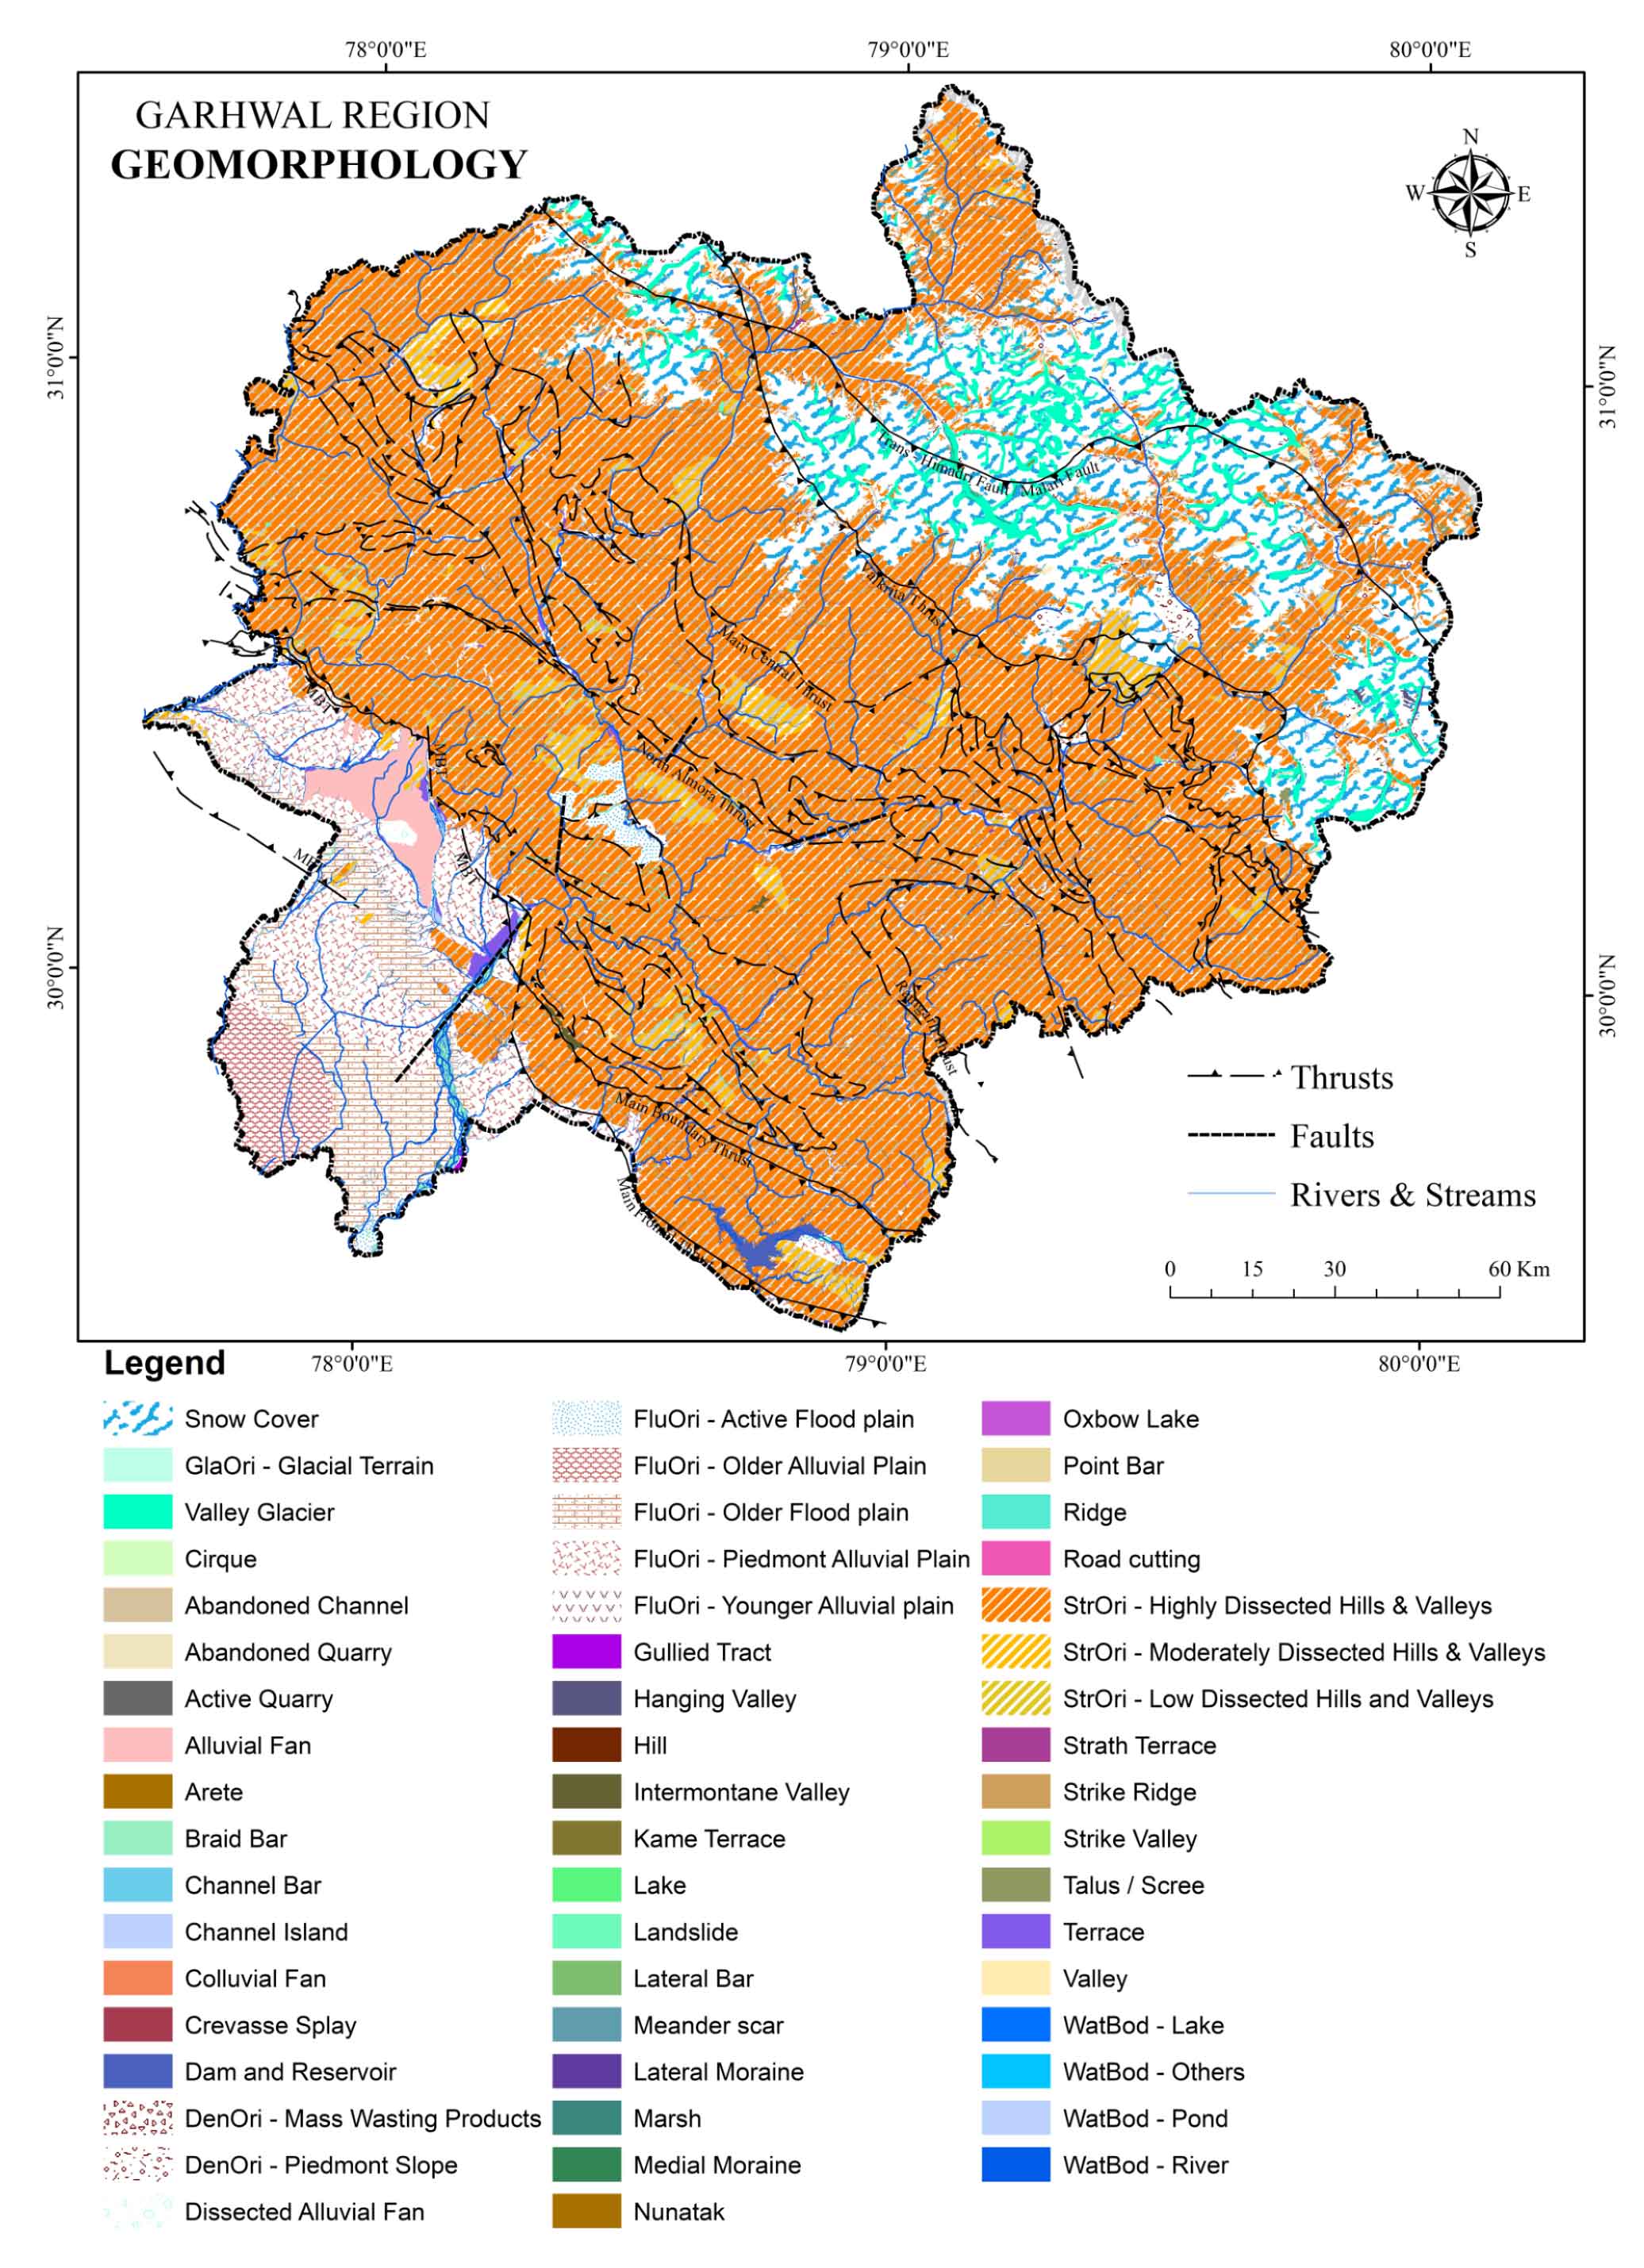
The zonal topographic characteristics indicate distinctive features developed due to various morphogenetic processes and structural progressions, i.e., glacial, fluvial, denudation, structural, and anthropogenic activities. According to the geomorphological map, different mophogenic processes result from the enormous variance in topography resulting in diverse climatic conditions, i.e. glacial, denudational, structural, fluvial (Figure 4). The northernmost part is influenced by glacial processes, where a significant part is perennially covered with scow in glaciers. The lower parts are largely glacio-fluvial processes, and most of the area is permafrost. There are various types of landforms, i.e., glacial terrain originated from glacial, cirque, arete, nunatak, kame terrace, hanging valley, lateral moraine and medial moraine found due to glacial processes (Figure 4). In the valley region in the upper part of the greater and lesser Himalayan ranges, denudational landforms (erosional and depositional) formed due to slope instability and rock formations are mass wasting products, piedmont slope and landslides found on various sites displayed in figure 4. In the Greater, Lesser, and Shiwalik Himalayan ranges in the region, maximum space is occupied by structural landform in the form of highly dissected hills and valleys, low dissected hills and valleys, moderately dissected hills and valleys, hills, ridge, intermontane valley, strike ridge and strike valley that is demonstrated in the map (Figure 4). In this whole region, moderately and less dissected valleys are the most habitable site for humans and their livelihood development. The fluvial process is most dominant in this sub-tropical monsoon climatic region; the Ganga, Yamuna and Ramganga rivers flowing in this region perennially develops a wide range of landforms (strath terrace, active flood plain, older flood plain, younger alluvial plain, older alluvial plain, piedmont alluvial plain, alluvial fan, point bar, braided bar, channel bar, lateral bar, channel sand, colluvial fan and dissected alluvial fan, crevasse splay, marsh, meander scar and oxbow lake) in their young, mature and old stage of landscape development (Figure 4). Besides natural processes, there are various landscapes, i.e., hill terraces, abandoned quarry, active quarry due to anthropogenic interventions and the moderate to nearly plain slope across the region.
The Garhwal Himalaya is characterized by a complex network of thrusts and faults, which not only define its geological framework but also exert a significant influence on river courses. These tectonic features distinctly separate the Trans-Himalaya, Greater Himalaya, Lesser Himalaya, and Shiwalik Himalaya, running from north to south.
The Mandhani Thrust demarcates the boundary between the Greater Himalaya and the Trans-Himalaya (Tethys Himalaya), which lies in the uppermost part of the region. The Main Central Thrust (MCT), a major geological feature nearly parallel to the Himalayan terrain, marks the transition between the Lesser Himalaya and the Central Crystalline zone (Figure 4). First identified by Heim and Gansser (1939) in the Kali Valley, this thrust was later redefined by Valdiya (1979), who termed it the Munsiari Thrust. Valdiya also discovered an additional thrust located a few kilometers north of the MCT, which transported high-grade metamorphic rocks to the Vaikrita Thrust in the Higher Himalayan region.
The MCT passes through several key locations, including Arakot, Naitwar, Bhatwari, Guttu, Ukhimath, Chopta, Helang, Karamnasa, Patal Ganga, Dhak, Tharali, and Loharkhet, Narayan Bagar. Reactivation of this thrust has triggered numerous landslides, notably in Karamnasa, Badeth, Kunjapuri, Sainj, Nald, Uttron, Mori, and Arakot. Further south, the Main Boundary Thrust (MBT) represents a major tectonic boundary, separating the Outer (Shiwalik) Himalaya from the Lesser Himalaya. Along this thrust plane, the older Lesser Himalayan sequences override the younger Tertiary formations. Although the MBT extends continuously for approximately 2400 km along the length of the Himalaya, additional crystalline thrusts-such as those in Almora, Bhatwari, Lansdowne, Satengal, Banali, and Purola-further contribute to the complex tectonic setting. Notable thrusts in the region include the North Almora Thrust, South Almora Thrust, Bhatwari Thrust, Amri Thrust, and Ramgarh Thrust (Valdiya, 1979).
Apart from these thrusts, tear faults, trending NNE-SSW, disrupt the continuity of the MBT at several locations, including Kalsi, Yamuna Tear, Song, Kesharwala, and Ganga Tear between Haridwar and Laxmanjhula. These faults influence the course of several smaller rivers, such as the Western Nayar, Mehdigad, and Jalkur (Figure 4). The Shiwalik Hills in the Garhwal region, located between the MBT and the Main Frontal Thrust (MFT), extend in a northeast-southwest direction (Figure 4). The Ganga River, flowing north to south, cuts across this range in the central part of the region.
Recent research by Mandal et al. (2023) explores the structural segmentation of the Uttarakhand Himalaya and its implications for earthquake hazards. Their analysis of seismic data identifies distinct structural segments within the region, which play a crucial role in determining the distribution and magnitude of seismic activity. Their findings underscore the importance of structural variations in earthquake occurrence, emphasizing the need for region-specific seismic hazard assessments and mitigation strategies in the Uttarakhand Himalaya.
4.2 Climatic Characteristics
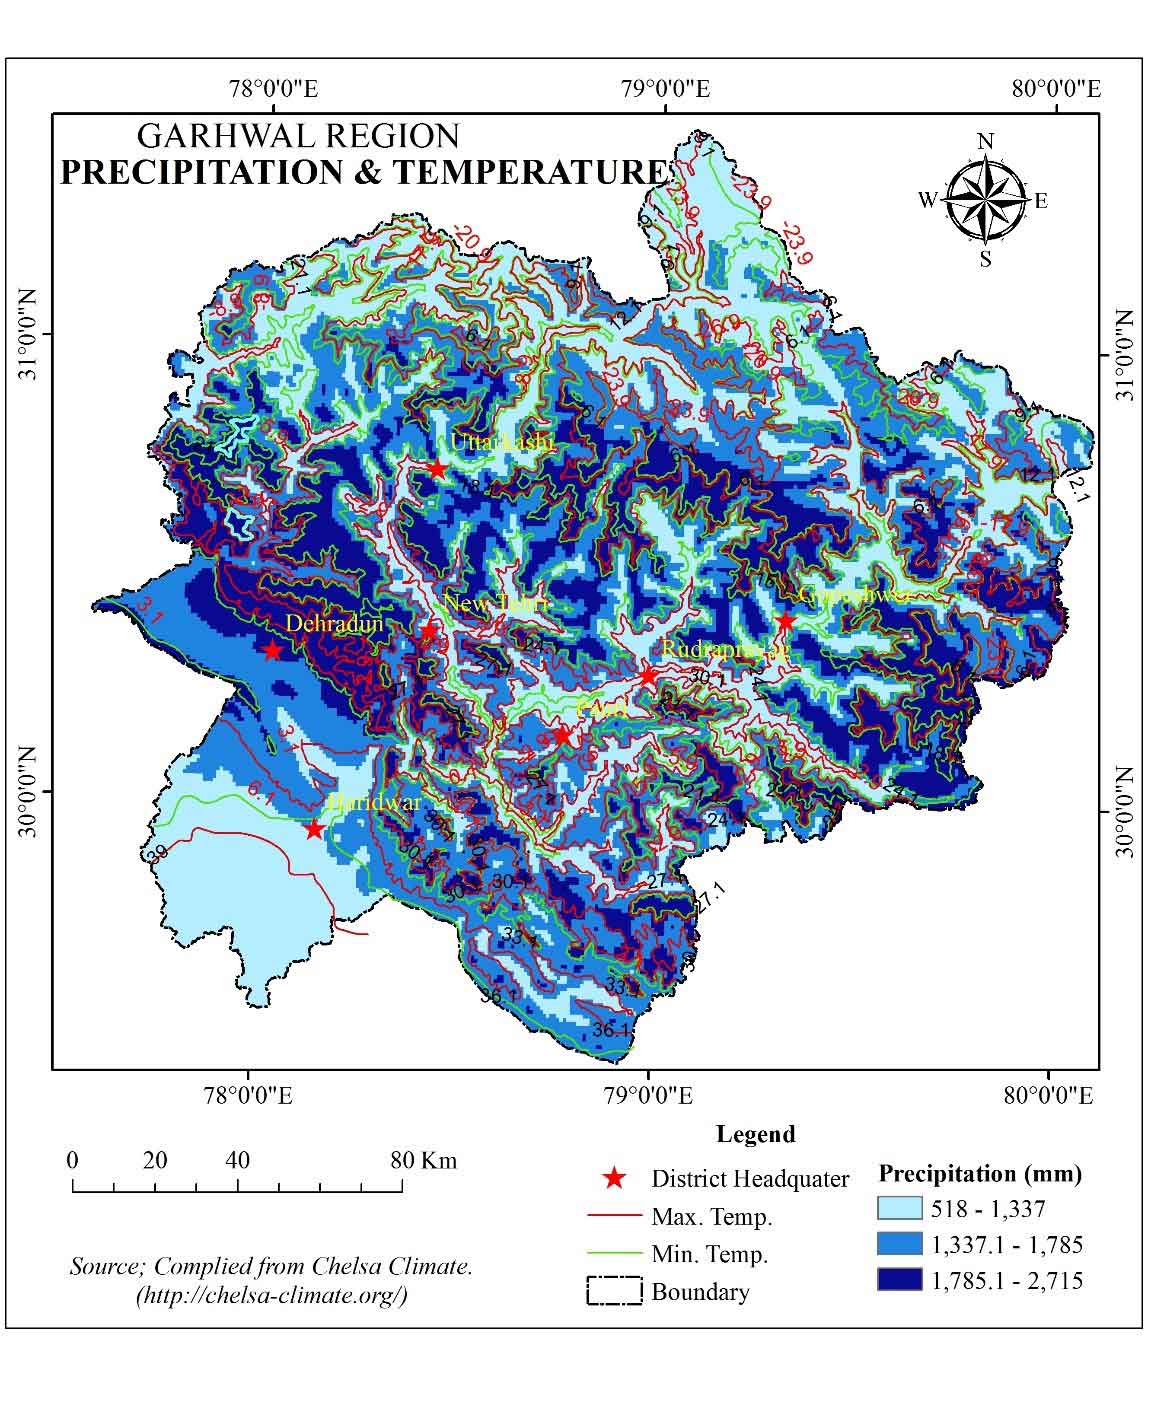
The Garhwal Himalayan region experiences three distinct climatic seasons: a warm summer from March to June, a humid and warm monsoon season from July to October, and a cold winter from November to February. This region is increasingly subjected to extreme weather events due to erratic precipitation patterns during the monsoon, making it highly susceptible to natural disasters such as cloudbursts, landslides, avalanches, and floods, particularly in the piedmont plains (Bhutiyani et al., 2009; Pal et al., 2016a, b). A common climatic phenomenon in this region is the decline in temperature with increasing elevation, influencing both spatial and temporal climatic patterns.
The Garhwal Himalaya exhibits a diverse climatic gradient, ranging from tropical conditions in the lowlands to glacial environments in the high-altitude zones. Based on elevation, seven distinct climatic zones have been identified from south to north: tropical (<300m), subtropical (301–800m), warm temperate (801–1600m), cool temperate (1601–2400m), cold temperate (2401–3200m), sub-alpine (3201–4000m), and glacial (>4000 m) (Kharkwal, 1993). Temperature and precipitation vary significantly across these altitudinal zones (Figure 5). The maximum recorded temperature across these zones is >39.9°C in tropical areas, 36.1°C in subtropical zones, 30.1°C in warm temperate regions, 24.1°C in cool temperate areas, 18.1°C in cold temperate zones, 9.1°C in sub-alpine regions, and <5°C in glacial zones. Minimum temperatures follow a similar pattern, ranging from 6.1°C in tropical areas to as low as -11.6°C in glacial regions.
Precipitation levels also vary with altitude, with annual precipitation exceeding 2500mm in the glacial zone, primarily in the form of snowfall and hailstorms. Other zones receive varying levels of precipitation: 2500–2700 mm in the sub-tropical zone, 2000–2500 mm in warm temperate areas, 1800–2000 mm in cool temperate regions, 1600–1800 mm in cold temperate areas, 1200–1600 mm in sub-alpine regions, and less than 900 mm in the lowest-lying tropical areas (Table 3). Numerous studies have explored climatic variations and their impact on both biotic and abiotic resources, emphasizing the importance of altitude-based climatic classification in understanding regional climatic patterns (Kaushik, 1962). The region experiencing climate change scenario is evident from the study that revealed climate change scenarios of the last 4000 years and found a significant impact on vegetation in different altitudes (Quamar et al, 2023; Demske et al., 2016; Bhattacharyya et al., 2011). The regional ecosystem is susceptible; therefore, it is suffering from drastic climate change due to various natural and anthropogenic factors resulting from cloudbursts, avalanches, glacial retreat, monsoon onset, and erratic rainfall patterns, drought, etc.
Table 3. Annual temperature and precipitation pattern
|
Climatic zones
|
Altitude (m)
|
Minimum temp. (°C)
|
Maximum temp. (°C)
|
Precipitation (mm)
|
|
Tropical
|
< 300
|
< 6.6
|
> 39.9
|
< 900
|
|
Sub-tropical
|
301-800
|
3.1
|
36.1
|
900-1200
|
|
Warm temperate
|
801-1600
|
0.1
|
30.1
|
1200-1600
|
|
Cool temperate
|
1601-2400
|
-2.9
|
24.1
|
1600-1800
|
|
Cold temperate
|
2401-3200
|
-8.9
|
18.1
|
1800-2000
|
|
Sub-alpine
|
3201-4000
|
-11.6
|
9.1
|
2000-2500
|
|
Glacial cover
|
> 4000
|
> -20.9
|
<5
|
> 2500
|
4.3 Altitude-Wise Spatial Distribution of Vegetation
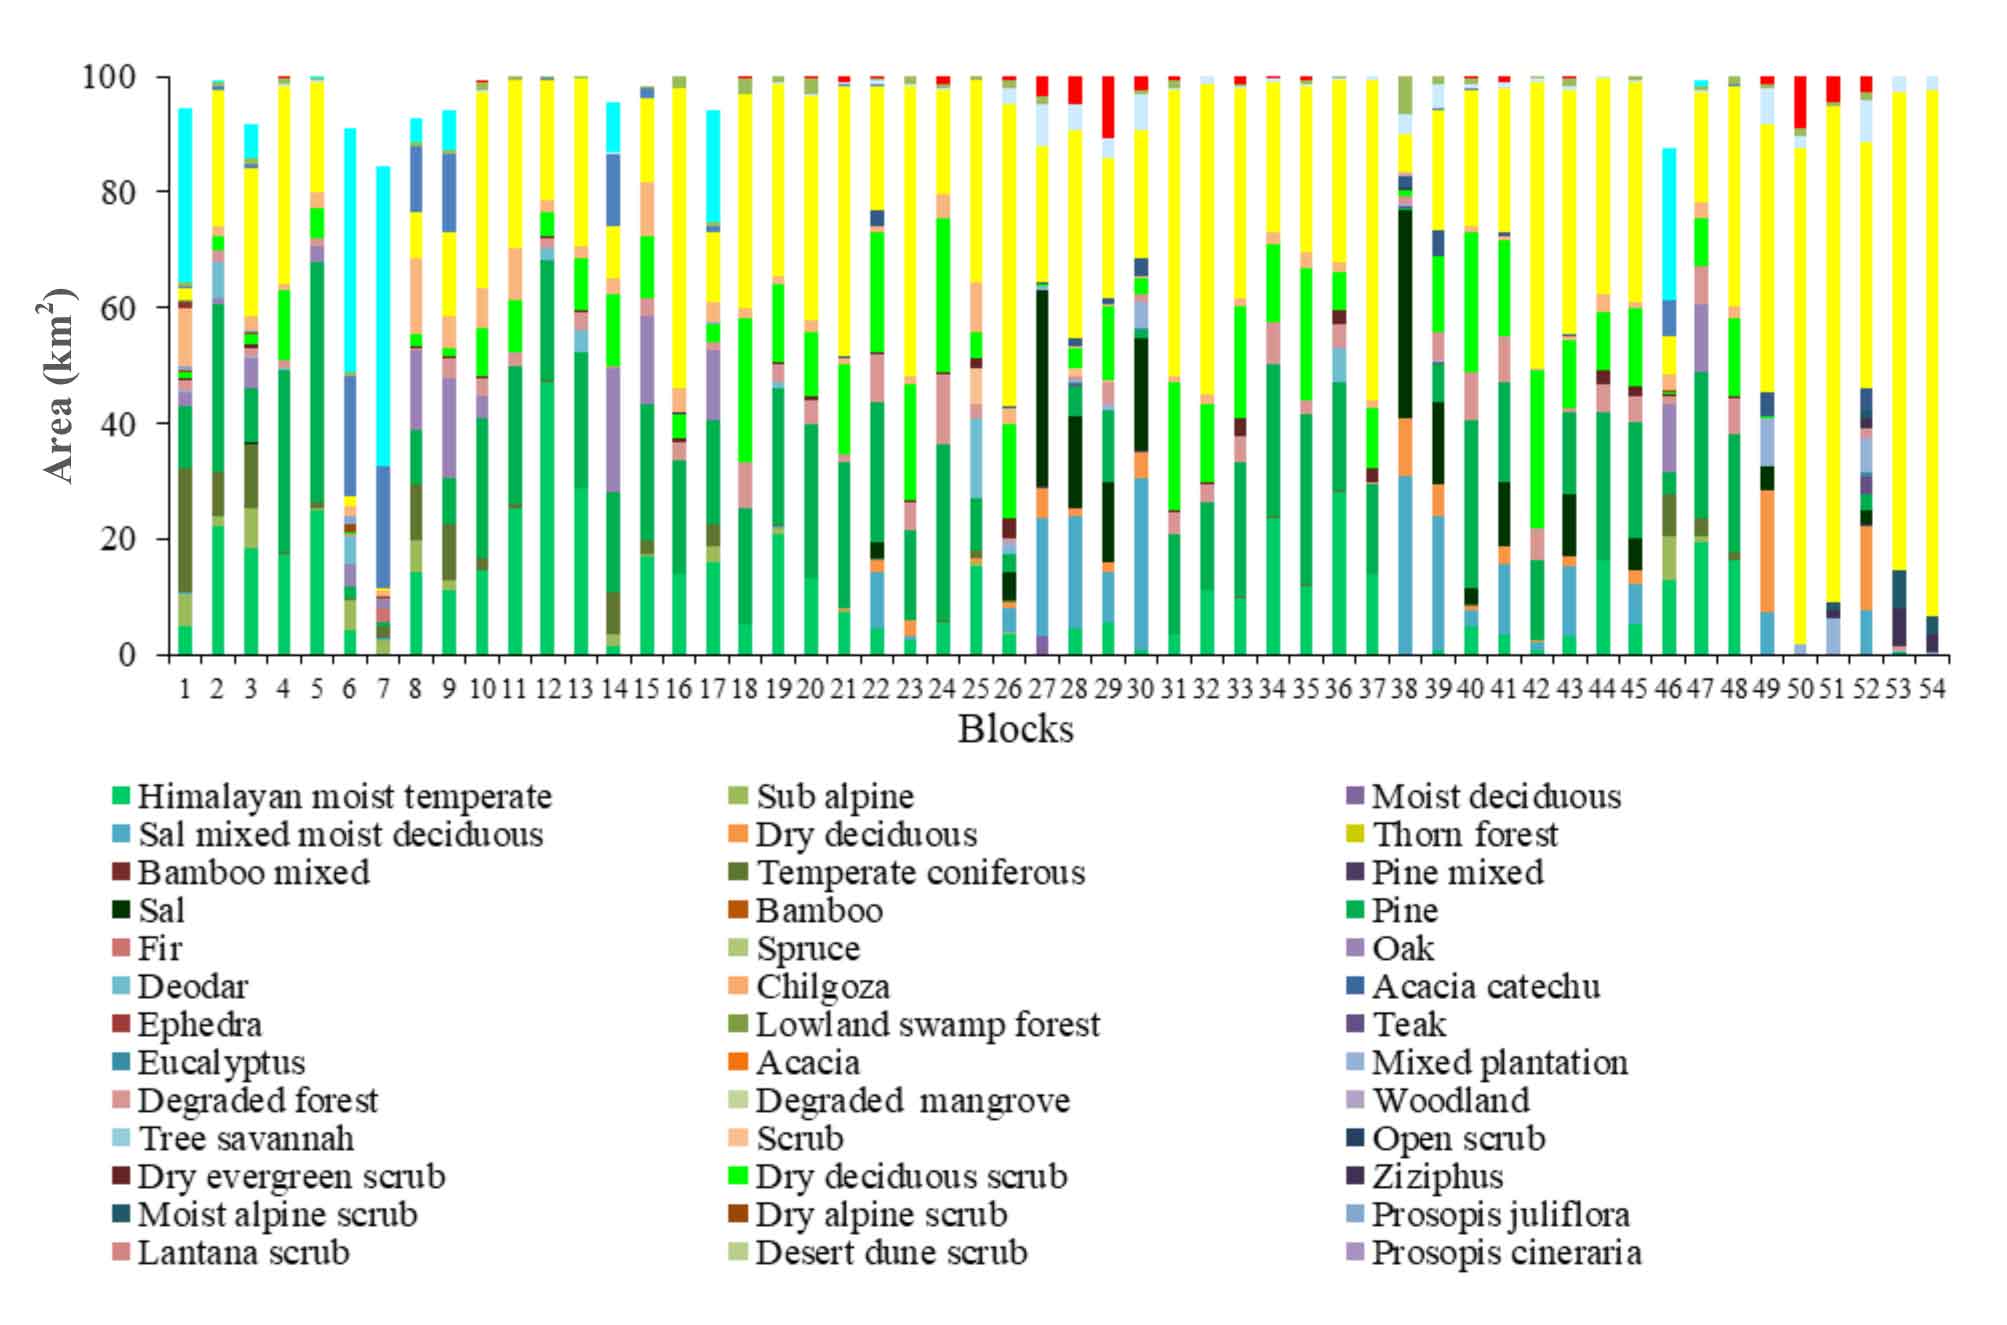
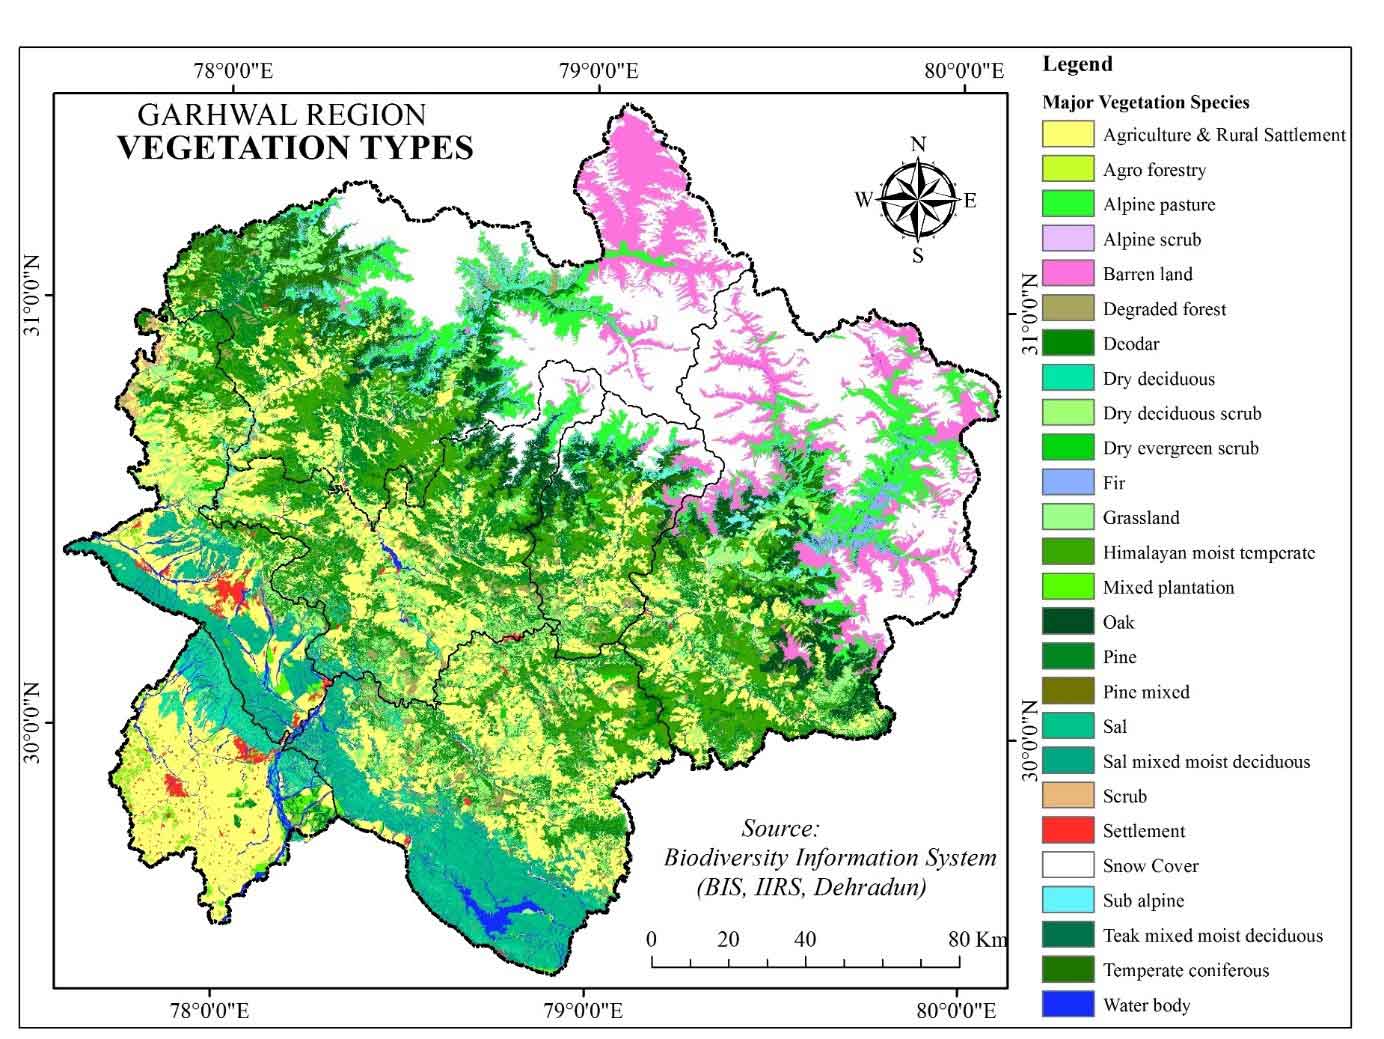
Table 4 presents the diverse forest types found across the Garhwal Himalayan region, classified according to altitudinal zones ranging from less than 300m to greater than 4000m. The region is broadly categorized into five major vegetation classes, with forests covering the most extensive area, approximately 19683.47km² (60.59%) of the total landscape. Apart from forest cover, agriculture and rural settlements collectively account for 6462.60 km² (19.89%), while snow-covered areas, water bodies, and major settlements occupy 5,513.90km² (16.97%), 622.15km² (1.92%) and 204.18km² (0.63%), respectively. A total of 59 distinct forest species have been identified in the region, which have been broadly reclassified into 22 major forest sub-classes. Am (Table 4). Long these, pine forests dominate, covering approximately 3,359.56 km² (10.34%). Other significant forest types include Himalayan moist temperate forests (2600.93 km², 8.01%), dry deciduous scrub (1757.32 km², 5.41%), alpine pastures (1666.24 km², 5.13%), sal mixed moist deciduous forests (1,225.23 km², 3.77%), sal forests (1074.82 km², 3.31%), grasslands (1,030.02 km², 3.17%), oak forests (1009.09 km², 3.11%), temperate coniferous forests (944.96 km², 2.91%), sub-alpine forests (682.69 km², 2.10%), degraded forests (660.54 km², 2.03%), dry deciduous forests (514.16 km², 1.58%), and deodar forests (379.89 km², 1.17%) (Figure 6). The distribution of forest types across different altitudinal zones, forming major forest groups, is discussed in detail in the subsequent sections (Table 4).
Table 4. Altitude-wise area under vegetation
|
Altitude (m)
Vegetation Zones
|
Area (%)
|
|
< 300
|
301-800
|
801-1600
|
1601-2400
|
2401-3200
|
3201-4000
|
> 4000
|
Total
|
|
Agriculture and Rural Settlement
|
20.11
|
11.36
|
43.01
|
23.87
|
1.56
|
0.08
|
0.01
|
19.89
|
|
Alpine pasture
|
0.00
|
0.00
|
0.76
|
4.45
|
11.32
|
43.76
|
39.72
|
5.13
|
|
Alpine scrub
|
0.00
|
0.00
|
0.00
|
0.00
|
7.98
|
65.65
|
26.38
|
0.25
|
|
Barren land
|
0.01
|
0.15
|
0.31
|
0.29
|
2.28
|
18.39
|
78.57
|
6.57
|
|
Degraded forest
|
2.09
|
10.25
|
39.71
|
34.33
|
11.25
|
2.32
|
0.06
|
2.03
|
|
Deodar
|
0.00
|
0.00
|
3.25
|
27.35
|
48.98
|
19.88
|
0.54
|
1.17
|
|
Dry deciduous
|
4.22
|
76.89
|
16.79
|
1.71
|
0.39
|
0.00
|
0.00
|
1.58
|
|
Dry deciduous scrub
|
0.15
|
9.04
|
65.57
|
23.10
|
1.94
|
0.20
|
0.00
|
5.41
|
|
Dry evergreen scrub
|
0.00
|
0.05
|
37.44
|
42.40
|
11.45
|
8.03
|
0.63
|
0.31
|
|
Fir
|
0.00
|
0.00
|
0.01
|
9.65
|
53.24
|
33.77
|
3.33
|
0.33
|
|
Grassland
|
0.73
|
12.67
|
22.95
|
46.89
|
15.80
|
0.96
|
0.00
|
3.17
|
|
Himalayan moist temperate
|
0.03
|
0.46
|
9.03
|
69.15
|
21.14
|
0.19
|
0.00
|
8.01
|
|
Mixed plantation
|
53.52
|
34.87
|
1.02
|
0.15
|
2.68
|
7.04
|
0.72
|
0.80
|
|
Oak
|
0.00
|
0.00
|
0.19
|
8.70
|
78.64
|
12.27
|
0.19
|
3.11
|
|
Pine
|
0.59
|
3.50
|
37.96
|
50.93
|
6.43
|
0.58
|
0.00
|
10.34
|
|
Pine mixed
|
0.00
|
78.38
|
21.62
|
0.00
|
0.00
|
0.00
|
0.00
|
0.01
|
|
Sal
|
0.10
|
81.15
|
17.41
|
0.45
|
0.17
|
0.69
|
0.03
|
3.31
|
|
Sal mixed moist deciduous
|
1.26
|
76.49
|
19.90
|
0.80
|
0.21
|
1.10
|
0.24
|
3.77
|
|
Scrub
|
0.00
|
8.16
|
63.49
|
25.48
|
2.72
|
0.14
|
0.01
|
0.19
|
|
Settlement
|
38.64
|
52.24
|
4.39
|
4.20
|
0.30
|
0.23
|
0.00
|
0.63
|
|
Snow Cover
|
0.00
|
0.00
|
0.00
|
0.02
|
0.42
|
4.83
|
94.72
|
16.97
|
|
Sub alpine
|
0.00
|
0.27
|
3.20
|
9.93
|
32.87
|
49.99
|
3.75
|
2.10
|
|
Teak mixed moist deciduous
|
41.07
|
58.25
|
0.13
|
0.03
|
0.18
|
0.29
|
0.05
|
0.09
|
|
Temperate coniferous
|
0.00
|
0.10
|
1.97
|
20.29
|
60.87
|
16.60
|
0.17
|
2.91
|
|
Water body
|
17.60
|
60.03
|
16.04
|
2.74
|
2.00
|
1.34
|
0.24
|
1.92
|
4.3.1Tropical natural vegetation (< 300 m)
In the lowest altitude zone (<300 m), the predominant land cover is mixed plantation, occupying 139.02km² (53.52%) of the total area. In contrast, barren land constitutes the smallest portion, covering only 0.26km² (0.01%) (Table 4). Apart from mixed plantations, the region is characterized by diverse forest types, including dry deciduous forests, teak mixed moist deciduous forests, degraded forests, dry deciduous scrub, grasslands, pine forests, sal mixed moist deciduous forests, sal forests, and Himalayan moist temperate forests (Figure 7). The lower piedmont areas the dominated by grasslands and the largely fragmented woody tree species and major occupied by the fertile Ganga-Yamuna Rivers plain, where intensive agriculture and urbanisation taking place, hence forests cover is declining rapidly, mostly in the Doon and Dwar region, especially in the vicinity of reserved forest areas (Joshi et al., 2011; Sati and Kumar, 2023).
4.3.2 Sub-tropical natural vegetation (301-800m)
Sal forests dominate this altitude zone, covering 872.20 km² (81.15%) of the total area, while temperate coniferous forests occupy only a minimal portion of 0.98 km² (Table 4). Additionally, several other forest types are present in this zone, including pine mixed forests, dry deciduous forests, sal mixed moist deciduous forests, teak mixed moist deciduous forests, mixed plantations, grasslands, degraded forests, dry deciduous scrub, scrublands, pine forests, Himalayan humid temperate forests, and subalpine forests (Figure 7). The major part of this zone is protected for wildlife corridors by Rajaji National park and Corbett National park, experiencing anthropogenic pressure threatening wildlife and forests. These protected areas are the source of various products extracted and utilizing for local people's livelihood (Negi et al., 1999; Joshi et al., 2011; Gupta et al., 2020).
4.3.3 Warm temperate natural vegetation (801-1600m)
In the warm temperate altitude zone (801-1600 m), dry deciduous scrub is the most dominant vegetation type, covering 1152.26 km² (65.57%) of the total area, while fir occupies the smallest extent at just 0.01 km² (0.01%) (Table 4). This zone also features a diverse range of forest types, including scrub, degraded forest, pine, dry evergreen scrub, grassland, pine mixed forests, sal mixed moist deciduous forests, sal forests, dry deciduous forests, Himalayan humid temperate forests, deodar forests, subalpine forests, temperate coniferous forests, mixed plantations, alpine pastures, barren land, oak forests, and teak mixed moist deciduous forests (Figure 7). Areas having moderate population density in the upper Shiwalik and lesser Himalayan region besides the agriculture, settlement, and grasslands, the major part is occupied by sal mixed deciduous woody forest species. The local people primarily use it for fuelwood, and their leaves were used for fodder and manure production (Singh et al., 2010; Negi et al., 2011; Dhanai et al., 2014).
Table 5. Block-wise Population distribution
|
Classes
|
Density
|
Blocks
|
No. of blocks
|
|
Very Low Dense
|
< 75
|
Joshimath, Bhatwari, Mori, Ukhimath, Yemkeshwar, Ghat, Tharali
|
7
|
|
Moderate Dense
|
76 - 150
|
Dasholi, Bhilangana, Kote, Chakrata, Rikhnikhal, Jahrikhal, Purola, Naugaon, Dwarikhal, Kalsi, Narayanbagar, Karanprayag, Dewal, Jaunpur, Dunda, Nainidanda, Thalisain, Pokhari, Pokhra
|
19
|
|
Highly Dense
|
151 - 300
|
Ekeshwar, Jakholi, Dogadda, Kajikhal, Dhauladhar, Devprayag, Pavo, Kirtinagar, Gairsain, Chinyali Saur, Agastyamuni, Jakhridhar, Narandranagar
|
13
|
|
Very High Dense
|
> 300
|
Chamba, Pauri, Bironkhal, Pratapnagar, Khirsu, Khanpur, Baharadabad, Bhagwanpur, Doiwala, Sahaspur,Vikasnagar, Nersen, Laksar, Rajpura, Roorkee
|
15
|
4.3.4 Cool temperate natural vegetation (1601-2400m)
In the cool temperate zone (1601-2400 m), the Himalayan moist temperate forest dominates the landscape, covering a vast 1798.53km² (69.15%) of the area. In contrast, the teak mixed moist deciduous forest is barely present, occupying just 0.01km² (0.03%) (Table 4). Given the region’s climate, a small portion-1.34km² (0.02%)-is covered by snow. Beyond these, the area is home to a diverse mix of forest types, including pine, grasslands, dry evergreen scrub, degraded forests, deodar, oak, fir, alpine pastures, and several others, each contributing to the rich ecological tapestry of the region (Figure 7). This zone signifies its rich biodiversity due to very dense moist temperate forests, especially Deodar tree cover; therefore, the extensive area is conserved in the form of national parks, wildlife sanctuaries, and conservation reserves, i.e., Nandadevi Biosphere reserve (Nandadevi National park, and Valley of Flowers); Kedarnath wildlife reserve, Govind National parks, and sanctuary and Gangotri National Park, etc. (Chaudhary et al., 2018). The people residing in the forest areas' proximity are primarily involved in the non-timber forest produces (NTFP), fuelwood, fodder, and collect various medicinal plant species for their livelihood, shown in Table 6. In the region, major NTFP collection from forest area is lichens, honey, dwarf bamboo (Drepanostachyum falcatum), resin (oleoresins), wild fruits, i.e., Kafal (Myrica esculenta), Indian gooseberry (Phyllanthus emblica), mushrooms (Agaricus bisporus), Rhododendron flowers, and Fiddlehead ferns (Matteuccia struthiopteris), other flowers medicinal plants, etc.
Table 6. Relative relief and population density
|
Block Name
|
Relative relief (RR)
|
SD of RR
|
Pop. density
|
Block name
|
Relative relief
|
SD of RR
|
Pop. density
|
|
(person/km2)
|
(person/km2)
|
|
Joshimath
|
1448
|
197.09
|
11
|
Jakholi
|
557
|
97.59
|
161
|
|
Bhatwari
|
1180
|
166.75
|
17
|
Dogadda
|
611
|
112.99
|
167
|
|
Mori
|
1322
|
121.9
|
24
|
Kajikhal
|
301
|
66.62
|
167
|
|
Ukhimath
|
897
|
141.37
|
49
|
Dhauladhar
|
458
|
72.28
|
170
|
|
Yemkeshwar
|
673
|
139.2
|
71
|
Devprayag
|
510
|
93.16
|
175
|
|
Ghat
|
793
|
129.21
|
71
|
Pavo
|
288
|
53.03
|
176
|
|
Tharali
|
510
|
97.55
|
75
|
Kirtinagar
|
569
|
95.95
|
179
|
|
Dasholi
|
648
|
117.88
|
81
|
Gairsain
|
555
|
116.49
|
187
|
|
Bhilangana
|
786
|
115.76
|
82
|
Chinyali Saur
|
440
|
85.76
|
201
|
|
Kote
|
369
|
77.37
|
84
|
Agastyamuni
|
384
|
64.55
|
226
|
|
Chakrata
|
564
|
82.53
|
84
|
Jakhridhar
|
709
|
104.7
|
229
|
|
Rikhnikhal
|
404
|
67.75
|
88
|
Narandranagar
|
602
|
100.44
|
237
|
|
Jahrikhal
|
452
|
103.36
|
88
|
Chamba
|
313
|
51.12
|
304
|
|
Purola
|
522
|
97.68
|
89
|
Pauri
|
392
|
78.65
|
308
|
|
Naugaon
|
640
|
113.57
|
93
|
Bironkhal
|
348
|
60.3
|
341
|
|
Dwarikhal
|
442
|
84.03
|
99
|
Pratapnagar
|
719
|
106.22
|
353
|
|
Kalsi
|
730
|
195.87
|
107
|
Khirsu
|
348
|
51.91
|
364
|
|
Narayanbagar
|
363
|
67.16
|
110
|
Khanpur
|
31
|
5.8
|
419
|
|
Karanprayag
|
411
|
75.34
|
116
|
Baharadabad
|
266
|
51.24
|
444
|
|
Dewal
|
775
|
139.24
|
117
|
Bhagwanpur
|
266
|
54.28
|
477
|
|
Jaunpur
|
329
|
60.43
|
122
|
Doiwala
|
635
|
96
|
605
|
|
Dunda
|
498
|
75.49
|
124
|
Sahaspur
|
689
|
157.08
|
617
|
|
Nainidanda
|
409
|
72.08
|
126
|
Vikasnagar
|
241
|
58.68
|
896
|
|
Thalisain
|
367
|
65.05
|
130
|
Nersen
|
81
|
10.76
|
1325
|
|
Pokhari
|
504
|
84.32
|
137
|
Laksar
|
30
|
5.92
|
2007
|
|
Pokhra
|
332
|
59.95
|
141
|
Rajpura
|
546
|
178.36
|
2197
|
|
Ekeshwar
|
337
|
65.4
|
150
|
Roorkee
|
42
|
7.13
|
2206
|
4.3.5 Cold temperate natural vegetation (2401-3200m)
In the 2401-3200 m altitude zone, oak forests dominate the landscape, covering 793.57 km² (78.64%) of the area. On the other hand, teak mixed moist deciduous forests are almost negligible, occupying just 0.06 km² (0.06%). Due to the colder climate, a small portion of the region-23.34 km² (0.42%)-remains under snow cover (Table 4). Apart from oak, this zone also supports a variety of other forest types, including temperate coniferous, fir, deodar, subalpine, Himalayan moist temperate, grasslands, dry evergreen scrub, alpine pastures, degraded forests, alpine scrub, pine, and several others, each playing a role in the region's diverse ecosystem (Figure 7). Moreover, the rich biodiversity is not limited up to the lower zones. The maximum portion of oak, deodar, and fir forests species are dominating this zone. Besides this, a large portion of this zone implies in grasslands. Alike the cool temperate zone, this zone also a hotspot for the NTFP and medicinal plant collection. In this region, various forest species areon the verge of extinction due to indiscriminate exploitation (Bisht et al., 2006; Nautiyal et al., 2005; Negi et al., 2011).
4.3.6 Sub-alpine natural vegetation (3201-4000m)
In the Sub-Alpine zone (3201-4000 m), alpine scrub forests dominate, covering 52.72 km² (65.65%) of the area, while scrub forests occupy the smallest portion, just 0.09 km² (0.14%). Due to the cold climatic conditions, a significant part of the region-266.27 km² (4.83%)-remains under snow cover (Table 4). In addition to alpine scrub, this zone also supports various other forest types, including subalpine forests, alpine pastures, fir, deodar, barren land, temperate coniferous forests, oak, dry evergreen scrub, mixed plantations, degraded forests, sal mixed moist deciduous, grasslands, sal, pine, teak mixed moist deciduous, dry deciduous scrub, and Himalayan moist temperate forests (Figure 7).There is a significant decline in the various characteristics of the forest diversity observed across this altitudinal stratum, indicating that the sub-alpine forest transition in west Himalaya exhibits diversity in compositional patterns. The variations in species diversity indicate a high degree of heterogeneity in the landscape and disturbance regimes (Bahukhandi et al., 2024). Regional distribution of species richness is often analyzed, which have implications for many interactive causes, such as geographical location, plant production, competition, regional species dynamics, evolutionary and historical development, environmental variables, regional species pool, and anthropogenic activities (Nandy et al., 2011; Singh, 2019).
4.3.7 Snow cover area (> 4000m)
This zone, reaching elevations of up to 4000 meters, is primarily known as the glacial cover zone due to its vast snow-covered expanse, which spans 5222.94 km² (94.72%). Apart from the glacier-dominated landscape, barren land represents the largest forested area, covering 1677.87 km² (78.57%), while scrub forests occupy the smallest portion, just 0.01 km² (0.01%) of the total area (Table 4). Other forest types found in this high-altitude zone include alpine pastures, alpine scrub, sub-alpine forests, fir, mixed plantations, dry evergreen scrub, deodar, sal mixed moist deciduous, oak, temperate coniferous forests, degraded forests, teak mixed moist deciduous, and sal (Figure 7).
In addition to NTFP collection, grazing-based livestock husbandry plays a vital role in the Himalayan region's high altitude inhabitants' economy (Negi et al., 2010; Singh, 2019). But the deterioration of grazing and pasture lands, these huge livestock resources are becoming a liability and endangering the very existence of our valuable forests (Rawat, 2010). Seasonal migration of livestock in search of fodder and livelihood is an ancient phenomenon in the Central Himalayas. Livestock activities and various products of this seasonal dwelling were an integral part of the Himalayan village life. They provided opportunities for additional income generation (Sharma et al., 2009b). Growing livestock population, reducing fodder production from agriculture, and evolving cropping patterns resulted in more intensive grazing in forests (Saxena et al., 2005). Temporary, seasonal settlements of grazers on the high hills alpine zone are locally known as Kharak (Sati, 2008). These Kharaks are the summer camps of local people and their grazing animals due to the lack of fodder and grazing around the lower regions' permanent settlement. The entire agricultural land is under Kharif crops, so that the local people migrated there for grazing cattle to upland pastures in temporary settlements. The families stay there almost the April to October, and the cattle are kept on free grazing. In addition to this, crops like potato, amaranth, and kidney bean are cultivated around the camps, and generally one crop is harvested throughout this period (Kumar et al., 2020; Shiva et al., 2005).
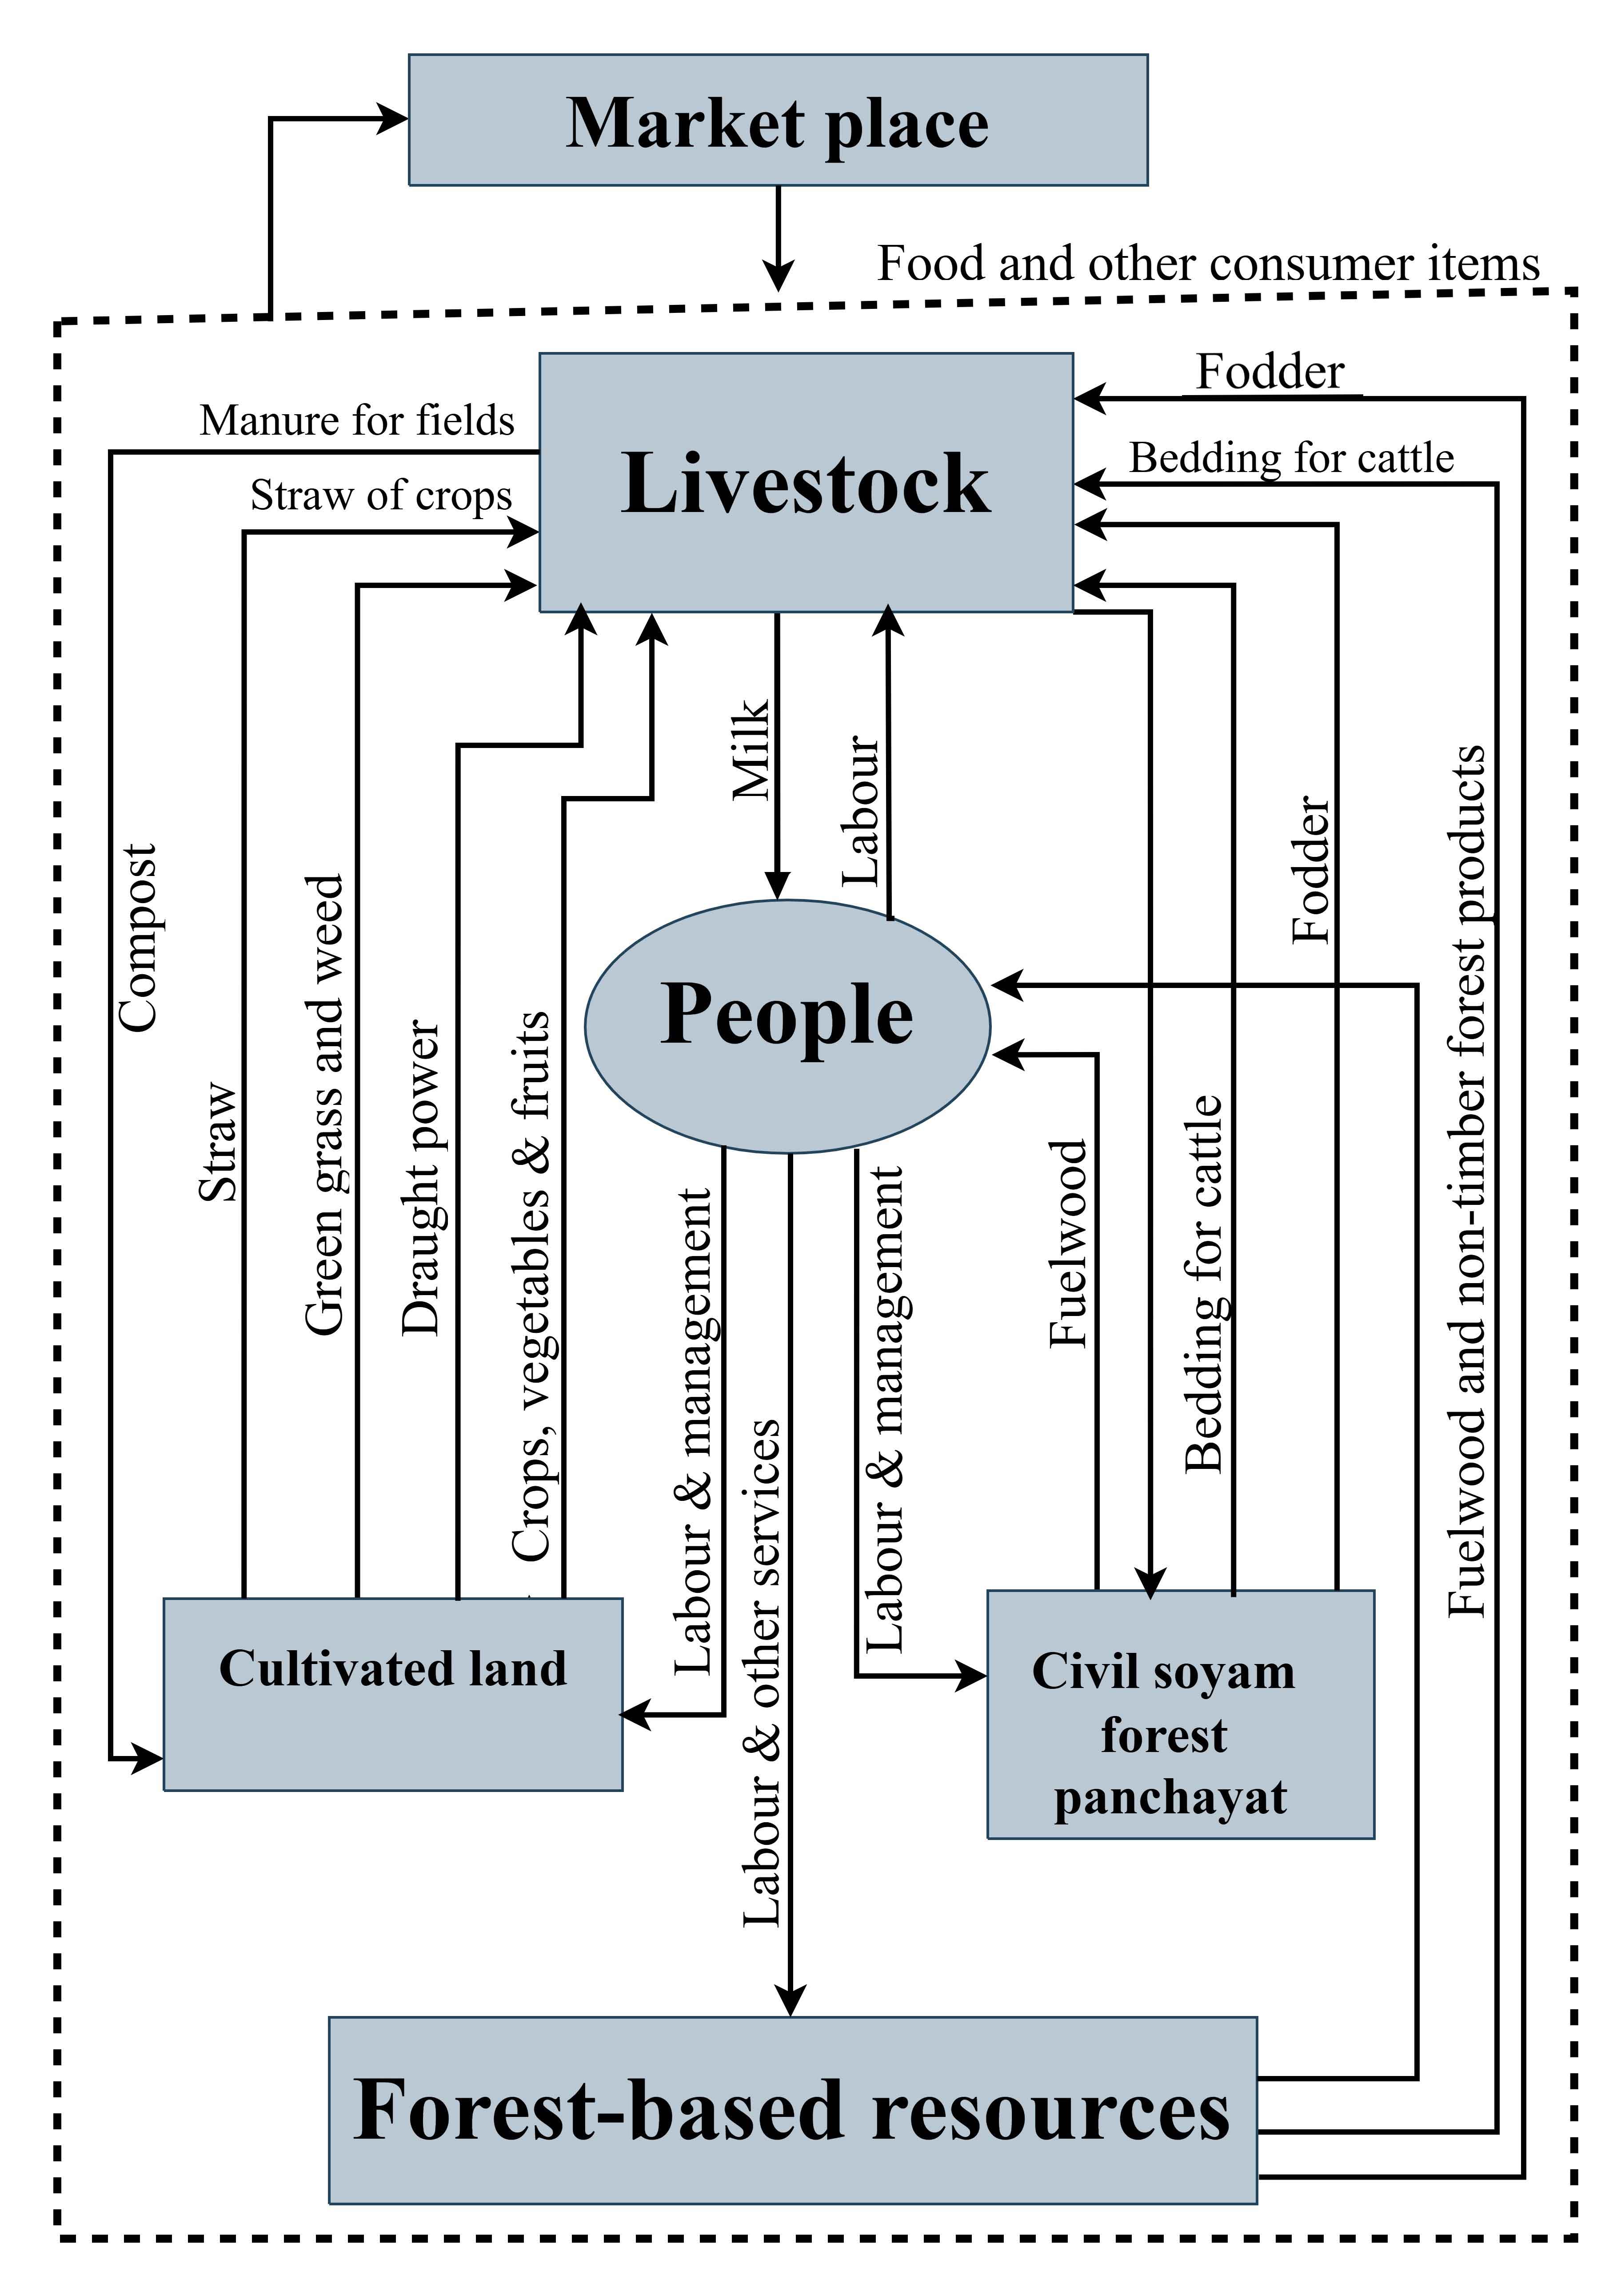
The people in the whole Himalayan region highly depend on forest-based ecosystem services. Figure 8 indicates that the farming communities follow the agro-forest-livestock based system for their livelihood. The larger part of the services that they received is associated with their livestock rearing and fuel wood (Table 8). The adjacent Civil Soyam forest areas are the prime source of most of the habitations in the rural areas in this region. It was also observed during the several visits in this region that Non-timber forest products (NTFPs) play a vital role among the rural population and provide an economical source and subsistence living. Fuel wood, flowers, fruits, nuts, medicinal plants, wild edible vegetables, house building materials etc., are an integral part of day-to-day livelihood activities, especially for people living in forest fringe. In areas above 2000m altitude, or villages with access to high altitude pastures, a very significant proportion of the population, roughly over 30% of households, depending on NTFPs gathering for a substantive part of their earnings (Semwal et al. 2007).
Lichens, Moss, Cinnamomum Tamala, Resin (Pinus roxburghii), Taxus, Behera (Terminalia bellirica), Harra (Terminalia chebula), Ritha (Sapindus mukorossi), Kafal (Myrica Esculenta), Burans Flower (Rhododendron arboretum), Ringal (Drepanostachyum Falcatum and Thamnocalamus Pathiflorus), Himalayan Morel Mushroom (Morchella Esculenta), etc. are the major forest product that contributes as an economical source of the rural economy in this region. The larger part of these sources is associated with sub-tropical and temperate areas where very little population is concentrated in valleys of the lesser and greater Himalayan region (Figure 5).
4.4 Population Distribution
According to the population census 2011, the block-wise population density was analyzed to interpreting population distribution in the Garhwal region (Table 6). Garhwal region occupies about 5857294 (58%) population in 32450km2 (60.7%) area with an average density of 181 persons per km2 (Table 1). It varies from the south (Ganges Great Plains) to the north (Greater Himalayan ranges). The population density is classified into four categories: very few dense to very high dense (Figure 3).
4.4.1 Areas with a low population density
A considerable area falls in this category, which is the part of the Greater Himalayas. Joshimath (11), Bhatwari (17), Mori (24), Ukhimath (49), Yemkeshwar (71), Ghat (71), and Tharali (75) blocks (Table 6), where population density is very low (< 75) these blocks mostly belong to Chamoli, Uttarakashi and Rudraprayag district (Figure 3). This very low density is the diverse condition of climate, topography and forest diversity (Figure 10).
4.4.2 Areas with a moderate population density
Blocks that have population density ranging from 75 to 150 person per km2 (Table 3), Dasholi (81), Bhilangana (82), Kote (84), Chakrata (84), Rikhnikhal (88), Jahrikhal (88), Purola (89), Naugaon (93), Dwarikhal(99), Kalsi(107), Narayanbagar (110), Karanprayag(116), Dewal (117), Jaunpur (122), Dunda (124), Nainidanda (126), Thalisain (130), Pokhari (137) and Pokhra (141) (Figure 3). All these 19 administrative blocks remain in the category that belongs to Chamoli Uttarakashi, Rudraprayag, Tehri Garhwal, Pauri Garhwal, and the northern areas of Dehradun. Due to highly dissected topographical conditions, these areas are less inhibited in this region (Figure 10).
4.4.3 Areas with a high population density
13 blocks fall under this category of population density, respectively Ekeshwar (150), Jakholi (161), Dogadda (167), Kajikhal (167), Dhauladhar (170), Devprayag (175), Pavo (176), Kirtinagar (179), Gairsain (187), Chinyali Saur (201), Agastyamuni (226), Jakhridhar (229) and Narandranagar (237) (Figure 3) that are distinguished with highly dense (151 - 300). In this zone, favourable geographical conditions for agriculture and other economic activities are found (Figure 10).
4.4.4 Area with a very high population density
In this group, almost all development blocks of Dehradun and Haridwar represents very high population density. As many as 15 blocks, viz. Chamba (304), Pauri (308), Bironkhal (341), Pratapnagar (353), Khirsu (364), Khanpur (419), Baharadabad (444), Bhagwanpur (477), Doiwala (605), Sahaspur (617), Vikasnagar (896), Nersen (1326), Laksar (2007), Rajpura (2198) and Roorkee (2206) (Figure 3). Besides Haridwar and Dehradun District, there are 2 blocks from Pauri and 2 from Tehri districts, where the population density is found very high because of urbanization development in these areas. In Haridwar and Dehradun, a high population concentration is because of plain surface and flat valleys (Figure 10). In these districts, agricultural and industrial activities play a significant role in urbanisation.
4.5 Association Between Relative Relief and Population Density
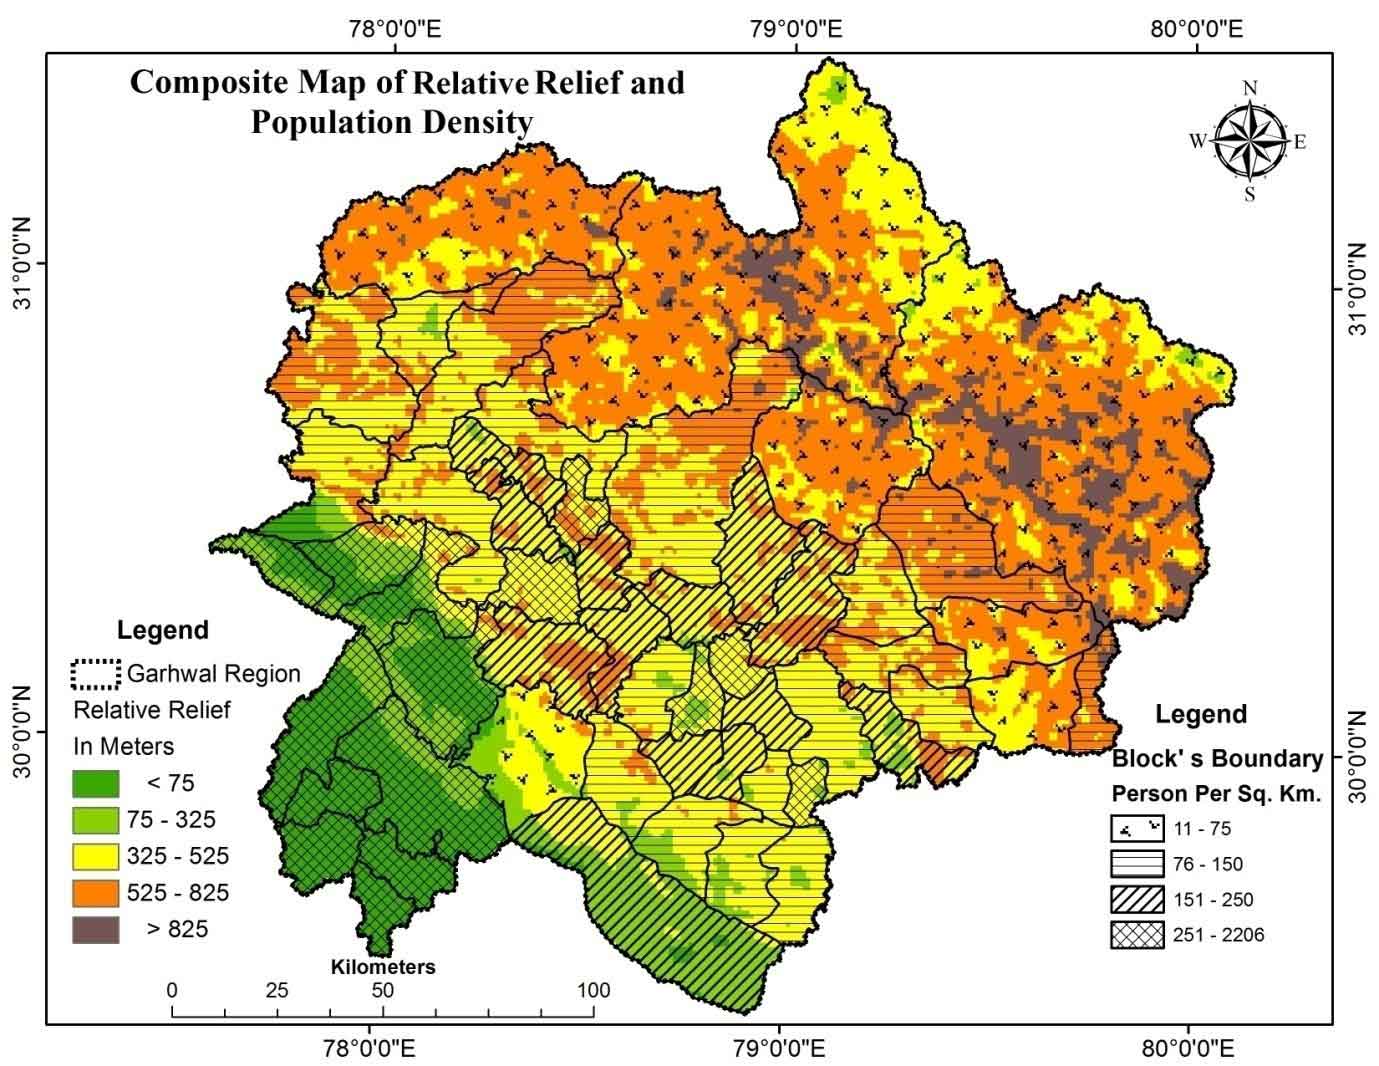
High to moderately dissected and rugged terrain in this stretch of the Himalayan part is very significant to explain the population's distribution with topographic relief of land surface variations. In this discussion, it is imperative to explain the topographic features of the terrain. Garhwal region has five uniform topographic zones from south to north plain surface, i.e., low relief surface, moderately high relief surface, high relief and steep slope surface, and very high relief surface in upper ridges. The block-wise population density indicates the blocks found in the northern upper parts of the region have very low population density up to 11 due to severe diverse conditions of climate and topographic features of the land surface (Figure 10).
The region has high relative relief ranging from 525-825m occupying about 28.91 %, with 15.13% of the population experiencing low population density (78-150m). These areas imply the region's central part representing the upper lesser Himalayan region, where mostly moist deciduous high dense forests exist in Figure 7. The areas have a 14.44% population with high density confining along the Alaknanda and Bhagirathi Rivers valleys (14.95% area), where substantial fertile land is cropping. The soils of this lower part of the lesser Himalayan region are affected mainly due to evolving cropping patterns and unavailability of irrigation sources-most of the farmers are involved in traditional farming with irrational practices that lead to less productivity. The southern parts are indicating relative relief < 325m showing Doon, Dwar, Bangur, and Khadar (alluvial plain) region that covers about 15% area of the region embracing more than half of the population of the region (65%) demonstrating enormous population pressure due to convenient, excellent accessibility, temperate climatic conditions and fertile cropping land (Table 7 and Figure 7). During the last decades, this region undergoing increasing population pressure due to haphazard urbanization, industrialization. The association of the land topography and population indicating huge population imbalances in this part of the Uttarakhand state that may be good or bad for the ecological environment without taking manageable measures in various aspects.
Table 7. Distribution of population
|
Classes
|
Area
|
Population
|
Population density (person/km2)
|
|
km2
|
%
|
Total
|
%
|
|
Very low dense
|
13370.50
|
41.15
|
333679
|
05.33
|
045
|
|
Moderate dense
|
9393.41
|
28.91
|
947797
|
15.13
|
106
|
|
Highly dense
|
4856.58
|
14.95
|
904160
|
14.44
|
187
|
|
Very high dense
|
4869.48
|
14.99
|
4077559
|
65.10
|
858
|
|
Total
|
32490
|
100
|
6263195
|
100
|
1196
|
Rural food and livelihoods are collected from forest-based subsistence agriculture (Tiwari, 2000; Sood, 2005). However, due to the climatic and land restrictions and insufficient agricultural production, significant food deficits and many male adults migrate from this region to seek employment and livelihoods. Marginalized farmers and landless households are mainly affected, primarily economically backward groups and severely low-income families. Thus, in this field, a community-based framework for forestry, land and water management, and the generation of sustainable off-farm opportunities are required to implement at local levels (Tiwari and Joshi, 2012). Regions where land consolidation is accomplished, organic farming, horticulture, and medicinal/aromatic plants are promising as viable sources of livelihood for the local population. Simultaneously, the provision of business linkages and marketing resources for potential agro-entrepreneurs is also critical. This lack of knowledge on future livelihoods impedes efforts to support livelihoods. Consequently, although it is necessary to establish and revise policies, it is equally vital to disseminate information and enforce current policies and schemes in both the agricultural and non-farming sectors (Naudiyal et al., 2019).
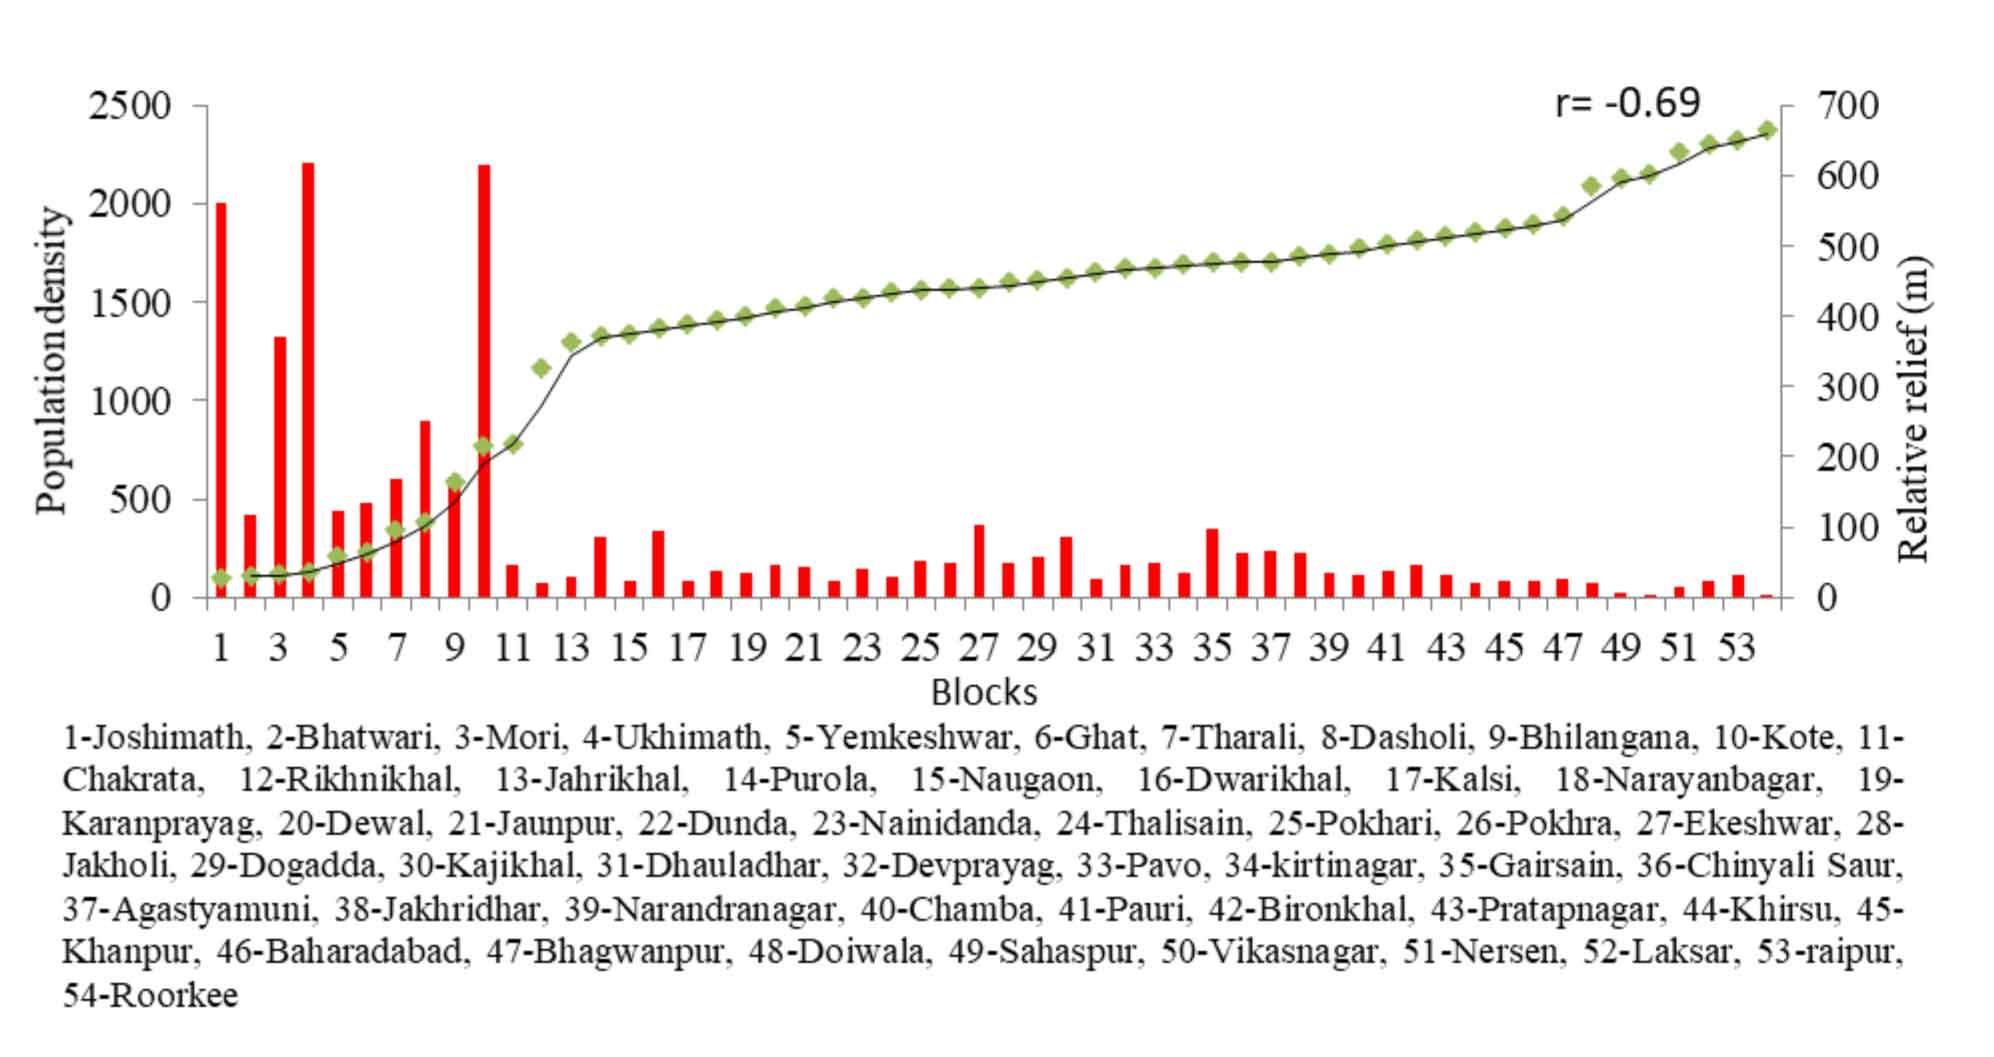
As we move towards Southern progression, we found that population density increases with decreasing topographic relief of the land surface (Figure 9). The maximum population reaches up to about 2200 persons/ km2. Where relative relief of the terrain is very low, representing flatted valleys and Ganges Great Plains in Haridwar and Dehradun districts of the region. In these areas, favorable conditions for habitation development like climate, topography, accessibility, resources, etc., exist. The negative correlation between population density and relative relief has found -0.69 (P<0.05), reflecting that the population is inversely distributed with relative relief of the surface in this region (Figure 9). The eloquent testimony of the highly unequal distribution of the population that about 65% of the region's population inhabited in 14% area of the region and contrast, only 5.33% of the population is dispersed in 41% of the total land of this region (Table 7). The studies carried out by Nand and Kumar (1989), Joshi and Gairola (2004), Pramanik (2016) witnessed the impact of altitude on land use and land cover. The most intense human activities were found to be in the lower valley areas between 900m and 2200m, demonstrating that human beings are residing at higher altitudes satisfying their food, fodder, and fuel requirements, which are the only places where forest cover exists.
Forest plays pivotal importance in sustaining the workforce in the Himalayan region. Forests not only maintaining the ecological system but also it is strengthening the geographical region socio-economically. In the upper areas of the region (>1800m), very few populations inhabited due to livelihood resources' availability. Local availability of feed resources for livestock, fuel wood, limited rearing facilities, marketing facilities, transportation and communication services, and so on are significant factors on which local livelihood resources depend in the region. It is also observed that almost all the families of rural areas use fuel wood for cooking food, lighting, water boiling, and space heating (Figure 8). It was also observed that fuel wood consumption varies with the lower region season but constant in the higher region because of climatic severity. Some common plant species were used as fuel and fodder for animals shown in Table 8. Villages preferred those species most suitable for fuel characteristics that produce less smoke and flame gradually. The durability of ember and high calorific value makes less smoke and has enough wood hardness. The people collect fuel wood and fodder from nearby Civil Soyam Panchayat forest (community forest), but sometimes people have to travel a long distance in the reserved forest. In a study, it was found that after introducing LPG in rural areas, the old energy consumption pattern has changed that not only reducing the pressure on women labor but also releasing the dependency of people on the forest to energy supply (Dhanai et al., 2015; Dhyani and Dhyani, 2020). This is strengthening ecological resources in terms of forest enhancement and empowering women in terms of health.
Table 8. Major plant species useful for fuel and fodder
|
Plant Species
|
Local Name
|
lower altitude
(<1500 m)
|
middle altitude
(1500-2500 m)
|
higher altitude
(>2500)
|
|
Abies pindrow
|
Raga
|
|
Y
|
Y
|
|
Alnus nepalensis
|
Usth
|
|
Y
|
Y |
|
Bauhinia variegate
|
Quiral
|
Y
|
|
|
|
Berberis aristata
|
Kilmore
|
|
Y
|
Y
|
|
Betula alnoides
|
Sor
|
|
Y
|
Y
|
|
Carpinus viminea
|
Chamkharikh
|
|
Y
|
Y
|
|
Cedrus deodara
|
Deodar
|
|
|
Y
|
|
Celtis australis
|
Kharik
|
Y
|
|
|
|
Daphniphyllum himalensis
|
Dambel
|
|
|
Y
|
|
Excoecaria acerifolai
|
Gangiva
|
|
|
Y
|
|
Ficus roxburghii
|
Timla
|
|
Y
|
|
|
Fraxinus micrantha
|
Anghu
|
|
Y
|
|
|
Fraxinus micrantha
|
Barara
|
|
Y
|
Y
|
|
Grewia optiva
|
Bhimal
|
Y
|
|
|
|
Lyonia ovalifolia
|
Ayar
|
Y
|
|
|
|
Lyonia ovalifolia
|
Ayar
|
|
Y
|
Y
|
|
Myrica esculenta
|
Kafal
|
|
Y
|
Y
|
|
Pinus roxburghii
|
Chir
|
Y
|
Y
|
|
|
Prunus ceresiodes
|
Padam
|
Y
|
Y
|
Y
|
|
Pyrus pashia buch.
|
Melu
|
Y
|
Y
|
Y
|
|
Q. glauca
|
Faliyat
|
|
Y
|
Y
|
|
Quercus floribunda
|
Moru
|
|
Y
|
Y
|
|
Quercus leucotrichophora
|
Banj (Tilanj)
|
Y
|
Y
|
Y
|
|
Quercus semecarpifolia
|
Kharsu
|
|
|
Y
|
|
Rhododendron arboretum
|
Burans
|
|
Y
|
Y
|
|
Rubus napalensis
|
|
|
Y
|
Y
|
|
Symplocos paniculata (Thunb.) Miq.
|
Lodh
|
|
Y
|
Y
|
|
Toona ciliate
|
Tun
|
Y
|
|
|
The populations and communities primarily depend on forest resources for livelihoods and basic requirements such as fuel wood, livestock fodder, and other non-timber forest products (NTFTs) and timber (Malik et al., 2014b). This fuel wood can be readily available without paying any economic cost. Therefore, people prefer to use firewood to supply their energy requirements in the entire Himalayan region (Figure 8).
A clear picture of the nexus between forest and livelihood of the local people is depicted in Figure 8, how livelihood activities of hilly people are intertwined with forests resources. The consumption of fuel wood is influenced by climatic and seasonal effects (Bhatt and Sachan, 2004). There are differences in fuel wood consumption at various altitudes in the hilly regions (Khuman et al., 2015). Multiple studies have been carried out to assess the level and pattern of consumption of fuel wood energy from forests in the Himalayan region. NTFPs play an important role among the rural villagers, which contribute to subsistence living and income. The day-to-day livelihood activities for the area's population, particularly in forest-neighboring regions, include fuel wood, flowers of food, berries, nuts and medicinal plants, edible vegetables, household building materials, etc.
In areas above 2000m altitude, or villages with access to high altitude pastures, a very significant proportion of the population, roughly over 30%, depends on NTFPs gathering for a substantive part of their earnings (Semwal et al., 2007). Jhoola (Lichens), Moss, Tajpata, Resin (Pinus roxburghii), Taxus, Bahera, Harra, Ritha, Kafal, Burans, Ringal, Guchii, and MAPs have emerged as the significant NTFPs collected in the region for medicinal and other industrial use. Alongside this, dried culinary herbs, herb tea, and local niche agro-products also provide alternate livelihood options for the communities of the region. The targeted herb species are (Salvia Rosmarinus) Rosemary, (Petroselinum Crispum), Parsley, (Thymus Serpyllum), Thyme, (Origanum Vulgare), Oregano, (Mentha arvensis), Mint, (Mentha balsamea), Peppermint, (Salvia Officinalis) Sage, (Origanum Majorana) Marjoram, (Ocimum Basilicum) Basil, (Melissa Officinalis) Lemon Balm, (Carum Carvi) Caraway, etc.
In the Himalayas, forest ecosystems and their surrounding communities are among the most ecologically and economically threatened (Singh and Singh, 2020). Thus, the residents of hilly regions remained marginalized in the context of the more extensive development process. Communities in forest ecosystems are dependent on natural resources and biodiversity for food security and livelihoods through fuel wood, fodder, and non-timber forest products (NTFPs) collection. Nowadays, medicinal and aromatic plants (MAPs) and herbs have gained global recognition as raw material sources for pharmaceuticals and traditional health care (Maikhuri et al., 1998; Kandari et al., 2012). The demand for herbal products is huge and increasing daily across the world (Singh 2005). The need for Ayurvedic medicines is expected to rise by 20% in India every year (Tewari et al., 2020).
After careful analysis based on facts mentioned above of the population density incorporated with topographic factors of the Garhwal Himalayan region, particular consideration is to be born in the mind that the fewer population utilizes considerable area resources the upper parts of the population region. Keeping some in view of the mountainous peculiarities, the reasons for this uneven distribution of people are diverse climate conditions, inaccessibility, natural disasters, and lack of necessary human resource development facilities. A long run of time population stretched outside from the remote rural areas towards main developing resource places. Outmigration, particularly within the region, has given new dimensions in the distribution of the population. Interregional and rural-urban migration has also created imbalances in this regard (Mamgain and Reddy, 2017; Joshi, 2018). The following conclusion may be drawn in support of this uneven distribution and density of the Garhwal Himalayan region population. The cumulative and direct influence of ruggedness of terrain, diverse climate, soils, vegetation, and forests can distribute habitation in this region. The study found that there is a close relationship between cultivable land and rural population. Rivers valleys are in this mountainous region boast fertile land where maximum population concentrated, but the distribution is uneven. The lack of necessary facilities such as transport, education, communication, employment, and opportunities in other economic activities resulted in immediate outmigration from this region's interior areas (Mamgain and Reddy, 2017). The availability of drinking water sources is the most deciding factor for the habitation of population in mountains (Thapa et al., 2023). Due to natural disasters, most of the sites are restricted to population distribution. Therefore, physical factors, such as altitude, slope, aspect, and drainage density, play a significant role.
Improving the livestock sector through effective local planning with local people intervention would improve the village economy's socioeconomic status. Local availability of feed resources, livestock genetic resources, animal health services, marketing facilities, transportation and communication services, and so on are significant factors on which regional livestock development planning can be based (Rawal, 2020). Analysing the multi-dimensional role of livestock in mountain farming systems, it became essential to review current planning and policymaking, finding an alternative planning strategy for livestock sector development in mountain areas. The livestock sector is often neglected in institutional planning and policies as well. However, it needs well-planned institutional intervention for socioeconomic development in mountain areas. Furthermore, as implemented in the plains areas, conventional planning is less responsive to mountain specificities. Such planning leads to waste of money and resources, seeks no participation from local people, and ignores local realities (Sati, 2016).


 ,
Atul kumar 2
,
Atul kumar 2