9 (2025), 1, 34-55

Journal of Geographical Studies

2582-1083

Exploring Spatial Heterogeneity and Wealth-Driven Neighborhood Patterns in Health Insurance Coverage Among Scheduled Tribes in India

SURANJAN MAJUMDER 1

1.University of North Bengal

Mr.SURANJAN MAJUMDER*

*.University of North Bengal

Professor.Masood Ahsan Siddiqui 1

1.Department of Geography, Jamia Millia Islamia – A Central University, New Delhi-110025 (India).

22-09-2025
16-06-2025
28-09-2025
29-09-2025

Graphical Abstract

Highlights

  1. The study offers spatially explicit dynamics examining district-level heterogeneity of health insurance coverage among Scheduled Tribe households in India using NFHS-5 data.
  2. A Gini coefficient indicates a moderate level of nationwide inequality in coverage among ST households, showing that the distribution is far from equitable.
  3. Findings reveals significant north-south and east-west divides in health insurance coverage. Southern and western districts, including Kerala, Tamil Nadu, Andhra Pradesh, and parts of Gujarat, have significantly higher coverage, while northern and eastern states like Uttar Pradesh, Bihar, Jharkhand,
  4. Identified “double burden geographies” where poor and BPL tribal households face both economic vulnerability and exclusion from insurance, with wealth positively linked to coverage in southern and central regions and strong negative correlations in poorer districts.
  5. Revealed high–high coverage clusters in southern India, showing regional policy diffusion and positive spill overs.
  6. Highlighted mismatches where wealth does not always translate into insurance. This persistent failure to address their unique cultural and environmental contexts has left healthcare as a

Abstract

This study spatially analyzes localized geography of health insurance coverage among Scheduled Tribe (ST) households in India, revealing persistent regional disparities using nationally representative data from NFHS-5 and advanced spatial analytical techniques. Employing Exploratory Spatial Data Analysis (ESDA), Geographically Weighted (GW) correlation and Empirical Bayes Smoothing (EBS), the research identifies significant north-south and east-west rifts in economic status and insurance access. The findings reveal marked regional disparities, with significantly higher insurance coverage in southern and western districts, particularly in Kerala, Tamil Nadu, Andhra Pradesh, and parts of Gujarat compared to persistently low coverage in northern and eastern states such as Uttar Pradesh, Bihar, Jharkhand, and West Bengal. A Lorenz curve (Gini coefficient: 0.36) indicates moderate nationwide inequality in insurance coverage among ST households. Southern and western districts, notably in Kerala, Tamil Nadu, and Gujarat, exhibit stronger insurance penetration than northern and northeastern regions. While some ST populations in poorer northern areas benefit from targeted schemes, vast stretches of central and northeastern India remain underserved due to low economic development and weak healthcare infrastructure. Local Moran’s I analyses highlight High-High clusters in southern India and Low-Low clusters in the north-central belt, underscoring entrenched spatial disadvantage. The clustering effect suggests that health policy interventions in these regions have likely benefited from regional policy diffusion, where best practices and institutional capacities spill over into neighboring districts, creating reinforcing zones of success. Bivariate and GW correlation visualizations display a strong positive association between wealth status and insurance coverage, especially in southern and central regions. Conversely, regions with high proportions of BPL and poor ST households demonstrate strong negative correlations, indicating a double burden geography of economic vulnerability and exclusion from insurance schemes. Importantly, the findings emphasize the localized need for inclusive policy interventions to ensure universal access of insurance coverage for ST households, especially in identified vulnerable regions.

Keywords

NFHS-5 , Marginalization , Insurance penetration , Indigenous health disparities , Geographical inequality , Spatial Analysis.

1 . INTRODUCTION

Health insurance coverage plays a critical role in determining access to healthcare services, yet disparities in coverage continue to affect marginalized populations globally (Nerenz et al., 2006; De Looper and Lafortune, 2009). The global pursuit of Universal Health Coverage (UHC), a cornerstone of Sustainable Development Goal (SDG) 3.8, has encountered significant impediments, particularly since 2015. Despite an increase in the UHC service coverage index from 45 in 2000 to 68 in 2021, the pace of progress has dramatically slowed, with only a three-point rise since 2015 and a stagnation at this level since 2019 (WHO, 2025). This decelerated advancement indicates a widespread failure to expand essential health service access, leaving approximately 4.5 billion people without full coverage in 2021. A critical and alarming global challenge is the continuous escalation of catastrophic out-of-pocket (OOP) health spending. By 2019, this burden affected over 1 billion people, pushing 344 million individuals deeper into extreme poverty due to health costs (WHO, 2025). This distressing pattern, characterized by stagnating service coverage alongside continuously increasing catastrophic OOP expenditures, is consistently observed across all regions, country income groups, and the majority of nations, underscoring persistent systemic inequalities in access and financial protection within global health systems. The COVID-19 pandemic further exacerbated these vulnerabilities, severely disrupting essential health services in 92 percent of countries at its peak in 2021, with 84 percent still reporting disruptions in 2022. This global health crisis also led to a significant decline in routine immunization coverage, with 25 million children under five missing out in 2021, and highlighted glaring disparities in vaccine access, particularly between high-income and low-income countries, thereby widening the existing health equity gap (WHO, 2025).

Within this challenging global landscape, India faces its own profound complexities in achieving UHC, particularly given that health is primarily a state subject, leading to varied policy implementation and outcomes across its diverse regions (Balarajan et al., 2011; Rao, 2011; Maity, 2017). In India, despite major public health initiatives and increasing investments in the health sector, access to health insurance remains uneven, particularly among lower-income groups, rural populations and socially disadvantaged communities such as Dalits and Adivasis (Mudgal et al., 2005; Baru et al., 2010; Devadasan et al., 2016; Karan et al., 2017). Despite the aspirational commitment in India's 12th Five-Year Plan to expand healthcare reach and coverage towards universal access, public spending on health remains critically low, constituting less than 1 percent of the Gross Domestic Product (GDP) (Planning Commission, 2013; Barik and Thorat, 2015; Player, 2025). According to NFHS-5 (2019-21), only 36 percent of households in the lowest wealth quintile reported any form of health insurance coverage, underscoring a stark inequity.

India is home to a substantial tribal population, numbering over 104 million, who constitute 8.6 percent of the country’s total population and are officially categorized as Scheduled Tribes (STs) for the purpose of affirmative action (Mavalankar, 2016; Kumar et al., 2020; Sharma, 2025). A defining characteristic of ST populations is their predominant residence in hilly, rural, and remote areas, often in close proximity to forests and in terrains that are difficult to access (Sharma, 2025). These indigenous communities, primarily residing in remote and ecologically fragile regions, have historically endured systemic exclusion, developmental neglect and weak healthcare infrastructure. Although schemes like Ayushman Bharat-PMJAY and RSBY aim to enhance coverage for vulnerable populations, the reach among STs remain limited due to geographic isolation, lack of awareness, digital exclusion, and persistent socioeconomic disadvantages (Haddad et al., 2012; Kumar et al., 2022). Their lives are frequently characterized by a ‘lack of material circumstances and lack of access to public utilities and services’, perpetuating a cycle of deprivation (Dror et al., 2018; Majumder et al., 2022). Crucially, the distinct terrain, environment, social systems, and cultural practices of tribal communities mean they possess unique healthcare needs that have been historically overlooked. Healthcare provisions for tribal people were often ‘subsumed in rural healthcare settings’, based on the flawed assumption that their health problems and needs were identical to those of the general rural population (Cowling et al., 2014; Kumar et al., 2020). This persistent failure to address their specific cultural and environmental contexts has left health and healthcare in tribal areas as deeply unsolved problems. The coverage of health insurance among Indians generally remains very low, with social insurance schemes contributing a meager 1.13 percent of total health expenditure (Barik and Thorat, 2015). Overall, health insurance reaches only 13-15 percent of the Indian population through various schemes (Kumar et al., 2020). For rural communities, which disproportionately include tribal populations, nearly 90 percent are not covered by any form of insurance, leaving them to bear the majority of healthcare costs out-of-pocket or to resort to loans (Player, 2025; Barik and Thorat, 2015).

Crucially, ST communities and other marginalized groups face what is often referred to as a ‘quadruple burden of disease’ an urgent and multi-layered public health crisis. This includes the coexistence of communicable diseases (e.g., malaria, tuberculosis), non-communicable diseases (e.g., diabetes, hypertension), malnutrition (both undernutrition and micronutrient deficiencies), and mental health disorders (often undiagnosed and untreated due to stigma and poor access) (Kumar et al., 2020). Despite national progress in infectious disease control, tribals constituting just 8.6 percent of the population account for 30 percent of all malaria cases, over 60 percent of Plasmodium falciparum infections, and nearly 50 percent of malaria-related deaths (Kumar et al., 2020). The tuberculosis rate among STs is alarmingly high at 703 per 100,000, compared to 256 in non-tribals, and leprosy continues to affect this group disproportionately, with 18.5 percent of new cases (Kumar et al., 2020). Alongside this, tribal populations are increasingly burdened by non-communicable diseases such as diabetes, hypertension, and cancer conditions driven in part by behavioral risks, including tobacco use (over 72 percent of men aged 15-54) and alcohol consumption (over 50 percent of men), far surpassing national averages. Malnutrition remains acute, with around 42 percent of tribal children underweight and 77 percent of under-five children anemic. Adolescent tribal girls are especially at risk, with nearly half having a BMI below 18.5, while 65 percent of tribal women suffer from anaemia, compared to 47 percent among non-tribal women. These conditions are compounded by high rates of low birth weight, perpetuating intergenerational cycles of ill health (Majumder et al., 2022). Mental health and addiction represent the often-overlooked fourth pillar of this disease burden, exacerbated by inadequate access to culturally sensitive mental health services and low levels of health-seeking behavior. These four dimensions of disease do not operate in isolation but intersect and reinforce each other, worsening health outcomes and complicating treatment pathways. The synergistic impact of this burden, especially in the absence of adequate health coverage, places an immense and chronic strain on tribal households, who must navigate care systems with very limited resources. This quadruple disease burden also has significant policy implications. Managing multiple and often chronic conditions without adequate insurance coverage means prolonged treatment, repeated visits, and costly medications, pushing already vulnerable households deeper into economic distress and destroying their futures (Kumar et al., 2020; Majumder, 2025). It calls for a paradigm shift from fragmented, disease-specific approaches to integrated, equity-oriented public health systems. Insurance policies and health financing mechanisms must be redesigned to account for the complex health needs of tribal populations, going beyond hospitalization coverage to include preventive, nutritional and mental health services, which are often ignored in traditional schemes (Kumar et al., 2020; Acharya, 2022; WHO, 2025).

In this context, the intersection of socioeconomic status and health insurance access becomes particularly consequential. Wealthier individuals are far more likely to have comprehensive insurance coverage either privately or through employment, while poorer individuals, especially from ST communities, often remain uninsured or underinsured (Ndugga et al., 2020). The wealth-health insurance gap compounds the vulnerability of tribal populations, who already face multiple health risks. Even when enrolled in public schemes, many ST households are unable to afford out-of-pocket costs for medicines, diagnostics, and travel to distant health facilities (Karan et al., 2017; Acharya, 2022).

Ultimately, the cycle of poverty, illness, and insufficient coverage reinforces marginalization and leads to catastrophic health expenditures for tribal families (Majumder and Chowdhury, 2023). To address this persistent inequality, it is essential to understand the structural linkages between economic deprivation, social identity, and healthcare exclusion. Therefore, the article seeks to unravel the complex geographies of health insurance coverage among ST households in India by examining how spatial inequality, economic stratification, and policy outreach intersect to shape patterns of inclusion and exclusion. Drawing upon nationally representative data from NFHS-5, this study employs a multidimensional spatial analytical framework to map district-level disparities and identify regional clusters of vulnerability. The article ultimately contributes to both academic understanding and policy debates by offering spatially nuanced insights into how wealth dynamics condition access to healthcare entitlements among tribal populations, thereby informing more geographically and socially inclusive approaches to health financing in India.

2 . MATERIALS AND METHODS

2.1 Methods

The methodological framework of this study is grounded in a robust integration of nationally representative data and advanced spatial analytical techniques to examine the intersection of wealth distribution and health insurance coverage among Scheduled Tribe households in India (Figure 1). To capture the spatial dimension of inequality, a suite of geospatial statistical tools is employed. Inequality is first quantified using the Lorenz Curve and Gini Coefficient to assess disparities in insurance coverage across social and economic strata. Next, Exploratory Spatial Data Analysis (ESDA) techniques such as Moran’s I and Local Indicators of Spatial Association (LISA) are used to detect spatial autocorrelation and identify clustering patterns. To enhance reliability in regions with small populations or low counts, Empirical Bayes Smoothing (EBS) is applied, adjusting raw rates to more accurately reflect underlying spatial structures.

2.2 Database

India is characterized by significant regional diversity. Therefore, the study used the secondary data regarding insurance coverage, wealth group distribution, and BPL household information from a nationally representative database from NFHS-5 (2019-2021). The NFHS-5 is a national survey conducted across India that collects baseline information on demographic, wellness, health, and nutrition parameters for different age and functional groups for both state and district levels and involves around 600,000 households. It is conducted by the Ministry of Health and Family Welfare, Government of India, with the International Institute for Population Sciences (IIPS) serving as the nodal agency. More information about the sampling procedure of the NFHS survey regarding the Demographic and Health Surveys (DHS) program under USAID can be found in https://dhsprogram.com/data/dataset/India_Standard-DHS_2015.cfm?flag=1.

2.3 Variable Descriptions and Processing

The present investigation utilized the conceptual frameworks to examine the district-level insurance coverage among households belonging to the ST as the consequence of household economic marginalization, or economic wellness. Furthermore, this study focuses on four key factors that influence household wealth and economic crisis among ST households, using extensive district-level data. These factors include rich households, households with middle wealth levels, poor households, and households below the poverty level. The study aims to identify the geographical locations where there may be potential barriers to insurance coverage and the influence of household economic wellness on one of the most historically marginalized social groups in India.


Figure 1. Methodology


Figure 2. The wealth quintile based breakdown of Schedule Tribes population in India. This distribution indicates that the majority of the ST population falls within the lower wealth quintiles, with 39.23 percent in the poorest category and 23.51 percent in the poorer category, showing significant poverty concentration. This combined classification shows a nearly one-third of the ST population is considered poor, while only 20.60 percent is classified as rich. This highlights a stark wealth disparity within the ST population, with the majority in lower wealth categories and a much smaller percentage reaching higher wealth levels.


Household wealth, as measured by indices like the wealth index, is a multidimensional concept encompassing household assets, material possessions, landholding and living conditions (Figure 2). According to Rutstein and Johnson (2004) in DHS Comparative Reports No. 6 suggest that household wealth signifies an impression of stability that transcends both income and consumption and must be quantifiable based on selected household indicators, types of flooring, water supply, sanitation facilities, different assets namely TV, radio etc. The allocation of health services to impoverished populations can be more effectively ascertained using a wealth index in comparison to an income or expenditure index. This is attributable to the reduced volatility associated with wealth as opposed to the fluctuations observed in income and expenditures (Rutstein, 2015; Rutstein and Johnson, 2004).

As per DHS guidelines all interviewed households categorized into five quintiles of wealth. The wealth index is a composite measure of a household’s cumulative living standard. The wealth index is calculated using easy-to-use data on a household’s ownership of selected assets, such as televisions and bicycles; materials used for housing construction; and types of water access and sanitation facilities (Rutstein and Johnson, 2004). The indicator variables are standardized by the calculation of z-scores. Following this, the scores of factor coefficients, which are also referred to as factor loadings, are calculated. Finally, the indicator values for each household are multiplied by the corresponding loadings and subsequently aggregated, yielding the index value for that particular household. When performing tabulation studies that involve the DHS wealth index, quintiles are utilized as the fundamental cut points for categorization (Rutstein and Johnson, 2004). Based on quintiles cut off relative wealth of the household, divided into quintiles from the poorest (Q1) to the richest (Q5). For more details on the computation and interpretation of the wealth index, please refer to the relevant sources https://www.dhsprogram.com/pubs/pdf/CR6/CR6.pdf.

For the present study, we combined the wealth index to produce three different variables, namely proportion of poor (combined the poorest, and poorer group), rich (combined the richer and richest group), and the middle wealth population group. Further, we selected another influencing variable, i.e. proportion of population belong to below poverty line. Individuals or households falling below a specific income threshold determined by the Government of India and receiving substantial social assistance through the public distribution system are categorised as living below the poverty line (Drèze and Khera, 2010; Hirway, 2003). Government assistance and welfare programs may target this demographic to provide support and improve their living conditions.

2.3.1Analytical Procedure

2.3.1.1 Lorenz Curve and Gini Coefficient

The Lorenz curve and the Gini coefficient are statistical tools used to measure the distribution of a variable across a population, typically used to analyze income or wealth inequality, but here it used to distribution of insurance coverage among ST population. It developed by economist Max Lorenz in 1905, plots the cumulative percentage of the population against the cumulative percentage of outcome variable, highlighting the degree of inequality (Lorenz, 1905). Additionally, the Gini coefficient, developed by the Italian statistician Corrado Gini in 1912, is a single number aimed at measuring the degree of inequality in a distribution. It ranges from 0 (or 0 percent) indicating perfect equality (where everyone has the same income) to 1 (or 100 percent) indicating perfect inequality. The Gini Coefficient can be mathematically derived from the Lorenz Curve using the following equation 1:

\(G=1-2∫_0^1  L(x)dx\)​                                          (1)

Where, G is the Gini coefficient, L(x) is the Lorenz Curve, which represents the cumulative proportion of the total income (or wealth) as a function of the cumulative proportion of the population, the integral calculates the area under the Lorenz Curve.

2.3.1.2 Empirical Bayes Smoothing

Empirical Bayes Smoothing (EBS) is a spatio-statistical technique used to stabilize rates, especially when data is sparse or contained high variability. It is particularly useful for spatial analysis, where some spatial units has smaller populations or fewer events (like, for this study, insurance coverage among the ST) can exhibit artificially high or low rates simply due to random fluctuations. By smoothing these rates, EBS helps to produce more reliable and interpretable estimates by “borrowing strength” from neighboring areas or regions with similar characteristics.

The EBS approach adjusts the raw rates by combining the observed data from a particular area with the overall mean rate for all areas. This process allows regions with fewer observations to move their rates closer to the overall mean, while regions with larger populations or more observations retain rates closer to their raw values. The mathematical expressions of EBS as equation 2:

\(r ̂_i=w_i⋅r_i+(1-w_i )⋅r ̅\)​           (2)

Where, ​\(r ̂_i\)​  is the smoothed rate for region i, ​\(r_i\)​  is the raw (observed) rate for region i, ​\( r ̅\)​  is the global rate for all regions, ​\(w_i\)​  is the weight for region i, calculated as equation 3:

\(w_i={n_i \over (n_i+σ_r^2 )}\)​        (3)

Where, ​\(n_i\)​  is the population or sample size in region i, and ​\(σ_r^2\)​  is the variance of the observed rates across all regions.

2.3.1.3 Geographically Weighted Summary Statistics (GWSS)

GWSS plays a crucial role in providing localized summary estimates (equation 4, 5, 6, 7) that aid in understanding the spatial characteristics of the datasets under investigation. The GWSS encompass essential metrics such as GW correlation coefficient, GW standard deviation, GW mean, and GW covariance. In this study, GW correlations are particularly valuable as they help measure and visualize the local connection between the outcome variable and four wealth and economic variables. For the analysis Gaussian kernel function was utilized to calculate the geographical weight (The GW summary statistics components are computed using the following equations (Luo et al., 2019; Yang et al. 2019):

\(x ̅(u_i,v_i )={(∑_j  x_j w_ij) \over (∑_j  w_ij )}\)​         (4)

\(SD(u_i,v_i )={\sqrt{((∑_j  (x_j-x ̅(u_i,v_i ))^2 w_ij) \over (∑_j  w_ij ))}}\)​                        (5)

​​ ​\(Cov⁡(u_i,v_i )={∑_j  [(x_j-x ̅(u_i,v_i ))(y_j-y ̅(u_i,v_i )]) \over ∑_j w_ij }\)​          (6)

\(ρ_{x,y} (u_i,v_i )={Cov_((x,y) )⁡(u_i,v_i ) \over (SD_x (u_i,v_i )SD_y (u_i,v_i ) )}\)                           (7)

Where, ​\(x ̅(u_i,v_i )\)​,  ​\(Cov⁡(u_i,v_i )\)​, ​\(Cov⁡(u_i,v_i )\)​, ​\(ρ_{x,y} (u_i,v_i )\)​  is the GW mean, GW standard deviation, GW covariance, and GW correlation coefficient; ​\((u_i,v_i )\)​ portrays the spatial coordinate at setting of location I; where, x and y indicates to attributes, and ​\(w_{ij}\) is the weight measured via a kernel estimation technique.

2.3.2 Exploratory spatial data analysis (ESDA): Spatial Autocorrelation and Spatial

2.3.2.1 Clustering

Exploratory Spatial Data Analysis (ESDA) is a set of techniques used to describe and visualize spatial distributions, identify patterns, and detect spatial associations in geographic data (Anselin 1988; Dall’erba, 2009). ESDA associates a given variable with a specific location by taking into account the values of the employed variable in the local vicinity (Anselin et al., 2006). It serves as a precursor to more formal spatial statistical modeling, providing insights into the structure and characteristics of spatial datasets (Roy et al., 2022). A popular ESDA technique is spatial autocorrelations that measuring the degree to which objects located near each other are similar or different in terms of values.

2.3.2.2 Moran’s-I

Measures the overall spatial autocorrelation across an entire dataset using the equation 8. It provides a single statistic that summarizes whether values are spatially clustered, dispersed, or randomly distributed. Values of Moran’s I range between -1 and +1,

I > 0: Positive spatial autocorrelation, indicating that similar values cluster together.

I < 0: Negative spatial autocorrelation, indicating that dissimilar values cluster together.

I = 0: No spatial autocorrelation, suggesting random spatial distribution.


Table 1. LISA

Categories

Core Features Characteristics

Neighbourhood Features Characteristics

Remarks

High-High (HH)

High Value

High Value

Cluster

High-Low (HL)

High Value

Low Value

Outlier

Low-Low (LL)

Low Value

Low Value

Cluster

Low-High (LH)

Low Value

High Value

Outlier


Figure 3. Spatial illustrations of health insurance coverage among Scheduled Tribe households across districts in India. Bar Chart shows the proportion of insurance coverage among ST households across different states and union territories, with the national average health insurance coverage for STs marked at 46.63 percent.


\(I={{n \over W}⋅ {∑_{(i=1)}^n  ∑_{(j=1)}^n  w_ij (x_i-x ̅ )(x_j-x ̅ )) \over(∑_{i=1}^n  (x_i-x ̅ )^2 )}}\)​                           (8)

Where, n is the number of spatial units (districts), ​\(x_i\)​  is the value of the variable of interest (health insurance coverage) at location i, ​\(x ̅\)​  is the mean of the variable of interest, ​\(w_ij\)​  is a spatial weight that reflects the proximity between spatial units i and j, W is the sum of all the spatial weights.

2.3.2.3 Local Indicators of Spatial Auto-correlation (LISA)

Local Indicators of Spatial Auto-correlation was developed by Luc Anselin in 1995, LISA statistics extend the concept of global spatial autocorrelation (such as Moran’s-I) to capture local variations in spatial patterns. LISA statistics helps measure the degree of spatial clustering and the occurrence of outliers are defined area (Pramanik et al., 2021). LISAs are widely utilized in various domains to detect geographical outlier or clusters. The measure of univariate LISA [Ii] is constructed by the following equation 9 (Kumar et al., 2022),

\(Univariate \ LISA: I_i = {{n⋅[x_i- \bar{X} ] \over Σ_i [x_i-\bar{X} ]^2 } Σ_j w_ij [x_j-\bar{X} ]}\)​       (9)

Bivariate Local Indicators of Spatial Auto-correlation is another useful tool to identify the nature of spatial association between the exposure and outcome variables with their locational reference (Singh et al., 2011; Kumar et al., 2022). The equation 10 f bivariate LISA [Ii] represented as below (Kumar et al., 2022),

\(Bivariate \ LISA: I_i = {{n⋅[x_i- \bar{X} ] \over Σ_i [y_i-\bar{Y} ]^2 } Σ_j w_ij [y_j-\bar{Y} ]}\)​           (10)

A high positive z-score for a space indicates that the neighboring features have similar values (either high values or low values). Low negative z-score for a space indicates a statistically significant spatial data outlier (Roy et al., 2022). The distribution of LISA represented as (Table 1).


3 . RESULT AND DISCUSSIONS

3.1 Specific Insights on Health Insurance Coverage among ST Households

This section presents a comprehensive spatial analysis of health insurance coverage among ST households across India, emphasizing regional disparities, scheme effectiveness, and the interplay with wealth distribution. The geographic variations are mapped across multiple layers, revealing significant north-south and east-west divides in the penetration of insurance schemes.

The caste-wise distribution of health insurance coverage (Figure 3) shows that Other Backward Classes (OBCs) have the highest coverage at 39.83 percent, followed by Scheduled Tribes (22.16 percent) and Scheduled Castes (20.66 percent), with other social groups accounting for the remaining 17.41 percent. When disaggregated by state and union territory, a bar graph shows wide inter-state variation, with the national average coverage for ST households at 46.63 percent masking substantial sub-regional heterogeneity.

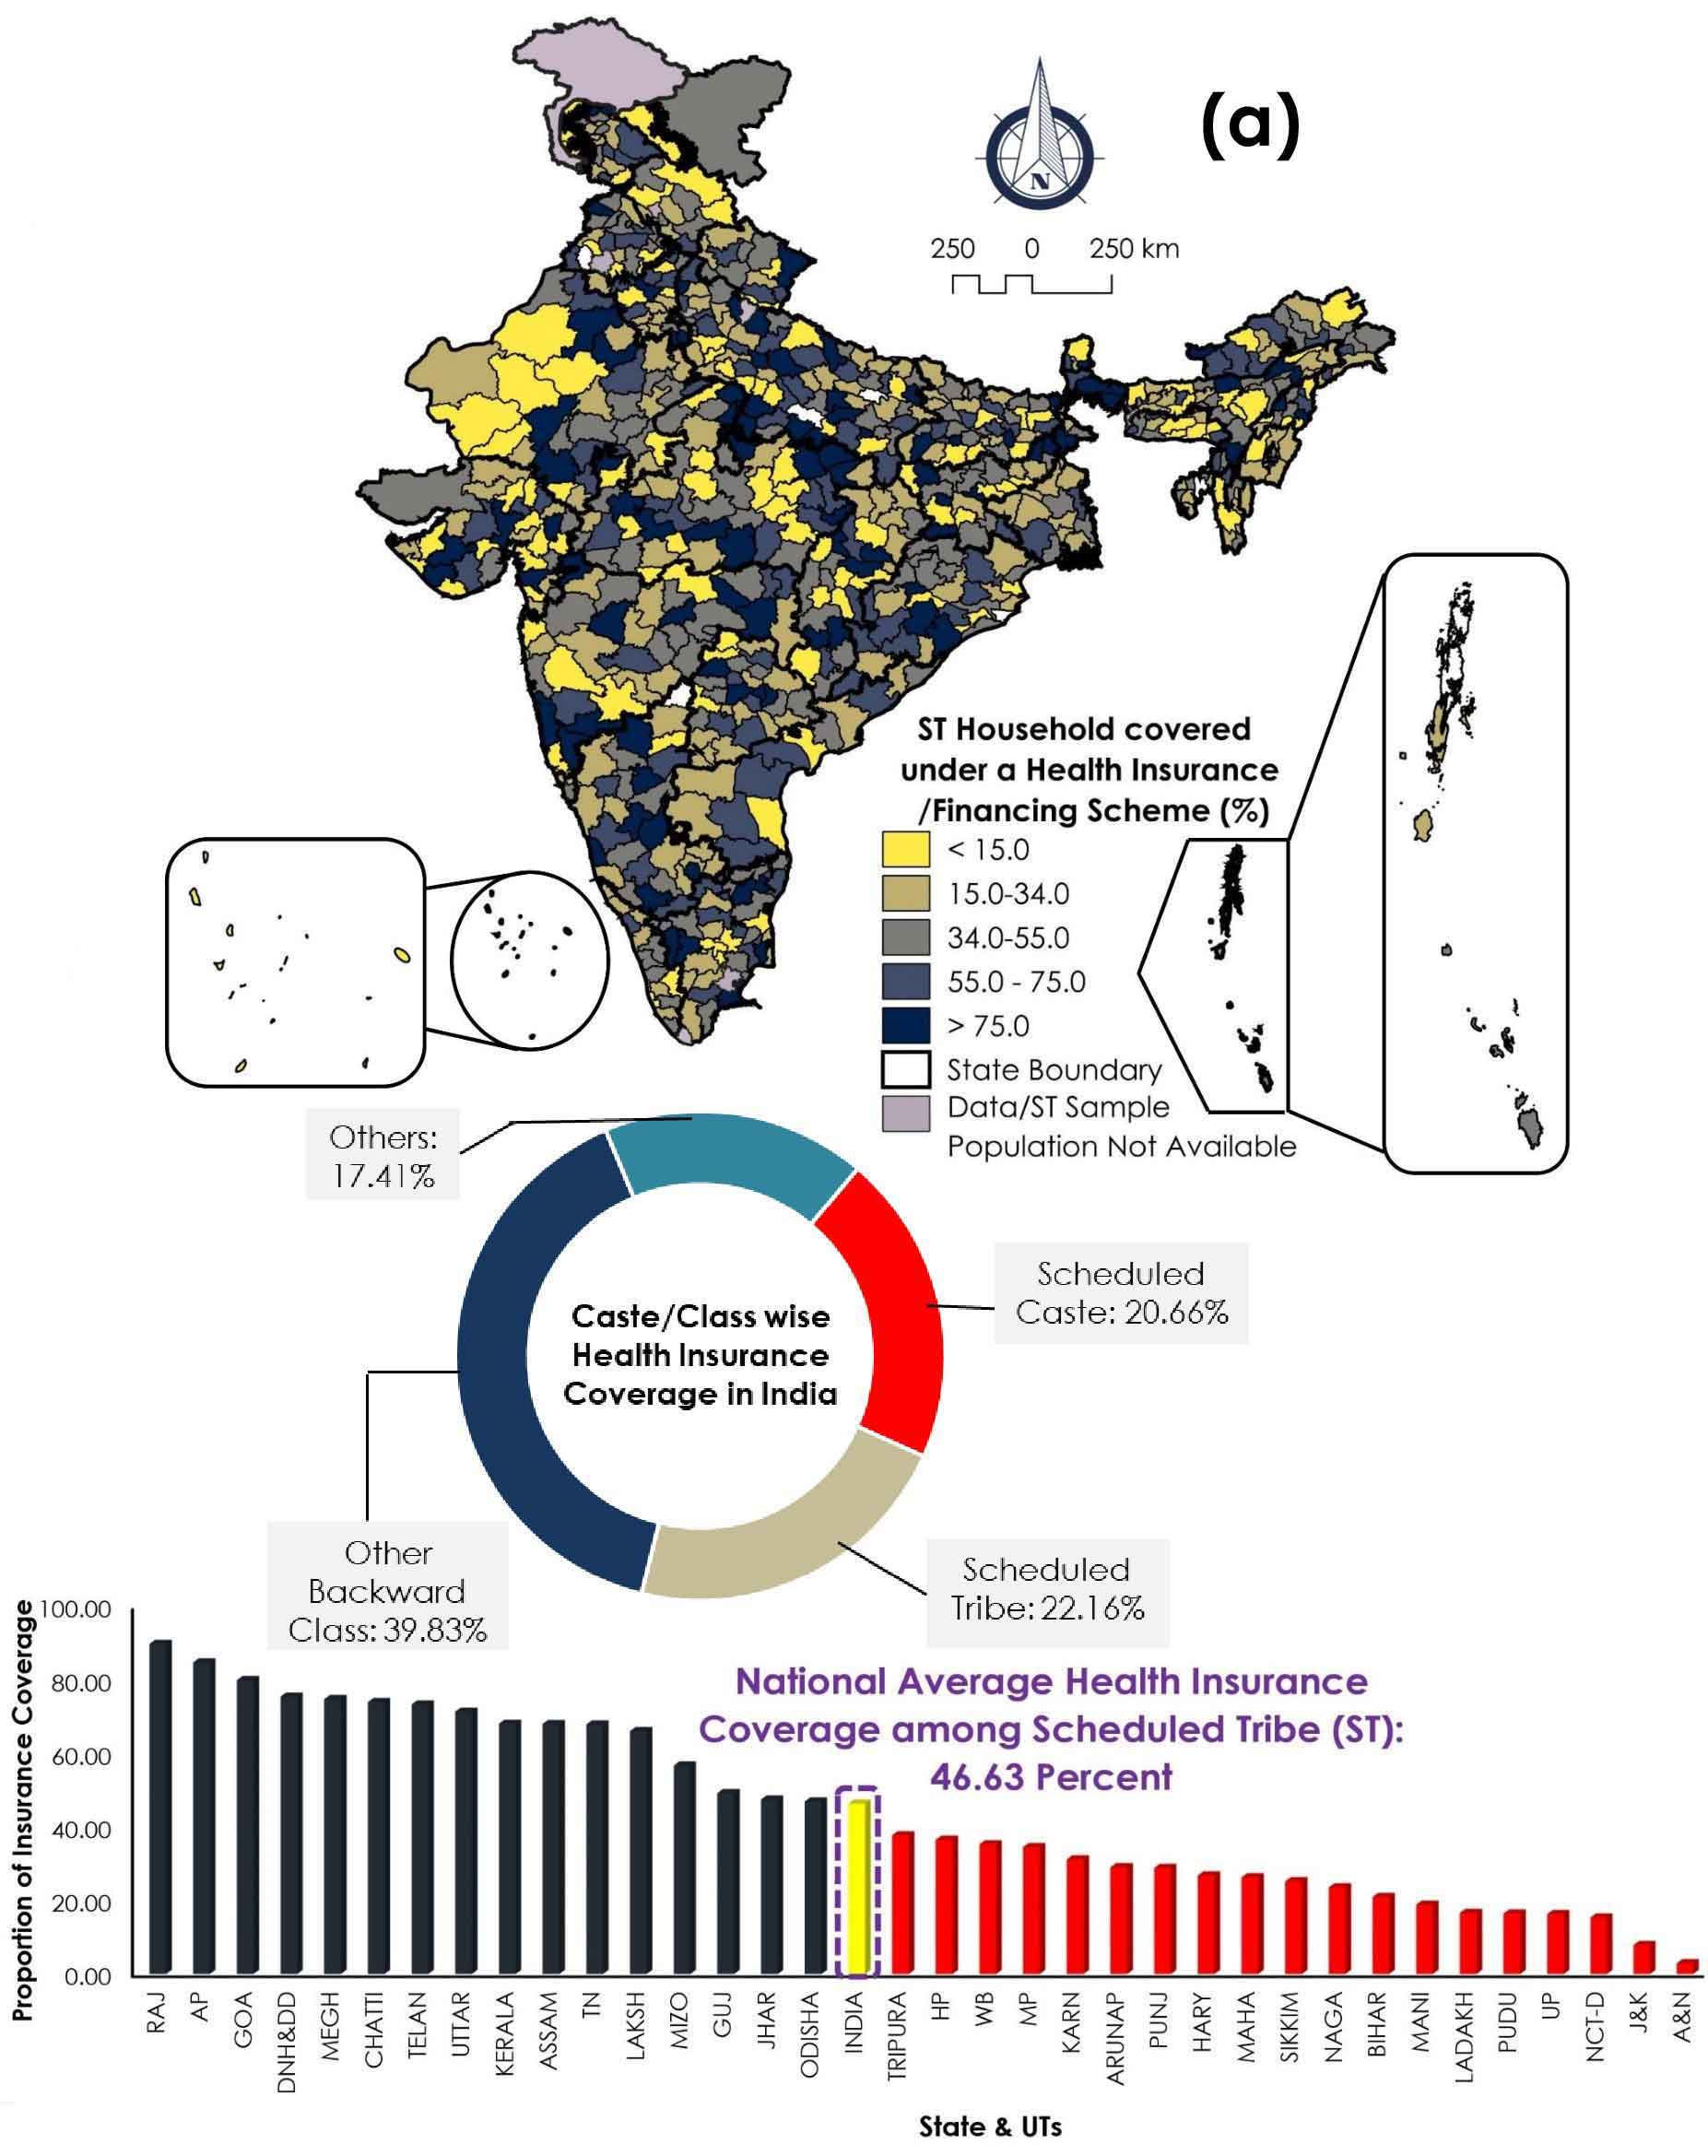
Spatially, higher coverage clusters are concentrated in the southern, central, and western parts of India, particularly in Kerala, Tamil Nadu, Andhra Pradesh, Gujarat, and parts of Chhattisgarh, where more than 75 percent of ST households are insured. These regions are characterized by relatively robust healthcare systems, improved outreach mechanisms, and a strong presence of State Health Insurance Schemes (SHIS) or other community-based initiatives. In contrast, coverage gaps are notable in Rajasthan, Uttar Pradesh, Bihar, West Bengal, and large parts of Northeast India, where coverage among STs often falls below 15 percent. These underperforming areas are marked by developmental backlogs, fragmented health infrastructure, and socio-geographic constraints.

A Lorenz curve with a Gini coefficient of 0.36 (Figure 4) illustrates a moderate level of inequality in health insurance coverage among ST households across India. This value indicates that while some degree of insurance penetration has been achieved, the distribution remains far from equitable. In an ideal scenario, a Gini coefficient of 0 would reflect perfect equality, where every ST household, regardless of region or wealth status, would have equal access to health insurance. However, the observed value of Gini signals persistent structural disparities and ineffective inclusion mechanisms within current health policy frameworks. The Lorenz curve showing that a disproportionately small segment of the ST population enjoys a relatively higher concentration of insurance coverage, while large segments remain uninsured or severely underinsured. This reinforces the broader narrative of spatial and socioeconomic marginalization, wherein access to health insurance is not merely a function of availability but is heavily influenced by geographical location, economic status, and social identity. This moderate inequality also reflects uneven policy outreach and implementation of schemes such as Ayushman Bharat, RSBY, or state-level insurance initiatives. Despite their pro-poor design, these programs often fail to achieve universal or equitable coverage due to logistical barriers, low awareness among remote ST communities, and the urban-rural digital divide. Notably, regions with weak public health infrastructure or limited civil society engagement tend to exhibit more pronounced gaps in insurance coverage, thereby inflating inequality.

A deeper look at individual health insurance schemes in India reveals a highly fragmented and uneven pattern of coverage for ST households. This ragmented landscape reflects deeper structural issues, including employment patterns, administrative design of schemes, and variations in state-level governance.


Figure 4. Lorenz curve with Gini coefficient revealing the pressing inequality among the ST households in terms of health insurance coverage.


The Central Government Health Scheme (CGHS) is primarily meant for central government employees, pensioners and a few selected groups in the formal sector. As a result, its structural design inherently excludes the vast majority of tribal populations, who overwhelmingly work in informal, unorganized sectors such as agriculture, daily wage labor, or forest-based livelihoods. Spatial data show that only a few pockets in states like Punjab, Haryana, Madhya Pradesh, Gujarat, and Rajasthan have more than 6.22 percent ST coverage under CGHS. This is not surprising that, tribal workers rarely have formal job contracts, which means they are ineligible for this scheme. Thus, the low outreach of CGHS is not due to administrative failure, but rather due to a misalignment between the scheme’s target population and the socio-economic profile of tribal communities.

Similarly, Employees’ State Insurance Scheme (ESIS) faces similar limitations. Designed to cover employees working in factories and other registered establishments, ESIS also caters mostly to the formal workforce, with benefits such as medical care, sickness benefits, and maternity benefits. Since most ST workers do not fall under formal employment, they are automatically excluded from this scheme as well. Coverage among STs under ESIS remains negligible, with most districts reporting less than 1.46 percent coverage. Again, the root issue here is not implementation inefficiency, but rather structural inaccessibility due to eligibility criteria. This raises important policy questions about the need to design insurance frameworks that reflect the actual working conditions of India’s most marginalized. Community Health Insurance Programs (CHIP) represent a more inclusive and localized model of health financing, often managed by non-governmental organizations (NGOs), cooperatives, or state-sponsored initiatives. These programs are sometimes tailored specifically for low-income and socially excluded groups, including tribes. Spatial analysis shows slightly better coverage under CHIP in parts of Rajasthan and the Northeast, where community-based organizations have successfully mobilized tribal participation. In some districts, CHIP coverage for STs exceeds 4.35 percent still low, but relatively higher compared to CGHS or ESIS. The advantage of CHIP lies in its bottom-up approach, relying on community trust, social solidarity, and local health workers to build participation. However, CHIP remains localized and underfunded, with limited scalability due to funding constraints, lack of integration with state systems, and poor monitoring mechanisms.

In contrast to the central schemes, State Health Insurance Schemes (SHIS) have shown the greatest success in reaching tribal households. These schemes are often custom-designed by state governments to meet local needs, sometimes using their own funds or leveraging central support. States like Rajasthan, Andhra Pradesh, and Telangana have achieved ST coverage levels exceeding 76 percent in several districts, largely due to strong political will, institutional capacity, effective public-private partnerships, and on-the-ground outreach mechanisms. In some northeastern states as well, certain districts exhibit high SHIS coverage. However, others, such as Assam, Manipur, Nagaland, and Tripura continue to lag due to administrative bottlenecks, lower resource allocation, or geographical challenges. Importantly, the success of SHIS programs demonstrates that decentralized, state-led efforts can effectively penetrate remote and marginalized areas, provided there is sustained investment and local adaptability.

Privately purchased commercial health insurance typically offered by for-profit insurance companies is almost non-existent among ST populations. Only a few relatively better-off districts in Andhra Pradesh, Gujarat, and Sikkim show marginally higher uptake (still less than 12 percent). For most tribal households, private insurance remains unaffordable, difficult to understand, and disconnected from their lived realities. These schemes often involve high premiums, complicated paperwork, and urban-centric hospital networks all of which alienate the average tribal consumer. Moreover, there is a lack of financial literacy, digital access, and insurance awareness in tribal belts, further preventing engagement with the commercial insurance market.

Interestingly, some southern states such as Tamil Nadu and parts of Kerala, along with isolated pockets in the Northeast, show aggregated insurance coverage through a mix of SHIS, CHIP, and legacy schemes. These areas benefiting from more developed public health infrastructure, stronger primary care systems, and institutional continuity demonstrate relatively higher coverage among ST households.


Figure 5. Spatial analysis of health insurance coverage in India, utilizing exploratory spatial data analysis techniques at the district level. (a) Spatial Empirical Bayes Smoothing (EBS) Rates of Health Insurance Coverage; (b) Spatial clustering of districts with Local Moran’s I based on health insurance coverage rates; (c) significant hot spots (red) and cold spots (blue) of health insurance coverage using Hot Spot Analysis (Getis-Ord Gi* Statistic).


3.2 Spatial Inequality Pattern Identifications: EBS, Univariate LISA and Getis-Ord Gi*

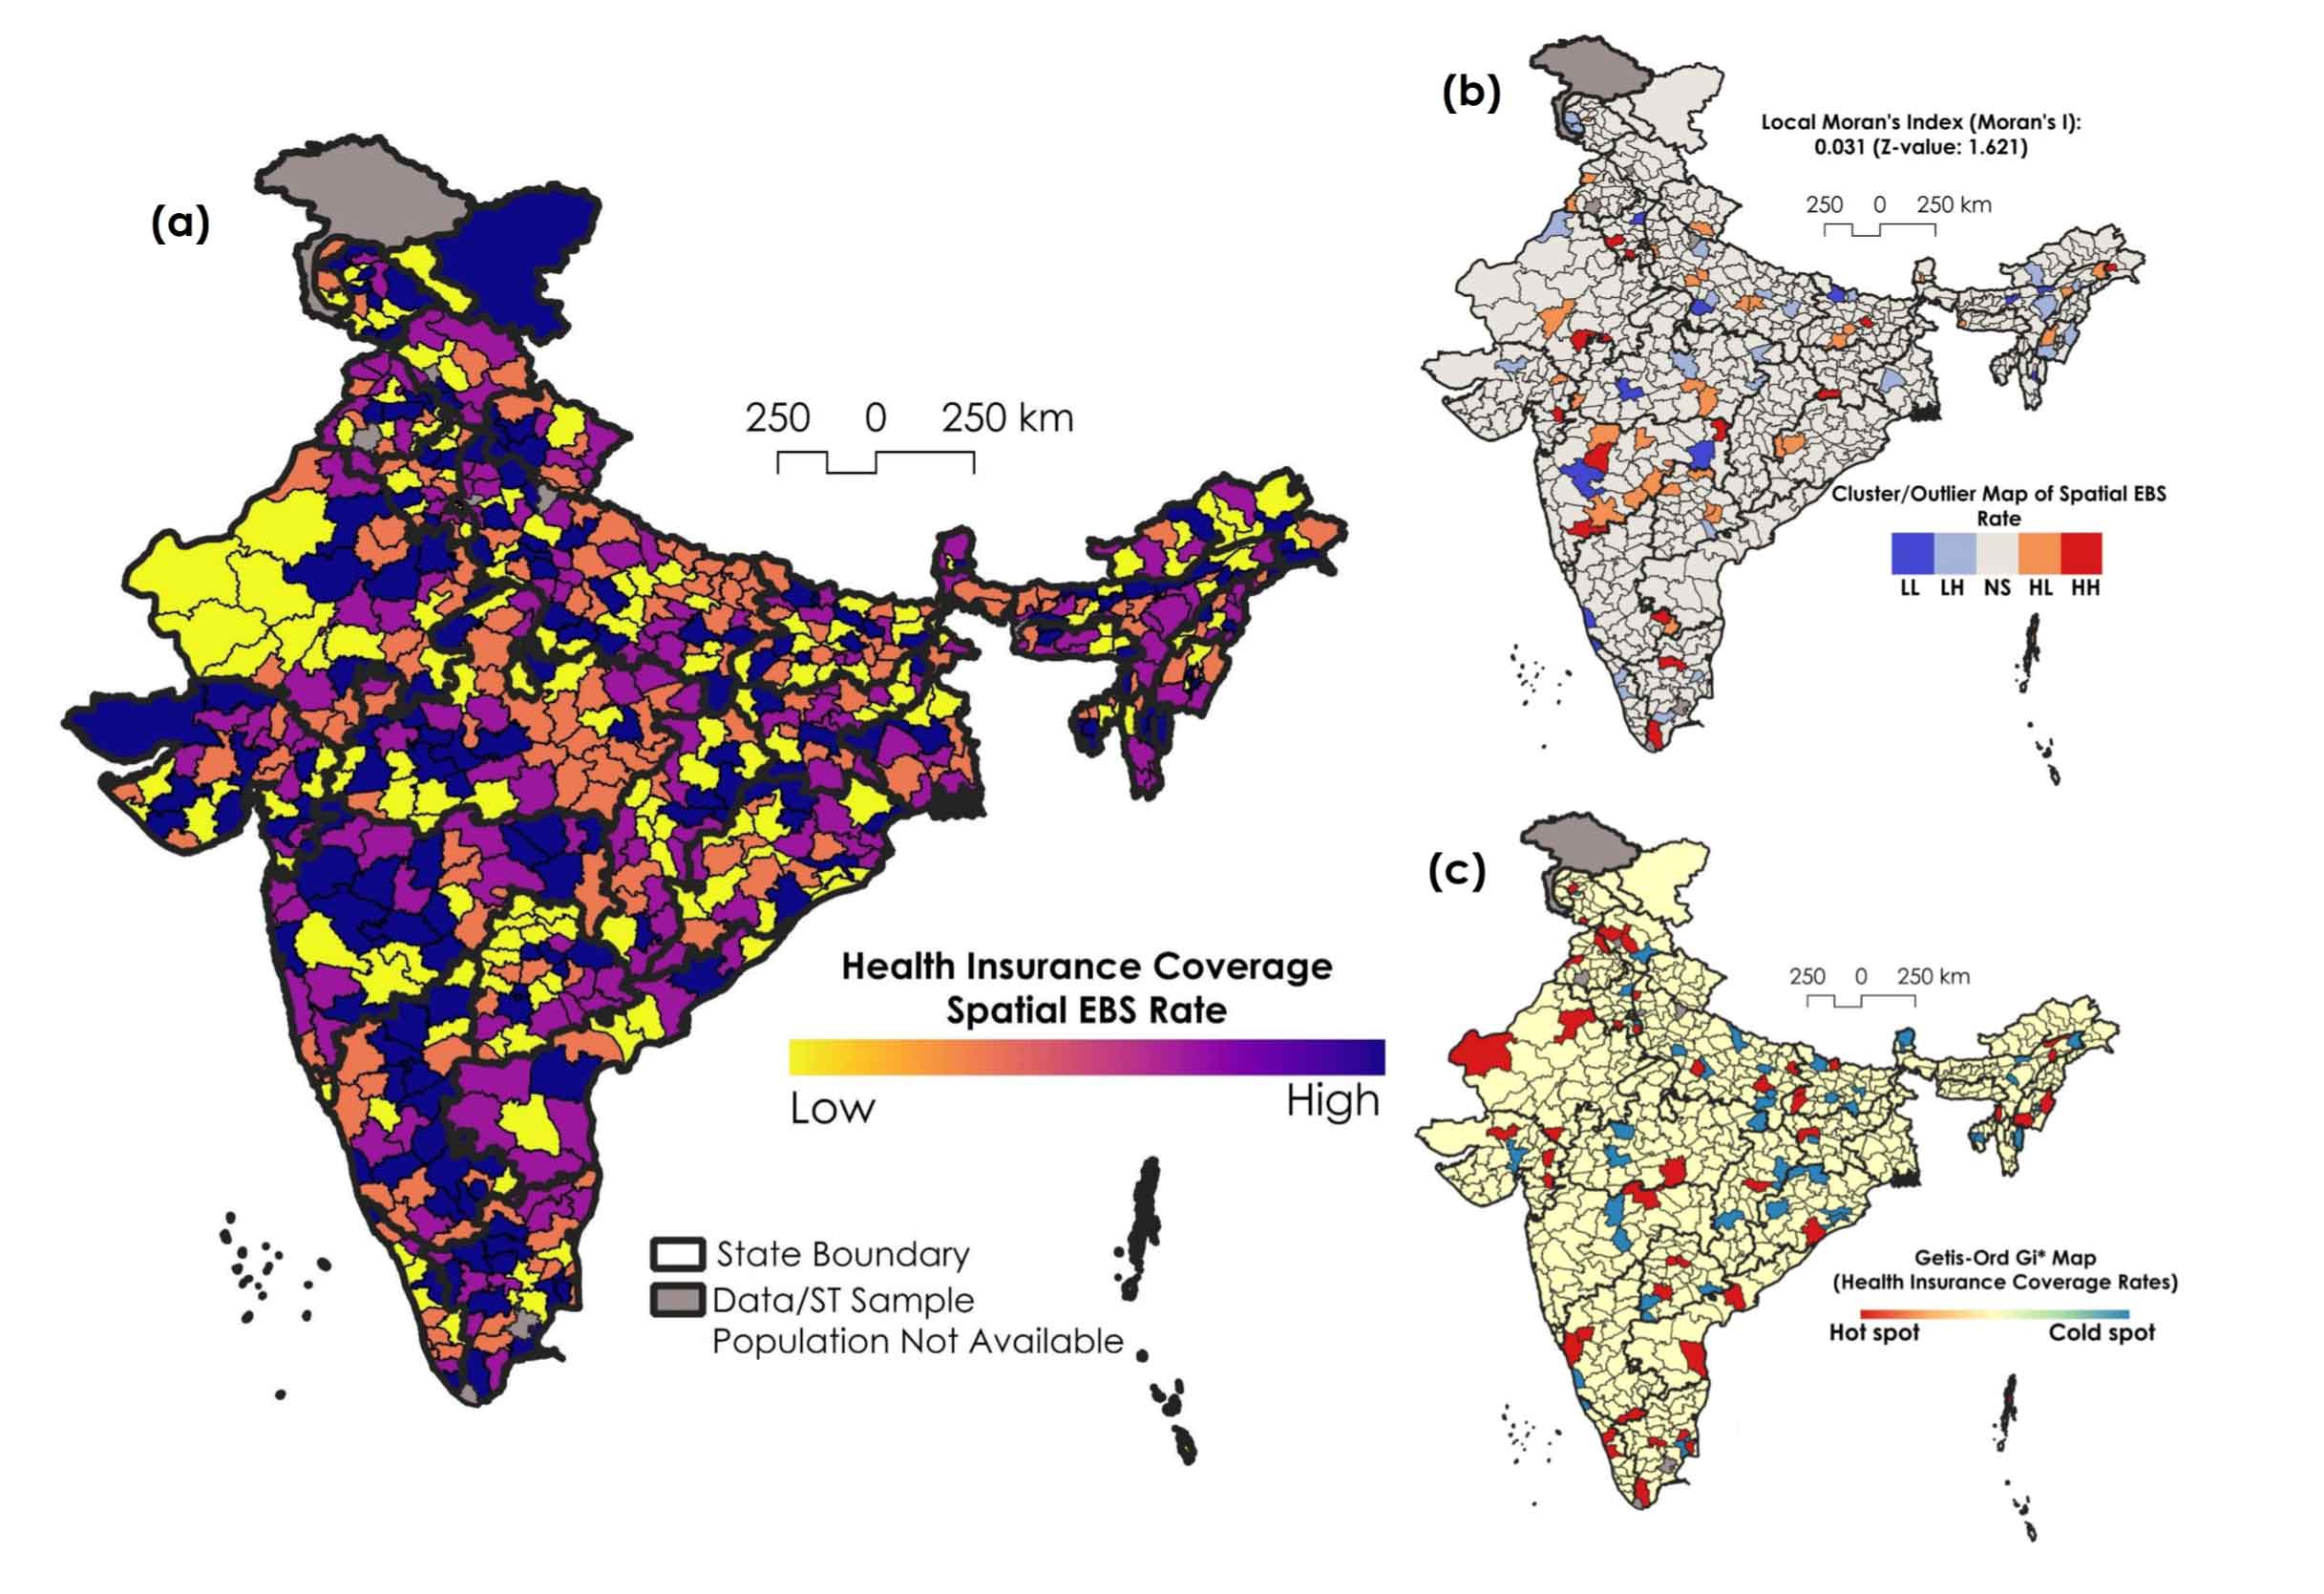
Figure 5 offers a detailed spatial analysis of health insurance coverage among Scheduled Tribe (ST) households across India present a clearer and more reliable picture of geographic disparities. The Figure 5 focusing on the spatial distribution and the application of Empirical Bayes Smoothing (EBS) to correct for statistical noise in areas with small populations or low counts. EBS is critical in ensuring that rates are more stable and less biased by small population sizes, which can lead to exaggerated or misleading high/low rates. EBS helps stabilize these values by borrowing strength from neighboring areas and adjusting extreme or unreliable figures. This results in a smoothed map, where patterns are clearer, and the influence of random chance is reduced. In simpler terms, it ensures that small or rural districts are not unfairly represented as outliers just because of their size. This method allows for a more reliable spatial interpretation of health insurance coverage, especially in areas with smaller populations or extreme values, smoothing out random fluctuations.

The application of Empirical Bayes Smoothing (Figure 5a) serves as a foundational step by adjusting for statistical instability in districts with small populations or sparse coverage data. This method minimizes the risk of overestimating or underestimating coverage in low-count areas, thereby ensuring that the observed patterns reflect systemic realities rather than random variation. The smoothed data reveals a clear north-south and east-west divide, with southern and western states, notably Kerala, Tamil Nadu, Karnataka, Andhra Pradesh, Maharashtra, and Gujarat exhibiting consistently high levels of insurance coverage among ST households. These regions are characterized by better healthcare infrastructure, higher health awareness, and the effective deployment of State Health Insurance Schemes (SHIS).

In stark contrast, the northern, northeastern, and central regions, particularly Uttar Pradesh, Madhya Pradesh, Bihar, Jharkhand, and parts of the Northeast register lower smoothed coverage rates, suggesting systemic barriers such as infrastructural deficits, weak governance, limited institutional outreach, and socio-economic exclusion. The adjusted figures confirm that these are not statistical outliers but structurally disadvantaged zones, requiring sustained public policy attention.

Building on this smoothed baseline, Local Moran’s I was employed as a spatial autocorrelation statistic to detect localized patterns of clustering and outliers. Unlike global measures of spatial autocorrelation, which summarize spatial dependence across the entire study area, Local Moran’s I enables the identification of local-level spatial dependencies, offering nuanced insights into how insurance coverage is distributed relative to neighboring districts.

The application of Local Moran’s I to the EBS data revealed a statistically significant spatial structure in the distribution of ST health insurance coverage. Specifically, four categories of spatial association were identified: High-High (HH) clusters, Low-Low (LL) clusters, High-Low (HL) outliers, and Low-High (LH) outliers. These spatial patterns illustrate how certain areas exhibit positive spatial autocorrelation, districts with similar levels of coverage tend to cluster together, while others demonstrate negative autocorrelation, where districts differ sharply from their neighbors. The combined scenario of Figures 5a, 5b, and 5c reveals pronounced regional disparities in insurance coverage for ST households. Broadly speaking, southern and western India emerge as hotspots of high and consistent coverage, while northern, northeastern, and central India display cold spots zones of persistent exclusion and under coverage.

The HH clusters represent regions where districts with high insurance coverage are surrounded by other similarly high-performing districts. These clusters were predominantly located in southern and western India, notably in Kerala, Tamil Nadu, parts of Rajasthan, and Gujarat (Figure 5b). The spatial concentration of high-coverage districts in these states reflects not only stronger health infrastructure and administrative capacity but also the successful implementation of SHIS. The clustering effect suggests that health policy interventions in these regions have likely benefited from regional policy diffusion, where best practices and institutional capacities spill over into neighboring districts, creating reinforcing zones of success.

Conversely, LL clusters were found in several northern, central, and eastern states, especially in Uttar Pradesh, Bihar, Jharkhand, and parts of Maharashtra (Figure 5c). In these districts, low insurance coverage is surrounded by similarly underperforming areas, indicating the presence of spatially entrenched disadvantages. These LL clusters are emblematic of broader structural issues, such as weak state capacity, under-resourced health systems, limited community outreach, and socio-economic marginalization of tribal populations that transcend district boundaries. The spatial persistence of these low-performing areas calls for coordinated, multi-district interventions that go beyond isolated programs and address regional governance failures and infrastructural deficits.

In addition to these core clusters, outlier patterns also emerged, with HL and LH associations marking spatial discontinuities. HL outliers indicate districts with high coverage surrounded by low-performing neighbors, while LH outliers suggest the opposite. These outliers are analytically significant because they may represent localized innovations or implementation anomalies. For instance, a district showing HL association might be benefiting from a successful local insurance pilot, NGO intervention, or a particularly efficient health administration. Conversely, LH districts may be constrained by localized barriers, such as poor terrain, political neglect, or community resistance despite being surrounded by otherwise better-performing districts. In essence, these spatial diagnostics make a compelling case for moving beyond national averages and one-size-fits-all policies. Recognizing these outliers offers strategic entry points for policy learning and localized troubleshooting. As India advances toward universal health coverage, such geographically informed approaches are essential to ensuring equity, inclusion, and structural justice for historically marginalized communities.

3.3 Regional Disparities in Wealth and Insurance Coverage

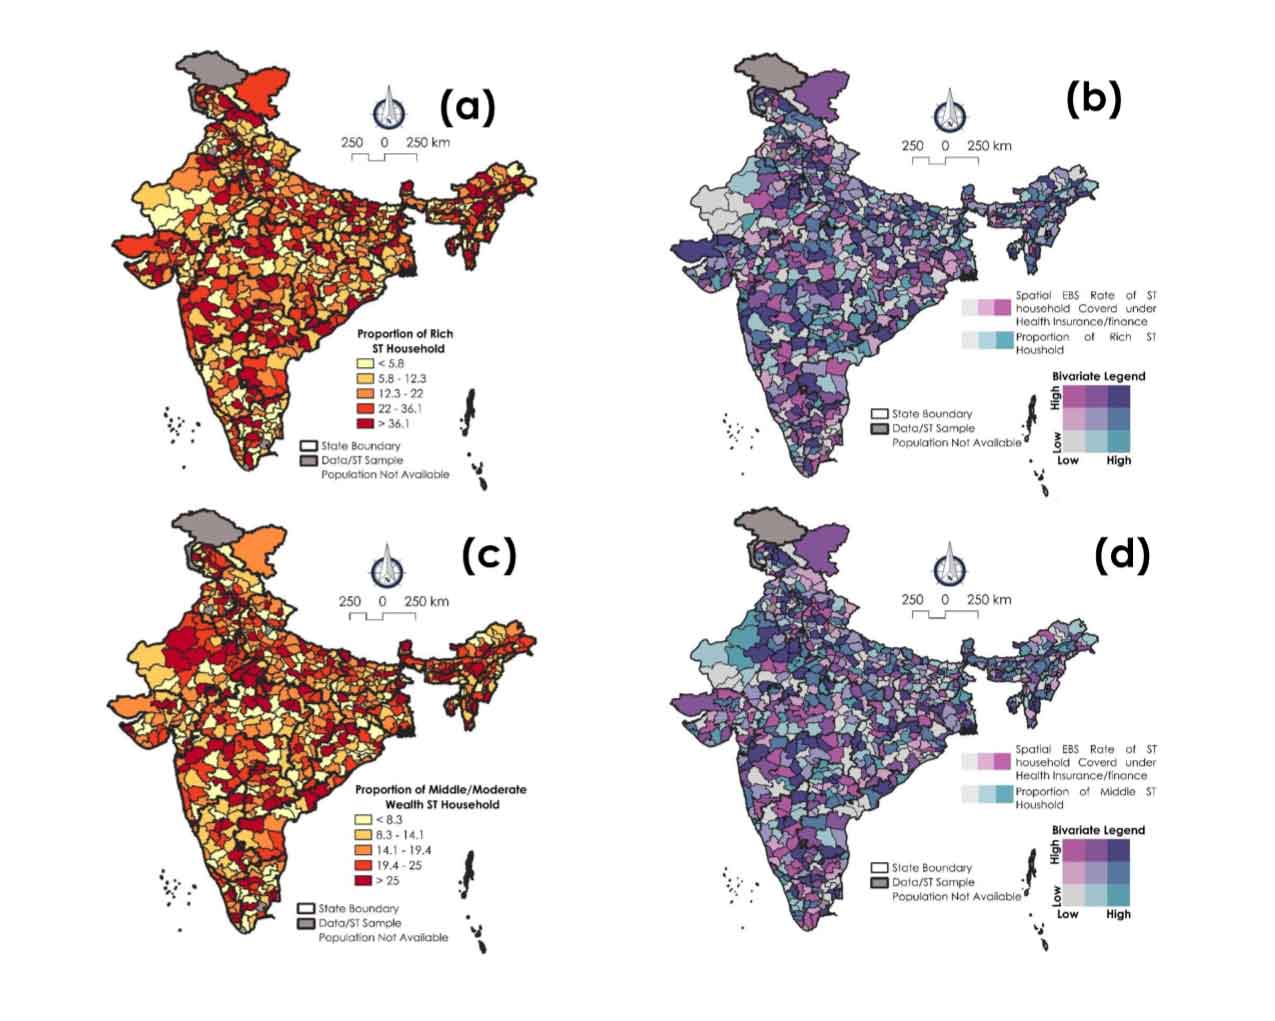
The maps presented in Figure 6(a-d) provide a detailed spatial perspective on the distribution of economic status among Scheduled Tribe (ST) households in India and its interrelationship with health insurance coverage at the district level. Through both univariate and bivariate spatial visualizations, these maps facilitate unpack the geographic inequality in wealth and healthcare access among tribal populations two fundamental dimensions of social security.

Figure 6a illustrates the spatial distribution of rich ST households, those situated in the upper economic tier among tribal communities. The map shows a pronounced spatial concentration of these households in southern and western India, especially in states such as Karnataka, Maharashtra, and parts of Gujarat, where over 36.1 percent of ST households fall under the 'rich' category. These areas tend to have better infrastructure, more diversified livelihoods, greater exposure to urban economies, and in many cases, stronger government program implementation. In contrast, northern and eastern states, including Uttar Pradesh, Bihar, Jharkhand, and West Bengal, have very low proportions of rich ST households, often below 5.8 percent. These patterns reflect historic and systemic disadvantages, including landlessness, lower educational attainment, and weaker integration into regional markets.

Importantly, this wealth distribution is not random. As shown in Figure 6b, when overlaid with health insurance coverage, a clear positive spatial correlation emerges in several regions. In districts where the proportion of rich ST households is high, particularly in the south and west health insurance coverage rates are also significantly higher. This co-occurrence of wealth and insurance coverage suggests a reinforcing relationship: economically better-off tribal households are more likely to enroll in or benefit from insurance schemes, possibly due to greater awareness, better access to administrative networks, or the ability to meet formal documentation requirements.

Conversely, in districts across the north and east, where tribal communities are predominantly poorer, both wealth and health insurance coverage remain low. This dual deficit, low economic capital and inadequate health security reflects a vicious cycle of exclusion, wherein lack of financial means directly limits access to essential health protections. These findings underscore a critical insight: wealth inequalities among STs directly translate into health protection inequalities, perpetuating socio-economic vulnerability over generations.

While rich households represent a narrower economic elite, the moderate-wealth or middle-income ST households form a much larger segment and offer insight into emerging socioeconomic mobility. Figure 6c maps the distribution of these households, revealing a broader but more uneven pattern. Higher proportions of middle-wealth ST households are concentrated in the central Indian belt, notably in Madhya Pradesh, Chhattisgarh, and selected districts of southern and northeastern India. These areas typically represent transitional zones, where tribal communities have gained some economic traction through agriculture, public sector employment, or state-level welfare schemes, but remain vulnerable to shocks. Figure 6d explores the bivariate spatial association between the proportion of middle-wealth ST households and health insurance coverage. The relationship here is positive, but weaker than that observed with the richer ST group. Districts with higher proportions of middle-income households, especially in the central and southern regions do tend to show better insurance coverage, yet the improvement is less consistent and often influenced by state-specific policies and local implementation efficiency. This suggests that while economic upliftment contributes to improve insurance access, it may not be sufficient on its own without targeted enrollment drives and administrative support.


Figure 6. Bivariate choropleth maps showing the combined effect and spatial patterns of socioeconomic attributes (wealth aspects of households) and health insurance coverage among Scheduled Tribes (ST) households in India. (a) Proportion of Rich ST Households; (b) A bivariate representation showing the relationship between the spatial EBS rates of ST households covered under health insurance and the proportion of rich ST households; (c) Proportion of Middle/Moderate Wealth ST Households; (d) Bivariate analysis depicting the interplay between health insurance coverage (EBS rates) and the proportion of moderate-income ST households.


Interestingly, several middle-wealth clusters do not exhibit proportionally high insurance coverage, indicating gaps in policy outreach or information dissemination. For instance, a household with modest resources may still fail to enroll in insurance schemes due to lack of awareness, language barriers, or difficulties in navigating complex administrative procedures. Therefore, the relationship between moderate wealth and insurance coverage is more sensitive to non-economic factors, including social capital and governance quality. These patterns underscore the multidimensional nature of vulnerability among tribal households, where economic status, geography, and healthcare access intersect. Importantly, while improving wealth conditions is key, it is not sufficient on its own.


Figure 7. Bivariate choropleth maps showing the combined effect and spatial patterns of socioeconomic attributes (wealth aspects of households) and health insurance coverage among Scheduled Tribes (ST) households in India. (a) Proportion of Below Poverty Level (BPL) category ST Households; (b) A bivariate representation showing the relationship between the spatial EBS rates of ST households covered under health insurance and the proportion of BPL ST households; (c) Proportion of Poor Wealth ST Households; (d) Bivariate analysis depicting the interplay between health insurance coverage (EBS rates) and the proportion of Poor wealth ST households.


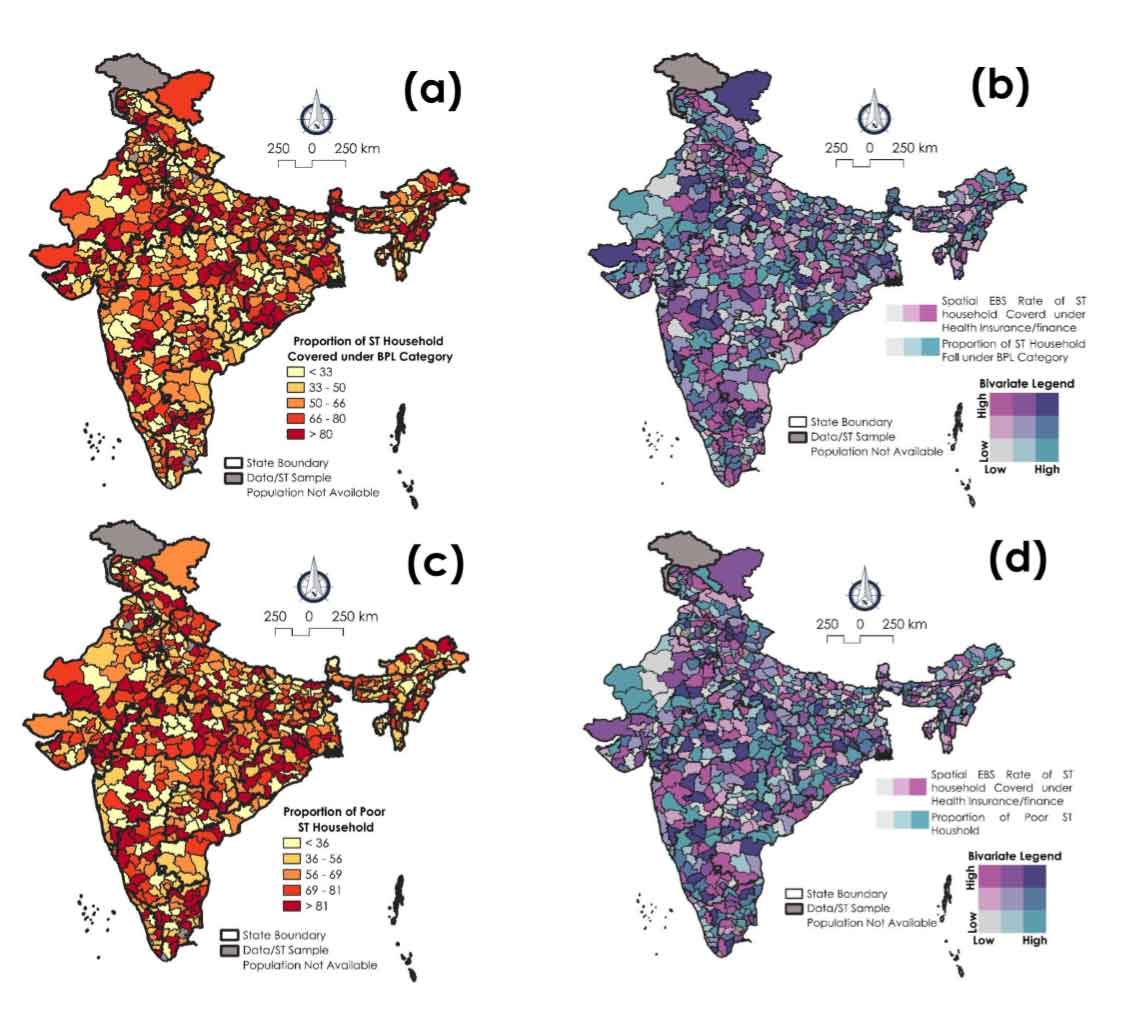
The maps in Figure 7 (a-d) deepen our understanding of the intersection between economic vulnerability and healthcare access among Scheduled Tribe households in India. These visualizations focus specifically on two markers of deprivation: households falling under the BPL classification and those designated as ‘poor’ based on wealth quintile data. When these economic indicators are analyzed in tandem with health insurance coverage, they reveal stark regional inequalities and structural disadvantages that disproportionately affect tribal communities in specific parts of the country.

Figure 7a presents the district-level distribution of ST households categorized as BPL a designation commonly used in policy targeting to identify socio-economically disadvantaged groups. A distinct north-east concentration is observed: districts in Bihar, Jharkhand, Odisha, and West Bengal show very high proportions of ST households under BPL, often exceeding 80 percent. These regions are historically underserved and exhibit persistent deprivation across multiple social indicators, including land ownership, literacy, and employment.

By contrast, southern and western states such as Kerala, Tamil Nadu, Gujarat, and parts of Maharashtra display a lower proportion of BPL-classified ST households, generally below 33 percent. This reflects comparatively stronger socio-economic conditions, better access to welfare services, and improved livelihood diversification in these regions. When the BPL data is paired with health insurance coverage in Figure 7b, a clear and inverse spatial pattern emerges. In districts where BPL proportions are highest, especially in northern and eastern India, health insurance coverage tends to be lowest. This indicates a negative spatial association, suggesting that the very regions with the highest economic vulnerability are also the most underserved in terms of health protection. This finding challenges the intended targeting mechanisms of public health schemes, many of which are specifically designed to prioritize BPL populations.

Conversely, in some southern and western districts the share of BPL households is lower, yet health insurance coverage is relatively high. This geographical misalignment between economic need and healthcare protection highlights a critical policy gap. While wealthier or less vulnerable regions are achieving better enrollment and insurance uptake, the most economically distressed areas, which should, in theory, be receiving the most support are being left behind, possibly due to administrative bottlenecks, lack of awareness, or geographic inaccessibility.

Complementing the BPL analysis, Figures 7c and 7d examine the proportion of ‘poor’ ST households as classified by asset-based wealth indices, offering a broader and more multidimensional view of poverty. Figure 7c reveals that poverty among ST households is highly concentrated in the north and east, particularly in Uttar Pradesh, Bihar, West Bengal, Jharkhand, and Odisha, where more than 81 percent of ST households fall into the lowest wealth category. This pattern aligns closely with long-standing regional disparities in land ownership, human capital development, and rural livelihoods. These districts typically lack reliable infrastructure, public health systems, and effective local governance, factors that collectively constrain opportunities for socio-economic advancement.

In contrast, southern and western India, especially districts in Tamil Nadu, Kerala, Maharashtra, and Gujarat, exhibit a lower proportion of poor ST households, often below 36 percent. These areas have benefited from more progressive welfare policies, better education and health infrastructure, and stronger community-based institutions. Figure 7d, which maps the bivariate relationship between poverty levels and health insurance coverage, further corroborates the inverse association observed in the BPL analysis. Districts with a higher concentration of poor ST households primarily in the north and east tend to exhibit markedly low levels of health insurance coverage. This correlation underscores a compounding disadvantage: those most in need of financial protection are least likely to receive it. While some central and northeastern districts show moderate improvements, the positive association between reduced poverty and higher insurance coverage is far more consistent in southern and western India, reinforcing the idea that economic status remains a key determinant of health security access. Importantly, the strength of this relationship is less variable in the south, likely due to more effective state-sponsored insurance schemes (namely, SHIS) and better administrative outreach.

Altogether, Figures 6 and 7 present compelling evidence of a geographically rooted cycle of deprivation. In much of northern and eastern India, ST households are economically marginalized and simultaneously excluded from health insurance protection. These areas represent converging zones of poverty and health insecurity, where existing public schemes are not reaching their intended beneficiaries. On the other hand, southern and western districts exhibit a double advantage lower economic vulnerability and higher health insurance penetration, suggesting that state capacity, local governance, and socio-political integration play significant roles in shaping coverage outcomes.

3.4 Spatial Nexus between Economic Vulnerability and Health Insurance Coverage

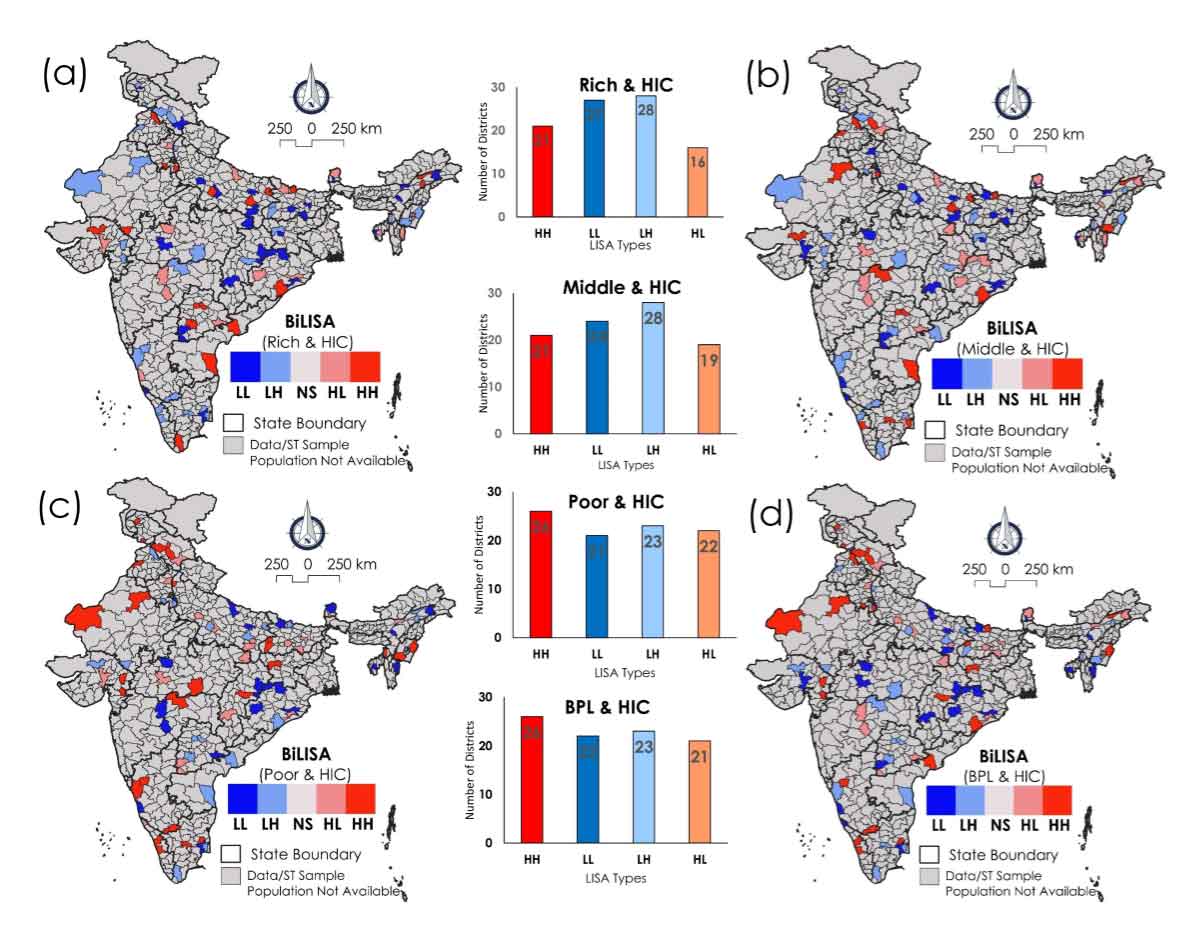
The maps in Figure 8 deepen geographical understanding of the bivariate intersection between economic vulnerability and healthcare access among ST households in India. Together, Figures 8 a-d present compelling evidence of a geographically rooted cycle of deprivation. In much of northern and eastern India, ST households are economically marginalized and simultaneously excluded from health insurance protection. These areas represent converging zones of poverty and health insecurity, where existing public schemes are not reaching their intended beneficiaries. On the other hand, southern and western districts exhibit a double advantage lower economic vulnerability and higher health insurance penetration, suggesting that state capacity, local governance, and socio-political integration play significant roles in shaping coverage outcomes. When these economic indicators are analyzed in tandem with health insurance coverage, they reveal stark regional inequalities and structural disadvantages that disproportionately affect tribal communities in specific parts of the country. A striking pattern that emerges from both maps is the prevalence of districts in northern, eastern, and central India that fall into the “high poverty-low insurance” quadrant. These are districts where large proportions of ST households are economically deprived, either classified under the BPL category or falling into the lowest wealth quintile and simultaneously exhibit poor enrollment in health insurance schemes. This co-location of poverty and exclusion represents the epicenter of structural marginalization. In such districts, ST households not only suffer from a lack of basic resources but are also denied access to one of the key protective mechanisms meant to shield them from health-related financial shocks.


Figure 8. Bivariate Local Indicators of Spatial Association (BiLISA) maps illustrating the spatial relationship (Spatial clusters and outliers) between health insurance coverage (HIC) and various socioeconomic strata among Scheduled Tribes (ST) households in India; (a) Rich ST households and health insurance coverage rates. (b) Moderate-income ST households and health insurance coverage rates; (c) Poor ST households and health insurance coverage rates; (d) Below Poverty Line (BPL) ST households and health insurance coverage rates.


The Rich and HIC map in Figure 8a shows districts where wealth (or economic prosperity) is high, in relation to the health insurance coverage among ST populations. The HH clusters, marked in red, indicate districts where both the rich population and the ST population with high health insurance coverage are concentrated. These clusters are found for 28 districts mainly located in northern, northeastern, and central India. These regions reflect districts where economic prosperity is coupled with better access to health services for marginalized communities. On the other hand, LL clusters, shown in blue, reflect districts with low wealth and low health insurance coverage among STs. These districts are mainly spread across central and southern parts of India, indicating areas where both economic development and health protection for ST communities lag behind. The scattered HL and LH districts reflect transitional zones, where one of the variables (wealth or health insurance coverage) is advanced, while the other is lacking. This categorically indicate regions with economic wealth but insufficient health insurance coverage for STs or areas where health insurance coverage for STs is significant but economic prosperity is lower.

In the Middle and HIC category in Figure 8b, districts with middle-income status are examined alongside the extent of health insurance coverage among the ST population. The HH clusters are more prominent in the northern and northwestern regions, indicating that in these 21 districts, a middle-income population is associated with higher levels of health insurance coverage for STs. These represent districts where moderate economic development has translated into better access to health services for marginalized populations. LL clusters, representing middle-income districts with low health insurance coverage for STs, are more widely dispersed across central and southern India, indicating regions that have moderate economic development but lag in providing health insurance to ST communities. The HL and LH areas are again scattered, reflecting districts that exhibit uneven development between economic status and healthcare coverage for Scheduled Tribes.

In the Poor and HIC map, districts with higher poverty levels are analyzed in conjunction with health insurance coverage among the ST population (Figure 8c). HH clusters in the northern and northwestern regions indicate areas where poverty and high health insurance coverage for STs coexist (for 26 districts). This suggests that despite the overall poverty in these regions, efforts have been made to provide health insurance to ST communities, due to directed health programs. Conversely, LL clusters, representing poor districts with low health insurance coverage for STs, are found in central and eastern India, showing regions where both poverty and lack of health coverage are critical issues.

Figure 8d focus is on districts where a significant portion of the population lives Below the Poverty Line, combined with the level of health insurance coverage for ST households. The HH clusters, which are prominent in the northern and northwestern regions, indicate areas where both high BPL household dominancy and high health insurance coverage for ST populations coincide. This mainly suggest areas where, despite the prevalence of extreme poverty, there has been effective implementation of health insurance schemes for marginalized groups, possibly through government interventions like subsidized health insurance programs for BPL families. LL clusters, found mainly in central and western parts of India, represent districts where both BPL levels and health insurance coverage for STs are low, suggesting areas where both economic upliftment and healthcare access are lagging. The HL and LH areas, where one factor is high and the other low are scattered across various parts of India, indicating uneven progress in terms of poverty reduction and healthcare coverage for Scheduled Tribes.

The bivariate maps also reveal spatial mismatches, where expected correlations are not observed. A few districts in central and northeastern India, for instance, demonstrate high proportions of poor or BPL ST households but moderate-to-high insurance coverage. These “high poverty-high coverage” zones indicate that with the right policy instruments and delivery mechanisms, economic deprivation need not translate into health insecurity. These regions could be benefiting from effective NGO partnerships, community health workers, or localized innovations in insurance outreach. They deserve further qualitative exploration to identify best practices.

On the other hand, some districts with relatively low poverty still report low insurance coverage, falling into the ‘low poverty-low coverage’ category. These anomalies suggest administrative neglect, weak political will, or lack of program visibility despite the economic potential of the community. Such mismatches highlight the importance of looking beyond economic indicators alone when designing interventions and considering socio-cultural or political constraints that may hinder coverage. These spatial analyses underscore the varying relationships between socioeconomic conditions and health insurance coverage among marginalized groups like Scheduled Tribes in India. From this analysis, the findings suggest that, HH clusters in the northern, northwestern, and central parts of India indicate regions where there is either wealth or higher poverty, coupled with significant health insurance coverage for ST populations. These areas may reflect regions where health insurance programs for Scheduled Tribes are effective, possibly due to targeted government health schemes. In contrast, LL clusters are more spread across central, southern, and western India, reflecting districts that are struggling with both lower economic status and poor health insurance coverage for the ST population. These areas could be priority regions for policies that aim to both reduce poverty and improve healthcare access for ST communities.


Table 2. Typology of local realities based on the directions and intensity of GW correlations

Type

Wealth-Insurance Correlation

Implications

Type A

Strong positive

Prosperity is leveraged into protection (namely, Telangana, Andhra Pradesh) - maintain momentum.

Type B

Weak/negative

Wealth does not translate to insurance (namely, Rajasthan, UP) - improve outreach and delivery.

Type C

Middle-income gaps

Coverage breaks for non-poor, non-rich (namely, Odisha, MP) - address policy blind spots.

Type D

Strong negative (BPL-poor)

Poorest excluded from protection (namely, Jharkhand, Bihar) - urgent corrective action needed.


Figure 9. Geographically Weighted Correlation (GW Correlation) analysis highlights the spatially varying relationships between socioeconomic attributes (wealth aspects of households) and health insurance coverage among Scheduled Tribe (ST) households in India, with correlation coefficients displayed as a localized neighborhood gradient of either positive correlation to negative correlation between the attributes. (a) Rich ST households and health insurance coverage rates. (b) Moderate-income ST households and health insurance coverage rates; (c) Poor ST households and health insurance coverage rates; (d) Below Poverty Line (BPL) ST households and health insurance coverage rates.


3.5 Localized Correlation between Health Insurance with Wealth Dynamics

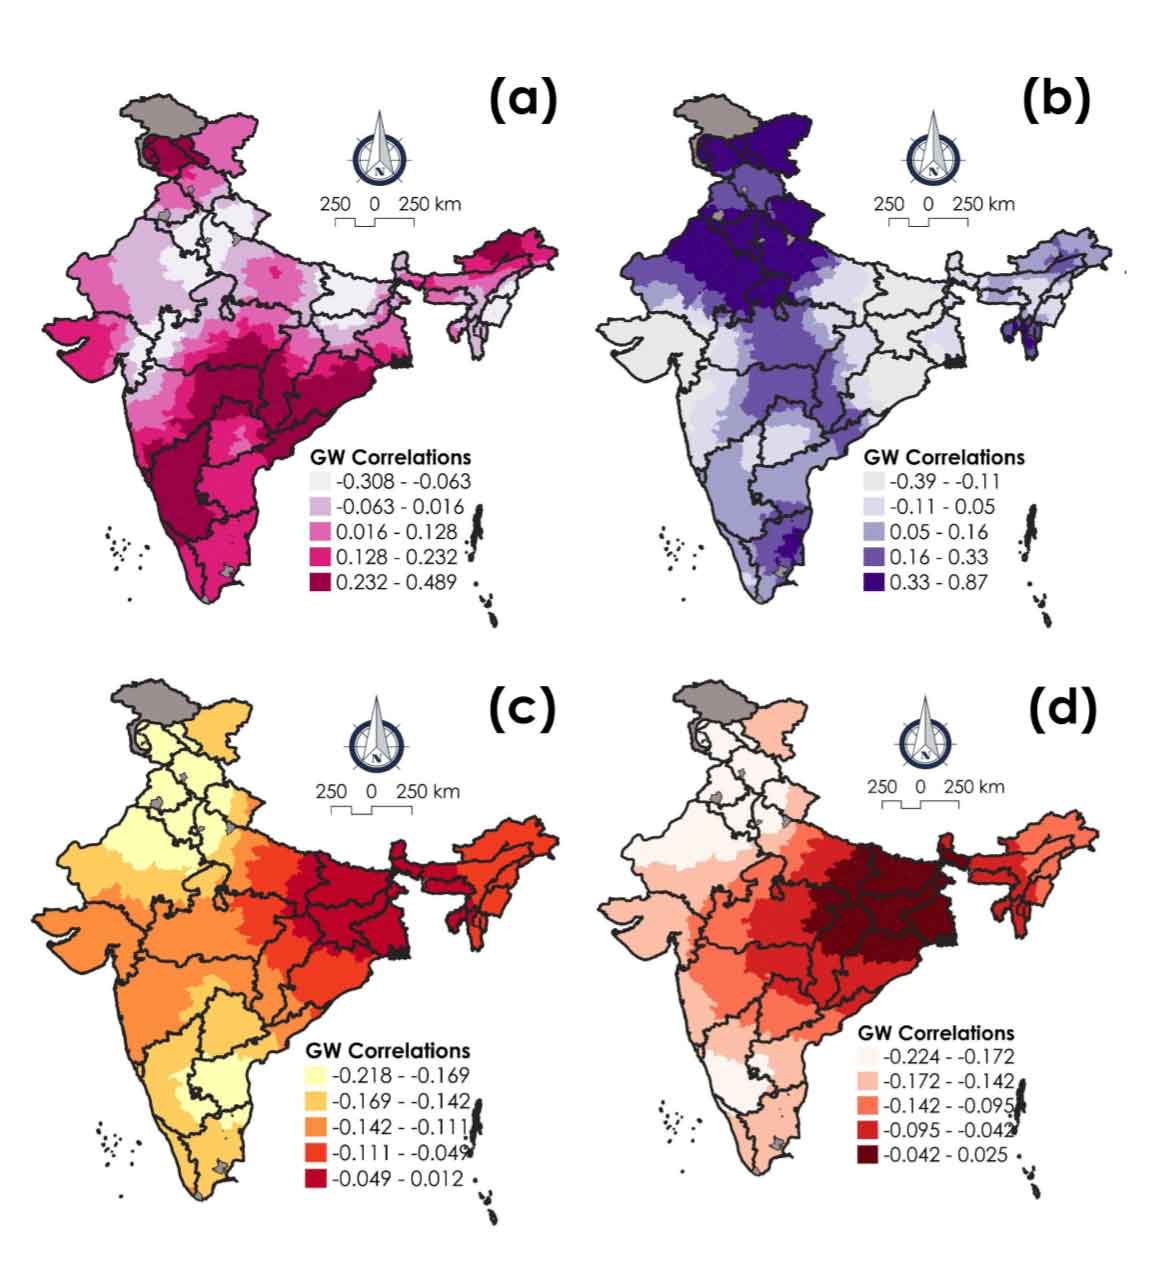
The Geographically Weighted (GW) correlation analysis presented in Figure 9 and Table 2 offers a powerful spatial perspective on how different wealth categories (rich, middle, poor, and BPL) relate to health insurance coverage across India’s ST population. In examining GW correlations between wealth gradients (rich, middle, poor, and BPL) and insurance coverage, we are not merely asking, ‘does wealth lead to coverage?’ Instead, we are exploring ‘where’ wealth matters more or less in securing health protection for tribal populations. Unlike global correlation measures that provide a single average value, GW correlations allow for the estimation of localized relationships, reflecting context-sensitive interdependencies that vary across geographic space.

The map reveals a notable concentration of positive GW correlations in southern and parts of central India, particularly in Telangana, Andhra Pradesh, Maharashtra, and Chhattisgarh. In these regions, there is a strong positive spatial association between wealth and insurance coverage, i.e., ST households classified as wealthy are more likely to be covered by health insurance. This suggests a clear gradient of advantage, where higher socio-economic status confers better access to health protection. This spatial alignment also indicates that in these regions, economic capital translates more directly into health security, reinforcing the structural benefits of relative affluence within ST communities. In contrast, northern regions, particularly Rajasthan, Uttar Pradesh, and parts of Gujarat, display weak or even negative correlations between wealth and insurance coverage. This suggests that economic advantage among STs in these areas does not consistently lead to improved access to health insurance.


Table 3: Key policy recommendations for improving tribal health and insurance access

Policy area

Key recommendations

Supporting rationale/impact

Increased Public Expenditure and Budget Allocation

  1. Substantially increase per capita government expenditure on tribal health, with 70 percent dedicated to primary healthcare. Allocate at least 8.6 percent of the national health budget specifically for tribal health.
  2. Ensure strict adherence to Tribal Sub Plan (TSP) guidelines to prevent resource diversion.

Addresses historical underfunding and ensures dedicated resources commensurate with population share, directly affecting service availability and quality.

Dedicated Policy and Institutional Framework

  1. Establish a National Institute for Tribal Health with field stations.
  2. Frame and implement a specific, culturally sensitive Tribal Health Policy and a coordinated action plan.
  3. Ensure representation of ST experts in policymaking bodies.

Moves beyond generic rural health approaches to tailored, evidence-based interventions that respect unique tribal contexts and needs, fostering ownership and effectiveness.

Infrastructure and Service Delivery Improvements

  1. Address critical shortfalls in Health Sub-Centers, Primary Health Centers, and Community Health Centers.
  2. Recruit and retain adequate numbers of allopathic doctors and specialists in tribal areas.
  3. Leverage information technology (telemedicine, mobile health) to bridge geographical gaps.
  4. Develop behavior change models to encourage utilization of modern medicine alongside traditional practices.

Improves physical access, quality of care, and addresses personnel shortages. Technology can overcome geographical isolation. Culturally sensitive approaches build trust and improve health-seeking behavior.

Financial Protection and Health Insurance

  1. Provide comprehensive health insurance for all tribal people, potentially through dedicated schemes (for instance, Aadivasi Aarogya Bima Yojana, ST health cards).
  2. Ensure government subsidization for vulnerable groups to make insurance truly accessible.

Mitigates the catastrophic financial burden of out-of-pocket expenditures, preventing impoverishment and enabling access to necessary care for the quadruple disease burden.

Data and Research

Prioritize and fast-track the collection and analysis of disaggregated data on tribal health status and underlying social, cultural, and economic determinants.

Fills critical data gaps, allowing for evidence-based policy design, targeted interventions, and effective monitoring of progress for diverse tribal groups.

Holistic Socio-economic Development

Focus on enhancing the overall development of tribal populations to bridge existing inequalities in education, economic attainment, and access to public utilities.

Addresses the root social determinants of health, recognizing that health outcomes are inextricably linked to broader socioeconomic conditions and systemic integration.


The spatial relationship between middle-wealth ST households and health insurance coverage shows considerable regional variability. Positive correlations are observed in northern states like Punjab, Himachal Pradesh, and Uttarakhand, where middle-class ST populations appear to benefit from moderate access to insurance. This may reflect relatively better outreach, higher educational levels, or proactive state health policies in these regions.

However, in much of central and eastern India, including Odisha, West Bengal, Madhya Pradesh, and parts of Chhattisgarh, the correlation either weakens or becomes negative. This suggests that even moderate wealth does not shield ST communities from exclusion, indicating that structural vulnerabilities persist regardless of relative economic positioning. This points to non-economic barriers, such as information asymmetries, lack of documentation, or cultural disconnection from institutional systems, that continue to affect insurance enrollment and utilization.

Perhaps the most alarming pattern revealed by the GW correlation maps concerns the poor and BPL ST households. In central and eastern India, particularly in Jharkhand, Bihar, Odisha, Chhattisgarh, and parts of West Bengal, there are strong negative correlations between poverty levels and health insurance coverage. This means that poorer ST populations in these regions are significantly less likely to be covered by any form of health insurance, despite being the most in need. This spatial mismatch signals a serious policy failure: the very groups that government health insurance schemes are designed to protect are the ones most likely to be left behind.

3.6 Implications for Policy and Interventions

In the study, the identified regional disparities in wealth, poverty, and health insurance coverage among ST households in India at the district level impose the need of inclusive policy interventions at the local scale. The confluence of the severe quadruple disease burden, profound systemic barriers to healthcare access, and critically low health insurance penetration presents an urgent and complex policy challenge for India. The current situation, marked by historical neglect and fragmented approaches, demands a fundamental shift in policy orientation towards tribal health. Addressing these deeply entrenched issues requires a comprehensive, multi-pronged policy approach that transcends traditional health sector boundaries and embraces a true equity focus. The fundamental issue at play is deep-seated health inequity, stemming from centuries of historical and systemic disadvantages. This necessitates a “whole-of-government” or truly multi-sectoral approach where various ministries and departments coordinate their efforts and resources (Table 3).  The findings suggest that, for northern and eastern districts, where economic and healthcare vulnerabilities are most pronounced, there is an urgent need for policies that promote strategic economic development, improve access to quality education and employment opportunities, and enhance social protection measures, including greater penetration of marginalized segments under comprehensive health insurance schemes. Such interventions potentially help revitalization ST households out of poverty and reduce their vulnerability to health and financial shocks.

In contrast, southern and western districts, while relatively better off, still require policies that ensure the sustainability of their socio-economic gains and address any emerging inequalities. Expanding health insurance coverage and improving the quality of healthcare services can further enhance the well-being of ST households in these regions. The analysis reveals significant spatial disparities in health insurance coverage for ST households, with southern and western states generally exhibiting better coverage outcomes than northern, northeastern, and central regions. State-Specific Health Insurance Schemes (SHIS) appear to be particularly effective in expanding coverage for ST households, especially in regions like Himachal Pradesh and Bihar, suggesting that these programs may be more directed to the needs of local populations than national schemes.

Conversely, states like Uttar Pradesh, Bihar, and Madhya Pradesh consistently demonstrate low health insurance coverage across various schemes. These underperforming regions require stronger policy interferences, including targeted awareness campaigns, improved access to government health schemes, and enhanced healthcare infrastructure, to ensure that ST populations receive adequate health insurance coverage. Moreover, given the low coverage rates under schemes like CGHS and ESIS, which cater primarily to the formal sector, there is an urgent need for new insurance programs specifically designed for ST households engaged in informal employment.


4 . CONCLUSION

The healthcare infrastructure in tribal areas is described as ‘grossly underdeveloped’ and even ‘worse than scarcity’. The persistent disparities in health outcomes, despite stated policy objectives, reveal a significant disconnect between aspirational goals and actual resource allocation and strategic prioritization. While there is a declared intent for UHC, the insufficient funding, urban bias in expenditure, and skewed programmatic allocations, such as 90 percent of the National Rural Health Mission (NRHM) budget being spent on family welfare, leaving only 7.7 percent for disease control demonstrate a fragmented approach that fails to address the foundational issues of access and equity. The global stagnation in UHC, despite impressive progress prior to 2015, reinforces that sustained political will and coherent investment strategies are paramount. In India’s context, this lack of policy coherence leads to entrenched disparities, particularly for rural and marginalized populations, indicating that effective policy extends beyond mere aspirational statements to encompass equitable resource deployment and strategic alignment. There is a significant shortfall in facilities compared to national standards, with 27 percent of Health Sub-Centers (HSCs), 40 percent of Primary Health Centers (PHCs), and 31 percent of Community Health Centers (CHCs) lacking adequate provision. This infrastructure deficit is further compounded by a severe deficiency of qualified medical personnel, particularly allopathic doctors (a 33 percent shortfall at PHCs) and specialists (an 84 percent shortfall at CHCs), leading to a critical lack of quality healthcare providers in these regions.

The spatial distribution of health insurance coverage for ST households in India reveals complex and wide-ranging disparities, with southern and western regions outperforming their northern, northeastern, and central counterparts. State-run insurance schemes appear to be more successful in reaching ST populations than national programs, underscoring the need for region-specific interventions to address the existing geographic and social inequalities in health insurance access. Closing these gaps will require concerted efforts at both the state and national levels to enhance the coverage and effectiveness of health insurance schemes for marginalized groups such as ST.

The spatial analysis of ST households in India reveals significant regional disparities in wealth, poverty, and health insurance coverage. Northern and eastern districts are characterized by higher proportions of economically vulnerable households with limited access to healthcare, necessitating targeted policy interventions to address these inequities. In contrast, southern and western districts, with better socio-economic indicators, can serve as models for implementing effective social protection measures. Addressing these regional disparities is crucial for promoting inclusive development and ensuring that the benefits of economic growth and social protection reach all sections of society, particularly the most vulnerable ST populations (Balarajan et al., 2011; Prinja et al., 2012; Maity, 2017).

Consequently, a predominant share of India’s total health expenditure more than two-thirds is borne directly by households through out-of-pocket payments. This substantial OOP burden represents a formidable barrier for the majority of the population, especially the economically disadvantaged, often compelling them to incur debt through loans or liquidate assets to cover medical expenses (Prinja et al., 2012; Bang, 2015). This financial strain pushes them into further economic distress, creating a cycle where illness not only impacts an individual’s health but also devastates their financial stability, thereby perpetuating and deepening poverty. This situation highlights a systemic failure of health financing to adequately protect vulnerable populations, directly undermining the financial protection pillar of Universal Health Coverage. Even where some health services might be physically available, the economic barrier renders them effectively inaccessible or financially ruinous.

While this study provides robust spatial insights into health insurance disparities among ST households in India, a few limitations must be acknowledged. The analysis relies on cross-sectional data, which limits the ability to capture temporal changes or causal relationships over time. Second, the categorization of wealth and insurance schemes is based on available survey classifications and may not fully reflect the nuances of informal coverage or mixed public-private enrolment. Additionally, some spatial patterns may be influenced by district-level heterogeneity in sample sizes, despite the use of EBS to correct for small area statistical noise. Finally, the study could not incorporate health outcomes or morbidity to directly link insurance coverage with health service utilization. Despite these limitations, the findings offer valuable policy-relevant insights into geographic and economic inequalities in health protection among India’s tribal communities.

Conflict of Interest

No potential conflict of interest was reported by the author.

Acknowledgements

This research is based on secondary data from the National Family Health Survey (NFHS), part of the Demographic and Health Surveys (DHS) program. I gratefully acknowledge the Ministry of Health and Family Welfare, Government of India, and the International Institute for Population Sciences (IIPS), Mumbai, for providing access to the dataset. I also extend my sincere thanks to the editor and the two anonymous reviewers for their insightful comments and constructive suggestions, which have greatly improved the clarity and quality of this paper.

Abbreviations

BPL: Below Poverty Line; CGHS: Central Government Health Scheme; CHC: Community Health Center; CHIP: Community Health Insurance Program; DHS: Demographic and Health Surveys; EBS: Empirical Bayes Smoothing; ESDA: Exploratory Spatial Data Analysis; ESIS: Employees’ State Insurance Scheme; GDP: Gross Domestic Product; GW: Geographically Weighted; GWSS: Geographically Weighted Summary Statistics; HSC: Health Sub-Center; IIPS: International Institute for Population Sciences; LISA: Local Indicators of Spatial Association; NFHS-5: National Family Health Survey (5th Round, 2019–21); NGO: Non-Governmental Organization; NRHM: National Rural Health Mission; OBC: Other Backward Classes; OOP: Out-of-Pocket; PHC: Primary Health Center; PMJAY: Pradhan Mantri Jan Arogya Yojana; RSBY: Rashtriya Swasthya Bima Yojana; SDG: Sustainable Development Goal; SHIS: State Health Insurance Schemes; ST: Scheduled Tribe; TSP: Tribal Sub Plan; TV: Television; UHC: Universal Health Coverage; USAID: United States Agency for International Development; WHO: World Health Organization.

References

5.

Bang, A., 2015. Health insurance, assurance, and empowerment in India. The Lancet, 386(10011), 2372-2373. 

29.

Planning Commission (Government of India), 2013. Twelfth five year plan (2012-2017): Faster, More Inclusive and Sustainable Growth. SAGE Publications India Pvt Ltd.

30.

Player, J., 2025. Healthcare access in rural communities in India-Ballard Brief. Ballard Brief. 

35.

Rutstein, S. O. and Johnson, K., 2004. The DHS Wealth Index. DHS Comparative Reports No. 6. Calverton, Maryland: ORC Macro.

36.

Rutstein, S. O., 2015. Steps to constructing the new DHS Wealth Index. Rockville, MD: ICF International, 542.

39.

WHO [World Health Organization], 2025. Universal health coverage (UHC)