9 (2025), 1, 69-90

Journal of Geographical Studies

2582-1083

Trash to Trouble: Revealing the Environmental Costs of Poor Waste Management in Durgapur

MD MAINUL SK 1

1.Department of Geography, Rajendra University, Prajna Vihar, Balangir, Odisha- 767002, India.

Dr.MD MAINUL SK*

*.Department of Geography, Rajendra University, Prajna Vihar, Balangir, Odisha- 767002, India.

Professor.Masood Ahsan Siddiqui 1

1.Department of Geography, Jamia Millia Islamia – A Central University, New Delhi-110025 (India).

09-10-2025
12-05-2025
07-10-2025
16-09-2025

Graphical Abstract

Highlights

  1. Improper solid waste disposal severely contaminates groundwater and surface water.
  2. High concentrations of Cd, Hg, and Pb exceed BIS drinking water limits near dump sites.
  3. Surface water bodies in Durgapur show degraded quality due to leachate and runoff intrusion.
  4. High PM₁₀ and PM₂.₅ levels indicate severe air pollution from open waste burning.
  5. Strong correlation (R² = 0.85–0.88) observed between waste sites and environmental pollution.
  6. Recommends engineered landfills, waste segregation, and GIS-based monitoring for policy action.

Abstract

Rapid industrial, urbanisation and population growth have recently led to increased pressure on the solid waste management infrastructure of Durgapur city, resulting in negative impacts to water and air quality. The study assesses the environmental impacts of insufficient solid waste disposal activities on the groundwater, surface water and air. The results indicate that areas around open dumping sites are severely deteriorated with high groundwater, surface water pollution and increased particulate matter in the air especially in winter. These findings suggest that buffer zones, containment infrastructure and improved air quality monitoring will be needed to regulate air pollution from this sector. The study highlights for the policymakers and urban planners to consider a sustainable waste management framework which would help to ensure the protection of the environment and public health of the Durgapur.

Keywords

spatial analysis , Air Quality Index , Water Quality Index , Surface Water Contamination , Groundwater quality , Environmental Impact Assessment , Solid Waste Management

1 . INTRODUCTION

Rapid urbanization, increasing industrial activities and changing consumption patterns have caused the exponential rise in waste generation in developing countries (Sharma et al., 2021; Sk et al., 2020a). Furthermore, limited infrastructure, financial resources and weak regulatory frameworks have hindered cities worldwide in addressing the ever-increasing waste (Batista et al., 2021; Mainul, 2019; Zohoori and Ghani, 2017). Improper Municipal Solid Waste (MSW) disposal has become an important environmental concern, which affects the quality of air, water and soil, and it also poses significant health hazards to the urban population (Khan et al., 2022; Siddiqui et al., 2021). Such practices, therefore, worsen environmental degradation and impedes the sustainable urban growth (Chakraborty et al., 2025; Sukanya and Tantia, 2023).

India currently generates 62 million tons of MSW each year and of which 75–80% gets collected and 22–28% of it is scientifically treated. The remaining waste is often dumped in open places posing significant environmental risks (TerraGreen, 2022). The projection shows that India will generate 165 million tons of MSW by 2031 and 436 million tons by 2050 (Siddiqua et al., 2022; Iqbal et al., 2020). As a result, mixed waste streams that escalate in their pollution levels make urban industrial cities such as Durgapur more exposed to these risks (Sk et al., 2020b).

Poor waste management leads to one of the world’s most concerning outcomes, namely ground water contamination (Abanyie et al., 2022). Heavy metals and organic matter found in the leachate infiltrate into soil and pollute groundwater, which is of much concern to water quality and health (Toha et al., 2024; Igwegbe et al., 2024). Open dumpsites in Durgapur city is devoid of leachate management systems and the people of the city depend on groundwater for drinking purpose containing high concentration of nitrates, chlorides, heavy metals cadmium and lead (values greater than WHO limits for safe drinking water) 

(Mawari et al., 2022). Similar studies reveal leachate pollutes surface water through rising BOD and COD levels (Karagozoglu and Asar, 2023; Tesseme et al., 2022). Dumping of waste in the city causes solid waste pollution in surface water bodies like the Damodar River which in turn degrades drinking water quality, impacts aquatic life and causes huge ecological damage (Sk, 2024a; Dutta and Chaudhuri, 2024; Seal et al., 2022).

Air pollution is another significant consequence caused by open burning and dumping sites. Pollutants such as SO₂, NOₓ, PM and VOC are released through open burning at waste dumping sites (Sethy et al., 2024; Izah et al., 2024). Hazardous waste burning in industrial cities like Durgapur releases toxic and long-lasting pollutants (POPs) (Singh et al., 2022; Chattopadhyay et al., 2019). Furthermore, methane emissions from the decomposition of waste in landfills also add greenhouse gas leading to global warming (Sk et al., 2025; Kiehbadroudinezhad et al., 2024; Sk, 2024b; Singh et al., 2017).

Though extensive studies have been done to examine the impacts of MSW in Indian cities, limited research work has focused on Durgapur. To fill these gaps, this study examines the environmental impacts of MSW disposal on groundwater, surface water, and air quality. The findings are intended to contribute to development of sustainable waste management strategies in industrial urban regions.


2 . MATERIALS AND METHODS

2.1 Study Area

Durgapur is an important industrial city of East India, situated on the left bank of Damodar River (Figure1). Durgapur is located approximately 170 kilometres (110 miles) northwest of Kolkata (state capital). The city is often called as ‘Steel City’ because of steel productions and heavy industries like Durgapur Steel Plant, Durgapur Projects Ltd. and a number of chemical and engineering plants. However, these industries have been crucial to the city’s fast economic growth, but they have also created environmental problems in the city, especially in the generation and disposal of municipal solid wastes (MSW). Durgapur has been characterized by rapid urbanization and industrial activities which have resulted into huge solid waste generation, and much of these wastes are disposed of in open dumping grounds and unmanaged landfills (Sk, 2023). These practices endanger the quality of local groundwater, surface water and, air in Durgapur and adversely impact the health of its residents and its surrounding ecosystems. The Durgapur Municipal Corporation (DMC), responsible for management of solid waste, has been struggling with limited resources, inadequate waste segregation practice and an improper way to dispose of the waste. The unchecked proliferation of dumping sites without an underpinned well planned waste management infrastructure has left a mark of further environmental pollution.


Figure 1. Study area


2.2 Data

2.2.1 Groundwater Sampling

The study involved groundwater samples collection from different wells to examine the level of leachate contamination in groundwater. These sites (wells) were chosen based on proximity to waste disposal and their use as sources of domestic water. The GPS coordinates for each sampling station are provided in Table 1 and shown in Figure 2. Samples were collected from a depth of 30 cm below the water surface in clean and distilled plastic containers. The natural chemistry of water samples was maintained using different preservation method like pH control, and avoided from sunlight and stored in a cool place. Groundwater samples of selected parameters from 2022 (pre- and post-monsoon) were analysed for physicochemical properties (Table 2) at A.M.U.’s Environmental Engineering Laboratory and WBPCB’s Durgapur Regional Office.


Table 1. Groundwater sampled stations

Stations

Locations

Latitudes

Longitudes

1

Raghunathpur

23°34'55.04"N

87°17'48.66"E

2

Main Gate

23°33'55.73"N

87°15'04.49"E

3

Natun Pally Punjabi Para

23°33'34.09"N

87°15'58.80"E

4

Vidyasagar Primary Vidyalaya

23°33'13.96"N

87°16'56.28"E

5

Jharna Pally

23°31'52.23"N

87°20'27.64"E

6

Bijra

23°34'48.54"N

87°21'02.79"E

7

Ispat Nagari Free Primary Schoo

23°34'03.48"N

87°18'28.14"E

8

Raturiya

23°29'58.78"N

87°16'53.26"E

9

DPL Coke Oven Colony

23°29'55.78"N

87°17'56.54"E

10

Khejurtala

23°29'37.45"N

87°18'13.78"E

11

Near Final Dumping Site

23°32'39.60"N

87°21'31.37"E


Source: Based on field survey by the researcher, 2022.


Figure 2. Location of groundwater sampled stations


2.2.2 Surface Water Sampling

Surface water samples were obtained from 11 ponds situated near dumping sites (pre- and post - monsoon seasons in 2022) to assess contamination from leachate runoff. These water bodies are commonly used for households, agriculture, and industrial activities. The GPS coordinates for each sampling location are 

provided in Table 3 and shown in Figure 3. From each sampling location, water was gathered in 1-liter plastic containers and stored under refrigeration at 4°C. The surface water parameters considered for the analysis of physico-chemical properties are presented in Table 2.


Table 2. Analytical Parameters for Water Quality Assessment

No.

Parameter

Unit

Analytical Method

1

pH

mg/L

Potentiometry (pH meter)

2

Conductivity (Electrical)

μS/cm

Measured using a conductivity meter

3

Total Dissolved Solids (TDS)

mg/L

Gravimetric analysis (dried at 105°C)

4

Total Hardness (TH)

mg/L

EDTA titration method

5

Chemical Oxygen Demand (COD)

mg/L

Dichromate oxidation technique

6

Biochemical Oxygen Demand (BOD₅)

mg/L

Modified Winkler’s Azide procedure

7

Chloride (Cl⁻)

mg/L

Silver nitrate titration

8

Phosphate (PO₄³⁻)

mg/L

Phenol-disulfonic acid technique

9

Sulfate (SO₄²⁻)

mg/L

Turbidimetric analysis

10

Ammoniacal Nitrogen (NH₄⁺-N)

mg/L

Colorimetric determination

11

Arsenic (As)

mg/L

Cold vapor atomic absorption spectrometry

12

Cadmium (Cd)

mg/L

Atomic absorption spectrometry

13

Chromium (Cr)

mg/L

AAS analysis

14

Mercury (Hg)

mg/L

Cold vapor AAS technique

15

Lead (Pb)

mg/L

AAS measurement

Source: Central Pollution Control Board (CPCB), 2007-08


Table 3. Surface water sampled stations

Stations

Locations

Latitudes

longitudes

1

Near Raghunathpur

23°35'09.68"N

87°18'14.64"E

2

Near Kada Road

23°34'03.65"N

87°15'00.15"E

3

Natun Pally Near Punjabi Para

23°33'33.06"N

87°16'12.42"E

4

Near Anandpausi Co-op.

23°32'40.85"N

87°17'08.63"E

5

Near Fuljore

23°32'05.85"N

87°20'33.60"E

6

Bijra Bandh

23°34'41.29"N

87°21'02.84"E

7

Near Ispat Free Primary School

23°33'58.01"N

87°18'29.28"E

8

Near DCL Colony

23°29'53.05"N

87°17'12.98"E

9

Near Ashis Nagar Colony

23°29'37.71"N

87°17'26.08"E

10

Near Khejurtala

23°29'35.65"N

87°18'09.25"E

11

Near Final Dumping site-3

23°32'40.66"N

87°21'32.26"E

Source: Based on the field survey by the researcher, 2022.


2.2.3 Air Quality Monitoring

For air quality analysis, four monitoring sites were selected around the Shankarpur landfill based on the wind direction during both summer and winter seasons to ensure comprehensive coverage. The primary air quality parameters measured included PM10, and PM2.5, SO2, and NOx. Sampling procedures have been followed the standard guidelines established by the WBPCB (Table 4). Detailed information about the sampling locations and wind directions are provided in Table 5 and shown in Figure 4. Laboratory analyses have been conducted to evaluate ambient air quality and identify pollution sources in the vicinity of the landfill.

The collected data was analyzed using statistical methods in SPSS, including Pearson correlation coefficients to identify relationships between pollutants and z-scores to detect outlier contamination levels. Spatial pollutant distribution was visualized using ArcGIS. To evaluate water and air quality, indices such as WQI and AQI were calculated to assess the severity of pollution relative to national standards.

2.2.4 Water Quality Index (WQI) Calculation

To calculate the WQI from sampled data on water quality, three-steps methodology was adopted. Firstly, key parameters were ranked ( \(K^n\)  ) based on their importance in water quality assessment and environment impact. Secondly, the relative weight ( \(W_g\) ) of each parameter was calculated using Equation (1):

\(W_g = \frac{K^n}{\sum_{g=1}^{n} K^n}\)  (1)

Where, \(W_g\)  is relative weight, \(K^n\)  indicates parameter rank and n is the total parameters.

Finally, a quality rating ( \(R_q\) ) was allotted to each parameter by comparing its measured concentration ( \(P_c\) ) against the permissible limit ( \(D_i\) ) specified by the BIS-2012 scaled to 100 using Equation (2):

\(R_q = \frac{P_c}{D_i} \times 100\)  (2)

Now, for computing the WQI, the SI value for each parameter was carried out. This value is then used in the following formula (Equation 3) (Ali and Ahmad, 2020):

\(SIi=W_g×R_q\)

\(WQI= ∑ SIi\)  (3)

Where, SIi is the sub-index of ith parameter, \(R_q\)  indicates

the rating value based on the concentration of the qth parameter, and n is the total number of parameters considered. Water quality is categorized into five classes based on the WQI values ranging from excellent to unsuitable for drinking.


Table 4. Air quality assessment methodology – APN 460 NL and APM 411 TE comparison

Parameter

RSPM (APN 460 NL)

SO₂ and NO₂ (APM 411 TE)

Sampling Device

Respirable Dust Sampler (RDS)

RDS with Impinger attachment

Media Used

Glass Fiber Filter (GF/A)

TCM, NaOH, Distilled Water (DW)

Flow Rate

1.0 - 1.3 m³/min

0.5 L/min

Sampling Frequency

24-hour cycles

8-hour intervals

Analysis Technique

Gravimetric measurement

Spectrophotometric analysis

Sampling Duration

Continuous 24-hour monitoring

-

Sampling Days per Site

Twice per fortnight

Twice per fortnight

Source: West Bengal Pollution Control Board (WBPCB), Durgapur Regional Office (2022).


Figure 3. Stations for surface water sampling


Figure 4. Stations for air quality sampling


Table 5. Air quality sampled stations

Stations

Locations

Longitude

Latitude

Wind direction

1

North of Landfill site1

87°21'34.75"E

23°32'40.50"N

Windward

2

North of landfill site2

87°21'38.55"E

23°32'38.37"N

Windward

3

South of landfill site1

87°21'31.44"E

23°32'29.54"N

Downward

4

South of landfill site2

87°21'35.26"E

23°32'27.90"N

Downward

Source: Based on field survey by the researcher, 2022.


2.2.5 Air Quality Index (AQI) Computation

AQI serves as a daily indicator to measure regional air pollution levels and its potential short-term health consequences. This index represents how the public understand about local air conditions may affect their well-being. In this study, AQI was calculated based on the methodology outlined by Kaushik et al., (2006). First of all, the air quality rating of each pollutant is calculated by the following formula (Equation 4):

\(R = 100 \frac{\cdot O_v}{S_v} \)  (4)

Where, \(R\)  = quality rating, \(Q_v\)  = observed pollutant concentration and \(S_v\)  = the corresponding standard value from NAAQS.

If total ‘n’ numbers of pollutants are considered for air quality measuring, the geometric mean of these ‘n’ number of quality rating is calculated as (Equation 5):

\(\text{GEO}_{\text{MEN}} = \text{anti}_{\text{log}} \left( \frac{\log x + \log y + \log z + \cdots + \log i}{N} \right)\) (5)

Where \(\text{GEO}_{\text{MEN}}\)  is the geometric mean, while x, y, z, and i represent different values of air quality rating, and \(N\)  is the number of values of air quality rating.

An AQI value between 51–100 indicates moderate air quality, which, while generally acceptable, may pose mild health risks particularly for individuals sensitive to air pollution, who could experience respiratory discomfort.


Figure 5: Groundwater quality index


3 . RESULTS

3.1 Improper Solid Waste Disposal and Groundwater Contamination

3.1.1 Assessment of Groundwater Quality

The groundwater quality reveals significant variations in chemical parameters, with values near or exceeding BIS standards, particularly in areas close to dumping sites (Table 6). The mean values of each parameter of groundwater for pre-monsoon and post-monsoon seasons are shown in Table 6. The measured values of each parameter have been compared with the standards given by the BIS (IS 10500:2012) (Table 7). It has been found that the pH values at most locations are within BIS’s permissible range, however, Raghunathpur (8.7 mg/lit), near the final dump site (8.8 mg/lit), and Main gate (8.5 mg/lit) show slightly higher levels. The electrical conductivity (EC) ranges between 1335 μS/cm and 1808 μS/cm, with higher values near the dump site. Similarly, Total Dissolved Solids (TDS) concentrations, while within BIS’s upper permissible limit of 2000 mg/l, exceed the acceptable threshold of 500 mg/l, particularly near dumping areas. Total hardness levels across most locations surpass the acceptable BIS limit of 200 mg/l, reaching as high as 735 mg/l near waste areas. However, they remain under the permissible upper limit of 600 mg/l, with lower values observed further from dumping sites. Chloride concentrations are within BIS limits but range from 365.78 mg/l to 552.4 mg/l, with higher values closer to the dumpsite. Sulphate levels, on the other hand, are within safe limits at all locations, ranging from 17.5 mg/l to 28.8 mg/l.

COD values across all sampled locations range between 15 mg/l and 26 mg/l, indicating acceptable but slightly higher levels near the final dump site, likely due to organic waste. BOD levels, with a range of 0.16 mg/l to 0.32 mg/l, are within BIS standards but display similar trends of higher concentrations in proximity to waste areas. Phosphate concentrations, although minimal (0.14 mg/l to 0.27 mg/l), remain within safe drinking standards but are slightly higher near the dump. Ammoniacal nitrogen values range between 0.12 mg/l and 0.26 mg/l with the highest values found near the dump site. Arsenic concentrations (0.007 mg/l to 0.019 mg/l) remain under BIS’s permissible limit of 0.05 mg/l but are higher near the waste areas. Chromium levels vary between 0.012 mg/l and 0.025 mg/l, below the permissible limit of 0.05 mg/l, yet elevated values near dumping areas. Heavy metal contamination is most concerning, with cadmium levels ranging from 0.05 mg/l to 0.15 mg/l, significantly exceeding the BIS acceptable limit of 0.003 mg/l at all locations, especially near waste disposal sites. Mercury concentrations between 0.13 mg/l and 0.26 mg/l also exceed the BIS limit of 0.001 mg/l particularly around the dump. Lead levels (0.031 mg/l to 0.057 mg/l) likewise surpass the acceptable BIS limit of 0.01 mg/l, with the highest concentrations near the final dumping site.


Figure 6: Surface water quality index


Table 6. Measured values of physicochemical parameters (groundwater)

Sampled stations

pH

EC

TDS

TH

COD

BOD5

Cl-

PO43−

SO42−

NH4+-N

As

Cd

Cr

Hg

Pb

Raghunathpur

8.7

1762

1345

720

24

0.3

548.5

0.26

28.3

0.24

0.017

0.14

0.023

0.25

0.056

Main gate

8.5

1705

1315

690

22

0.28

522.45

0.24

27.5

0.22

0.015

0.12

0.021

0.23

0.053

Natun pally Punjabi para

8.3

1658

1305

685

21

0.26

522.25

0.22

26.2

0.2

0.014

0.11

0.02

0.22

0.052

Vidyasagar Primary Vidyalaya

8.1

1635

1265

660

20

0.25

515.75

0.2

25.8

0.19

0.012

0.1

0.018

0.19

0.047

Jharna pally

7.9

1575

1225

625

19

0.24

465.8

0.19

23.8

0.17

0.011

0.09

0.017

0.18

0.044

Bijra

7.5

1505

1180

600

18

0.22

421.3

0.17

22.8

0.15

0.008

0.07

0.014

0.16

0.038

Ispat nagari free Primary school

7.1

1335

1105

540

16

0.16

365.78

0.14

18.9

0.12

0.007

0.05

0.012

0.14

0.032

Raturiya

7.5

1545

1165

585

18

0.2

412.65

0.17

21.5

0.15

0.009

0.09

0.016

0.16

0.04

DPL coke oven Colony

7.1

1405

1130

545

15

0.19

375.44

0.15

17.5

0.13

0.008

0.06

0.015

0.13

0.031

Khejurtala

7.3

1445

1165

550

17

0.2

388.66

0.18

19.7

0.14

0.009

0.07

0.014

0.14

0.037

Near final Dumping site

8.8

1808

1400

735

26

0.32

552.4

0.27

28.8

0.26

0.019

0.15

0.025

0.26

0.057

Source: Based on field survey, the samples tested by the Environmental Laboratory of A.M.U., Aligarh, 2022.

Note:      1. EC- Electrical Conductivity, TDS- Total Dissolved Solid, TH-Total Hardness, COD- Chemical Oxygen Demand, BOD5- Biochemical Oxygen Demand, Cl-Chloride, PO43− -Phosphate, (SO42−) - Sulphate, NH4+-N-Ammoniacal nitrogen, As- Arsenic, Cd- Cadmium, Cr- Chromium, Hg- Mercury, Pb- Lead. 2. (All units are in mg/l except EC- μS/cm.)


Table 7. Drinking Water Quality Standards as per IS 10500:2012 (India)

Parameter

Acceptable Limit

Maximum Permissible Limit

Test Method Reference

Potential Health/Usage Effects Beyond Limits

pH

6.5–8.5

No relaxation

IS 3025 (Part 11)

Can harm mucous membranes and water supply systems

Turbidity (NTU)

1

5

IS 3025 (Part 10)

Reduced consumer acceptance above 5 NTU

Odour

Agreeable

Agreeable

IS 3025 (Part 5)

Total Dissolved Solids (TDS)

500

2,000

IS 3025 (Part 16)

May cause gastrointestinal irritation

Electrical Conductivity

Total Hardness (TH)

200

600

IS 3025 (Part 21)

Negative impact on domestic use

Chloride (Cl⁻)

250

1,000

IS 3025 (Part 32)

Affects taste, causes corrosion

Sulphate (SO₄²⁻)

200

400

IS 3025 (Part 24)

Gastrointestinal issues (with Mg/Na presence)

Ammoniacal Nitrogen (NH₄⁺-N)

0.5

No relaxation

IS 10500

Iron (Fe)

0.3

No relaxation

IS 3025 (Part 53)

Alters taste/appearance; impacts domestic use

Manganese (Mn)

0.1

0.3

IS 3025 (Part 59)

Affects taste/appearance; domestic issues

Zinc (Zn)

5

15

IS 3025 (Part 49)

Causes astringent taste and water opalescence

Fluoride (F⁻)

1

1.5

IS 3025 (Part 60)

Excess leads to fluorosis

Sulphide (H₂S)

0.05

No relaxation

IS 3025 (Part 29)

Arsenic (As)

0.01

0.05

IS 3025 (Part 37)

Toxic at higher concentrations

Cadmium (Cd)

0.003

No relaxation

IS 3025 (Part 41)

Toxic

Mercury (Hg)

0.001

IS 3025 (Part 48)

Toxic

Lead (Pb)

0.01

IS 3025 (Part 47)

Toxic

Chromium (Cr)

0.05

IS 3025 (Part 52)

Carcinogenic potential

Nickel (Ni)

0.02

IS 3025 (Part 54)

Cyanide (CN⁻)

0.05

IS 3025 (Part 27)

Toxic

Chloroform

0.2

APHA 6232

Source: Researcher’s compilation based on IS 10500:2012 standards.

Note: All units are in mg/l, max. - Not available


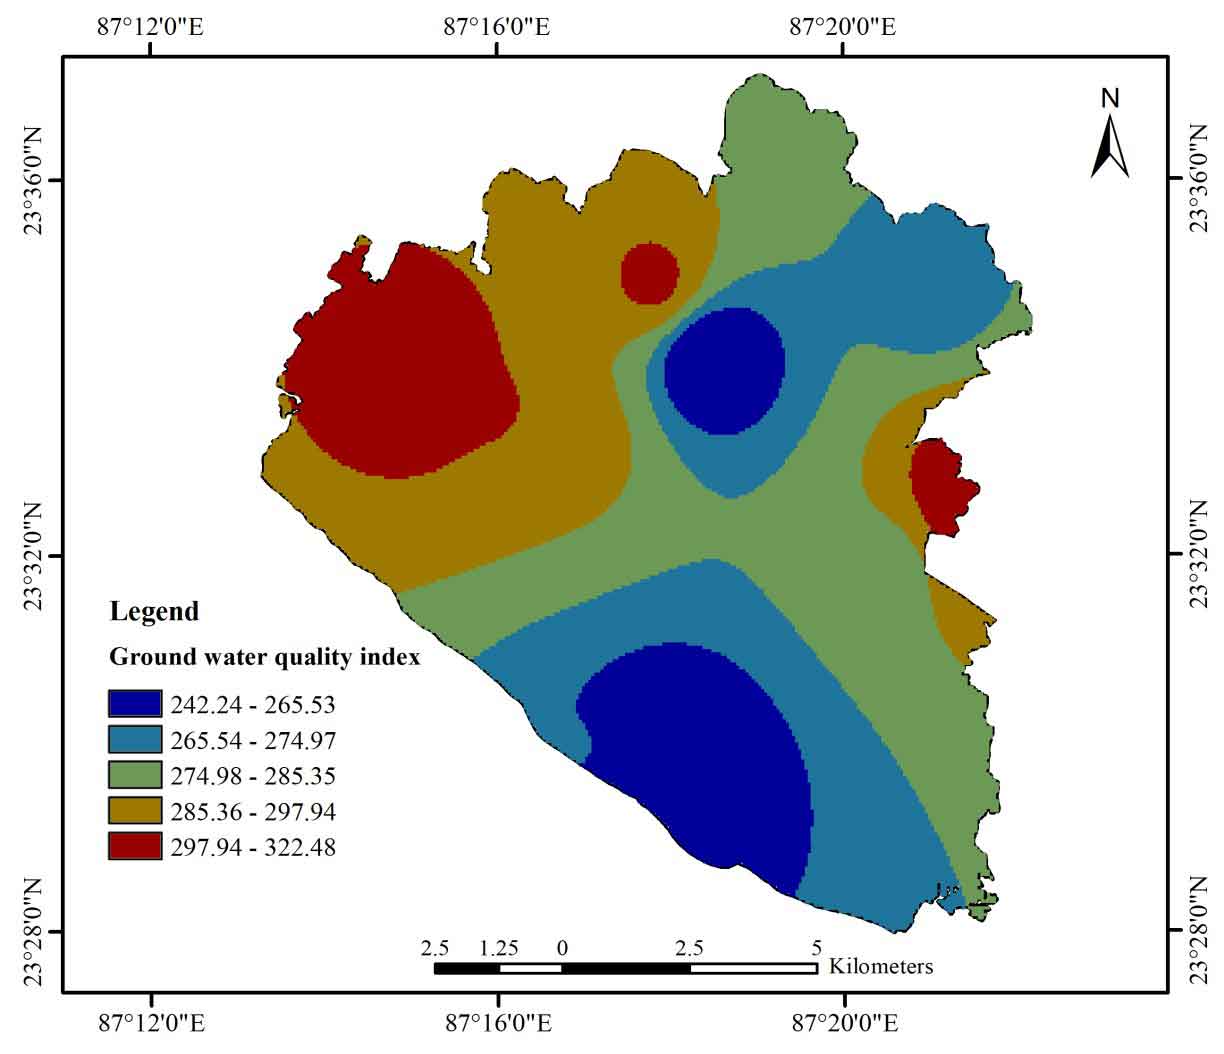
3.1.2 Assessment of water quality index

In this study, groundwater quality index has been calculated as per the standard value of BIS, 2012. The status of groundwater and classification of water quality in WQI has been presented in Table 8 and Table 9. Table 8 shows that the quality of groundwater in 4 sampled stations out of total 11 stations named Raghunathpur, Main Gate, Natun Pally Punjabi Para and near-final dumping site exceeds the value of more than 294 which is unfit for drinking purpose. The water qualities in these places have been highly deteriorated due to heavy absorption of pollutants discharged from nearby solid waste dumping sites. There is an immediate need for water treatment for these places before uses.

The status of water quality in 1 sampled station Vidyasagar Primary Vidyalaya is very poor, which is considered only for restricted use in irrigation. The people in Bijra predominantly use the well water for drinking, bathing and other domestic activities. The quality of water in this place has been highly contaminated with heavy pollutants and has been considered as poor status as per the WQI (Figure 5).

The status of groundwater quality of only two sampled stations named Ispat Nagari Free Primary school and DPL Coke Oven Colony range from 241 to 255 have been considered as good which is fit for domestic, irrigation and industrial activities but not for drinking (Table 9). There is not a single groundwater sampled station which is suitable for drinking purposes in the study area, but majority of the people in ward numbers 1 and 2 uses well water for drinking purposes.

3.2 Improper Solid Waste Disposal and Surface Water Contamination

3.2.1 Analysis of surface water quality

The physico-chemical parameters of the analyzed surface water samples of Durgapur city, including statistical mean values of pre-monsoon and post-monsoon seasons, are presented in Table 10. Fifteen parameters of surface water have been selected for the analysis of the quality of sampled surface water bodies in the study area (Table 11). The measured values of each parameter of water have been compared with the standards given by BIS-2012 (Table 10).

The surface water quality analysis of the sampled locations reveals notable variations across key chemical parameters, with certain values approaching or exceeding BIS standards, particularly near waste dumping sites. Most sampled sites exhibit pH levels within the BIS range (6.5-8.5); however, one site near the final dump shows a higher pH of 8.7, indicating minor alkalinity likely due to waste leaching. The EC values range from 1710 to 2110 μS/cm, with maximum concentration found near the final dumping site, suggesting increased dissolved ions from contaminants. Total Dissolved Solids (TDS) levels remain within BIS’s permissible range of 500-2000 mg/l, though highest near the dumping area, indicating salinity and potential leachate influence.


Table 8. Ground water quality index

Stations


GWQI

Raghunathpur


313.16

Main gate


303.43

Natun Pally Punjabi Para


299.25

Vidyasagar Primary Vidyalaya


292.04

Jharna Pally


279.43

Bijra


266.69

Ispat Nagari Free Primary School


242.20

Raturiya


266.10

DPL Coke Oven Colony


249.52

Khejurtala


256.59

Near Final Dumping site


322.49

Source: Calculated by the researcher, 2022.


Table 9. Classification of Groundwater Quality Based on WQI

No.

Water Quality Index (WQI) Range

Quality Status

Recommended Applications

1

Below 241

Excellent

Potable use, agricultural, and industrial

2

241 – 255

Good

Household, farming, and industrial purposes

3

255 – 268

Moderate

Suitable for irrigation and industrial use

4

268 – 281

Poor

Limited to irrigation only

5

281 – 294

Very Poor

Highly restricted irrigation use

6

Above 294

Unsuitable

Requires treatment before any application

Source: Research findings, 2022.


Table 10. Measured values of physicochemical parameters (surface water)

Name

pH

EC

TDS

TH

COD

BOD5

Cl-

P043-

S042-

NH4+-N

As

Cd

Cr

Hg

Pb

Near Raghunathpur

8.2

1964

1568

744

91.34

27.22

291.65

1.313

167.25

0.605

0.0066

0.07

0.067

0.083

0.117

Near Kada Road

8.4

1922

1504

703

87.32

26.54

284.55

1.222

162.3

0.588

0.0064

0.068

0.064

0.081

0.112

Natun Pally Near Punjabi Para

8.3

1932

1498

707

81.63

25.37

257.63

0.988

156.3

0.567

0.0057

0.062

0.062

0.075

0.101

Near Anandpausi Co-op.

8.2

1928

1478

702

78.35

25.05

255.65

0.967

145.38

0.532

0.0049

0.054

0.053

0.072

0.096

Near Fuljore

8

1845

1421

677

75.43

24.38

252.45

0.878

134.5

0.511

0.0045

0.043

0.047

0.067

0.092

Bijra Bandh

6.8

1825

1400

622

74.95

21.85

248.54

0.827

128.1

0.412

0.0039

0.041

0.043

0.061

0.09

Near Ispat Free Primary School

6.7

1710

1255

525

63.66

18.32

213.16

0.678

109.5

0.363

0.0028

0.028

0.032

0.042

0.076

Near DCL Colony

7

1805

1388

605

68.73

19.23

244.45

0.766

129.2

0.405

0.0033

0.033

0.038

0.056

0.082

Near Ashis Nagar Colony

6.1

1605

1216

522

62.57

18.55

221.69

0.723

113.4

0.352

0.0024

0.027

0.032

0.041

0.068

Near Khejurtala

6.6

1715

1245

535

65.64

19.12

243.44

0.812

119.5

0.344

0.0028

0.035

0.033

0.036

0.077

Near Final Dumping site

8.7

2110

1670

760

93.3

27.92

318.23

1.341

185.4

0.621

0.007

0.071

0.068

0.086

0.121

Source: Based on field survey, the samples tested by the Environmental Laboratory of A.M.U., Aligarh, 2022.

Note:      All units are in mg/l, max. except EC–μS/cm.


Table 11. Standards for Surface Water Quality (BIS-2012)

No.

Parameter

Inland Surface Water

Public Sewers

Irrigation Use

1

pH Level

5.5 – 9.0

5.5 – 9.0

5.5 – 9.0

2

Total Suspended Solids (TSS, mg/L)

100

600

200

3

Temperature (°C)

≤ 5°C above ambient

Not specified

Not specified

4

Residual Chlorine (mg/L)

1

Not specified

Not specified

5

Ammonical Nitrogen (as N, mg/L)

50

50

Not specified

6

Total Nitrogen (as N, mg/L)

100

Not specified

Not specified

7

Free Ammonia (as NH₃, mg/L)

5

Not specified

Not specified

8

BOD₅ (mg/L)

30

350

100

9

COD (mg/L)

250

Not specified

Not specified

10

Arsenic (as As, mg/L)

0.2

0.2

0.2

11

Mercury (as Hg, mg/L)

0.01

0.01

Not specified

12

Lead (as Pb, mg/L)

0.1

0.1

Not specified

13

Cadmium (as Cd, mg/L)

2

1

Not specified

14

Total Chromium (as Cr, mg/L)

2

2

Not specified

15

Copper (as Cu, mg/L)

3

3

Not specified

16

Zinc (as Zn, mg/L)

5

15

Not specified

17

Fluoride (as F, mg/L)

2

15

Not specified

18

Sulphide (as S, mg/L)

2

Not specified

Not specified

19

Iron (as Fe, mg/L)

3

3

3

Source: Prepared by the researcher based on IS: 2012. 


Total hardness values range from 522 to 760 mg/l, exceeding the BIS acceptable limit of 200 mg/l but falling within the upper permissible limit of 600 mg/l in most locations, with hardness generally higher near the final dumping site. COD and BOD levels remain within permissible ranges, yet display slightly elevated concentrations near the final dumping site, hinting at organic contamination. Chloride levels across sampled sites are within BIS standards, though readings are highest near the dumpsite, highlighting potential contamination risks. Trace elements like arsenic, cadmium, and chromium are detected in concentrations below BIS thresholds, but mercury levels exceed safe limits across several sites, particularly near the final dumping site, suggesting bioaccumulative pollution from solid waste. Maximum lead concentrations are also noted at sites near the final dumping area, posing health risks, particularly for sensitive groups. In summary, the analysis points to significant pollutant influx in surface water near waste areas, requiring monitoring to mitigate health and ecological impacts.

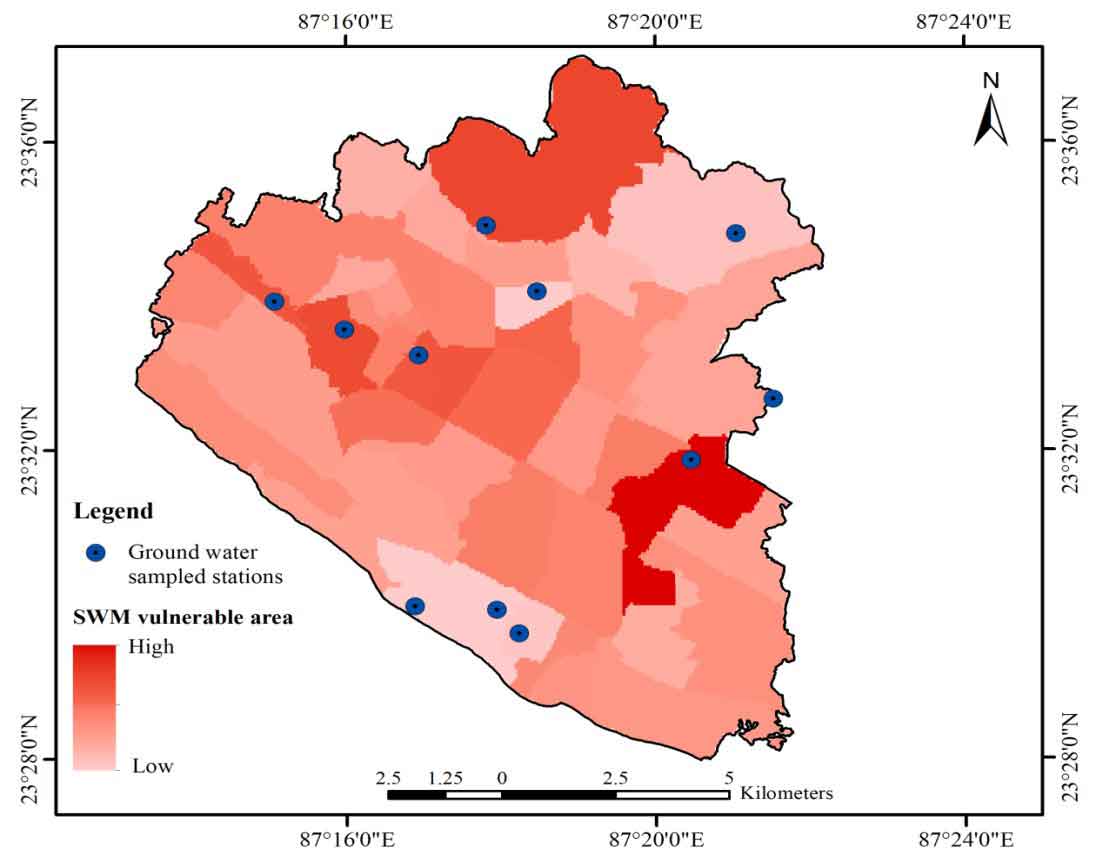
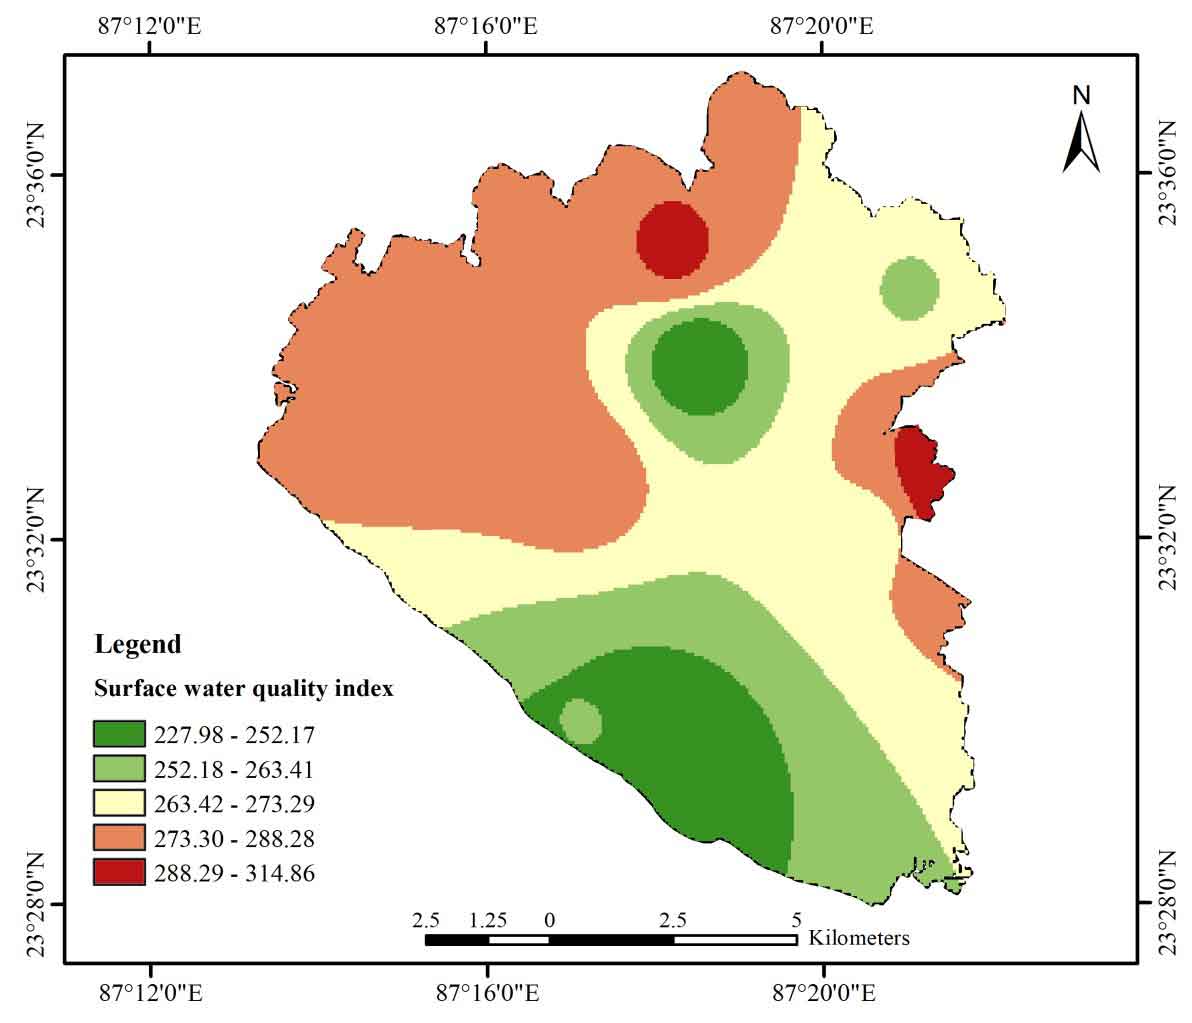
3.2.2 Assessment of water quality index

Surface water quality index of the sampled stations was calculated considering the standard value of BIS, 2012. The status of surface water quality and classification of water quality in WQI are shown in Table 12 and 13, respectively. Considering the status of surface water quality of the sampled stations, SWQI was classified into six classes (Table 13). Table 12 shows that the quality of surface water in 2 sampled stations Raghunathpur, and Natun Pally Punjabi Para exceeds the value of more than 287 which has been considered as unsafe for any uses. Three stations viz. near Kada Road, Natun Pally near Punjabi Para and near Anandpausi Co-op. come under very poor status while another 3 sampled stations, i.e., near Fuljhore, Bijra Bandh and DCL colony ranging WQI from 257 to 272 come under the poor quality of water. The surface water quality in sampled stations near Ispat Free Primary School, Ashis Nagar Colony, and Khejurtala are considered as good quality of water. The water quality in these sampled stations is not much contaminated due to its distant location from open dumping sites (Figure 4).

3.3 Improper Solid Waste Disposal and Air Pollution

3.3.1 Analysis of ambient air quality

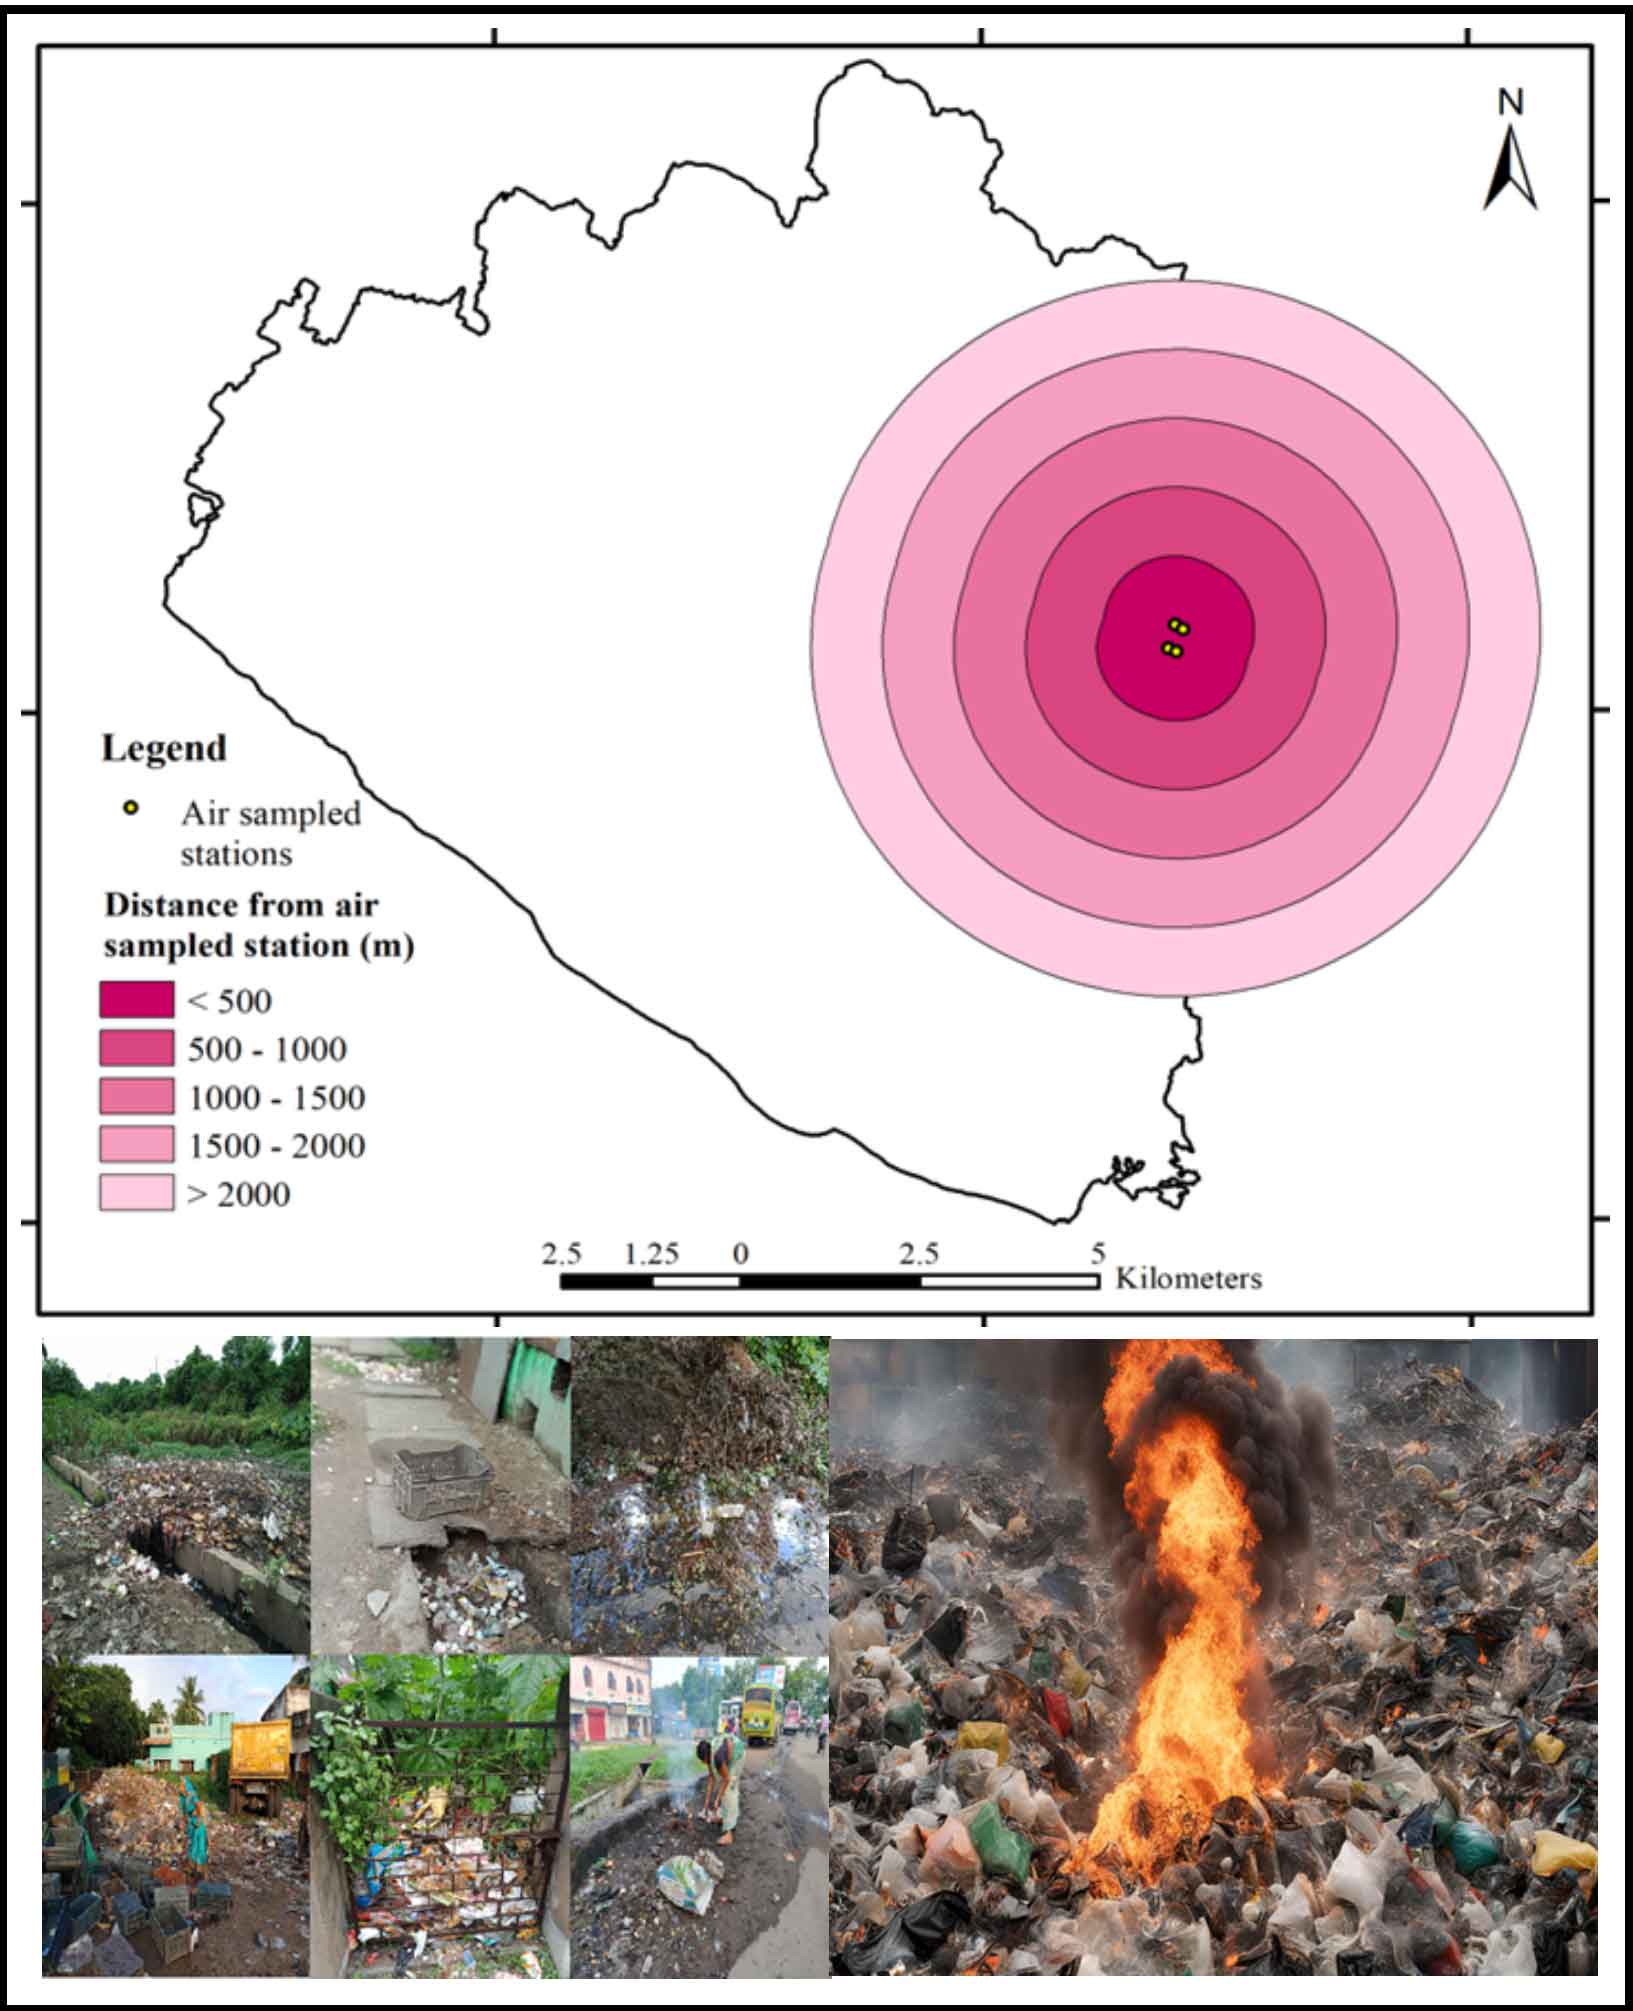
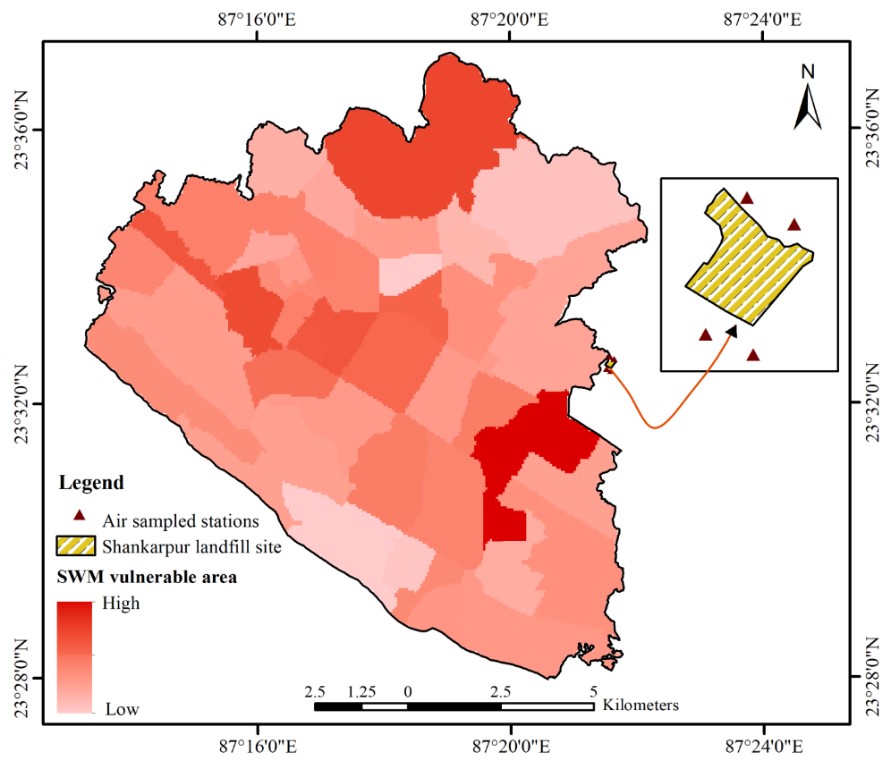
The status of ambient air quality of the sampled stations located in the vicinity of open dumping sites was analyzed for summer and winter seasons. The mean values of PM10, PM2.5, SO2, and NOx in Table 14 and 15, respectively. The stations for ambient air quality monitoring were fixed considering the direction of wind flow in the area. The general wind direction during summer seasons is from south to north and from north to south during the winter season. Considering the locations of solid waste dumping site, two sampled stations were selected in the windward side and two stations on leeward side of the wind flow. The monitoring of AAQ was carried out as per the standard procedure. The details of the methodology for assessing air quality are presented in Table 4. The ambient air quality status around the landfill site was analyzed as per the Standards of Ambient Quality for landfills sites as suggested by MSW Rules 2016, MoEF, GoI (Table 16).

Tables 14 and 15 present the concentration levels of SO₂, NOₓ, PM₁₀, and PM₂.₅ across four stations near the dumping site during both summer and winter. It is found that SO₂ concentrations range from 15.1 to 18.4 μg/m³ in summer and 19.5 to 23.5 μg/m³ in winter, with the highest levels observed on the windward side of the sites. This variation is largely due to the combustion of sulfur-containing wastes like plastics and rubber. NOₓ concentrations vary from 15.2 to 19.2 μg/m³ in summer and 26.1 to 29.1 μg/m³ in winter. Both SO₂ and NOₓ levels remain within limits as specified by MSW Rules 2000, MoEF, Government of India. 


Table 12. Sampled stations and surface water quality index

Stations

SWQI

Near Raghunathpur

295.46

Near Kada Road

285.10

Natun Pally Near Punjabi Para

282.47

Near Anandpausi Co-op.

285.10

Near Fuljore

267.97

Bijra Bandh

261.84

Near Ispat Free Primary School

235.18

Near DCL Colony

258.51

Near Ashis Nagar Colony

227.89

Near Khejurtala

237.99

Near Final Dumping Site

314.88

Source: Calculated by the researcher, 2022.


Table 13: Surface water quality index and status

Sl. No.

WQI

Status

1

< 227

Excellent

2

227 – 242

Good

3

242 – 257

Fair

4

257 – 272

Poor

5

272 – 287

Very Poor

6

> 287

Unsafe for using

Source: Calculated by the researcher, 2022.


Figure 7. Buffer from the location of dustbins


Table 14. Air quality status of sampled stations (summer season)

Stations

Locations

Longitude

Latitude

Wind direction

PM10

PM2.5

SO2

NOx

1

North of Landfill site1

87°21'34.75"E

23°32'40.50"N

Windward

233

84

18.2

19.2

2

North of landfill site2

87°21'38.55"E

23°32'38.37"N

Windward

230

81

18.4

19

3

South of landfill site1

87°21'31.44"E

23°32'29.54"N

Downward

210

57

15.5

15.2

4

South of landfill site2

87°21'35.26"E

23°32'27.90"N

Downward

208

61

15.1

15.5

Source: Calculation is based on the field survey and laboratory experiment, 2022.

Note: 1. SO2- Sulphur dioxide, NOx- Nitrogen dioxide, 2. all units are in μg/m3


Table 15. Air quality status of sampled stations (winter season)

Stations

Locations

Longitude

Latitude

Wind direction

PM10

PM2.5

SO2

NOx

1

North of Landfill site1

87°21'34.75"E

23°32'40.50"N

Downward

245

165

19.8

26.1

2

North of landfill site2

87°21'38.55"E

23°32'38.37"N

Downward

246

168

19.5

26.3

3

South of landfill site1

87°21'31.44"E

23°32'29.54"N

Windward

267

190

23.5

29.1

4

South of landfill site2

87°21'35.26"E

23°32'27.90"N

Windward

265

195

23.3

28.5

Source: Calculation is based on the field survey and laboratory experiment, 2022.

Note: 1. SO2- Sulphur dioxide, NOx- Nitrogen dioxide, 2. all units are in μg/m3


Table 16. Permissible Ambient Air Quality Levels for Landfill Sites

No.

Parameter

Allowable Limits

1

Sulphur dioxide (SO₂)

50 μg/m³ (Yearly average*), 80 μg/m³ (24-hour max**)

2

Nitrogen dioxide (NO₂)

40 μg/m³ (Yearly average*), 80 μg/m³ (24-hour max**)

3

Particulate matter (PM₁₀)

60 μg/m³ (Yearly average*), 100 μg/m³ (24-hour max**)

4

Particulate matter (PM₂.₅)

40 μg/m³ (Yearly average*), 60 μg/m³ (24-hour max**)

5

Carbon monoxide (CO)

1-hour max: 4 mg/m³, 8-hour max: 2 mg/m³

6

Ammonia (NH₃)

100 μg/m³ (Yearly average*), 400 μg/m³ (24-hour max**)

7

Benzo(a)pyrene (BaP) (particulate)

1 ng/m³ (Yearly average*)

Source: Developed by the author using guidelines from the Ambient Air Quality Standards for Landfills under the MSW Rules 2016, Ministry of Environment, Forest and Climate Change, Government of India. Note: The annual average values (*) are based on the arithmetic mean of at least 104 measurements taken twice per week over a year, while the 24-hour, 8-hour, or 1-hour maximum limits (**) must be met 98% of the time annually, allowing exceedances up to 2% of the time, provided they do not occur on two consecutive monitoring days.


Table 17. Ambient air quality status

Locations

Summer season

Winter season

PM10

PM2.5

SO2

NOx

PM10

PM2.5

SO2

NOx

North of Landfill site1

233.00

140.00

22.75

24.00

245.00

275.00

24.75

32.63

North of landfill site2

230.00

135.00

23.00

23.75

246.00

280.00

24.38

32.88

South of landfill site1

210.00

95.00

19.38

19.00

267.00

316.67

29.38

36.38

South of landfill site2

208.00

101.67

18.88

19.38

265.00

325.00

29.13

35.63

Source: Calculated by the researcher, 2022.


Figure 8. Buffer from the location of open dumpsite


Figure 9. Buffer from densely populated areas


For particulate matter, PM₁₀ concentrations range from 208 to 233 μg/m³ in summer and 245 to 267 μg/m³ in winter, while PM₂.₅ levels are in between 57 and 84 μg/m³ in summer and 165 to 195 μg/m³ in winter. Higher concentrations in winter are attributed to poor air circulation. Although PM₁₀ exceeds regulatory limits at all stations, PM₂.₅ levels exceed standards at all stations except the southern station, downwind of the landfill.

3.3.2 Assessment of Air Quality Index (AQI)

The AQI was calculated following the method by Kaushik et al. (2006). The status of air quality index of the sampled stations for both summer and winter seasons is shown in Table 17. Table 17 shows that the values of SO2 and NOx in all the four sites remained within the acceptable limits. During the winter season, the values of SO2 and NOx were recorded higher than the summer season. But, the level of concentration of PM10and PM2.5 in all four stations during both summer and winter seasons were found to be exceeding the acceptable limits. The highest concentration of PM10 and PM2.5 is found in the south of landfill site-2 (windward) during the winter season which may affect the people living nearby the dumping site.

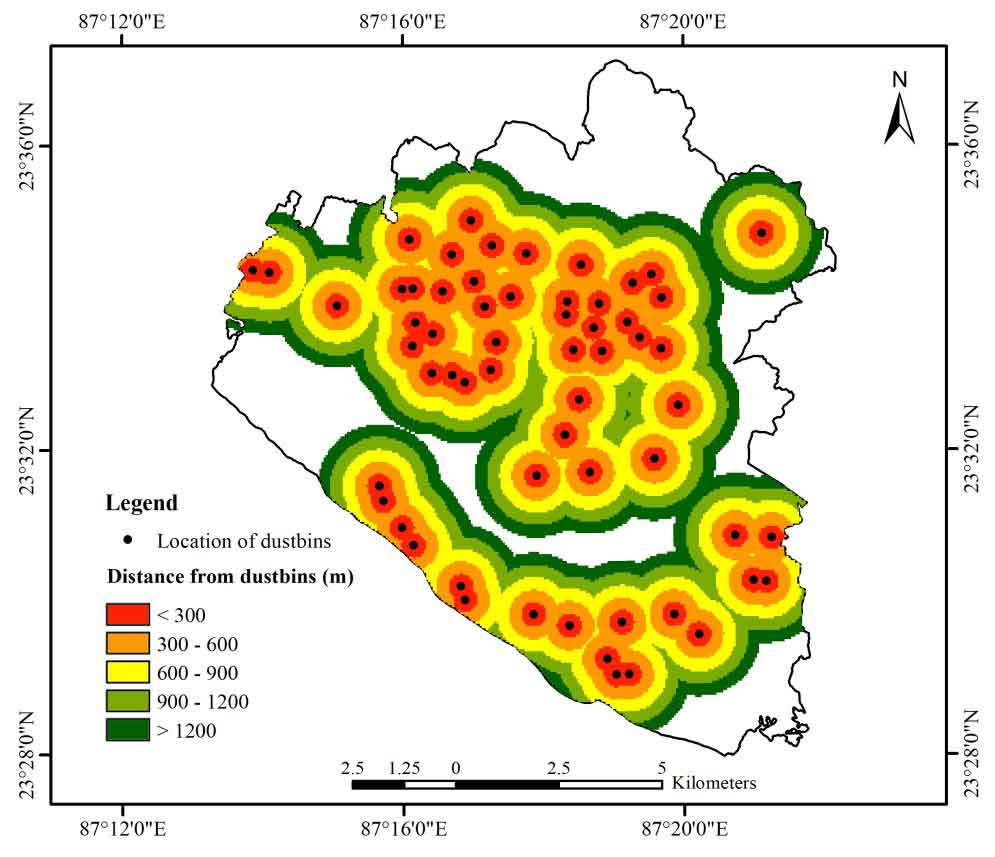
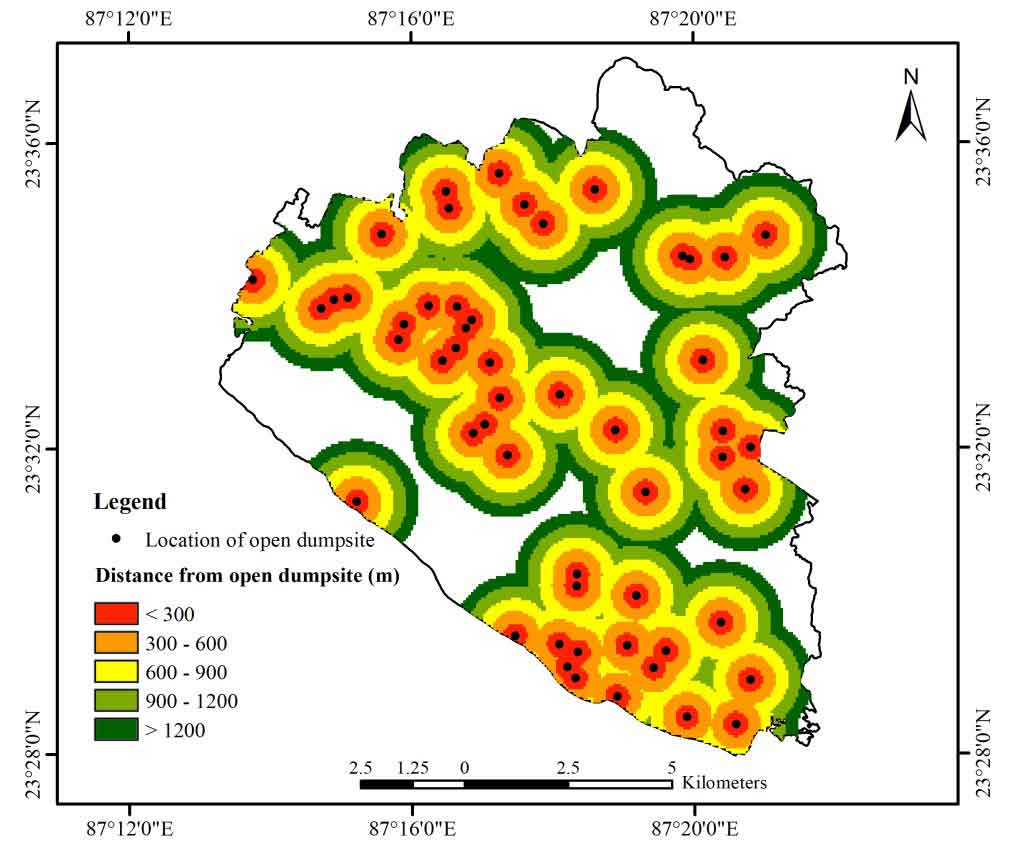
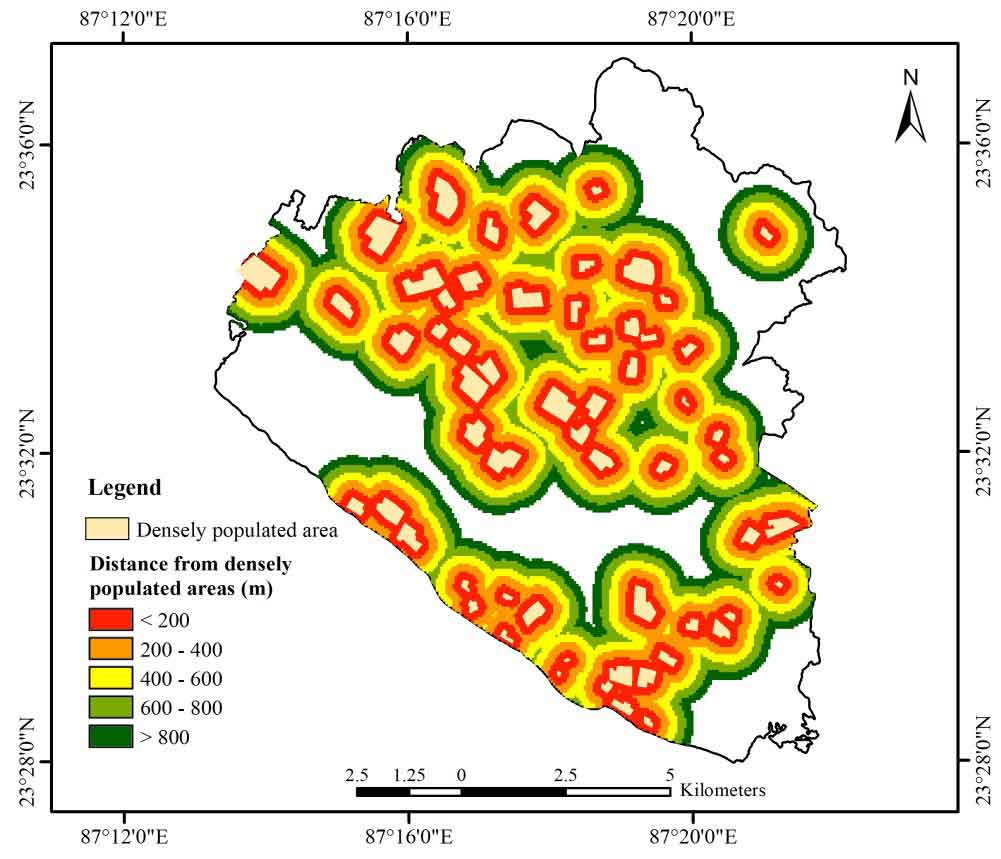
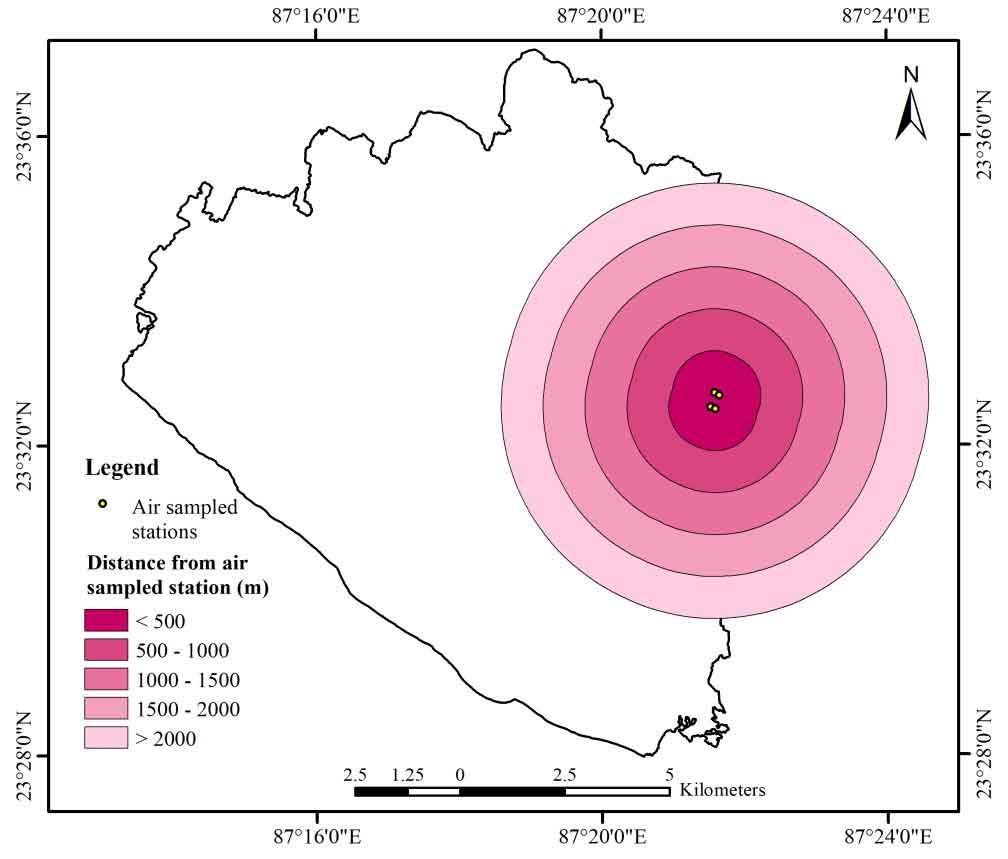
To further assess environmental impacts, spatial buffers were created around key pollution sources such as dustbins, open dumpsites, densely populated areas, and the Shankarpur landfill site. This helped in identifying zones affected by groundwater and surface water pollution, as well as air quality degradation (Figure 7, 8, 9 and 10). These buffer zones highlight regions at risk of groundwater, surface water, and ambient air pollution.

3.4 Environmental Impact Assessment of Improper Solid Waste Disposal

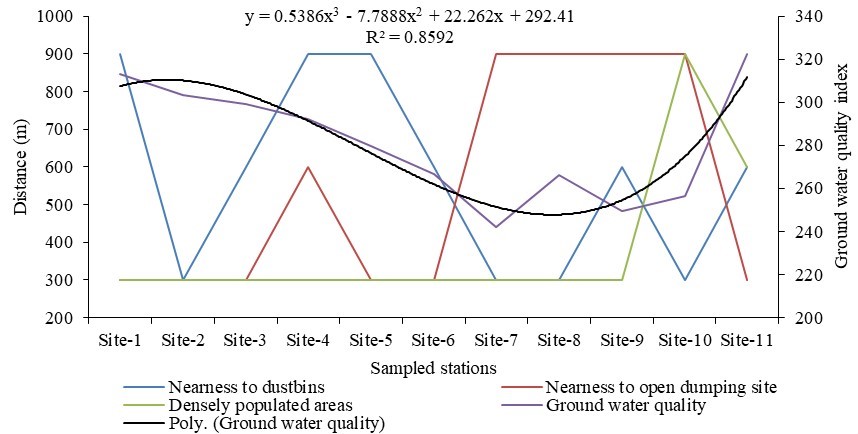
The environmental impact assessment of improper disposal of solid waste on surface water, groundwater, and the air was analyzed with help of standard statistical technique to find out the degree of correlation with improper management of solid waste and water and air. The correlation between groundwater quality and proximity to dustbins, open dumping sites, and densely populated areas is shown in Figure 11. The analysis reveals that nearness to dustbins, open dumping sites and densely populated areas are positively correlated with poor groundwater quality with R2 value 0.85. It is found that the groundwater quality is good in those sampled stations which are far away from open disposal sites, dustbins and low vulnerable areas to solid waste management.


Figure 10. Buffer from air sampled stations


Figure 11. Correlation between groundwater quality and system of solid waste management


Figure 12. Correlation between surface water quality and system of solid waste management


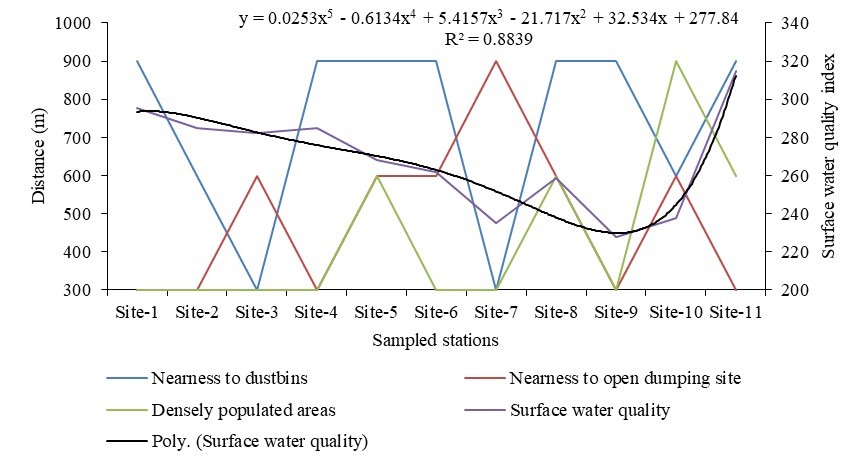
Similar results are found in case of surface water quality and locations of dustbins, open dump sites and highly densely populated areas. Figure 12 illustrates the correlation between surface water quality and proximity to dustbins, open dumps, and densely populated areas with R2 value 0.88. It is found that the surface water quality is good in those sampled stations which are far away from open disposal sites, dustbins and low vulnerable areas to solid waste management and vice-versa.

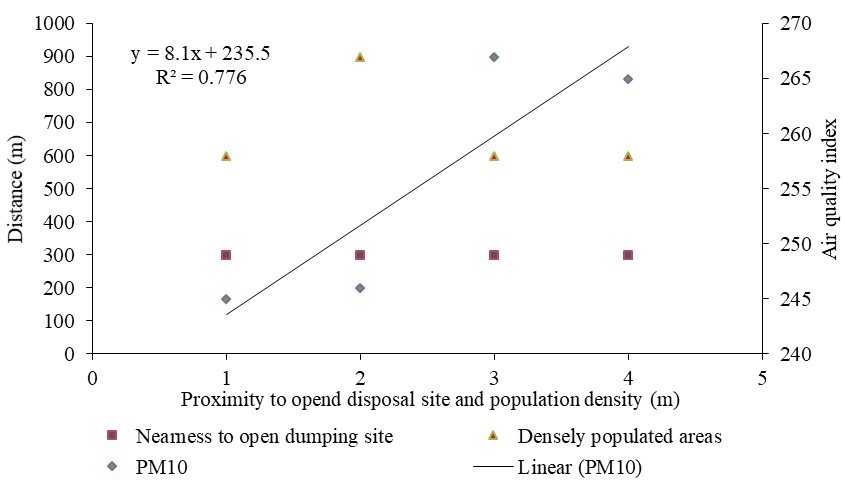
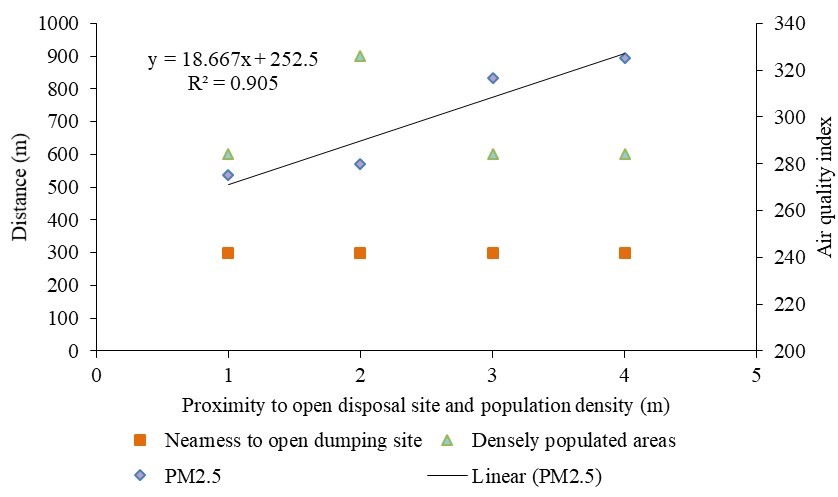
Figure 12 and Figure 13 display the correlation between air quality (specifically PM₁₀ and PM₂.₅ levels) and proximity to open dumping sites and densely populated areas in both seasons. The results indicate that PM₁₀ and PM₂.₅ levels are significantly higher in winter, likely due to reduced air circulation, and exhibit a stronger correlation with waste disposal sites and high-density areas compared to summer levels.

4 . DISCUSSION

The analysis of improper solid waste disposal and its impact on groundwater, surface water, and air quality highlights serious environmental challenges. The findings show strong correlations between waste disposal practices and environmental degradation which align with observations from similar urban-industrial regions globally (Sk et al., 2023; Abubakar et al., 2022; Deus et al., 2020). The study reveals a strong positive correlation (R²=0.85) between groundwater contamination and proximity to dustbins, open dumping sites, and densely populated areas. High concentrations of heavy metals such as cadmium, mercury, and lead in groundwater have been identified near waste disposalsites. These results are consistent with studies conducted in other industrial cities, where improper waste management similarly lead to groundwater contamination (Alam et al., 2024; Sarkar, 2024; Sharma et al., 2019). In Kolkata, for instance, leachate from unregulated landfills was identified as a primary source of heavy metal pollution in groundwater, representing the contamination patterns observed in Durgapur (Ali and Ahmad, 2020). These findings are consistent with studies highlighting that groundwater in regions with inadequate waste containment is at high risk of contamination, posing health risks to communities reliant on groundwater for drinking and agriculture (Abanyie et al., 2023; Li et al., 2021). Moreover, the regional hydrology of Durgapur, characterized by an unconfined to semi-confined groundwater system, facilitates the rapid migration of contaminants. This is comparable to findings from Nadia district by Dey et al. (2022), where the geology and hydrogeology significantly influence pollutant dispersion, resulting in widespread groundwater contamination near waste disposal sites. The similarity in groundwater flow patterns and contamination sources emphasizes the critical need for implementing robust containment and treatment measures to protect aquifers in industrial urban centers.


Figure 13. Correlation between air quality and open disposal site (summer season)


Figure 14. Correlation between air quality and open disposal site (winter season)


The study also demonstrates positive correlation between surface water quality decline and proximity to waste sources (R² = 0.88) reflects the susceptibility of surface water bodies to contamination from nearby waste disposal activities. High concentrations of EC, TDS, and BOD near dumping sites indicate substantial leachate infiltration into surface water bodies. These findings resonate with research conducted by Alo et al., 2023, where improper waste disposal has similarly led to the deterioration of riverine water quality. In Durgapur, surface water bodies near dumping sites results in high concentrations of TDS and EC levels, consistent with studies by Tesseme et al. (2022), where runoff from unmanaged landfills contributes to increased salinity and ion concentration in adjacent water bodies. The presence of heavy metals and organic pollutants in surface waters not only compromises water usability for domestic and agricultural purposes but also poses significant risks to aquatic life. Comparative analysis with Bangalore reveals that integrated waste management practices, including leachate treatment and effective runoff control, are essential to mitigate similar water quality issues (Cumar and Nagaraja, 2011).

Additionally, air quality analysis in Durgapur highlights high levels of particulate matter (PM₁₀ and PM₂.₅) and gaseous pollutants (SO₂ and NOₓ) near open dumping sites, particularly during the winter season. The correlation between waste disposal proximity and increased pollutant concentrations is evident, with PM levels exceeding national standards. These results are in line with studies from Chennai and Mumbai, where open burning of municipal solid waste significantly raises PM and gaseous pollutant levels, leading to adverse health effects (Peter and Nagendra, 2021; Singh et al., 2021). In winter, the reduced atmospheric dispersion and increased combustion of sulfur-containing materials contribute to higher pollutant concentrations, similar to the seasonal air quality variations observed in Delhi (Awasthi et al., 2024). The persistent high levels of PM₁₀ and PM₂.₅ are particularly concerning due to their association with respiratory and cardiovascular diseases, reinforcing the urgent need for implementing stricter air quality management practices. Comparative study by Mukherjee et al., (2020) has shown that the adoption of waste-to-energy technologies and improved waste segregation can significantly reduce airborne pollutants, offering viable solutions for Durgapur.


5 . IMPLICATIONS FOR POLICY AND WASTE MANAGEMENT PRACTICES

The findings from Durgapur highlight the need for inclusive waste management strategies that address the multifaceted impacts of solid waste disposal on environmental quality. Effective policy measures should include the establishment of engineered landfills with proper leachate management systems, implementation of waste segregation at source, and promotion of recycling and composting initiatives. These measures are supported by successful models from Ghana, where stringent waste management policies have resulted in minimal environmental contamination and enhanced public health outcomes (Williams et al., 2023). Additionally, continuous monitoring and enforcement of environmental standards are imperative to ensure compliance and mitigate pollution. The integration of Geographic Information Systems (GIS) for spatial analysis, as employed in this study, can aid policymakers in identifying high-risk areas and prioritizing interventions. Community engagement and public awareness campaigns are also crucial in fostering responsible waste disposal behaviors, as evidenced by community-driven waste management programs in Fiji (Sewak et al., 2021).

6 . CONCLUSION

In conclusion, this study underscores the environmental consequences associated with improper management of solid waste, particularly concerning its detrimental effects on groundwater, surface water, and air quality. The findings of this research insist the necessity of implementing focused measures-controlling groundwater leachate, preventing contamination from surface runoff, and minimizing airborne pollutants in areas near waste disposal sites. These actions are vital to fostering sustainable waste management within urban settings. By presenting clear evidence of the connections between waste site proximity and environmental degradation, this study advocates for well-considered policy interventions. It is hoped that these insights will serve as a guiding force for policymakers and urban planners, leading to the development of resilient waste management systems that safeguard environmental integrity and public health.

Conflict of Interest

The author declares no known conflicts of interest, financial or otherwise, that could influence the research findings or the publication of this work.

Acknowledgements

The author gratefully acknowledges the support and facilities provided by the Department of Geography, Aligarh Muslim University, Aligarh. Special thanks to the local authorities and community members of Durgapur for their cooperation during data collection.

Abbreviations

AMU: Aligarh Muslim University; AQI: Air Quality Index; As: Arsenic; BIS: Bureau of Indian Standards; BOD₅: Biochemical Oxygen Demand (5-day); Cd: Cadmium; Cl⁻: Chloride Ion; COD: Chemical Oxygen Demand; CPCB: Central Pollution Control Board; Cr: Chromium; DMC: Durgapur Municipal Corporation; DPL: Durgapur Projects Limited; DW: Distilled Water; EC: Electrical Conductivity; GF/A: Glass Fiber Filter (Type A); GIS: Geographic Information System; GoI: Government of India; Hg: Mercury; IS: Indian Standard; MoEF: Ministry of Environment and Forests; MSW: Municipal Solid Waste; NH₄⁺-N: Ammoniacal Nitrogen; NOₓ: Nitrogen Oxides; Pb: Lead; PM₁₀: Particulate Matter ≤10 Micrometers; PM₂.₅: Particulate Matter ≤2.5 Micrometers; PO₄³⁻: Phosphate Ion; : Coefficient of Determination; RDS: Respirable Dust Sampler; SO₂: Sulphur Dioxide; SO₄²⁻: Sulphate Ion; SPSS: Statistical Package for the Social Sciences; TDS: Total Dissolved Solids; TCM: Tetrachloromercurate Solution; TH: Total Hardness; WBPCB: West Bengal Pollution Control Board; WHO: World Health Organization; WQI: Water Quality Index

References

4.

Alam, A., Shamim, S., Fatima, S., Siddiqui, A. H., Alam, M. M. and Khan, W. U., 2024. Assessing the influence of Bandhwari landfills on groundwater quality using pollution index of groundwater (PIG) and leachate pollution index (LPI) in Gurugram, India. African Journal of Biological Sciences, 6(9), 2773-2783. 

22.

Mainul, S., 2019. Challenges in the management of single-use plastic carrier bags in Aligarh City: A study on sellers and consumer attitude. International Journal of Research in Social Sciences, 9(7), 732–750. 

33.

Siddiqui, M. A., Sk, M. M., Jinnah, M. A. and Anjum, R., 2021. Assessment of physico-chemical properties of ground water in Aligarh city. International Journal of Trend in Scientific Research and Development, 5(2), 917–924.

37.

Sk, M. M., 2023. Spatial Analysis of Solid Waste Generation Patterns in a Fast-Growing Industrial City-Durgapur, India. Journal of Emerging Technologies and Innovative Research, 10(7), e245-253.

40.

Sk, M. M., Ali, S. A. and Ahmad, A., 2020a. Forecasting municipal solid waste generation in a fast-growing industrial region using systematic approach. Studies in Indian Place Names, 40(71), 284-300.  

43.

Sk, M. M., Qamar, S. and Sethy, T., 2023. Solid waste management in Indian perspectives: A comprehensive review. Humanities and Social Science Studies, 12(1), 35.

44.

Sukanya, R. and Tantia, V., 2023. Urbanization and the impact on economic development. In New Perspectives and Possibilities in Strategic Management in the 21st Century: Between Tradition and Modernity (pp. 369-408). IGI Global.

45.

TerraGreen., 2022. MSW Management: The pitiable situation of Municipal Solid Waste Management. The Energy and Resources Institute.

49.

Zohoori, M. and Ghani, A., 2017. Municipal solid waste management challenges and problems for cities in low-income and developing countries. Int. J. Sci. Eng. Appl, 6(2), 39-48.