This is comprehensive assessment of vegetation indices for drought vulnerability assessment of Afar Region, Ethiopia.
The final map obtained by integrating NDVI, VCI, DSI and SPI shows competent results.
Extreme droughts were observed in 2005, 2009, 2011 and 2015.
The methodology and results are competent for drought risk management and drought mitigation strategies.
Abstract
Drought is a water related climatic natural disaster affecting wide range of environmental, biological and social factors. Short, poor and delayed rainfall in 2015 caused critical water shortage, livestock causality and decline in milk production in the pastoral areas of Ethiopia. The relationship between rainfall and vegetation indices was analyzed to identify drought-vulnerable areas in Afar region of Ethiopia using 11 years time series of decadal NDVI, VCI, DSI and SPI using SPOT (2005-2013) and PROVA-V (2014-2015) data. For the validation of drought indices, correlation and regression analyses between NDVI and rainfall (r = 75%), NDVI and crop yield, and VCI and rainfall (r = 90%) were done. The findings showed that there was extreme drought in the Afar region in 2005, 2009, 2011 and 2015. The region was highly prone to drought, even though its severity levels varied in different years. Drought was severe, longer and intense in most of the areas in the region, adversely affecting agricultural productivity and livestock maintenance and management. Assessments of such natural disasters are useful to plan mitigative measures in advance for effective management programmes, including drought hazards.
Keywords
Drought , Drought index , Normalized Difference Vegetation Index , Standardized Precipitation Index , Vegetation Condition Index , Vulnerability
1 . INTRODUCTION
Ethiopia is one of the Sub-Saharan African countries, part of which in highly vulnerable to hazards. Different natural hazards have been recorded in Ethiopia. Food production and water scarcity are long-standing issues in Ethiopia, exacerbated by periodic droughts and an ever-increasing population (Meze-Hausken, 2004; Tadesse et al., 2008; Tadesse et al., 2015). Agriculture continues to be a predominant sector of the economy and an important sector that provides food to the fast-growing population. Food insecurity typically results from a combination of climate events and societal vulnerabilities. In rainfed agriculture, availability of water is the most critical factor for sustaining crop productivity and food security. Recent droughts have illustrated the need for improved monitoring and enhanced decision support systems to deliver timely and reliable information to decision makers at many levels (Tadesse et al., 2008; Suryabhagavan, 2017). Several methods and approaches for drought monitoring and risk management have been developed in the last few decades (Panu and Sharmat, 2002). However, drought has remained the leading cause of disasters and human sufferings in Ethiopia in terms of frequency, area coverage and the number of people and livestock affected. The history of known droughts in Ethiopia dates back to 250 B.C. There had been many national and localized recent droughts since the 1970s, for which international support was sought, which was managed mainly by local communities. However, the magnitude, frequency and the effects of droughts have increased since the mid-1970s and the severity and persistence of the latest droughts have produced a wide range of
impacts across the country (Sara, 2010; Defferew, 2011; Akhtar, 2014). Drought is a water-related natural disaster, which affects a wide range of environmental factors and economic activities related to agriculture, vegetation, human and wildlife, and the local economy. Drought is a single most important weather-related natural disaster aggravated by human activities, which affects large areas continuously for months, and years and thus has a serious impact on regional food production, life expectancy of populations and economic performance of large regions or countries (Dutta et al., 2015). During 1967-1991, drought has affected 50 percent of the 2.8 billion people, who suffered from all natural disasters and killed 35 percent of the 3.5 million people, who lost their lives. In the recent years, large-scale intensive droughts affected in all continents leading to huge economic losses, destruction of ecological resources, food shortage and starvation of millions of people (WMO, 2004; Gizachew and Suryabhagavan, 2014; Seyoum et al., 2016).
The experience from droughts has underscored the vulnerability of human societies to this natural hazard (Birhanu et al., 2014). Food production and water scarcity are long-standing issues in Ethiopia, exacerbated by periodic drought and an ever-increasing population (Meze-Hausken, 2004; Tadesse et al., 2015). Agriculture continues to be a predominant sector of the economy of the country. Food insecurity typically results from a combination of climatic events and societal vulnerabilities. In rainfed agriculture, availability of water is the most critical factor for sustaining crop productivity and food security. Several methods and approaches for drought monitoring and risk management have been developed in the last few decades (Panu and Sharmat, 2002; Tadesse et al., 2008). Droughts are classified into four categories: meteorological or climatological, agricultural, hydrological and socioeconomic (Wilhite and Glantz, 1985; AMS, 2004; Mishra and Singh, 2010).
In different parts of Ethiopia, drought is a common phenomenon, which occurred in 1996, 1997, 1998, and 1999 (Suryabhagavan, 2017). Less rainfall had a major impact on rural populations throughout the country during 2000, which resulted in drought conditions and reduced agricultural productivity. This had a cumulative impact on households in both pastoral and agricultural communities, leading to greater vulnerability of drought. Many households were forced to sell their livestock and other assets and many of them have migrated from their traditional land to other areas in search of income and food for survival (Amare, 2007; Viste et al., 2013; Dutta et al., 2015).
Integration of information derived from Remote sensing techniques with other datasets both in spatial and non-spatial formats, provides tremendous potential for identification, monitoring and assessment of droughts (Berhan et al., 2011; Dodamani et al., 2015). Remote sensing and geographical information system (GIS) technologies can significantly contribute in all the three phases such preparedness, monitoring and relief of drought risk management (Jeyaseelan, 2003). The objective of the present study was to assess the level of effectiveness of RS-based drought indices as an indicator for drought assessment in arid and semi-arid areas and to examine the relationship between rainfall and vegetation indices of drought in the Afar Regional State of Ethiopia, part of which is a drought-prone region.
2 . STUDY AREA
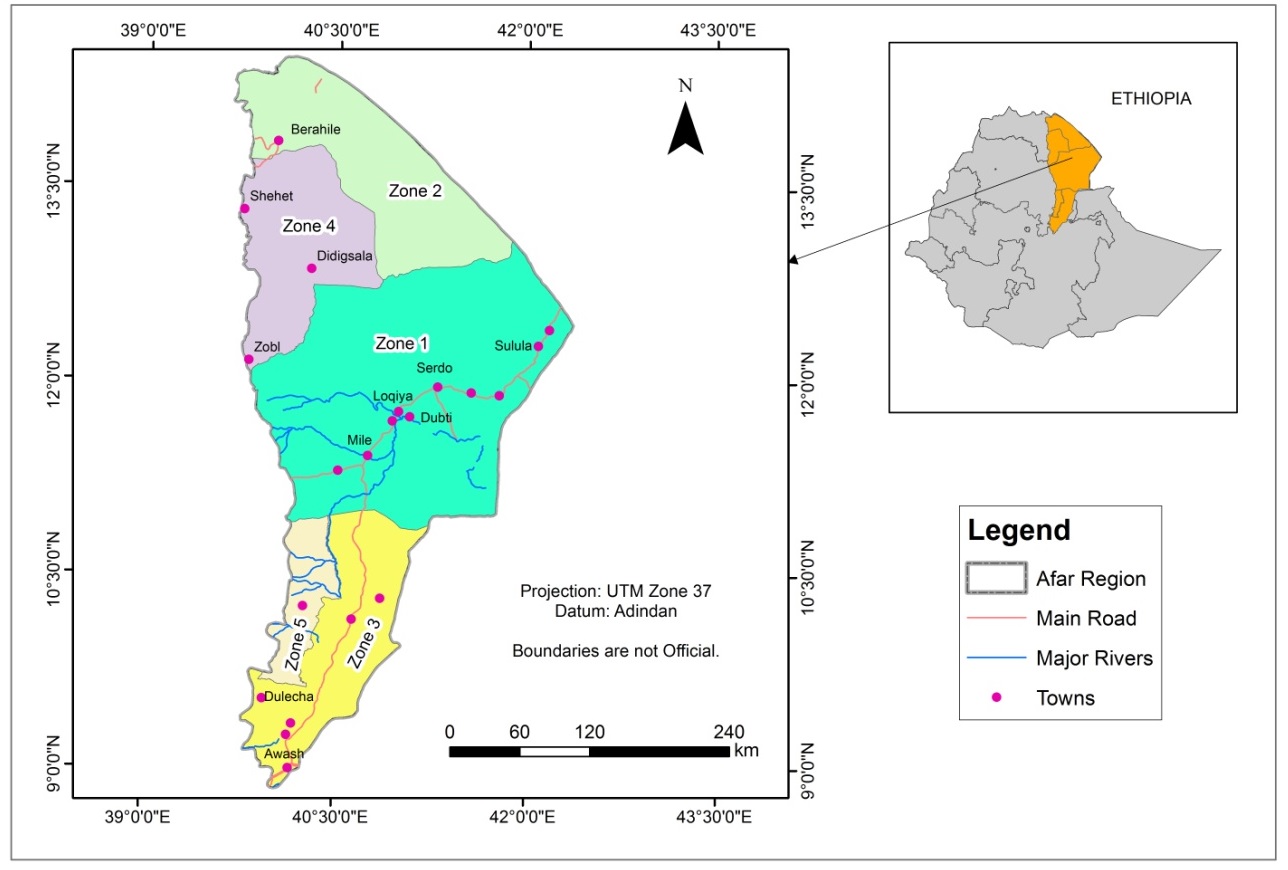
Geographically, Afar Regional State is located in the eastern part of Ethiopia (Figure 1) with a total geographical area of 94,243.8 km2, covering approximately 10 percent of the extent of the country. This Regional State is located between latitudes 8º49ʹ-14º30ʹN and longitudes 39º34ʹ-42º28ʹE and shares common international boundaries with Eritrea in the North-East and Djibouti in the East, and Somali in the South-East and boundaries with the Ethiopia Regional States of Tigray in the North-West, Amhara in the South-West and Oromia in the South (CSA, 2008). This Regional State consists of five administrative Zones (sub-regions), 32 administrative districts, 28 towns, and 401 rural and urban sub-districts. The Southern part consists of the valley of the Awash River, which empties into a string of lakes along the Ethiopian-Djibouti border. Other notable landmarks of this region include Awash and Yangudi Rasa National Parks (ANRS, 2004). The population density of this Regional State is 14.59 people per km2.
Figure 1. Location map
3 . TOPOGRAPHY AND CLIMATE
Most of the Afar region is flat land with the altitude ranges from 116 m below sea level (Danakil depression) to 2063 m above sea level (Mt. Mussa-Alle). The Danakil depression in the north of the Afar region is a plate tectonic triple junction. The Afar Depression is part of the Great East African Rift Valley (ANRS, 2004). Afar region is characterized by arid and semi-arid climates with low and erratic rainfall. Rainfall is tri-modal throughout the region with a mean annual rainfall below 600 mm in the most favored areas in the South and semi-arid Western escarpments, decreasing to 200 mm in the arid zones in the east. The region receives three rainy seasons. The main rainy, summer accounts for 60% of annual rainfall and occurs during mid-June to mid-September. This is followed by little rains in the mid-December and a minor rainy season during March-April. Disturbances on the performance of any rainy season will impact on the availability of pasture and water as well as the overall food security situation of the pastoral and agro-pastoral communities in the region (Diress et al., 1998). Temperature of Afar varies from 25ºC during the rainy season (March to September) to 48ºC during the dry season (October to February). The satellite based average annual record rainfall was 187.9 mm.
4 . METHODS
The present study was conducted using satellite imageries, Ethiopian mapping agency tope sheets and other collateral data obtained from various Governmental organizations as well as through ground truths.
4.1 Data Acquisition and Software
SPOT-5 vegetation 10-day synthesis archive products were downloaded for the years 2005-2013. The vegetation data had all products, including high level products, derived from the vegetation instrument on board of the SPOT satellite (Yang and Merchant, 1998; Karabulut, 2003; Shilong et al., 2004; Kabo-bah, 2013). PROBA-V, vegetation data were also used for 2014-2015 of the study period. PROBA vegetation data used for this study had 1 km spatial resolution similar to that of SPOT vegetation data, but of two days temporal resolution. Rainfall data of Ethiopia were acquired using GeoCLIM software from the Famine Early Warning Network (FEWS). Rainfall data downloaded were finally masked out for the study area. Spanning 50ºS to 50ºN (all longitudes), starting from 1981 to 2015. CHIRPS incorporate 0.05º resolution satellite imagery with in-situ station data to create gridded rainfall time series for trend and seasonal drought monitoring. ArcGIS 10.3, ERDAS Imagine 2014, GeoCLIM software, Vegetation Extraction tool (VGTExtract) and Microsoft excel were used for this study for graphical display and statistical analysis.
4.2 Vegetation Indices
4.2.1 Computing Normalized Difference Vegetation Index (NDVI)
Normalized Difference Vegetation Index (NDVI) (1) was calculated from the near-infrared (NIR) and RED wavelengths, using the following algorithm:
\(NDVI = (NIR-RED)/(NIR+RED)\) (1)
where, NIR and RED are reflectance in the near infrared and red bands, respectively.
NDVI is a non-linear function that ranges between −1 and +1. Raw data from SPOT vegetation system were rescaled to −1 to +1 to obtain the actual NDVI value. Raw data are digital numbers for a pixel plus certain coefficients and ranges from 0 to 255. The valid range of eight bit raw data values are 3-255 (Shilong et al., 2004).
The relationship between the Digital Number (DN) and the \(NDVI_{actual}\) (2) was expressed as:
\(NDVI_{actual}= Coefficient\ a × DN+Coefficient\ b\) (2)
where, \(Coefficient\ a\) = 0.004 and \(Coefficient\ b\) = −0.1
Then, \(NDVI_{actual}\) was calculated from the raw data (raw data pixel value × 0.004) − 0.1 using raster map algebra in ArcGIS. While in the case of PROVA-V vegetation data, rescaling was different from SPOT vegetation data processing. The PROVA-V vegetation data were also rescaled to obtain the actual NDVI value that ranged from −1 to +1. Raw digital value ranged 3-255, which was similar of SPOT vegetation data, but its offset value was different. Therefore, the rescaling value was expressed (3) as:
4.2.2 Computation of Vegetation Condition Index (VCI)
Satellite land observation data have been used to monitor a variety of dynamic land surface processes (Anderson et al., 1976; Reed et al., 1994; Yang et al., 1998; Peters et al., 2002; Gu et al., 2008). Satellite remote sensing provides a synoptic view of the land and a spatial context for measuring drought impacts, which have proved to be a valuable source of timely, spatially continuous data with improved information on monitoring vegetation dynamics in large areas. According to Kogan (1995), the drought monitoring algorithm considers separation of the short-term weather related NDVI fluctuations from long-term ecosystem changes following the equation (4) given below:
where \(NDVI\) , \(NDVI_{max}\), and \(NDVI_{min}\) are smoothed weekly \(NDVI\), its multiyear absolute maximum, and minimum, respectively.
4.2.3 Computation of Deviation of NDVI (Drought Severity Index, DSI)
Drought Severity Index (DSI) was computed based on the seasonal level using ArcGIS raster calculator. To derive the \(NDVI_{DEV}\) map of the study area, decadal long-term mean images were stacked together and monthly long term means were calculated. DSI was computed seasonal basis to identify the drought years and its severity classes. It was computed using the following algorithm (5):
\(NDVI_{DEV}=NDVI_1-NDVI_{mean,m} \) (5)
where, \(NDVI_1\) is the \(NDVI\) value for season and \(NDVI_{mean,m} \) is the long-term mean.
4.2.4 Computation of Standardized Precipitation Index (SPI)
Standardized precipitation Index was designed to quantify the precipitation deficit for multiple time scales. These time scales reflect the impact of drought on the availability of different water resources. Soil moisture conditions respond to precipitation anomalies on a relatively short scale (Shaheen and Biag, 2011). This long-term record was fitted to a probability distribution and transformed to a normal distribution so that the mean SPI for the location and desired period was zero (McKee et al., 1993; Edwards and McKee, 1997). The SPI (6) was calculated as:
\(SPI=(X-P_a)/Standard\ deviation\) (6)
where, \(X\) is total seasonal precipitation, \(P_a\) is long term mean of total seasonal mean
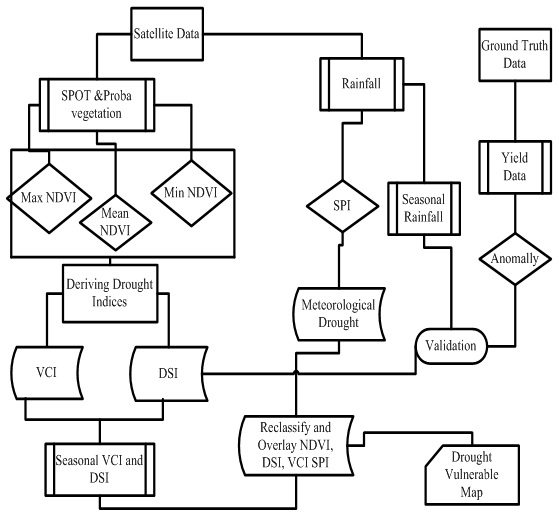
Seasonal frequency maps obtained from each drought indices were reclassified into a common scale obtained from literature. For example, Lemma (1996), Gizachew and Suryabhavan (2014) have showed the probability of drought occurrence in a given area can be classified in to high, moderate and low, when drought is prevalent in more than 50%, 30 to 50% and less than 30% of the years, respectively. Based on this criterion, the frequency of maps of each of the drought classes were reclassified into four classes on the regularity of drought rate during the study periods. Accordingly, the occurrences of drought were rated as 3-4 mild 5-6 moderate, 7-10 severe and 11-13 extreme vulnerable. Finally, maps from each drought indices were weighted overlaid based on the percentage of influence using ArcGIS software. The detailed flow chart of the methodology is presented in figure 2.
Figure 2. Schematic preparation
5 . RESULTS
5.1 Normalized Difference Vegetation Index
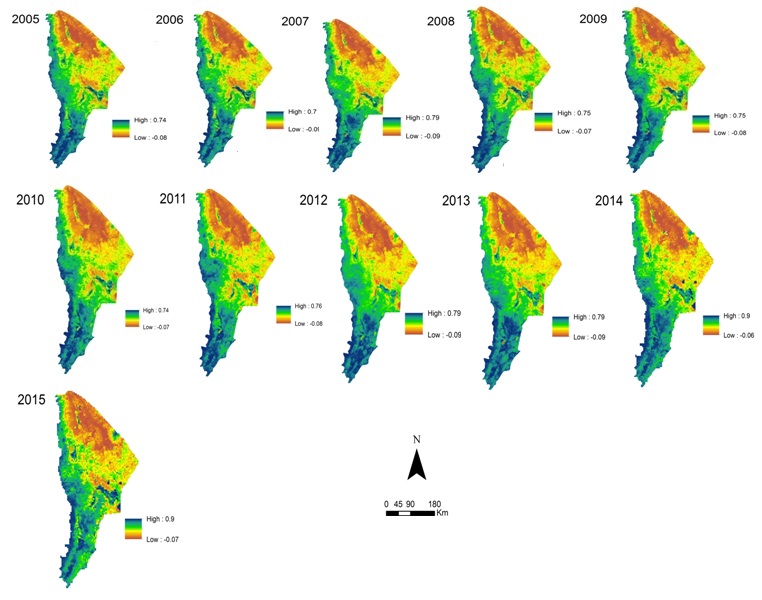
Results of NDVI showed that there was variability in drought during different seasons. The eastern and north-eastern parts of the study areas have the lowest NDVI values compared to other parts of the Regional State (Figures 3 and 4). Relatively, the south-western and western parts have high vegetation and high NDVI value (0.9). These areas are more vegetated than eastern and north-eastern parts of the Regional State. Based on the drought index scale, areas affected by drought have low NDVI values. During 2005, seasonal NDVI values varied from −0.08 to 0.74. North-eastern and eastern parts had values < 0, indicating no or very low vegetation. On the other hand, in 2006, seasonal NDVI values ranged from −0.09 to 0.7, showing low vegetation cover during the growing season in the north-eastern and eastern parts of the study area. The historical NDVI (long term seasonal) values indicated the existence of drought in the Afar Regional State. However, its magnitude and spatial extension varied. Negative values indicated the dry season, while positive values showed wet season. Even though, the seasonal mean values of each of the years was positive, the values varied spatially and seasonally across the region in different growing seasons during 2005-2015. Vegetation covers identified in terms of NDVI values were high in the western and south-western parts of the Regional State. The seasonal pattern of NDVI varies from year to year (Figure 3).
Figure 3. Mean seasonal NDVI (2005 to 2015)
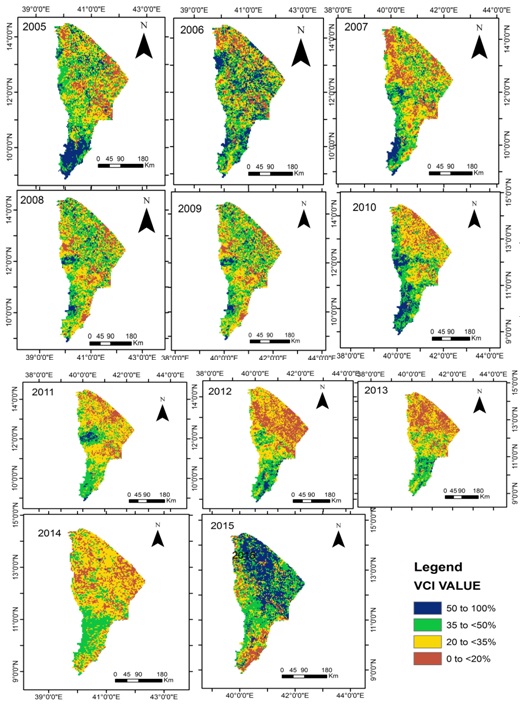
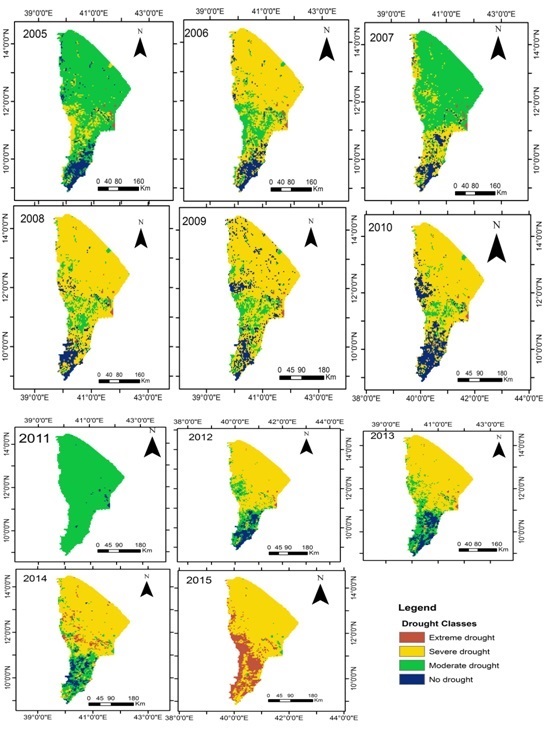
Figure 4. Vegetation Condition Index (2005-2015)
5.2 Relationship between Normalized Difference Vegetation Index and Rainfall
Considering the average seasonal NDVI and rainfall patterns of the Afar region from 2005 to 2015, NDVI values have increased proportionally as the mean seasonal rainfall increased. Spatially, NDVI and rainfall values increased from the eastern part to the western and South-western parts of the region, with its values reached up to 0.9 and 575 mm, respectively. But, in the Eastern and North-eastern parts of the region, NDVI and rainfall values were low with the minimum of −0.07 and 133 mm, respectively. Seasonal NDVI and rainfall varied from 0.14 to 0.2 (with NDVI average value of 0.17; r, 75%), and 95 to 270 mm (rainfall average,
197 mm; r, 75%), respectively. Analysis of variance of these drought indices showed significant differences (p<0.05) among the years of analysis. The correlation between NDVI and seasonal rainfall was statistically significant. During the study period, there were considerable changes in NDVI and rainfall values. The highest NDVI value was observed when the mean seasonal rainfall was better distributed and the lowest NDVI value was recorded when rainfall was less. Rainfall was less during the years 2005, 2008, 2011 and 2015. The minimum NDVI responded as rainfall changed during the dry years, particularly 2005, 2009, 2011 and 2015. During these years, NDVI values were low as compared with the remaining years in the study period. There was failure of rainfall seasonally in the years 2008, 2009, 2011 and extremely in 2015 compared to that of the other years of study. Contrary to these years, 2007 and 2010 seasonal rainfall was good in the region. On the other hand, the NDVI value was high during the years 2007, 2012, 2013 and 2014. This shows drought occurred during the years 2005, 2006, 2008, 2009, 2011 and 2015.
5.3 Vegetation Condition Index
It was found that severe drought condition prevailed during the rainy seasons of the years 2005, 2006, 2009, 2011 and 2015. The onset and spatial extent of drought were clearly observed from the VCI map for the years 2005-2015. Vegetation Condition Index values ranged from 0 to 100, where 0 indicates absence of vegetation and 100 indicates high availability of vegetation. Figure 4 shows temporal trends of VCI index of the Afar region from 2005 to 2015. The mean VCI values ranged from 25% (lowest) in 2015 to 75.9% (highest) in 2013. From 2005 to 2015, the lower VCI values were observed in 2005 (32.29), 2006 (46.7), 2008 (36.68), 2009 (36.68), 2010 (39.24), 2011 (42.7), and 2015 (25). Hence, drought years in this Regional State were identified as 2005, 2006, 2008, 2009, 2010, 2011 and 2015. However, its severity varied as given above for the respective years.
5.4 Vegetation Condition Index Vs. mean seasonal rainfall, Precipitation Index and Yield
The VCI was strongly correlated with the mean seasonal rainfall in the Afar region. The VCI (79.5%) was highest during 2013, when the mean seasonal rainfall was at its peak (270mm). The mean seasonal rainfall and VCI were increasing and decreasing with nearly the same proportion. The relationship between VCI and mean SPI was positive and had good relationship (r = 0.55), and it was statistically significant with coefficient variation, which indicated positive relationship between the two drought indices in the study area. From 11 years of VCI data, 29% of VCI variability could be explained by SPI. Therefore, VCI and SPI have positive correlation to indicate drought. However, SPI was the meteorological drought indicator, while VCI was the agricultural drought indicator. It was revealed that both the drought indices were good indicators of drought in the present study area. The correlation coefficient was r = 68% and it was statistically significant with p = 0.02, with a good relationship. The crop values are increased by 68% as a result of increase in VCI. When VCI was low, crop yield was also low. However, there was no consistent increase or decrease as one of the variables increase or decrease. In some years, VCI was low, but crop yield production was relatively moderate.
5.5 Drought Severity Index Vs. Yield
The DSI values indicated the existence of drought during the study periods in the Afar region. As shown in figure 5, DSI values ranged from −1 to +1. During the years 2005, 2006, 2008, 2009, 2010, 2011 and 2015, the mean seasonal DSI values were -0.04, -0.02, -0.03, -0.03, -0.01, -0.01 and -0.004, respectively. The wet years were 2007, 2012, 2013 and 2014, with DSI values of 0.11, 0.03, 0.04 and 0.01, respectively. However, its severity varied spatially and temporally across the region during the study period. For instance, in 2015, the DSI value was less than 0 indicating drought. Drought Severity Index and crop yield indicated a positive relationship with r = 41%. Based on the result of DSI and yield, there was a change in the agricultural production. Relatively, DSI was low for Afar region, but lower DSI was observed during 2005, 2006, 2008, 2009, 2011 and 2015. Hence, these years were drought years in the region.
Figure 5. Spatial patterns of drought in Afar region as revealed by Drought Severity Index (2005-2015)
5.6 Standardized Precipitation Index (SPI)
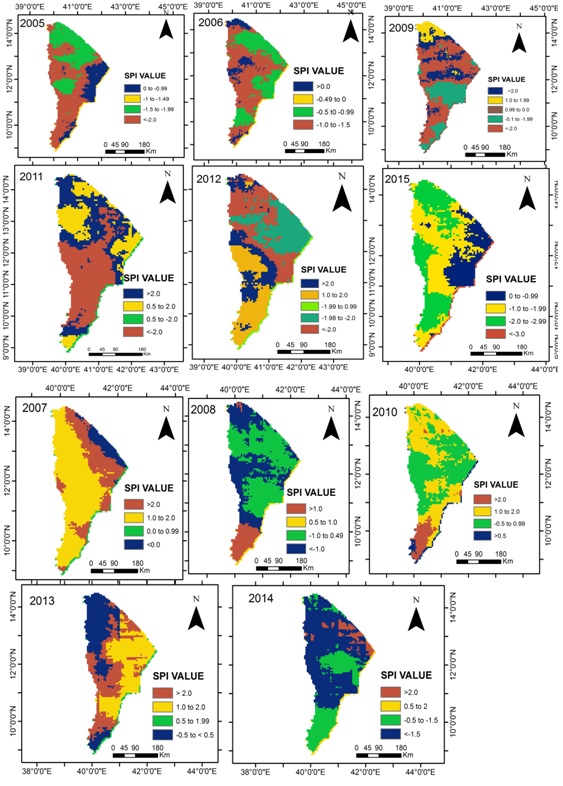
Based on SPI for 11 years, the values are ranged from < −3 to > +3. The threshold value for the drought severity class was −1.5. The values were low in 2005 (−1.5), 2006 (−1), 2009 (−2.0), 2011(−1.5) and 2015 (−3). Based on the considered threshold value −1.5, severe meteorological drought occurred during 2005, 2009, 2011 and 2015 in the Region (Figure 6). The results of SPI value indicated that there was dry condition prevailing during the summer (rainy) season in the study area. The SPI value ranged from <−3 to +3 in different years. The relationship between SPI and yield was positive with r = 0.73. It shows that 54% of yield variability could be explained by standard precipitation index.
Figure 6. Spatial-temporal pattern of drought in Afar region for dry years as expressed by Standardized Precipitation Index
5.7 Comparison of Drought Indices and Drought Classification
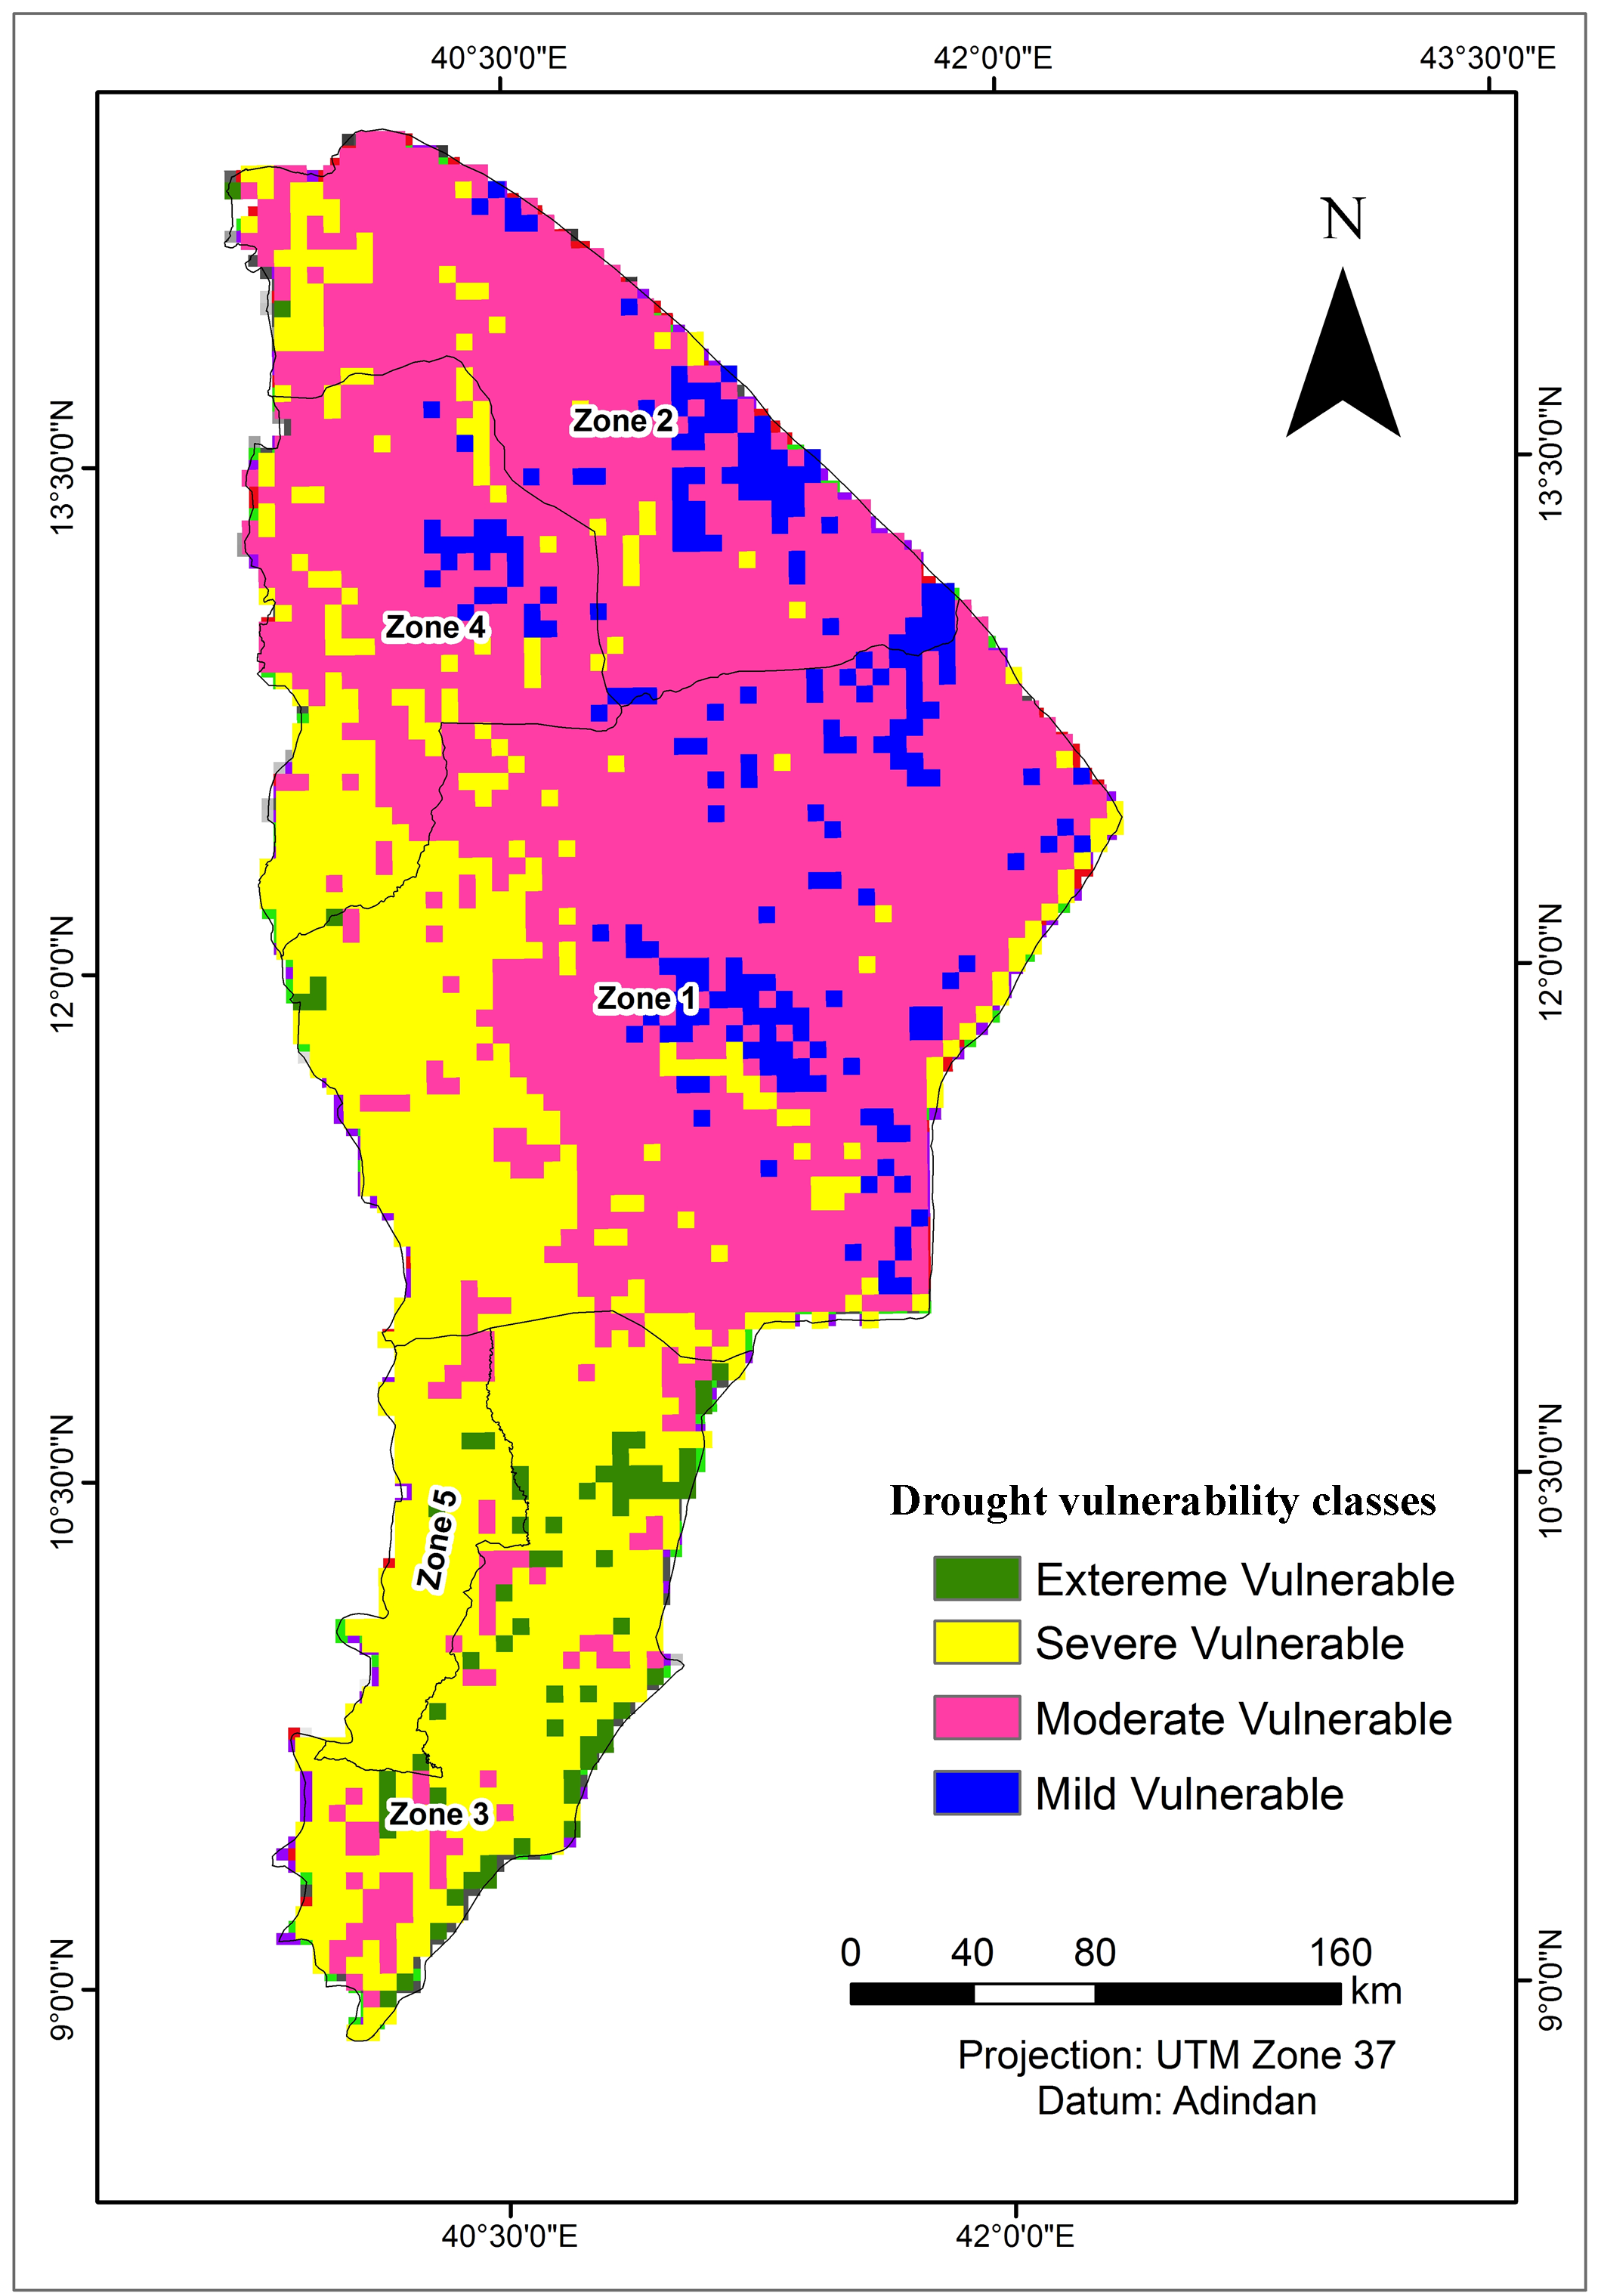
The NDVI values were more or less similar with little fluctuation in different years. However, its mean value is positive throughout the study periods indicating the presence of vegetation. In the case of VCI, the value ranged from 0 to 79.5%. The lowest VCI was observed in 2015 and the highest in 2013, indicating the Vegetation Condition Index. This result fits better with the drought years in the study area. The DSI was also used as a Drought Index, and hence this result is a better index. The SPI was also better fitted with DSI values and the lowest values coincided with the drought years occurred in the region. The final drought vulnerability map of the study area (Figure 7) has revealed that the area is under mild, moderate, severe and extreme vulnerable class to drought. Based on the drought vulnerable classes, about 2% of the region is categorized as extreme vulnerable, 33% as severe vulnerable, 59% as moderate vulnerable and only 6% is mild vulnerable. Hence, region in general is in the vulnerable class of drought.
Figure 7. Drought vulnerability classes of the Afar region
6 . DISCUSSION
The NDVI is a measure of greenness or vigor of vegetation. The findings of the present study have revealed that NDVI varied from the east towards to the west of the arid and semi-arid regions of Afar region of Ethiopia. Kabo-bah et al. (2013) showed the effectiveness of the SPOT vegetation NDVI for monitoring the vegetation cover in Northern Ghana. There are inter-annual variations in the magnitude and evolution of NDVI for particular a location which is governed by meteorological variables such as precipitation, temperature and relative humidity (Belal et al., 2012). Interpretation of NDVI values was spatially dependent as more productive ecosystems have different radiometric properties than less productive ones due to differences in climate, soil and topography.
As the present study area is largely pastoral and agro-pastoral, vegetation conditions and cover also varied. The NDVI and rainfall relationship (r = 0.75) was also positive in this respect. Mahyou et al. (2010) have revealed a good relationship between NDVI and rainfall with the coefficient of variation (r = 76%) in the pastoral areas of Morocco using Landsat NDVI. A high correlation between NDVI and rainfall was reported by Davenport and Nicholson (1993). Similarly, Gizachew and Suryabhagavan (2014) showed good relationship between rainfall and NDVI in East Shewa Zone, Ethiopia. The mean seasonal NDVI indicating greenness of the vegetation and seasonal rainfall had strong relationship (Gaikwad et al., 2015). They also concluded that NDVI can be used as an indicator for drought. The present study also revealed that the NDVI responded as a result of rainfall variation seasonally and spatially. Therefore, NDVI is found to be a relatively good indicator of drought in pastoral and agro-pastoral areas of Afar Region.
Vegetation as a drought index was developed by Kogan (1997) to separate ecosystem variability of vegetation resulted from components of the ecosystem. The lowest VCI value observed in the present study area in 2015 coincides with drought occurred in the Afar region, which was a severe drought in 30 years of history in relation with El-Niño event that occurred in Ethiopia and the Horn of Africa (OXFAM, 2015). The year 2011 was the worst drought affected year in the central eastern parts of Africa, when around 258,000 lives in Somalia and devastated livelihoods across Ethiopia and Kenya. In addition to the 2011 drought, 2015 was also severe that affected almost the whole parts of the Afar Regional State. Kogan (1995) showed VCI as a good tool to detect and monitor drought, and used to detect prolonged, widespread, intense and localized droughts. Kogan (1995) also evaluated the relationship between corn crop and VCI, and concluded to have better matched. The spatio-temporal extent of agricultural drought in Rajasthan (India) was delineated by Dutta et al. (2015) using RS-based VCI.
The VCI and the rainfall in the study area varied seasonally. Similar approach was made to assess drought-risk in Gujarat (India) and found good relationship between VCI and rainfall (Chopra, 2006). Similarly, Mahyou et al. (2010) have also studied VCI and rainfall relationship in drought-risk assessment in pastoral lands of Morocco and showed high correlation. Vogt et al. (2000), Wang et al. (2004) and Thenkabail et al. (2004) have also showed high correlation between VCI and rainfall. Vegetation Condition Index was low during 2015 and this might be due to the effect of El-Niño in the region (Tadesse et al., 2008; Suryabhagavan, 2017). However, this study did not incorporate the Sea Surface Temperature (SST), which is the main cause of El-Niño. According to Kogan (2000), vegetation was in severe stress during the El-Niño event. Kogan (2001) also noted that the relationship between rainfall and VCI was high with a strong coefficient of variation. A rainfall characteristic was not only the amount of rainfall, but also rainfall distribution that plays a significant role for the growth of vegetation. Therefore, VCI was effective for drought assessment in the pastoral and agro-pastoral lands of Afar region. Unganai and Kogan (1998) have used VCI for drought monitoring and corn yield estimation and corn crop to validate criteria for satellite algorithms for the assessment of drought severity in South Africa. According to them, VCI was highly correlated with corn (r > 0.75). The present study also revealed the relationship with crop yield production in the study area (r > 0.68). In addition, Dutta et al. (2015) have also found good relationship between VCI with major crop yield in India.
The SPI is a very popular meteorological drought index, which has been frequently used by decision makers for measuring and monitoring the intensity of meteorological drought events. Standardized Precipitation Index is useful for identifying spatiotemporal extent of long-term historical droughts. Different studies across the world used SPI as a drought indicator, particularly meteorological drought. The present study incorporated SPI to assess meteorological drought in the study area and revealed occurrence of meteorological drought in different years in the area. The SPI value fell within the range of −3 (severe drought) to 2.0 (wet). Shah et al. (2015), Dutta et al. (2015) and Dodomani et al. (2015) have also used SPI for drought risk assessment and modeling. Farahmand and Aghakouchak (2015) obtained SPI using 33 years of precipitation data and concluded that the result obtained was more reliable. The present study correlated SPI with crop yield and revealed statistically significant positive relationship (r = 0.73). Similarly, Rui et al. (2014) conducted index based assessment of agricultural drought in semi-arid region of Inner Mongolia, and found significant correlation between SPI and crop yield. In other parts of the world, particularly in the Sub-Saharan Sudan, Elagib (2013) had come up with an impressive correlation between SPI and crop yield. The results of the present study also shows that SPI and crop yield are positively correlated and hence can be used as an effective tool for assessment of drought in and semi-arid areas.
7 . CONCLUSION
The pastoral and agro-pastoral areas of Ethiopia, particularly the Afar region are frequently affected by drought. Temporal and spatial extents and characteristics of drought can be noticed, monitored and mapped from remotely sensed data such as SPOT and PROVA-V vegetation. Remote sensing-based drought indices are effective in drought assessment in arid and semi-arid areas. The temporal variation of NDVI values were closely related to rainfall to validate how vegetation stress condition was changing with the variability of rainfall. There is a relationship between NDVI and rainfall variability and between VCI and rainfall during the growing season. Vegetation Condition Index and crop yield also had good relationship. Standardized Precipitation Index and DSI were also highly correlated. The present study shows the occurrence of drought at least in every two or three years. Within the 11 years of the study period, the drought was observed in 11 years. Therefore, it could be concluded that the region is highly prone to drought. The drought vulnerability map shows that the Region is within the drought vulnerability range from mild to extreme. The findings of this study can be used for improvement of regional drought monitoring. Taking into account the spatial extension and frequency of drought and lack of timely ground data observations, the application of remotely sensed data could play a key role for drought monitoring and drought prediction, which in essential for governments to implement mitigative measure in advance.
Tables
Figures
Conflict of Interest
The authors declare no conflict of interest.
Acknowledgements
We are thankful to the School of Earth Sciences and the College of Natural and Computational Sciences, Addis Ababa University for providing necessary facilities and support during the present study period. We are also thankful to the anonymous reviewers for their comments, which helped us to improve this manuscript.
Akhtar, I. H., 2014. Identification of drought events from multi years temporal SPOT NDVI data for Potohar Region in Pakistan. International Journal of Remote Sensing and GIS. 3, 39-52.
2.
Amare, D., 2007. Application of remote sensing for delineation of drought vulnerable areas in Amhara Region, MSc thesis Addis Ababa University, Addis Ababa.
Anderson, J. R., Hardy, E. E., Roach, J. T. and Witmer, R. E., 1976. A land use and land cover classification system for use with remote sensor data. US Geological Survey Professional Paper, 964. 28.
5.
ANRS., 2004. Afar ational regional state, a strategic plan for the sustainable development, conservation, and management of the woody biomass resources. Final report, Addis Ababa.
Birhanu, G., Legesse, H., Solomon, A. and Suryabhagavan, K.V., 2014. Drought risk assessment using remote sensing and GIS: The case of Southern Zone, Tigray Region, Ethiopia. Journal of Natural Sciences Research. 4, 87-94.
9.
Chopra, P., 2006. Drought risk assessment using remote sensing and GIS: A case study of Gujarat. Thesis of Indian Institute of Remote Sensing (IIRS), Dehradun, India and International Institute for Geo-Information Science and Earth Observation, Enschede, Netherlands.
10.
CSA, 2008. Summary and statistical report of the 2007, Population and Housing Census, Addis Ababa.
Defferew, K., 2011. The impact of drought on livelihoods, vulnerability and coping mechanisms: The case of North Shoa Zone, Oromiya, MA Thesis, Addis Ababa University, Addis Ababa.
13.
Diress, T., Farah, K.O. and Mbuvi, D., 1998. Impacts of land use on woody vegetation in the semi-arid areas of Aba’ala district, North Afar, Ethiopia. The African pastoral forum (APF) working paper, 16, 37, Nairobi.
14.
Dodamani, B. M., Anoop, R. and Mahajan, D.R., 2015. Agricultural drought modeling using remote sensing. International Journal of Environmental Sciences and Development. 6(5), 326-331.
Elagib, N. A., 2013. Meteorological drought and crop yield in Sub-Saharan Sudan. International Journal of Water Resources and Arid Environments. 2, 164-171.
Gizachew, L. and Suryabhavan, K.V., 2014. remote sensing and GIS based agricultural drought assessment in East Shewa Zone, Ethiopia. Tropical ecology. 55, 349-363.
Jeyaseelan, A. T., 2003. Droughts and floods assessment and monitoring using remote sensing and GIS. Satellite Remote Sensing and GIS applications in Agricultural Meteorology, Proceedings of a Training Workshop held 7-11 July 2003, Dehra Dun.
Kogan, F. N., 2000. Contribution of remote sensing to drought early warning. In Early Warning Systems for Drought Preparedness and Drought Management, Proceedings of an expert group meeting held on Warning Systems for Drought Preparedness and Drought Management. Lisbon, Portugal.
29.
Lemma, G., 1996. Climate classification of Ethioia. Metorological Research Report Series, 3, 1-8, Addis Ababa.
Sara, A., 2010. Mitigating drought: Policy impact evaluation: A case of Tigray Region, Ethiopia, MSc Thesis, University of Twente, Enschede, The Netherlands.
Vogt, J. V., Viau, A. A., Beaudin, I., Niemeyer, S. and Somma. F., 2000. Drought Monitoring from Space using Empirical indices and physical indicators in: International Symposium on satellite based Observation: A toll for the ftudy of Mediterranean Basin Tunis, Tunisia.
WMO, 2004. Satellite remote sensing and GIS applications in agricultural meteorology. Proceedings of the Training Workshop, Geneva, Switzerland, 1182, 291-313.


 ,
K. V. Suryabhagavan 1
,
K. V. Suryabhagavan 1
 ,
M. Balakrishnan 2
,
M. Balakrishnan 2