1 . INTRODUCTION
The increasing demand of water in the urban area leads to the stress on groundwater resources on and around the urban locality (Anonymous, 2002; Singh et al., 2009; Kadam et al., 2012). Due to over exploitation of groundwater resource and rapid urbanisation in Ranchi urban area, there will be a shortage of groundwater availability in near future and require artificial recharge structure for replenish it (CGWB, 2013). The natural replenishment of groundwater reservoir is slow in hard rock terrain due to excessive continued exploitation of groundwater resources and less infiltration of rainwater (Ibrahim, 2009). This has resulted in declining groundwater levels and depleted the potential of groundwater resources. Therefore, to maintain the natural availability of groundwater, artificial recharge to groundwater has become an important and frontal management strategy. Many scientific groups and researchers from all over the world have confirmed the potential of rainwater harvesting (RWH) system to enhance the Groundwater productivity (Handia et al., 2003; Kim et al., 2005; Concepcion et al. 2006; Sazakli et al., 2007; Abdulla and Al-Shareef, 2009; Vohland and Barry, 2009; Kadam et al., 2012; Moon et al., 2012) and suggested that rainwater harvesting may be one of the best methods available to recovering the natural hydrologic cycle and enabling urban development to become sustainable. Hence, the study has emphasised on the suitability of artificial groundwater recharge structures in and around the Ranchi urban area through various rain water harvesting techniques (Check dams, Percolation tanks, Nala bands, Rooftop rainwater harvesting, etc.) depending on the availability of area, rainwater and land use practices within the urban environment.
Several researchers in delineating groundwater potential zones in hard rock terrain (Agarwal et al., 1992; Rao et al., 2001; Kumar et al., 2008; Shekhar and Pandey, 2014) have carried out extensive hydrogeological studies. In recent years, use of satellite remote sensing data along with Geographical Information System (GIS), topographical maps, collateral information and limited field checks, has made it easier to establish the base line information on groundwater prospective zones (Saraf and Jain, 1993; Krishnamurthy et al., 2000; Agarwal et al., 2004; Kumar et al., 2008; Shekhar and Pandey, 2014; Ranjan et al., 2017). Though the study of delineating groundwater prospective zones has been carried out quite well for hard rock terrain, but there are only few papers and reports (Saraf and Choudhury, 1998; Chowdary, 2009; CGWB, 2007) on the site suitability analysis for various groundwater recharge structures on the hard rock terrain using remote sensing and geospatial technology. Additionally, though the artificial groundwater recharge methods are made available, these are not being extensively used in the developing nations like India due to lack of their feasibility and suitability analysis for a particular region (Bhattacharya et al, 2010). Therefore, approaching geospatial technologies for the study of site suitability and feasibility analysis of artificial groundwater recharge structures through RWH systems can enhance the potential area of RS and GIS for hydrology and water resource management.
3 . METHODS
3.1 Data
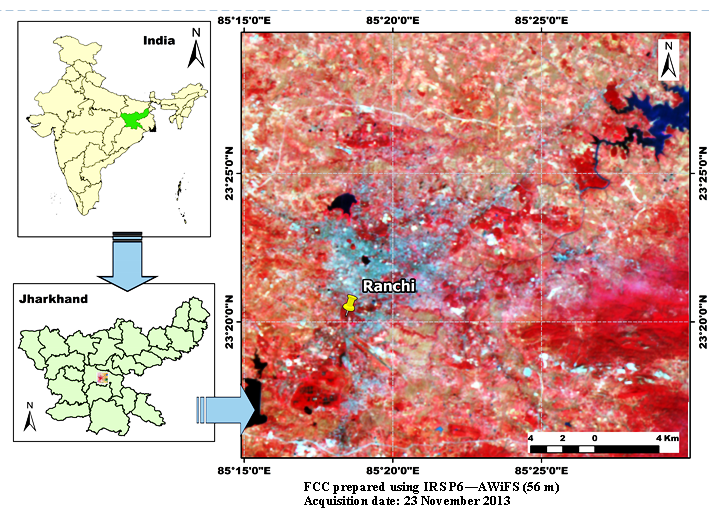
The study has been carried out for the Ranchi urban area. The base map (SOI toposheet 73E/7) is procured from the CGWB, State unit, Ranchi. Annual rainfall data has been collected from, Indian Meteorological Department (IMD), Govt. of India, Pune for estimation of surface runoff. Underground geological profile has been taken extracted from the geology map prepared by Geological Survey of India. The water level and well data for shallow and deeper aquifers has taken from Central groundwater Board (CGWB, 2007), State unit, Ranchi. Cartosat DEM data of 30m spatial resolution and IRS-P6 (AWiFS) satellite dataset of 56m spatial resolution is used for preparation of elevation profile and False Colour Composite (FCC), respectively. This data has been downloaded from Bhuvan-NRSC portal (http://www.bhuvan.nrsc.gov.in/) (Table 1).
Table 1. Specifications of the dataset
|
Data
|
Specification
|
Source
|
|
Topographical sheets
|
Sheet no. 73E/7, Scale = 1:50000
|
Survey of India (SOI)
|
|
Rainfall data
|
Monthly and Annual Rainfall (mm)
|
Indian Meteorological Department (IMD)
|
|
Geological map
|
Sheet no. 73E/7, Scale = 1:50000
|
Geological Survey of India (GSI)
|
|
Well water level data
|
Monthly well water level (m)
|
Central Groundwater Board (CGWB)
|
|
AWiFS Satellite data
|
56m X 56m
|
Bhuvan-NRSC
|
|
Cartosat DEM
|
30m X 30m
|
Bhuvan-NRSC
|
3.2 Methodology
In many parts of India, due to the vagaries of the monsoon, and, in the arid and semi-arid regions, due to the lack or scarcity of surface-water resources, dependence on groundwater has increased tremendously in recent years. Thus, given the possibility of the available groundwater resources to be over-exploited in these areas, it is essential that proper storage and management of available groundwater resources be instituted. Techniques like canal barriers, percolation tanks and check dams, and rooftop rainwater harvesting (RTRWH) methods, etc. can be implemented in both urban and rural environment depending on the feasibility of recharge parameters.
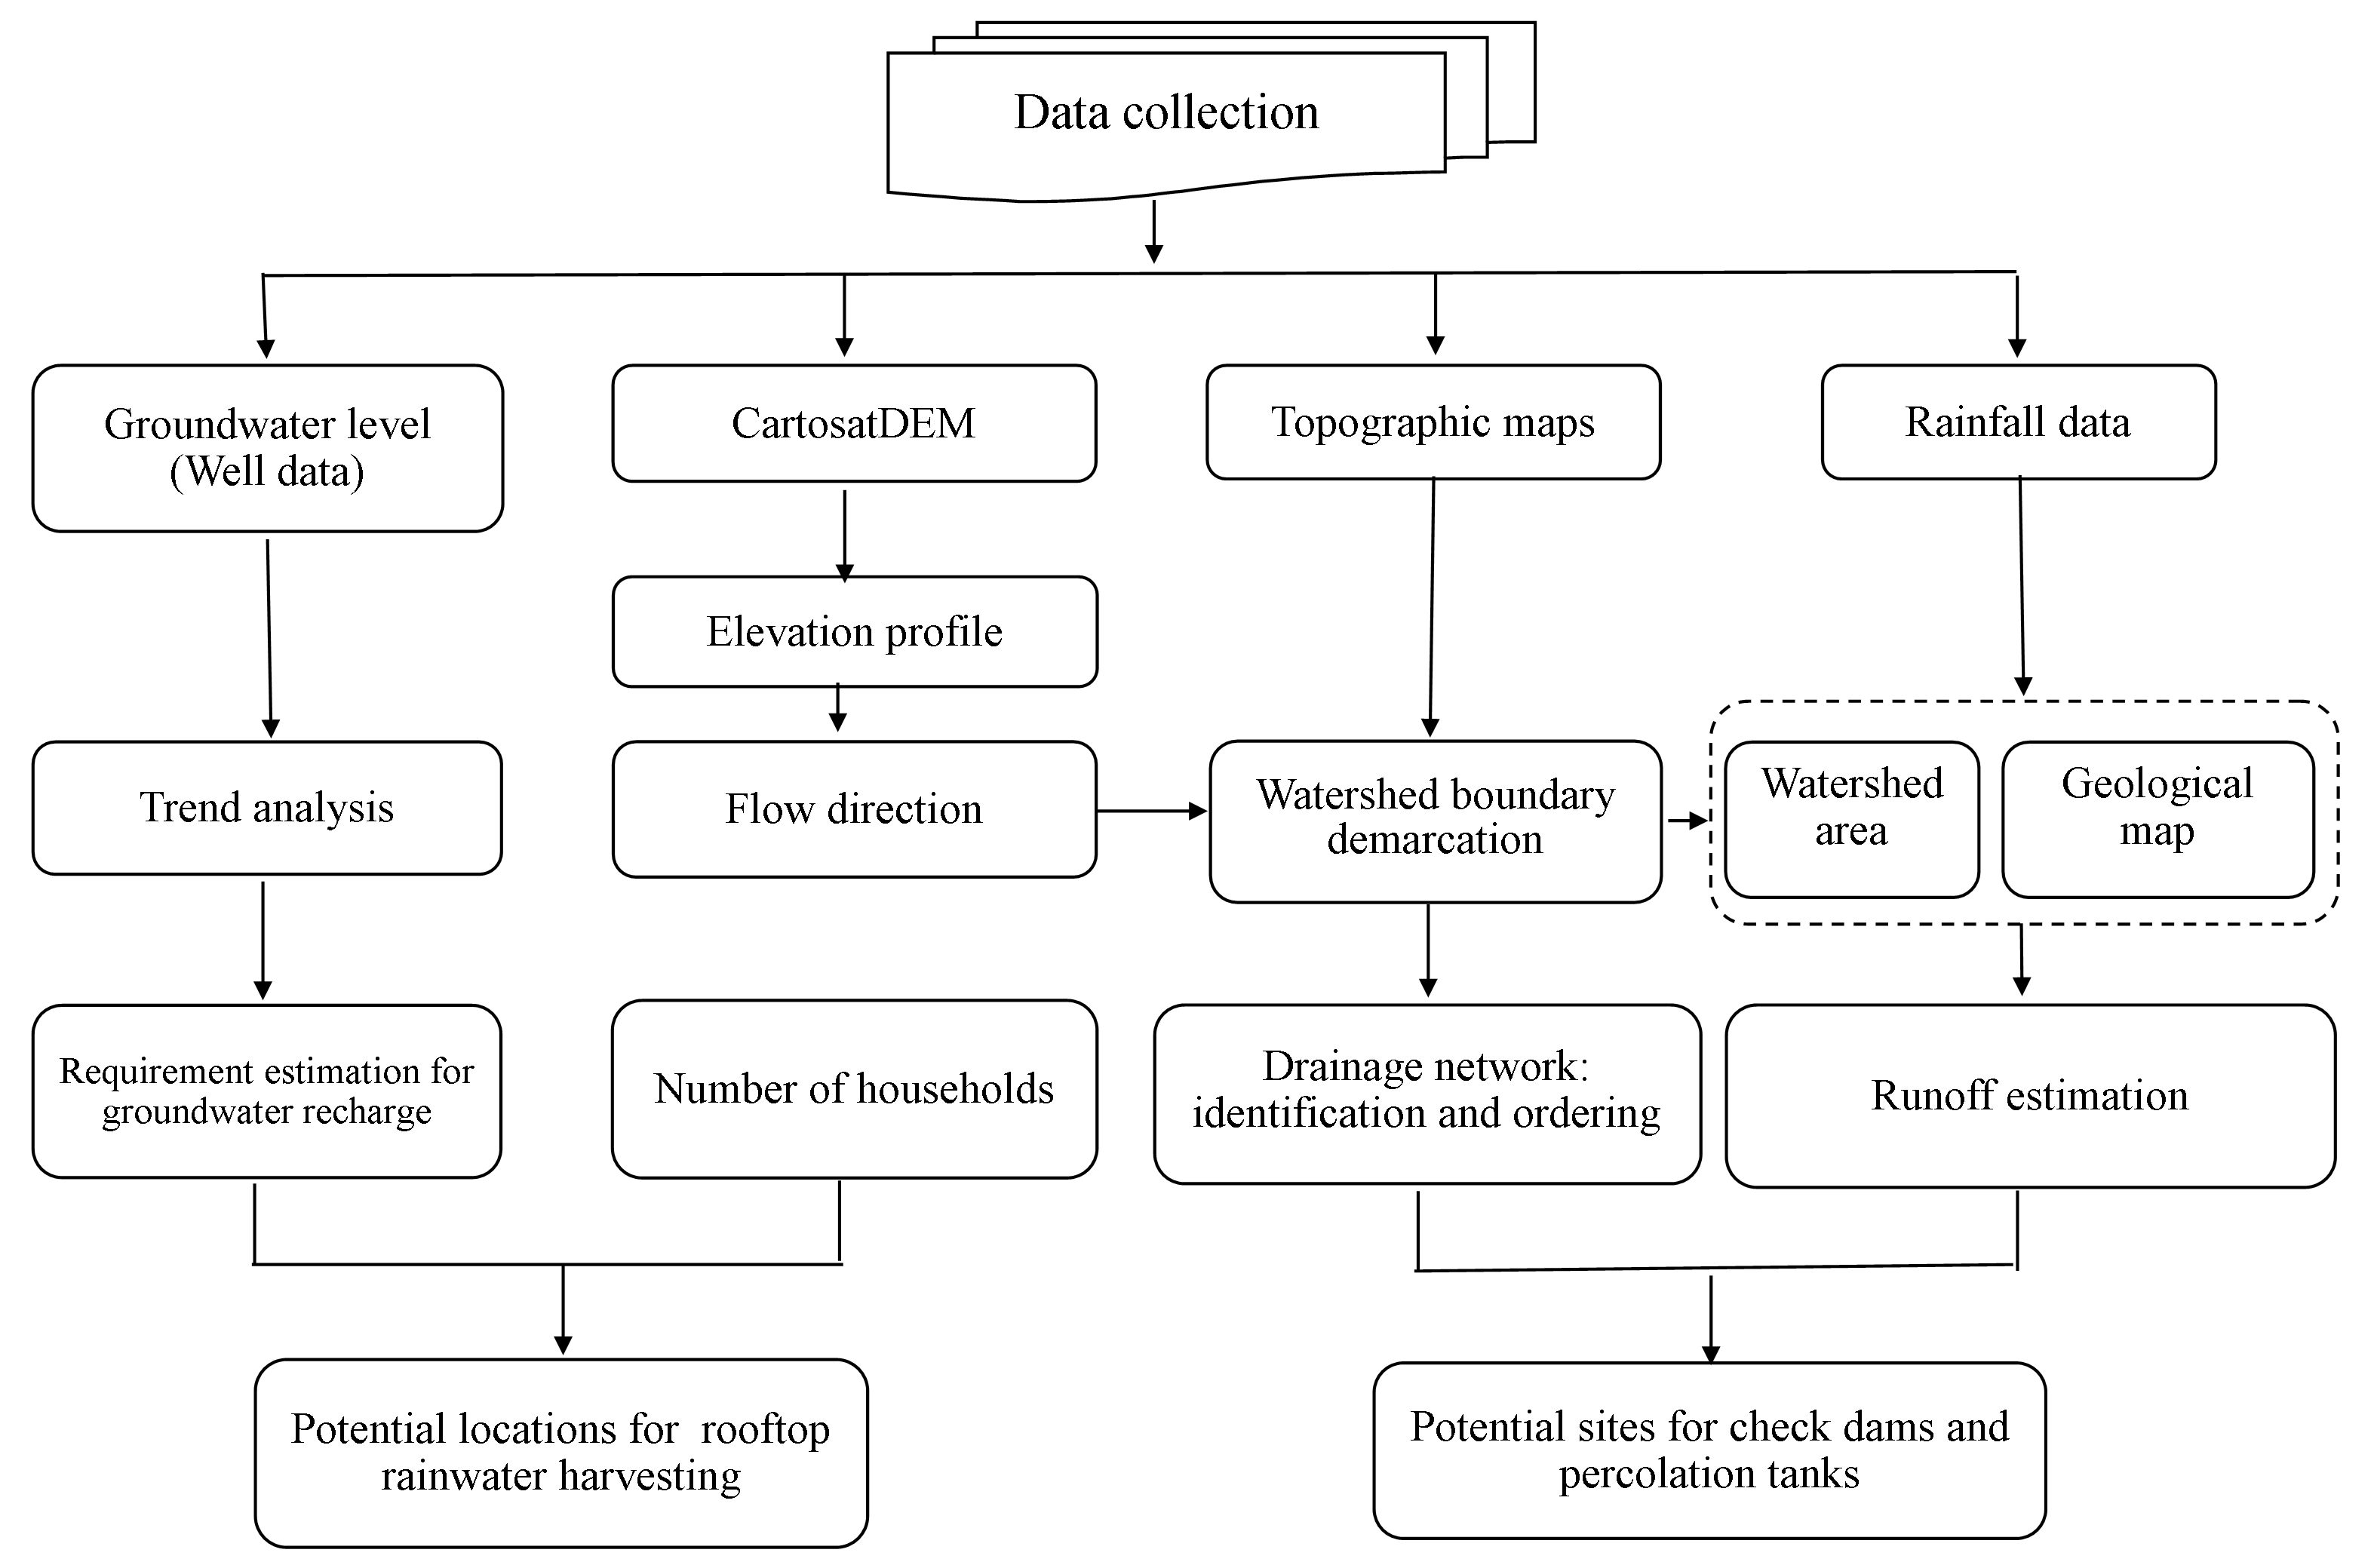
Rooftop rainwater harvesting through existing tube wells can be adopted to recharge the deeper aquifers of urban environment. In areas where the surface soil is impervious and large quantities of roof water or surface runoff is available within a very short period of heavy rainfall, the use of trenches/pits is made to store the water in a filter media and subsequently recharge to ground through specially constructed recharge wells. Whereas in rural areas, gully plug, contour bunding, percolation tanks and check dams are most common rain water harvesting structures constructed across small streams having gentle slope. The site selected should have sufficient thickness of permeable bed (CGWB, 2013). Hence, morphometric analysis has been done for the study area watershed in order to assess the feasibility of artificial recharge structures for Ranchi urban area and its nearby rural environment Figure 2.
Runoff means the draining or flowing off precipitation from a catchment area through a surface channel. It represents the output from the catchment in a given unit of time. We have used empirical equation (1) for the calculation of surface runoff in the various watersheds in the study area.
R = CAP (1)
where,
R = Runoff in million meter cube (mcm)
C = Runoff coefficient, dimensionless
A = Area in sq km
P = Average annual precipitation in meter (m).
4 . RESULTS AND DISCUSSION
4.1 Elevation Profile
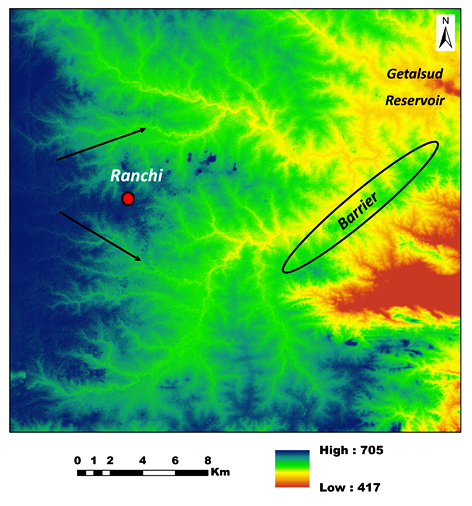
One critical factor that governs the runoff potential is the land gradient followed by slope (Mati and Bock. 2006; Ramakrishnan et al., 2009; Dhakate et al., 2013; Prasad et al., 2014). Hence, Cartosat DEM (30m) has been downloaded and the elevation profile is generated for the Ranchi urban area. It has been found that the elevation profile is decreasing from West to East. Ranchi urban region is found to be situated at a higher elevation creating a plateau region in contrast to the surrounding region. Due to this reason generally the drainage streams seem to be radially outward. Also it has been noticed that, very few drainage streams flow through the city agglomeration. Moreover, the upper catchment streams are splitting apart and taking water away (Figure 3). This may be one of the reasons for getting less water into the rivers through the surface runoff. This DEM layer is further used to visually identify the drainage stream with stream orders.
It has been noticed that some of the drainage streams are not contributing their water to the major stream contributing of Getalsud reservoir, even if they are very close to it. Such scenario can be seen in the Eastern region of the study area. It has been found that, a narrow stretch of elongated elevated region along Northeast (NE)-Southwest (SW) direction is found to a natural barrier (Figure 3) which is restricting the nearby drainage streams to contribute to the main river. Therefore, the Eastern region of study area found to be not suitable for construction of such recharge structures. Hence, it is even more necessary to study and monitor the groundwater conditions of the Ranchi urban area in order to replenish it for the fulfilment of water demand and long term stable water budget.
4.2 Drainage Stream Identification and Ordering
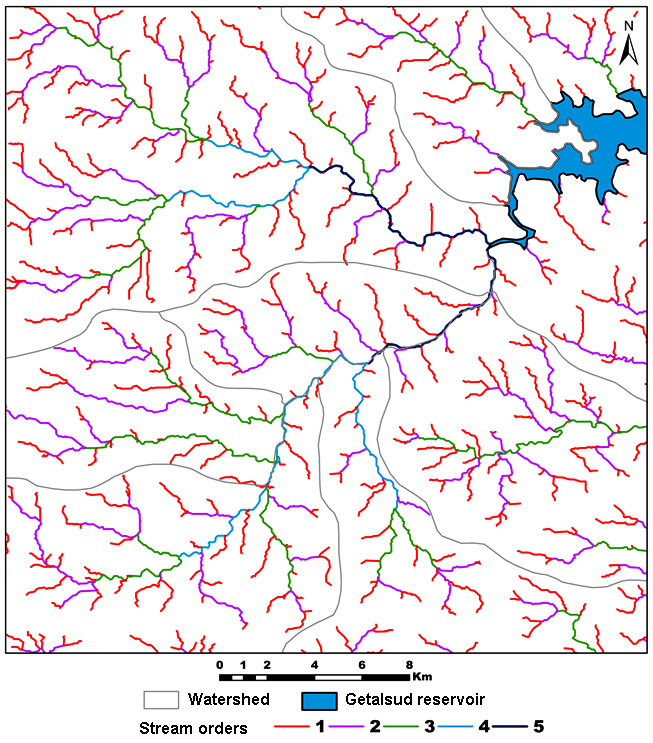
The stream order is a measure of the relative size of streams, whose sizes range from the smallest, first-order, to the largest, the twelfth-order (Amazon basin) "drainage basin". The amount of water they discharge increases as the order of streams increases (CGWB, 2007). The study area is found to be mainly consisting of dendritic drainage pattern, which follows the irregular tree branch shaped pattern over the terrain. Dendritic systems form in V-shaped valleys; as a result, the rock types must be impervious and non-porous (i.e. hard rock terrain) with uniform lithology, and where faulting and jointing are insignificant (Lambert and David, 1998). The path followed by drainage streams are the best indicators for the availability of water. These paths are governed by natural flow of water under gravity and topography and hence, probability of getting water for groundwater recharge is considered as maximum around these drainage streams or river streams.
The order of each stream is calculated from a map of a stream network of drainage map. The drainage map thus obtained is then assigns a numeric orders for the streams (Figure 4). The stream ordering is started by identifying the smallest streams, those have no permanently flowing tributaries. Higher order (greater than 3) streams are perennial streams, which carry water over the year. Therefore, the length and locations are important in terms of delineating the groundwater potential zones (Saraf and Jain, 1993; Krishnamurthy et al., 2000; Agarwal et al., 2004, Shekhar and Pandey, 2014).
4.3 Watershed Demarcation
The drainage map thus obtained is then demarcated to find different watershed in the study area using ArcGIS software as Geodatabase. Nine contributing watersheds has been demarcated in the study area, which includes seven major contributing watersheds viz. Jumar watershed, Sapahi watershed, Sapali watershed, Upper Subaranekha watershed, Lower Subaranekha watershed, Harmu watershed and Doma watershed. The stream flow direction of Getalsud and Raru watershed has been observed as away from mainstream, hence not considered for the further study and listed in the list of non-contributing watershed, as they may not be efficiently feasible for constructing any rainwater harvesting (RWH) structure in consideration for benefiting the Ranchi urban area.
It has been found that the construction of artificial recharge structure is highly suitable in major watershed and not in the minor watershed as most of the area in minor watershed comes under the habitation less area/ forest. Jumar watershed is found to the largest catchment area (206 km2) with maximum number of higher stream orders. The total area of the contributing watershed within the study area is calculated as 576 km2. The area statistics and number of stream orders for each associated watersheds is calculated in the GIS environment, which is shown in the Table 2. Further, the geology map has been overlapped with these layers to decide the permeability constant for the desired underground rock type (Figure 6). Collectively, along with rainfall data the surface runoff has computed in the respective watershed.
Table 2. Contributing watersheds
|
Name of watershed
|
Contributing watershed
|
Area (Km2)
|
Number of stream orders
|
|
2nd
|
3rd
|
4th
|
5th
|
|
Jumar
|
Yes
|
206
|
60
|
30
|
15
|
3
|
|
Sapali
|
Yes
|
52
|
11
|
5
|
0
|
0
|
|
Upper Subarnarekha
|
Yes
|
43
|
7
|
2
|
0
|
0
|
|
Lower Subarnarekha
|
Yes
|
105
|
26
|
6
|
2
|
0
|
|
Sapahi
|
Yes
|
76
|
26
|
11
|
3
|
0
|
|
Getalsud*
|
No
|
46
|
---
|
---
|
---
|
--
|
|
Duma
|
Yes
|
24
|
4
|
2
|
1
|
0
|
|
Raru*
|
No
|
92
|
---
|
---
|
---
|
---
|
|
Harmu
|
Yes
|
61
|
13
|
8
|
1
|
0
|
* Not considered for further analysis.
4.4 Geology
The aquifer geometry is basically decided by the underlain geological arrangement of different rock types. As per the geology map, most part of the study area is placed above granite gneiss. A big patch of older alluvium exists in North and South-Western part of the study area and less than 5% are comprised of Dolerite, Pegmatite vein and Laterite (Figure 6).
4.5 Land Use/Land Cover
The Land Use/Land Cover (LU/LC) map has been prepared using Indian Remote Sensing (IRS) LISS-III (23.5m resolution) dataset. The area has been classified into seven major LU/LC classes i.e. Built-up, Fellow land, Agricultural land, Wasteland, Scrubland, Water bodies and Forest (Figure 7). Due to varying roughness coefficient of different LU/LC classes, the amount of water that flows out as runoff also varies. Both are inversely proportional to each other. Forest covered area has the high roughness coefficient than built-up area and hence, it witnesses less runoff than the built-up area. Almost all the urban area and forest area has expanded over the South-Western and South-Eastern region of the study area, respectively. The agricultural land and fellow lands are uniformly distributed over the entire region.
4.6 Runoff
Since the catchment area or watersheds are small in nature, an empirical equation is used for the calculation of surface runoff in the various watersheds of the study area (Wanielista, 1978 ; FDER, 1998). Equation (1) is used to calculate the average yearly runoff for precipitation where the value runoff coefficient (C) is taken as 0.6 for the study area as per Richard (1998) since most of catchment area is of slightly permeable, cultivated or covered with vegetation whose constant value varies from 0.4 to 0.8 (Table 3). The value of average annual precipitation is calculated from the rainfall data.
Table 3. Richard’s runoff coefficient corresponding to catchment classification
|
Types of catchment
|
Value of C (Richards 1998)
|
|
Rocky and impermeable
|
0.8-1.0
|
|
Slightly permeable
|
0.6-0.8
|
|
Cultivated or covered with vegetation
|
0.4-0.6
|
|
Cultivated absorbent soil
|
0.3-0.4
|
|
Sandy soil
|
0.2-0.3
|
|
Heavy forest
|
0.1-0.2
|
The runoff of each individual watershed has been calculated by multiplying the monthly average rainfall (JJAS - June, July, August and September), runoff coefficient (C) and area of contributing watersheds. It has been found that Jumar watershed receives more than 35 million m3 (mcm) of surface runoff water per year. Table 4 is showing the average water available to the Ranchi urban area in form of surface runoff during the rainy season.
Table 4. Water availability
|
WatershedS
|
Runoff/year (mcm)
|
|
Jumar
|
36
|
|
Sapali
|
9
|
|
Upper Subarnarekha
|
7
|
|
Lower Subarnarekha
|
18
|
|
Sapahi
|
13
|
|
Duma
|
4
|
|
Harmu
|
10
|
4.7 Trends of Groundwater Level
Central Groundwater Board has studied the surface and sub-surface geophysical nature for the Ranchi district and found that many dug wells dry up during summer months in the shallow aquifer. Samples have been collected from the hand pump suggested that the water level in deeper aquifer has also declined over the years, but not recharging by natural water balance phenomenon. Therefore, these wells may get dry in near future (CGWB, 2009). Hence the feasibility of recharging structures have considered for the vulnerable zones of deeper aquifers.
A series of observations of water level have been collected over period to determine whether if water level is suddenly increasing or decreasing (i.e. the level of groundwater is going better or worse). In the study area, trend of 15 exploratory well (deeper aquifer) water level of post monsoon period of three years (2012-2015) is taken into consideration to understand whether water level is inclining or declining. From the result, it has been found that water level in only one deeper well are inclining with 0-1m/year, while other 14 deeper wells show declining nature. The declining deeper wells are characterized into five classes depending upon the water level declining per year. The trend and location of characterized exploratory wells of deeper aquifer have shown in Table 5 and Figure 8, respectively.
Table 5. Trends of groundwater level in deeper aquifers
|
Declining
|
Inclining
|
|
0-1m/yr
|
1-2m/yr
|
2-3m/yr
|
3-4m/yr
|
4-5m/yr
|
0-1m/yr
|
|
Ranchi College
|
HEC Sector II
|
NIFT, Hatia
|
Kanke High School
|
HHC Harmu
|
Jamchuwan
|
|
Kanke Chowk
|
Forest Nursary
|
Aerodram Hinoo
|
Mlitary Farm Namkum
|
|
|
|
Sukurhutu
|
|
JVM Shyamli Doranda II
|
|
|
|
|
Bukru
|
|
RIMS Hostel
|
|
|
|
|
Ormanjhi
|
|
|
|
|
|
Table 6. Volume of water required for recharge
|
Contributing watersheds
|
Water required for recharge (mcm)
|
Water availability
|
|
mcm
|
%
|
|
Jumar
|
128.1
|
35.6
|
27.79
|
|
Doma
|
41.78
|
7.9
|
18.91
|
|
Upper Subaranekha
|
14.35
|
7.4
|
51.57
|
|
Lower Subaranekha
|
54.89
|
18.2
|
33.16
|
|
Harmu
|
77.75
|
10.5
|
13.50
|
|
Sapahi
|
40.8
|
13.1
|
32.11
|
|
Sapali
|
42.1
|
9.1
|
21.62
|
4.8 Need of Groundwater Recharge
Water requirement of the study area is defined as the amount of water required to attain the long term annual average water level i.e. 3m for Ranchi urban area. In the present study, the contours of watershed monitoring station having same water level has been prepared. The area of respective contour interval in the various watersheds in the study area is obtained in the ArcGIS environment. The area of contour lines below 4m is neglected, as the fluctuation below these contour lines will be one or less than. Fluctuations in groundwater level from the long-term average water level (3 m) has multiplied with the area of particular contour interval in each contributing watershed in order to calculate the water requirement in the various watersheds. It has been found that, around 90 mcm water is still required for recharge in Jumar watershed to bring the water level up to its targeted level. Harmu watershed is found to be in the worst condition in terms of availability of runoff water. Hence, it requires urgent recharge of groundwater aquifers followed by Doma watershed (18.91 %) and Jumar watershed (27.79%), respectively (Table 6).
Table 6. Volume of water required for recharge
|
Contributing watersheds
|
Water required for recharge (mcm)
|
Water availability
|
|
mcm
|
%
|
|
Jumar
|
128.1
|
35.6
|
27.79
|
|
Doma
|
41.78
|
7.9
|
18.91
|
|
Upper Subaranekha
|
14.35
|
7.4
|
51.57
|
|
Lower Subaranekha
|
54.89
|
18.2
|
33.16
|
|
Harmu
|
77.75
|
10.5
|
13.50
|
|
Sapahi
|
40.8
|
13.1
|
32.11
|
|
Sapali
|
42.1
|
9.1
|
21.62
|
4.9 Groundwater Recharge Techniques
4.9.1 Check dams and Percolation tanks (CD/PT)
Most of the shallow water is wasted due to evaporation, climate, infiltration, anthropogenic factor etc. ponds and pans, dams, terracing, percolation tanks, and nala bunds are the most common types of RWH techniques in ASARs (Oweis et al., 2012). Many researchers have suggested that watershed regions having annual rainfall less than 1000 mm, slope less that 15% and catchment less than 25 hector are most suitable for constructing check dams and percolation tanks (Gupta et al., 1997; Mati et al., 2006; Ramakrishnan et al., 2008, 2009; Weerasinghe et al., 2011; Al-Adamat et al., 2012). Therefore, 75% of water availability is taken in the consideration to construct check dam/ percolation tank. In which, 70% of efficiency is concern in the present study. As per CGWB guidelines, 60% of efficient water has been used for the construction of check dam while 40% has been used for the construction of percolation tank. The total number of check dam/percolation tank (CD/PT) build in the particular watershed is calculated by dividing total volume of water available to construct check dam or percolation tank by volume of check dam or percolation tank, respectively. The total number of check dam/percolation tanks can be constructed in each watershed is shown in the Table 7. Second order streams are found to the suitable area to construct check dam while 3rd order streams are the suitable area to construct percolation tank (Figure 9).
##table|117#
4.9.2 Rooftop rainwater harvesting (RTRWH)
From the trend of deeper water, it is found that the abnormal declining of water level is noticed in six major places in Ranchi urban area. They are marked down in polygon feature in ArcGIS and the total number of habitation present has been counted in those places from the referenced toposheet (73E/7). The runoff availability is found to be very less in such reasons (especially in Harmu region) due to slope and topographic gradient; hence, construction of check dams/percolation tanks would not possible in these regions. Therefore, the study have suggested to implement the rooftop rainwater harvesting system (RTRWH) such regions as it is the only possible solution to recharge the groundwater level of that regions. The high priority zones identified as per urgent need of groundwater recharge with respect to household water requirement have shown in Figure 10. The number of household information has mentioned in Table 7.
Table 7. Number of check dams/percolation tanks suggested for construction and efficiency of rooftop rainwater harvesting
|
Contributing watersheds
|
Water required for recharge (mcm)
|
Water availability (mcm)
|
Check dam/ PT ( 70% efficiency of 75% of water availability)
|
No. of Check dams/PT that can be made
|
RTRWH
(70% efficiency of 75% of water availability)
|
Households
|
|
Check Dam (60% Efficiency)
|
PT (40% Efficiency)
|
Check Dam
(30 TCM )
|
PT
(188 TCM)
|
|
Jumar
|
128.1
|
35.6
|
5.607
|
3.738
|
186
|
19
|
9.345
|
6435
|
|
Doma
|
41.78
|
7.9
|
1.244
|
0.829
|
41
|
4
|
2.073
|
754
|
|
Upper Subaranekha
|
14.35
|
7.4
|
1.166
|
0.777
|
38
|
4
|
1.942
|
4649
|
|
Lower Subaranekha
|
54.89
|
18.2
|
2.866
|
1.911
|
95
|
10
|
4.777
|
9786
|
|
Harmu
|
77.75
|
10.5
|
1.636
|
1.1
|
54
|
5
|
2.756
|
8791
|
|
Sapahi
|
40.8
|
13.1
|
1.81
|
1.21
|
60
|
6
|
3.018
|
1376
|
|
Sapali
|
42.1
|
9.1
|
1.433
|
0.956
|
47
|
5
|
3.64
|
1145
|


 ,
Anuj Prakash Kushwaha 1
,
Anuj Prakash Kushwaha 1