Large-scale industrialization in the southern part of Gujarat is characterized by regional pollution of soil and water resources.
The chemical composition of soil, particularly its metal content is environmentally important. They accumulate in food stuff and ultimately influence the human health.
Analysis of soil samples is an excellent method to monitor heavy metal pollution because anthropogenic heavy metals are deposited generally on top soils.
Physico-chemical properties such as texture, cation exchange capacity, total carbonate and organic matter content, as well as the percentages of the sand, silt, and clay fractions have been examined.
Correlation analyses of the soil phsico-chemical properties with the heavy metal content gives an judgment of how this properties has helped in determining the dispersion of heavy metals in soil and leading to the environmental impact.
Abstract
Extensive industrialization in the southern part of Gujarat is characterized by regional pollution of soil and water resources. In view of this, the present study has been undertaken in Ankaleshwar, one of the biggest industrial townships of India. About, 25 surface sediment /soil samples were collected from top 10 cm representing entire study area and were analyzed for heavy metals by using X-ray fluorescence spectrometer (XRF). The heavy metals concentrations were compared with the standard shale to find out pollution index (PI), results shows the significant enrichment for arsenic, moderate enrichment for Pb and minimal enrichment for metals in descending order as Fe>Mn>Cr>Ni>Co>Zn>Cu>Mo. Physico-chemical properties such as texture, cation exchange capacity, total carbonate and organic matter, as well as the percentages of the sand, silt, and clay fractions have been examined. It is observed that heavy metals like Ni, Cu, Zn, and Mo show a positive correlation with the silt size fraction. Similarly, Mn, Cr, As, and Pb show positive correlation with clay size fraction. Chemical properties like EC, CEC and organic matter have control over majority of heavy metals. High correlation with these properties suggests that higher ionic conductivity soils have high heavy metal content. The effect of these properties can be arranged in descending order as follows: EC >OM > Clay % >Silt % > CEC.
Keywords
Pollution Index , Enrichment , Physico-chemical , Heavy Metals , Ankaleshwar , Chemical properties , Industrial area
1 . INTRODUCTION
Large-scale industrialization in the southern part of Gujarat is characterized by regional pollution of soil and water resources. In view of this, the present study has been undertaken in Ankaleshwar, one of the biggest industrial townships of India. The Ankaleshwar Industrial Estate (AIE) is characterized by industrial and urban distends reclaiming a large extent of fertile alluvial flood plains of Narmada River in Gujarat state of India. AIE is essentially a chemical domain, which is a part of the industrial ‘Golden Corridor’ housing 171 industrial estates created by the Gujarat Industrial Development Corporation (GIDC). AIE includes an array of chemical, fertilizer, paint, dyes, glass, pharmaceutical and other allied industries, which have impacted the local environment to a great extent. Discovery of hydrocarbons in the area has further hastened the pace of urbanization and industrialization with concomitant increase in environmental problems. Although there is some information generated by the local NGO’s about levels of heavy metals in industrial effluents, there is no scientific data available on the dispersion of metals in the soils.
Soil samples are an excellent media to monitor heavy metal pollution because anthropogenic heavy metals are deposited generally on top soils. Generally the distribution of the heavy metals depends on the parent material, climate and very much on the soil properties i.e. texture and classification. The chemical composition of soil, particularly its metal content is environmentally important, because toxic metal can
reduce soil fertility, and can increase input to food chain, which accumulate in food stuff and ultimately influence the human health (Krishna et al., 2007). Therefore, depending on environmental conditions, soils can be a sink or a source for metals. A common approach to estimate the anthropogenic impact on sediments is to calculate a normalized enrichment factor also called as pollution index for metal concentrations above uncontaminated background levels. While the use of average earth or crustal values are the norm as reference concentrations, local baseline or background levels are more recent choice, carrying the advantage of reducing the effect of natural geochemical variability (Abrahim and Parker, 2008) so the tertiary shale from the study area was used as background value.
The examination of particle size distribution is an important approach for understanding the environment and hydraulic conductivity of soil and the process of heavy metal fortification. In an attempt to understand of the distribution the pollutant elements in the sediments and to know the relation of the measured elements with some physic-chemical properties such as texture, cation exchange capacity, total carbonate and organic matter content, as well as the percentages of the sand, silt, and clay fractions have been examined. The distribution of the metals in different size fractions reflect the differences in mineral compositions, surface chemical properties, specific surface area, and surface free energy of sediment, which are significantly important to understand the mechanisms of metal adsorption, desorption, and transportation in nature (Chen et al., 2000; Thuy et al., 1999). The primary objective of the present study was to assess the degree of pollution i.e Pollution Index by calculating enrichment of metals above the standard. In an effort to obtain better understanding of distribution of the pollutant elements in this soils the relation of the measured elements with some physico-chemical properties of the soil such as CEC, total carbonate, and organic matter content, as well as the percentage of sand, silt, and clay fractions have been examined.
2 . STUDY AREA
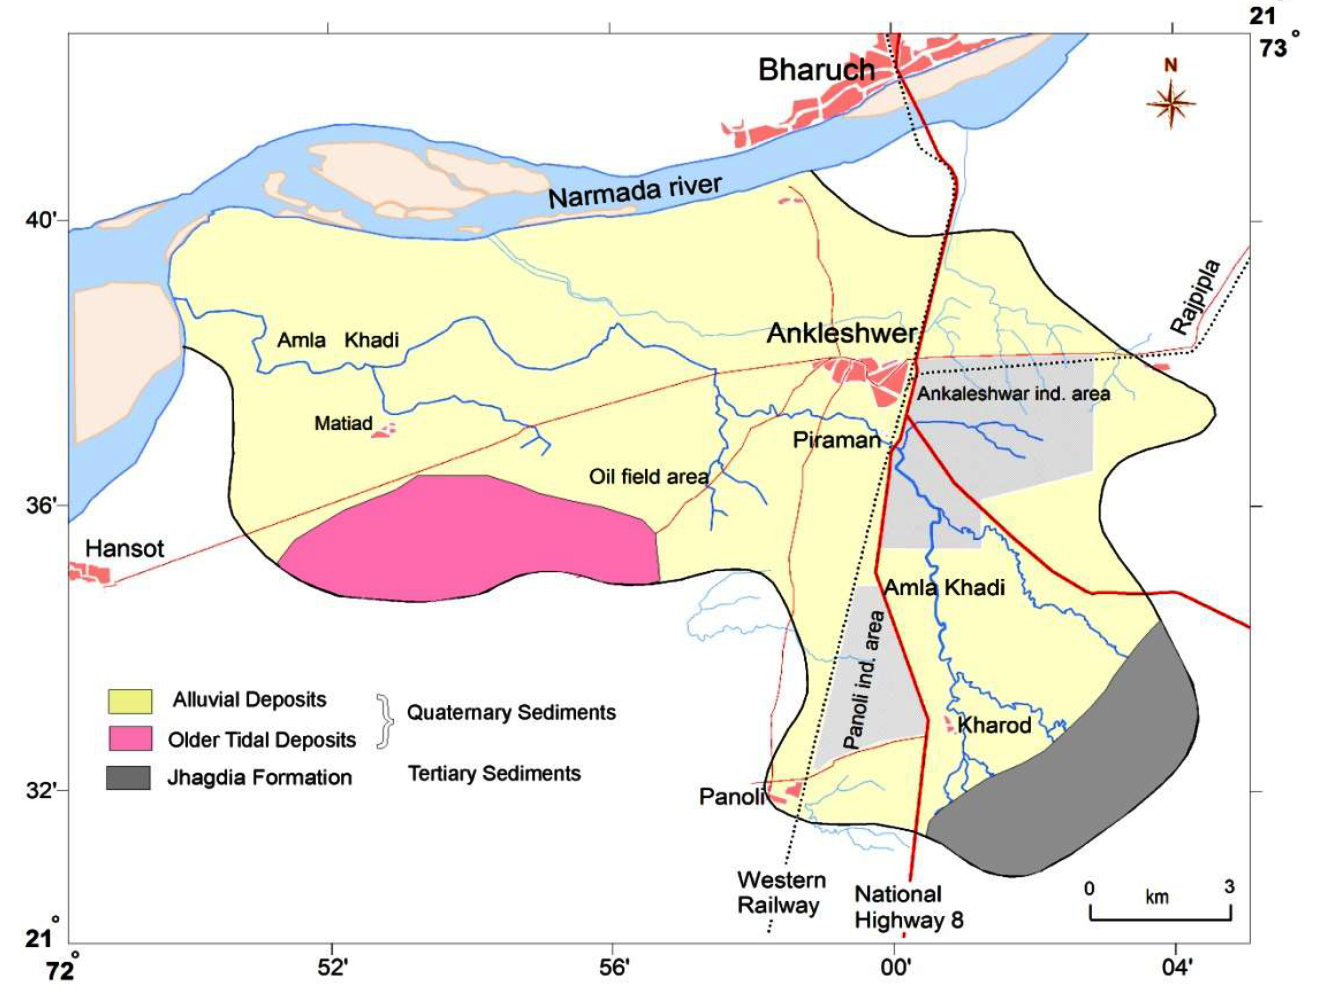
The study area, Ankaleshwar industrial Estate (AIE) is located in Bharuch district of south Gujarat in Western India (latitudes 21⁰ 30ʹ N and 21⁰ 42ʹ N and longitudes 72⁰ 49ʹ E and 73⁰ 05ʹ E). It is drained by a small third-order stream, Amla Khadi with watershed area of approximately 240 km2. Amla Khadi is one of the tributaries of Narmada River that originates in the lower reaches of alluvial flood plain of Narmada (Figure 1). The area receives an average annual rainfall 860 mm recorded at Bharuch. It is also known for rich agriculture endowed with crops of cotton, horticulture and vegetables due to fertile alluvial soils and perennial availability of water. The Amla Khadi stream along its length is divisible into three distinct zones viz. (1) source region with dry stretch, (2) middle ponding segment and (3) lower dry reach. Ankaleshwar Industrial Estate (AIE) is located in upper and middle reaches. The stream segment in the lower reaches runs foamy red with a pungent foul smell as it carries only industrial effluents with toxic heavy metal concentrations several thousand times the permissible limits. During monsoon the stream overflows submerging the surrounding lands under polluted waters (Santillo et al., 1996). The AIE incorporates two industrial zones: (1) Ankaleshwar industrial area (AIA) and (2) Panoli industrial area (PIA). Both these sectors together comprise over 3,000 industrial units; over half of which are chemicals, manufacturing dyes, paints, fertilizers, pharmaceuticals, industrial chemicals, pulp and paper and pesticides (Bruno, 1995; CPCB, 1996). Aligned parallel to National Highway No. 8 (Mumbai – New Delhi) and Western Railways, Ankaleshwar is one of the biggest industrial townships in India. The members of the AIE generate between 250 and 270 million liters/day of liquid waste and ~50,000 tonnes of solid waste annually (Bruno, 1995). Of this, 58% arises from the manufacture of dyes and dye intermediates, 19% from drugs and pharmaceuticals, and 5% from inorganic chemicals (CPCB, 1996). This set up in the basin provides an ideal site to monitor the interplay between the sources of heavy metals and the response of aqueous system to them.
Figure 1. Study area: Ankaleshwar Industrial Estate (with Geology)
3 . GEOLOGY
The geology of the area is characterized by Quaternary alluvium. Alluvial sediments have been differentiated on the basis of their depositional environment by GSI (2002). They comprise older tidal flat and tidal marsh deposits of Rann Clay Formation and younger tidal flat deposits (spit/bar and shoal) of Mahuva Formation, representing marine environment. The flood plain deposits of Katpur Formation represent fluvial environment of deposition GSI (2002). The AIE belongs to Katpur Formation wherein low-lying flood plain south of Narmada exhibits poorly developed natural drainage and very low relief (Figure 1). It forms a part of regional alluvial deposits of Late Pleistocene to Holocene in age (Bhandari et al., 2001; Chamyal et al., 2002) through which the stream Amla Khadi drains. The saline wastelands and swampy areas of broad estuarine mouth bar of river Narmada (Alia bet) and older Tidal flat/marsh deposits mark the western boundary of this plain. Towards the South and East, the plain is bounded by uplands comprising rocks of Tertiary Sequence (Lower Eocene to Pliocene) and Deccan Volcanics (Chamyal et al., 2002).
4 . MATERIALS AND METHODS
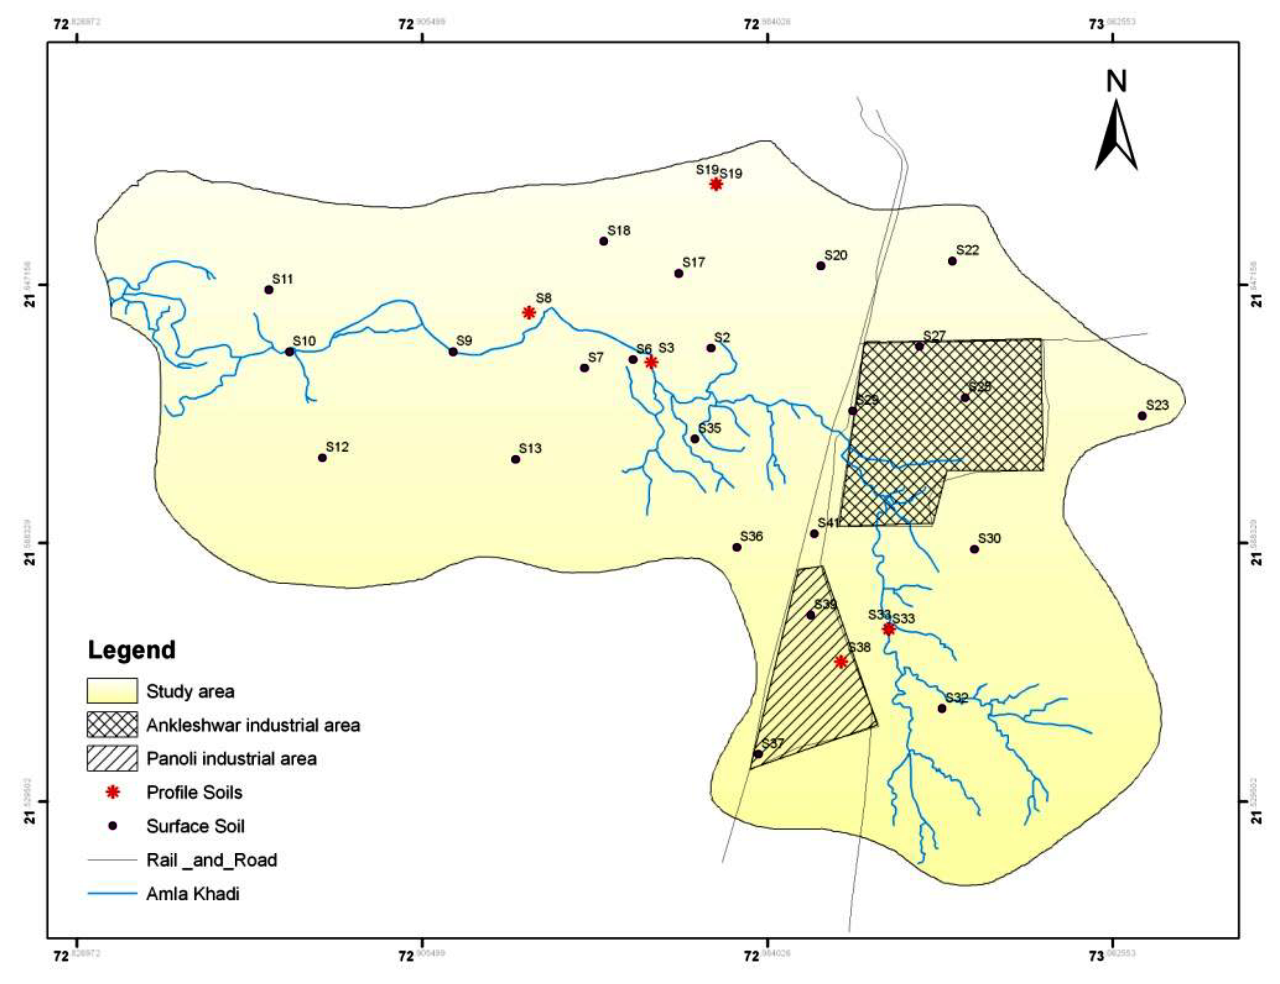
Since the purpose of the present study was to delineate spatial variations in the toxic metals and to identify their possible sources (industrial/urban, etc.) impacting the surface environment, the sampling plan was designed accordingly. Random sampling technique was adopted for the selection of surface soil/sediment samples and due consideration was given to represent industrial, urban and oil field areas besides highways and polluted stream stretches. However, overall 25 surface samples could be collected from the industrial and oilfield areas due to constraints in the field (Figure 2).
Figure 2. Soil/sediment sample locations
Undisturbed surface soil/sediments from 0 to 15 cm depth were collected in March 2006, to study the anthropogenic sources of pollutants which normally contaminate the upper layer of soil/sediment. In case of natural abundance of the metals the concentration at all its depths is equivalent. Only grabs that showed no evidence of leakage or surface disturbance were retained; the top 3 cm were removed so to avoid the surface contamination. The soils/sediment were collected in polythene self-locking bags and stored, use of metal tools were avoided and plastic spatula was used for sample collection, (Figure 2) shows the soil/sediment sample location map and its distribution in study area. Due care was taken to avoid contamination of samples during handling.
5 . ANALYTICAL METHODS
In the laboratory the samples were kept in darkness at 4ºC until processing and analysis. The samples were dried at normal room temperature. Particle size analysis was performed on sedigraph. Samples were sieved at (< 0.002mm) fine size fraction. Analysis of this fraction is normally carried out in sediment studies because clay and silt particles generally contain the highest concentrations of pollutants and are most readily transported in suspension in natural waters (Fytianos and Lourantou, 2004). The fine soil samples were used for the analysis by X-ray fluorescence the powder method was used to determine the elemental concentrations. The result obtained from the analysis performed on the sedigraph was plotted in the ternary diagram of soil by USGS in Rock ware software to get the textural classification. The collected samples have been analyzed for, total organic matter (% TOM), cation exchange capacity (CEC) and total carbonate content (% CO3) based on the standard published methods (Hesse, 1972; Cotteni et al., 1982; Loring and Rantala, 1992). Cation exchange capacity was determined by using sodium acetate and ammonium acetate solutions (Hesse, 1972). The total carbonate content was determined by chemical titration method (Cotteni et al., 1982); and the organic matter content was determined by oxidation with potassium dichromate (Loring and Rantala, 1992 ).
To quantify the magnitude of pollution by different metals, pollution index was calculated for soil/sediments in study area. The ratio of heavy metals to its original background values may directly reveal the environmental quality and should be used as an index of evaluating the geochemical imbalance, thus elevating trace metal concentrations, which normally are attributed to the anthropogenic activities (Birch and Taylor, 1999). The pollution index is calculated as:
\(PI = C_{i} /S_{i}\)
Where, \(PI\) is heavy metal contamination index, \(C_i\) is measure content of metal and \(S_i\) is the background value. Pollution Index according to Sutherland (2000), five contamination categories are generally classified on the basis of their enrichment factor (Table 1).
Table 1. Pollution Index according to Sutherland (2000), five contamination categories are generally classified on the basis of their enrichment factor.
Classes (EF)
Descriptions
< 2
Depletion to minimal enrichment, suggestive of no or minimal pollution.
2 to5
Moderate enrichment
5 to 20
Significant enrichment
20 to 40
Very high enrichment
> 40
Extremely high enrichment
6 . RESULTS
6.1 Enrichment of Heavy Metals
The values of pollution index were obtained and for the better understanding the dispersion of the heavy metals in surface soils of the study area by categorizing them into 8 distinct classes. Upper dry stretch, Middle pounding stretch, Lower stretch of Amla Khadi, The Ankaleshwar Industrial area (AIA), Panoli Industrial area (PIA), Oil Field area, Narmada bank sediment and Stream sediments of lower stretch.
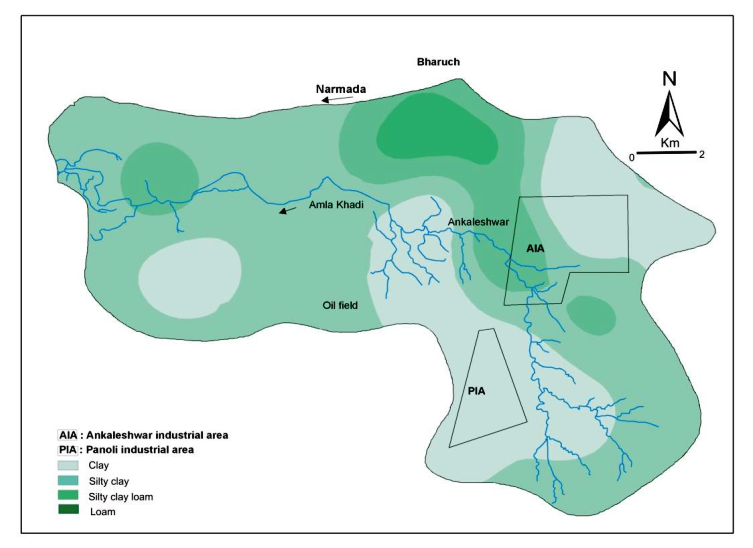
Figure 3. Surface soil texture: spatial distribution
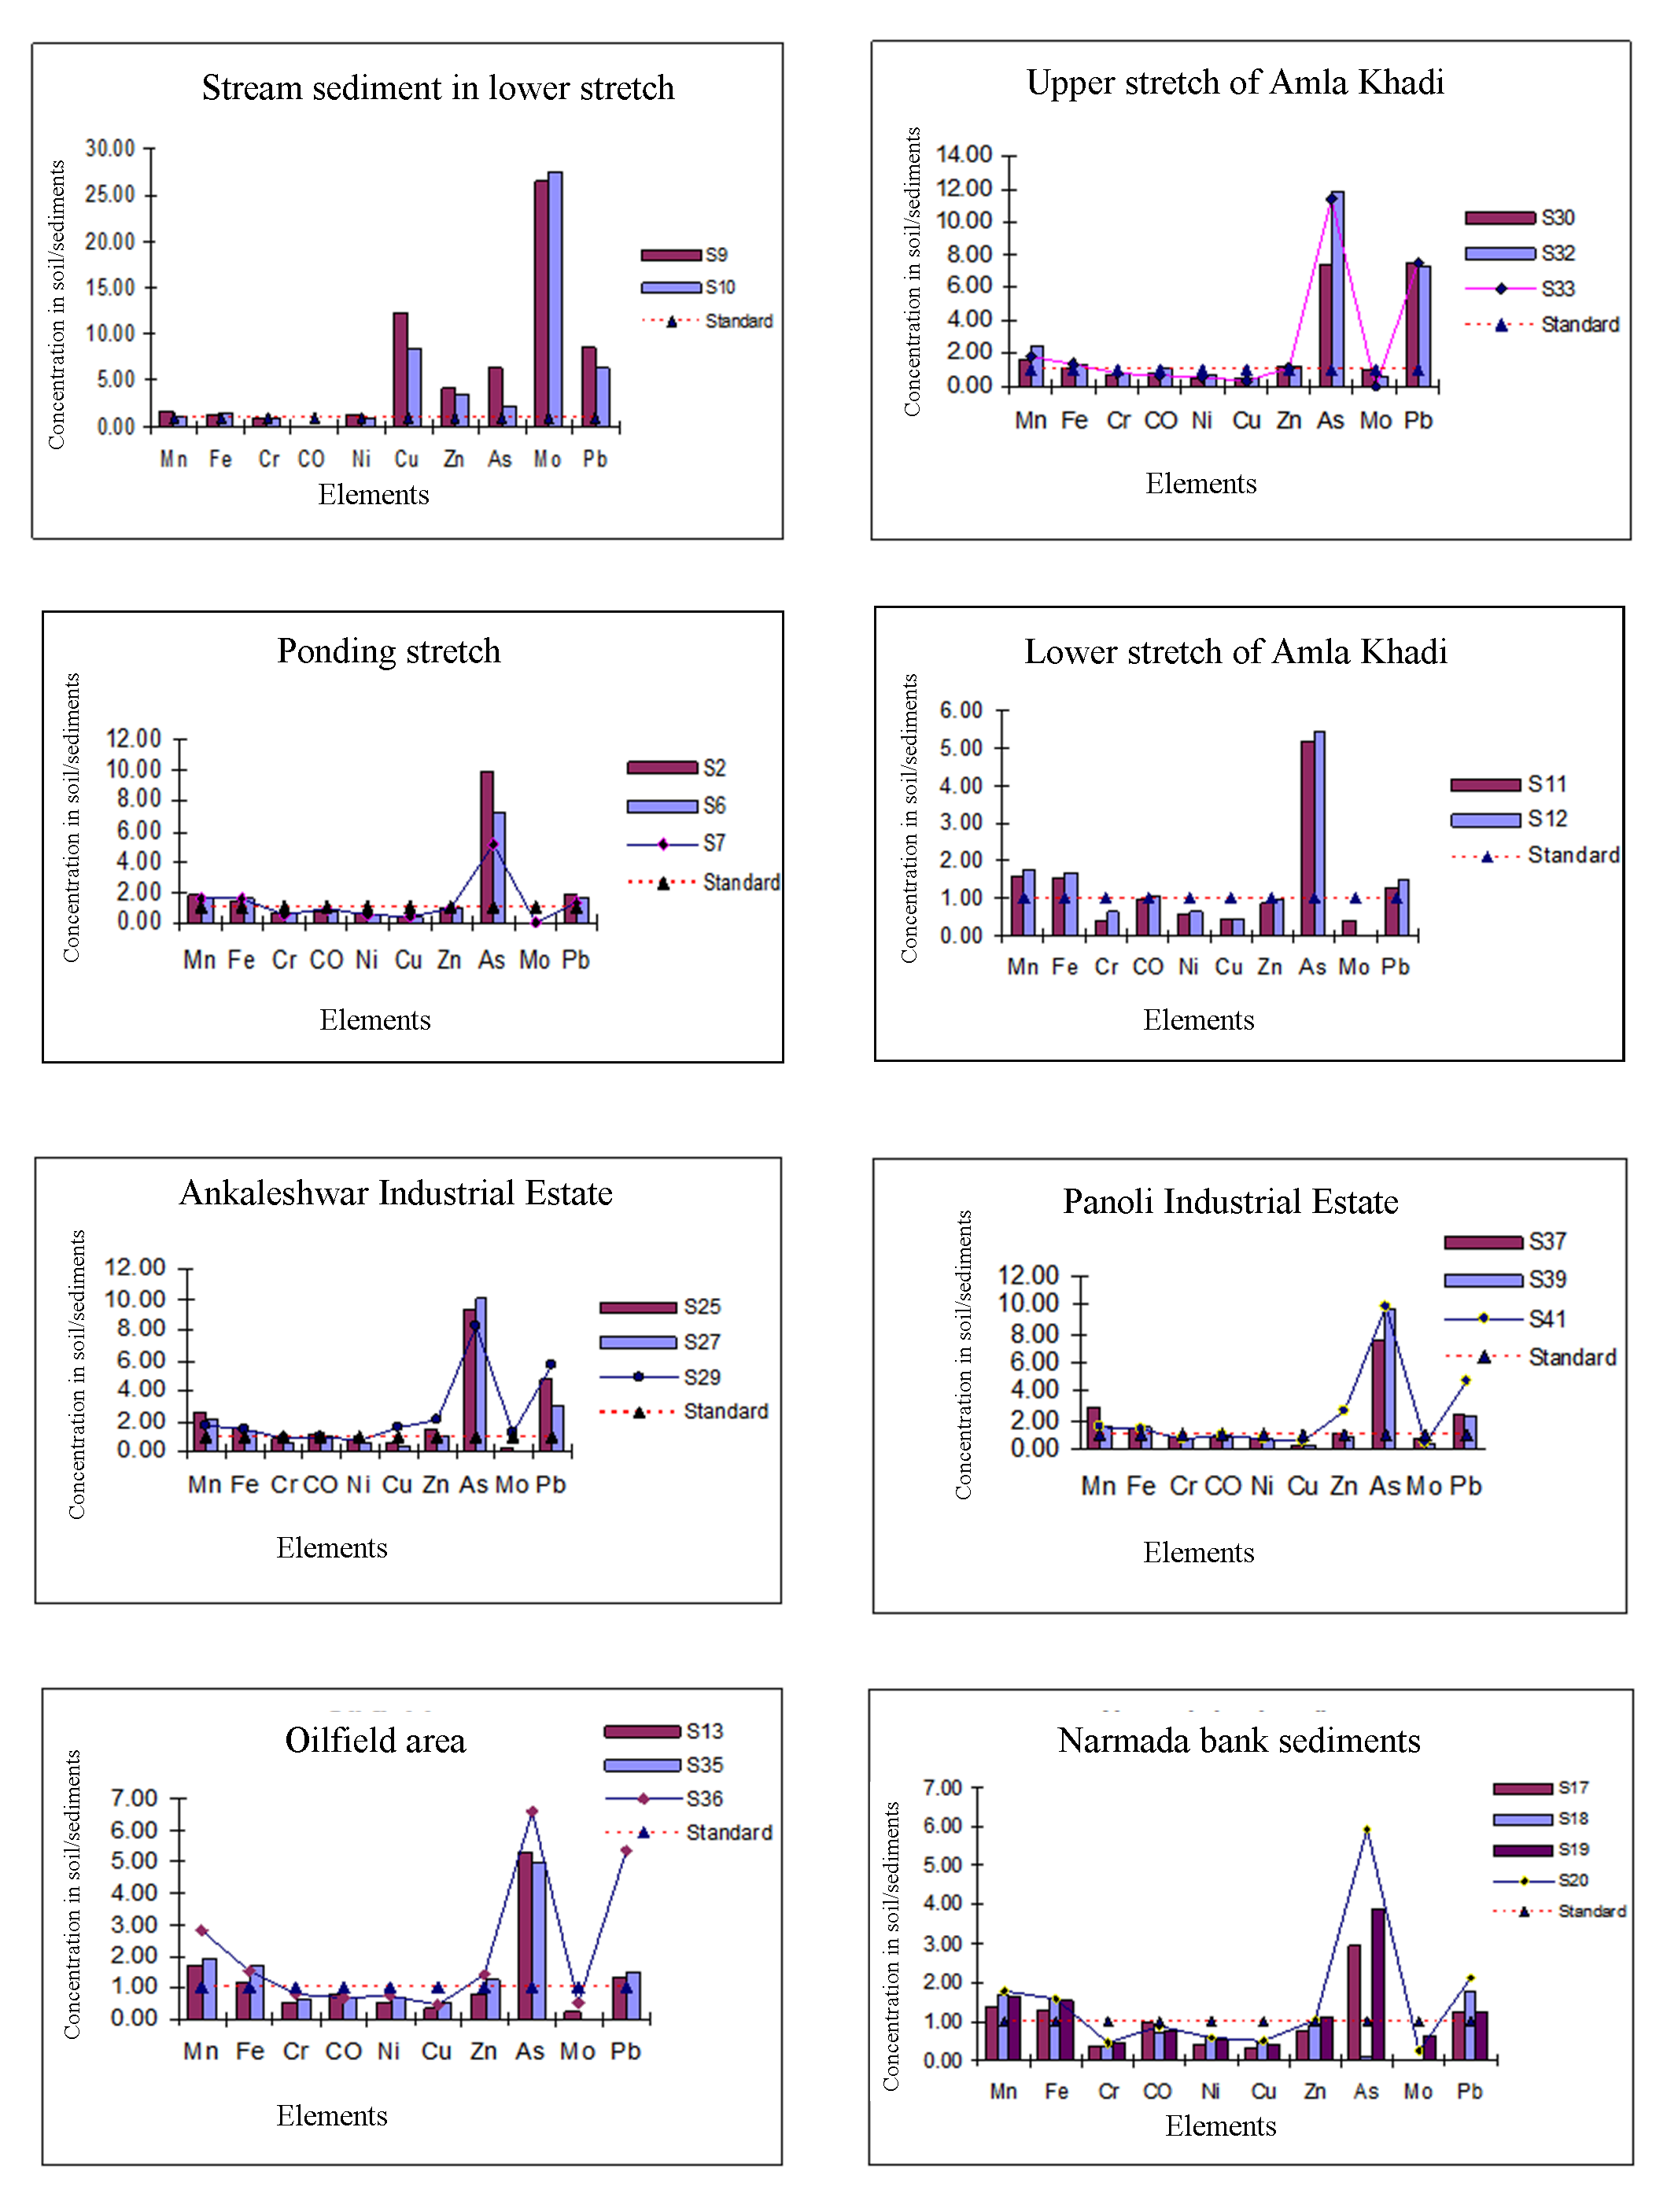
The samples collected representing sample nos. S9 and S10 from lower stretch of the Amla Khadi is very highly polluted (mud sample), pollution index values for Mo vary from 20 to 40 EF, which is very highly enriched class followed by EF values of 5 to 20 for Cu, As, and Pb with significant enrichment and moderate enrichment values are seen for metal, Zn.
In upper dry stretch (samples: S30, S32, S33) the dispersion of the metals shows highest arsenic values followed by Pb>Mn>Mo (Figure 4). The pollution index shows moderately enriched values for Mn and significant enrichment for As and Pb. In the middle pounding stretch (samples: S2, S6, S7) depicts the same pattern (Figure 4) of increase in metal content As>Pb>Mn>Fe and instead of Mo, Fe is present here. The pollution index values reveal significant enrichment for As and moderate for Pb. Lower stretch of Amla Khadi displays (samples: S11 and S12) the same trend of enrichment of heavy metals with values in descending order as As > Mn > Fe > Pb (Figure 4) with moderate enrichment for the As. The soil samples from Ankaleshwar and Panoli industrial area show increase in content of metals (Figure 4) As > Pb > Mn > Zn in both Ankaleshwar and Panoli industrial areas. This pattern of increase in the heavy metals can therefore be considered as characteristic of industrial zone. In oil field area, the increase in metal content is As > Mn > Fe > Pb (Figure 4) revealing very high concentration of the metals that are 2 to 10 times the actual concentration in the standard shales. The pollution index in this case shows moderate enrichment for As. The heavy metals in hierarchial order as As > Pb > Mn > Fe are seen (samples: S17, S18, S19 and S20) from the Narmada bank with very high concentrations as compared to the standard, background values in shale (Figure 4) Besides pollution index moderate enrichment for metals Pb and As is noticed.
Figure 4. Comparison of heavy metals with tertiary shale values
6.2 Controlling Parameters of Soils:
The size fraction in the present study area comprises of alluvial Quaternary deposits and belongs to a class of clay to clayey loam and silty clay. The soil samples were grouped into eight groups specifying the area which they represent (Table 2).
Table 2. Surface soil/sediment grain size data
Area
Soil samples
Sand
Silt
Clay
Soil texture
Urban and
S2
17
41
42
clay
lower stretch
S6
11
46
43
silty clay
S7
14
51
35
silty clay/silty clay loam
S9
10
54
37
silty clay
S10
9
65
26
silty clay loam
S11
16
60
24
silty clay loam
S12
6
33
61
clay
S13
10
49
40
silty clay
Narmada bank
S17
28
45
28
clay loam
S18
8
65
27
silty clay loam
S19
30
53
18
loam
S20
30
41
29
clay loam
S22
35
26
39
clay
AIA
S23
12
37
52
clay
S25
10
37
53
clay
S27
20
41
39
clay
S29
25
41
34
clay loam
Upper stretch
S30
9
34
57
clay
S32
26
40
33
clay loam
S33
14
54
32
silty clay loam
S35
6
33
60
clay
PIA
S36
14
33
52
clay
S37
12
33
55
clay
S39
7
31
61
clay
S41
11
37
41
clay
The sediment samples from industrial area are mostly clay and silt and show transition to clayey loam, soils from oil field are silt and clay, Narmada bank sediments are transition of clayey and silty clay loam, the upper stretch of Amla Khadi are in the group of clay, clayey loam and silty clay loam, middle pounding stretch show silt and silty clay, lower stretch shows clay and silty loam, the stream sediments of lower stretch are silty loam, loam, silty loam (Figure 3).
The chemical properties of soil/sediments have been determined by the colloidal portion of soils i.e. clays and humus. The chemical environment of soil not only influences the plant growth but also it decisively determines the physical environment of soil (Orlov, 1992). Therefore, in order to characterize the soils from the area, the chemical properties like pH, EC, CEC, Carbonate content and Organic matter were estimated (Table 3).
Table 3. Chemical properties of surface soil/sediments
Area name
Sample Nos.
pH
EC
CEC
CaCO3 (%)
Organic carbon (%)
Organic matter (%)
Urban and
S2
7.42
0.48
78.40
1.04
0.42
0.72
lower stretch
S6
8.3
0.21
60.50
49.2
0.76
1.31
S7
7.52
0.37
57.60
40.4
1.35
3.12
S9*
5.46
24.30
56.80
34
1.98
3.40
S10*
5.76
10.12
55.90
33.8
1.98
3.40
S11
8.03
0.29
46.90
34.6
0.56
0.97
S12
7.87
0.14
89.20
34.2
0.21
0.37
S13
8.03
0.22
71.50
35.7
0.56
0.97
Narmada bank
S17
8.05
0.36
34.50
38.4
0.35
0.61
S18
8.04
0.25
36.80
34.4
0.76
1.31
S19
7.7
0.44
47.50
33
1.52
2.40
S20
8.12
0.48
46.30
34.2
1.00
1.72
S22
7.96
0.56
68.10
1.91
0.85
1.47
AIA
S23
7.79
0.08
77.80
1.04
0.36
0.62
S25
7.69
0.44
70.30
2.82
0.68
1.17
S27
7.9
0.21
57.80
3
0.42
0.72
S29
7.7
0.36
56.50
2.1
1.07
1.84
Upper stretch
S30
8.62
0.16
69.50
3.17
0.18
0.31
S32
7.9
0.92
53.40
1.45
1.01
1.74
S33
7.76
0.98
52.50
1.97
0.34
0.59
S35
7.45
0.43
83.50
1.29
0.51
0.88
PIA
S36
7.86
0.28
67.20
1.76
1.08
1.86
S37
7.89
0.12
68.60
1.15
0.39
0.68
S39
8.3
0.38
78.20
2.2
0.83
1.43
S41
7.7
0.91
73.50
2.65
1.93
3.33
In general, pH range of 6.5 to 7.5 of the saturation extract is considered as standard range in which most of the soil nutrients are available to plants. In the present study area, all surface samples except no. 9 and 10 the pH is above 7, and it ranges from 7.2 to 8.6 reflecting alkaline nature of majority soil/sediments while sample no. S9 and S10 show pH 5.4 and 5.7 that is acidic possibly showing effect of industrial effluents.
The EC values range from 0.082 to 24.3 dS/m in the study area. The highest values of EC have been observed for sample no S9 and S10 representing surface soil/sediments belonging to the polluted stream bank sediments of Amla Khadi. The highest values of EC 24.3 and 10.2 dS/m of this locations show that it is heavily loaded with the heavy metals. The remaining samples from unpolluted area have EC values of (0.082 dS/m) are on lower side. The areas showing moderate to high EC are from industrial, urban, environment and polluted stretch of Amla Khadi.
CEC values range from 34.5 to 89 meq/100g, considering this the soil in this area is classified as silty clay and inference that is also supported by textural analysis. The samples, S12 belonging to lower polluted stretch, S22 from Narmada bank sediment, S23 from Ankaleshwar industrial area and S35 from upper stretch of Amla Khadi and S 39, 41 from Panoli industrial area show highest values for CEC (Table 3).
Carbonate values vary from 1.04 to 49.2% (possibly nodules) the higher values of carbonates were seen the samples: 6,7,9,10,11,12,13,17,18,19,20 that are from the middle pounding and lower stretch of Amla Khadi as well as from Narmada bank sediments. The samples from industrial area in the upper dry stretch (samplers: .22, 23, 25, 27, 29, 30, 32, 33, 35, 36, 37, 39, and 41) show the lower values of carbonate.
Organic carbon and organic matter varies in surface soil/sediment samples from 0.18 to 1.98 and 0.31 to 3.4 %. The values are seen higher in the samples belonging to polluted stream bank sediments i.e. S9 and S10, and also in the industrial areas (sample: 41, 36, 32, 29). The higher values of organic carbon and organic matter in these areas can be attributed to the anthropogenic activities as many of the industrial sites are situated throughout the area, and samples, S9 and S10 are having higher values as they are from the polluted stream bank sediments receiving the highly loaded effluents from industries. Remaining samples in the area show moderate to lower values of organic carbon and organic matter as from (Table.3).
The correlation between heavy metals and phsyco-chemical properties of surface soil/sediments was performed in order to assess control of these properties on heavy metal dispersion. Correlation analyses of the soil phsyco-chemical properties with the heavy metal content gives an judgment of how this properties has helped in determining the dispersion of heavy metals in soil and leading to the environmental impact.
Cobalt is positively correlated with the pH value with (r=0.72). Good positive correlation of EC with the heavy metal like Cu, Zn, Mo, Ni is seen and moderate to poor correlation of EC with the soil properties like percentage of Carbon and Organic matter is also seen. CEC shows moderate to poor correlation with metals like Ni, Zn, Pb and Cu. Carbonate content show moderate correlation with Cu Mo. Organic matter content show the positive correlation of the heavy metal content with Ni, Cu, Zn Pb and Mo.
Table 4. Correlation of heavy metals and physical properties of surface soil /sediments
Sand %
Silt %
Slay %
Mn
Fe
Cr
Co
Ni
Cu
Zn
As
Mo
Pb
Sand %
1
Silt %
-0.09
1
Clay %
-0.56
-0.75
1
Mn
-0.16
-0.40
0.46
1
Fe
0.03
0.09
-0.08
0.22
1
Cr
-0.43
-0.23
0.48
0.43
-0.19
1
Co
0.21
-0.48
0.24
0.43
0.35
-0.28
1
Ni
-0.30
0.15
0.07
0.09
0.00
0.70
-0.55
1
Cu
-0.20
0.42
-0.21
-0.25
-0.29
0.52
-0.79
0.84
1
Zn
-0.20
0.28
-0.16
-0.19
-0.25
0.61
-0.66
0.80
0.89
1
As
-0.15
-0.52
0.50
0.52
0.01
0.52
0.47
0.11
-0.18
-0.04
1
Mo
-0.21
0.44
-0.22
-0.28
-0.28
0.51
-0.82
0.78
0.97
0.86
-0.23
1
Pb
-0.11
-0.17
0.20
0.14
-0.41
0.73
-0.34
0.52
0.53
0.66
0.36
0.50
1
Table 5. Correlation of heavy metals with chemical properties of soil/sediments
pH
EC
CEC
CaCO3
C (%)
OM
Mn
Fe
Cr
Co
Ni
Cu
Zn
As
Mo
Pb
pH
1
EC
-0.87
1
CEC
-0.21
0.32
1
Caco3
-0.17
0.25
-0.13
1
C (%)
-0.66
0.59
0.60
0.24
1
OM
-0.64
0.57
0.54
0.26
0.99
1
Mn
0.11
-0.19
-0.15
-0.52
-0.40
-0.40
1
Fe
0.14
-0.31
-0.15
0.02
-0.13
-0.11
0.22
1
Cr
-0.55
0.48
0.17
-0.46
0.21
0.19
0.43
-0.19
1
Co
0.72
-0.75
-0.13
-0.31
-0.54
-0.51
0.43
0.35
-0.28
1
Ni
-0.81
0.84
0.37
-0.08
0.51
0.48
0.09
0.00
0.70
-0.55
1
Cu
-0.91
0.97
0.26
0.26
0.63
0.60
-0.25
-0.29
0.52
-0.79
0.84
1
Zn
-0.85
0.84
0.38
0.04
0.75
0.71
-0.19
-0.25
0.61
-0.66
0.80
0.89
1
As
0.14
-0.15
0.18
-0.59
-0.13
-0.14
0.52
0.01
0.52
0.47
0.11
-0.18
-0.04
1
Mo
-0.91
0.91
0.22
0.26
0.63
0.60
-0.28
-0.28
0.51
-0.82
0.78
0.97
0.86
-0.23
1
Pb
-0.41
0.51
0.30
-0.39
0.38
0.34
0.14
-0.41
0.73
-0.34
0.52
0.53
0.66
0.36
0.5
1
7 . DISCUSSION
The groupings of metals into 8 different classes based on land use have made it easier to locate their possible sources and also the degree of the enrichment or pollution they have reached. Metals occurring at all sites are well correlated positively as discussed earlier, including As, Pb, Mn, Fe and Mo, indicating that they have a common source, which could be an anthropogenic or lithogenic. The samples show very high values of the metals like As followed by Pb >Zn and Mo. The concentration of Mo and Cu is found to be highest in the samples of the lower polluted stretch (mud) as it is directly in contact with the highly toxic and polluted industrial effluent from this area. The pollution index shows the significant enrichment in metals like As, moderate enrichment in case of Pb and minimal enrichment in Fe > Mn > Cr > Ni > Co > Zn > Cu > Mo. The data reveals that the surface soils/sediments in the area are appreciably contaminated, showing high levels of toxic elements than standard values of Shales.
Generally the distribution of the heavy metals is very high in the finer fraction then the coarser fraction (Li et al., 2006) as this finer fraction mainly clay and silt have high surface area for adsorption and form complexes with different compounds.
High correlation with chemical properties suggests that higher ionic conductivity soils have high capacity for heavy metal storage. Also the affirmative relation between the Mo and CaCO3 as well as organic matter content suggests possible presence of calcium humates in the soil/sediments. Co is the only metal which shows the positive correlation with the pH and all other heavy metals are negatively correlated. This concludes that the mobility of Co is strongly influenced by pH. Generally, the metals in soils are strongly bonded by soil organic matter. The higher CEC of the soil also means the greater adsorption capacity for heavy metals (Liu et al., 2007). The measured total concentration of heavy metal was positively correlated with measured physico-chemical properties. The effect of these properties can be arranged as fallow: EC > % C > Organic matter > Clay content > Silt content.
8 . CONCLUSION
The present study shows significance to minimum enrichment of heavy metals in soil/sediment of study area. High concentration of heavy metals then the standard values has led to contamination of soil/sediment quality in the study area. This significant enrichment of heavy metals like As and Pb, was seen in the area which are influenced anthropologically including industrial, urban and lower stretch which is drained by industrial effluent.
The heavy metals like Arsenic and Pb have high values then the standard values which are really unsafe. Contribute firmly by the anthropogenic activities like industries and traffic, wastes from urban area, etc.
The measured total concentration of the heavy metal shows control of their physico-chemical properties. The effect of these properties can be arranged in descending order as follows: EC > OM > Clay % > Silt % > CEC. Thus, study clearly highlights the control of physico-chemical properties on heavy metal content and prerequisite measure for exceptionally severe metal pollution in the Ankaleshwar area.
Tables
Figures
Conflict of Interest
Authors proclaimed no conflict of interest.
Acknowledgements
Authors would like to thank the Head of the Department of Geology, Savitribai Phule Pune University, Pune for providing necessary facilities. Financial assistance by DST, Government of India, under SSS program is gratefully acknowledged. The first author thankfully acknowledges the financial support by DST as a Research Fellow. Authors also acknowledge the anonymous reviewers for many meaningful suggestions that led to considerable improvement in the quality of the paper.
CPCB [Central Pollution Control Board], 1996. Inventorisation of hazardous waste generation in five districts (Ahmedabad,Vadodara, Bharuch, Surat, and Valsad) of Gujarat. Central Pollution Control Board (Ministry of Environment and Forests, Government of India).
8.
Fytianos, K. and Lourantou, A. 2004. Speciation of elements in sediment samples collected at lakes Volvi and Koronia, N. Greece. Environment International, 30, 11-17.
Orlov, D. S., 1992. Soil Chemistry, Oxford and IBH publ. Co, New Delhi.
17.
Santillo, D., Stephenson, A., Labunskaia, I. and Siddorn, J., 1996. A preliminary survey of waste management practices in the chemical industrial sector in India: Consequences for environmental quality and human health. Part I. Gujarat. Greenpeace Research Laboratories Technical Note, 96/8.


 ,
N. J. Pawar 2
,
N. J. Pawar 2