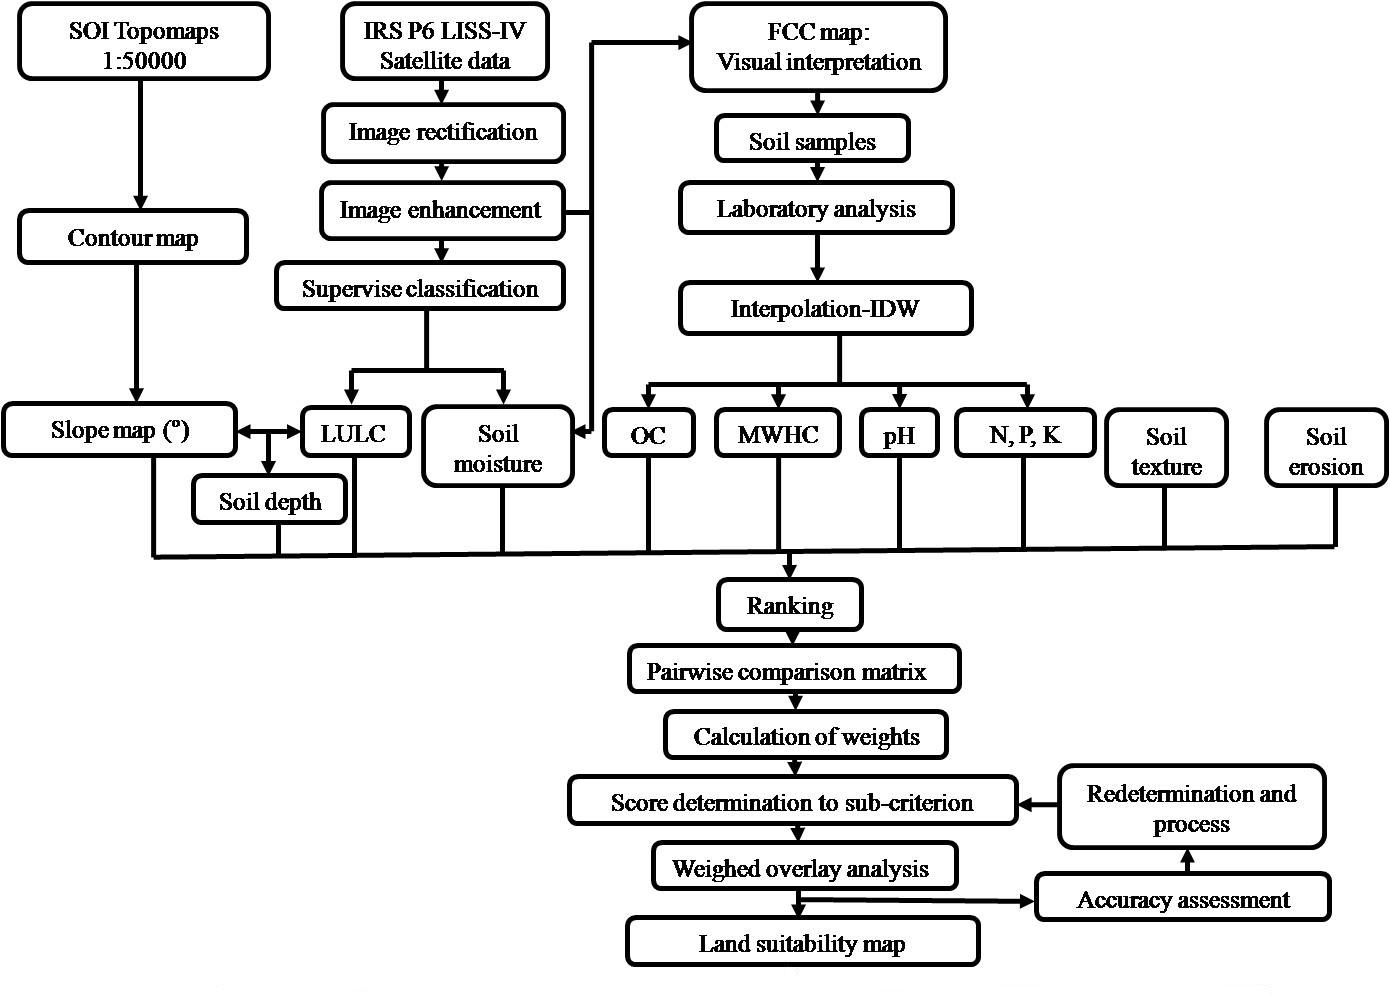
The spatial information regarding selected criterion i.e. slope, LULC and soil qualities like depth, texture, moisture, SOC, MWHC, pH, EC and primary nutrients were used for present LSA for plantation in this study. Satellite data has used for preparation of thematic maps i.e. LULC, soil depth and SM. The topomaps (47 E/10, 11, 14, 15) have also procured from Survey of India for preparation of slope map.
Soil samples (74) were collected from selected sites using purposive sampling method and analysed in laboratory. Field based laboratory data were also used for preparation of thematic maps like OC, MWHC, pH, EC, Nitrogen, Phosphorus and Potassium using interpolation technique in ARC GIS.
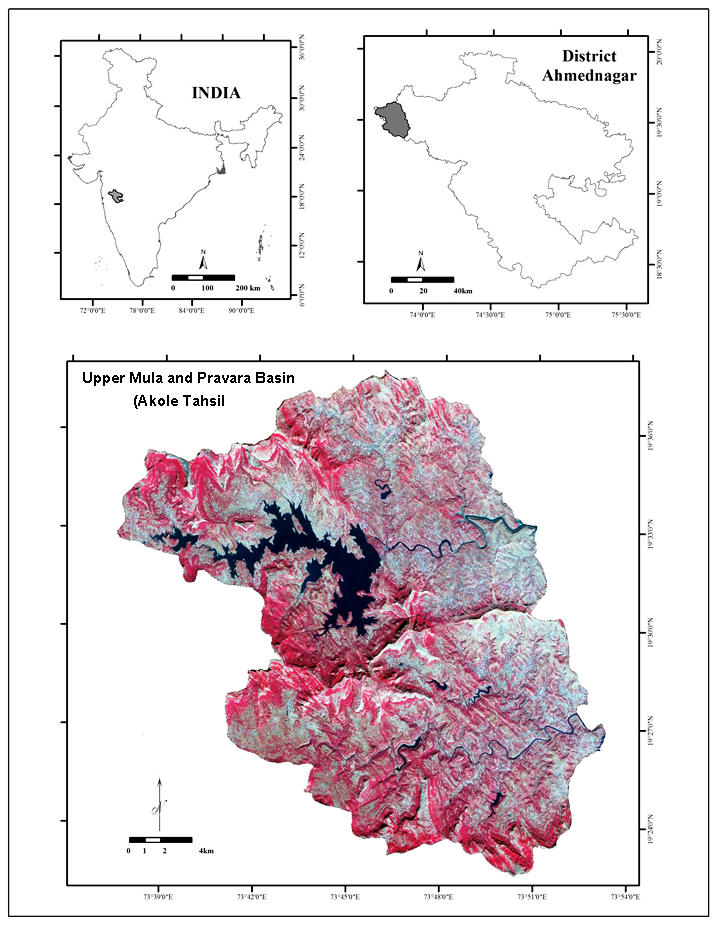
High resolution (5.8m) satellite data (cloud free) i.e. IRS P6 LISS-IV (path 095 and row 059) (21st November 2013) was procured from National Remote Sensing Centre (NRSC), Hyderabad, India and used for the spatial analysis.
The GPS [Global Positioning System] was used to locate the sites to collect soil sample and information regarding LULC and vegetation. About 158 observations distributed within suitability classes were collected for accuracy assessment.
3.2 Software and Mapping
GIS software i.e. Arc10 and ERDAS 9.2 [Earth Resource Development Application System] were used for preparation of thematic map and image analysis, respectively. Supervised classification method i.e. Bayesian maximum likelihood and collected information from field were used for LULC mapping. SM map prepared using Normalized Difference Water Index (NDWI).
3.3 Selection and Mapping the Criterion
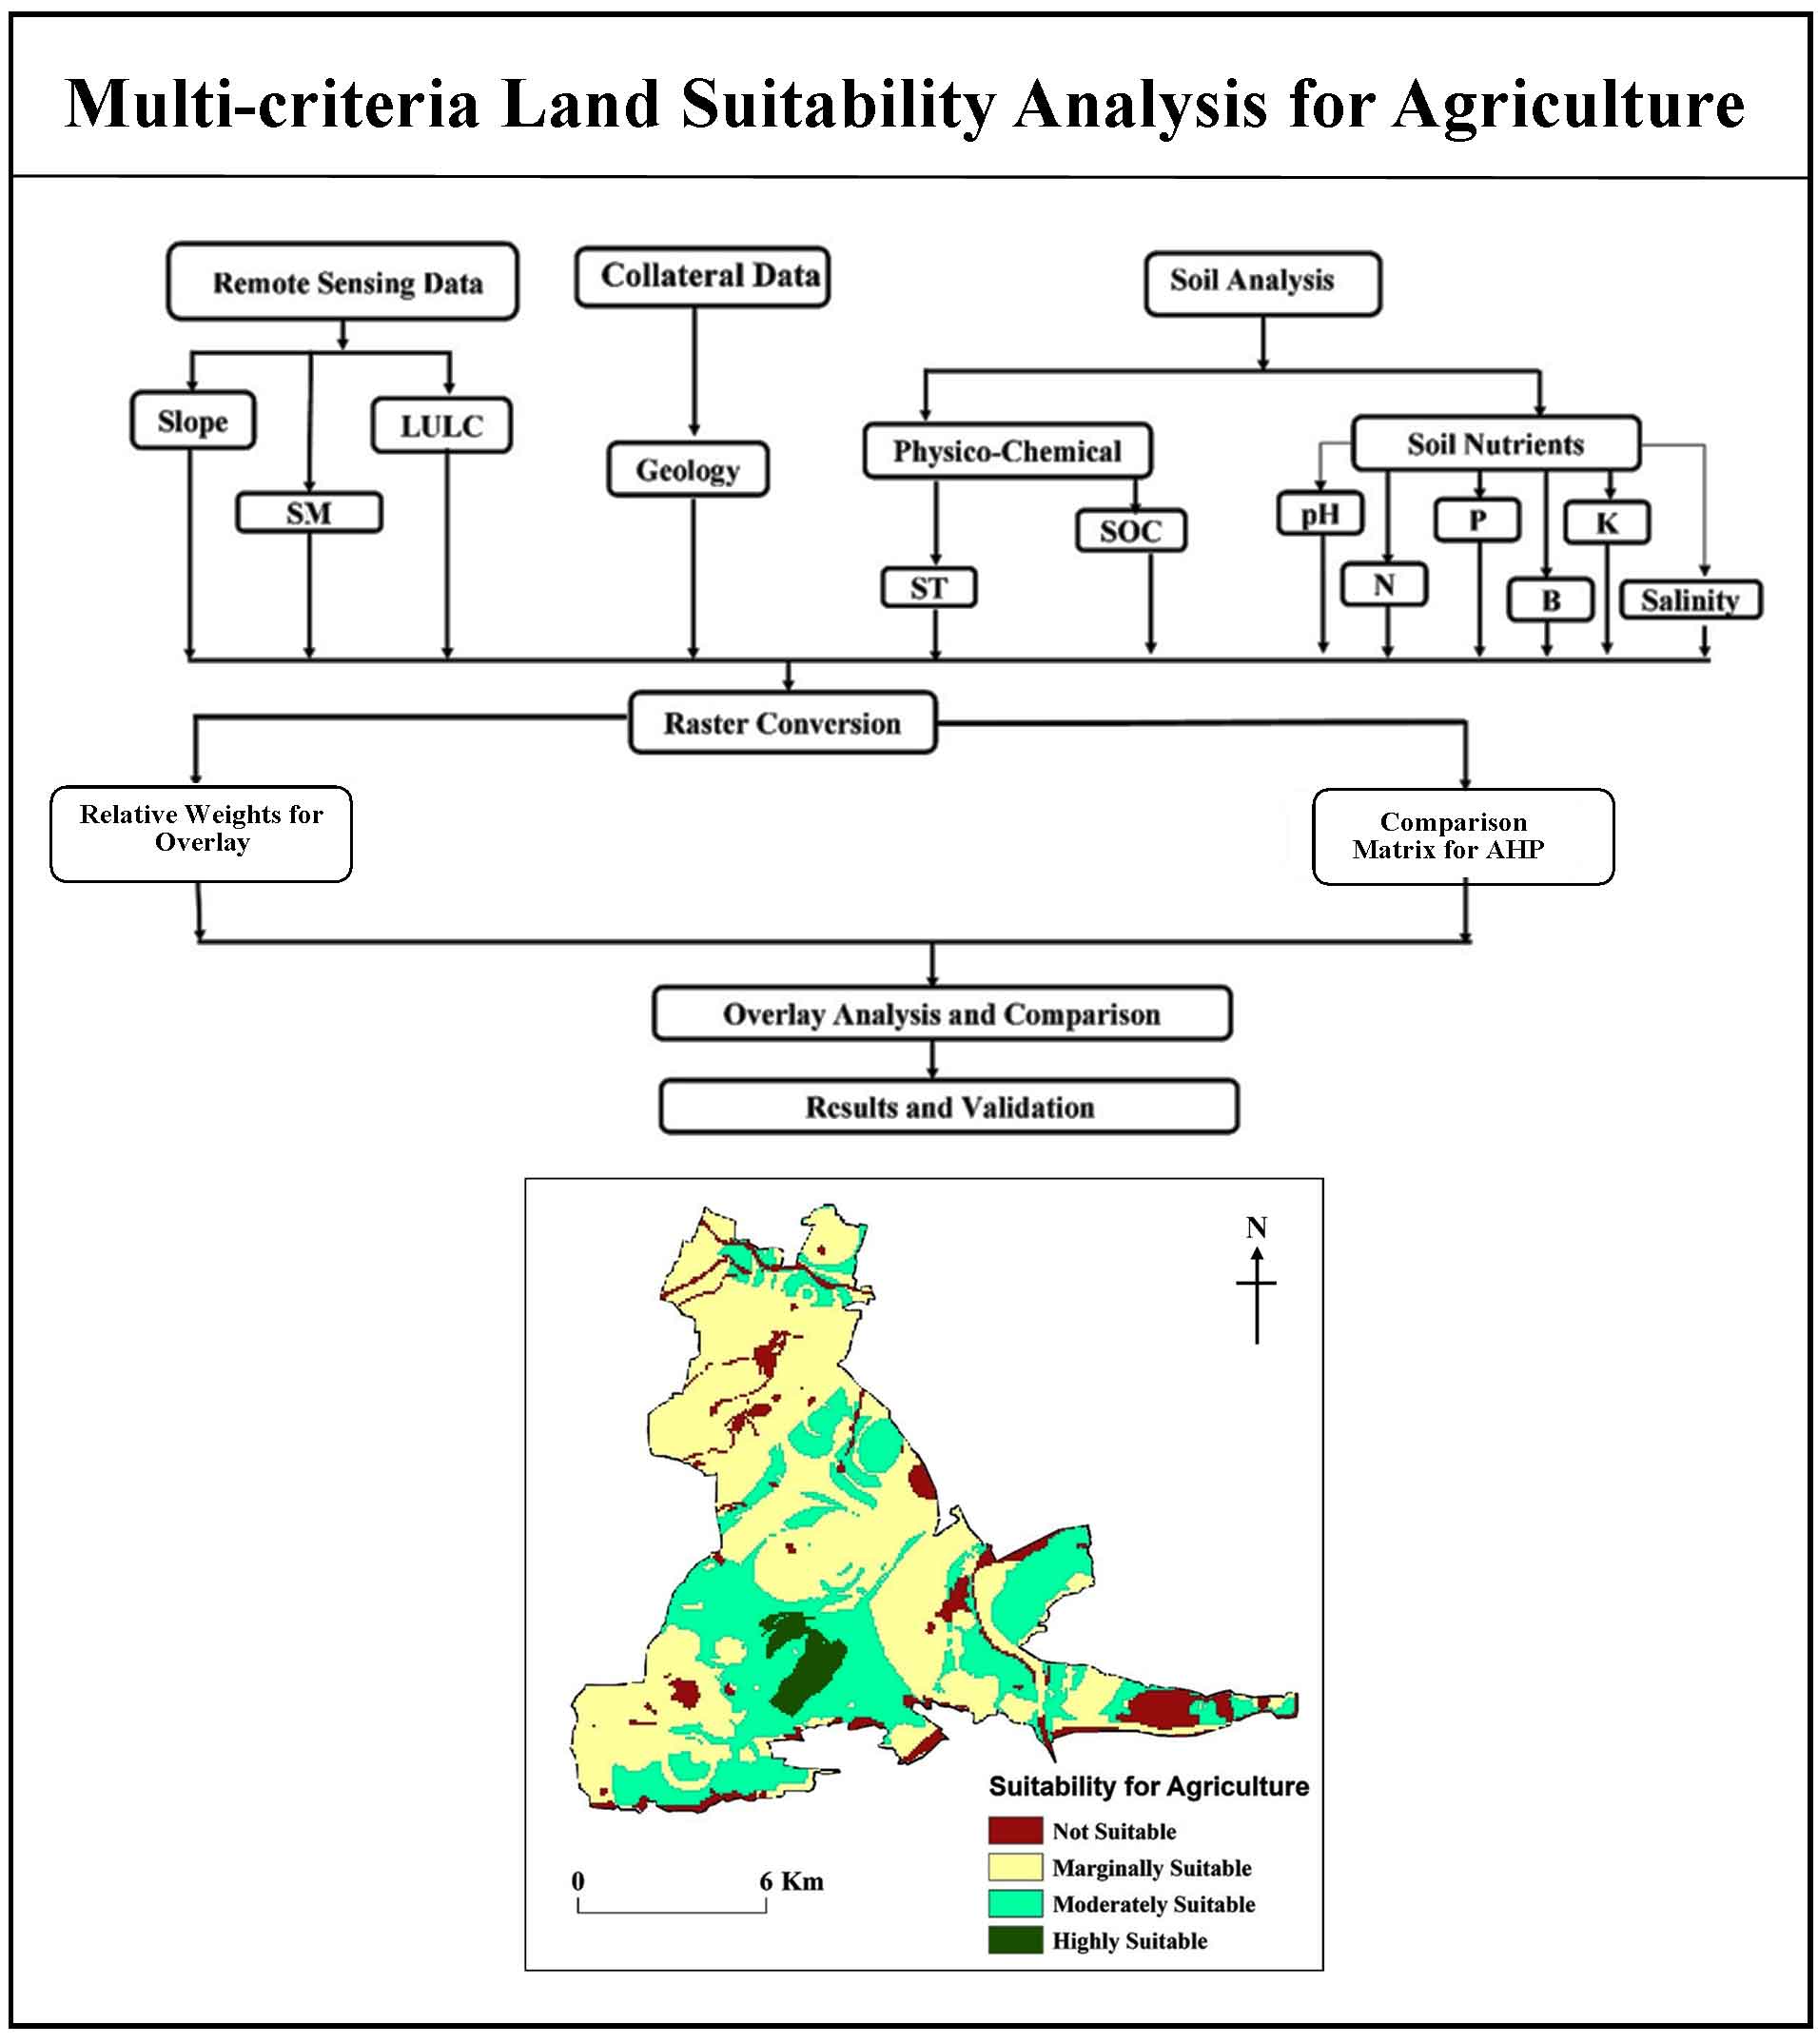
In this study, twelve criterion such as slope, LULC and soil qualities (depth, MWHC, SOC, pH and nutrients) were selected for spatial analysis using weighted overlay analysis (WOA). Thematic maps i.e. pH, EC, OC, N, P and K were prepared using Inverse Distance Weighting (IDW) interpolation technique in GIS. Comparison for Super Decision Software (CSDS) was used for calculation of weights for selected criterion.
Experts were selected from reputed Journal (literature review) in the field of LSA for selection of criterion, assigned ranks and score of criterion. A questionnaire was made based on plantation activities and mailed to experts. These responses were loaded and analyzed in CSDS for calculation of weights of each criterion.
3.4 Analytic Hierarchy Process (AHP)
The hierarchical structure of AHP is useful for complex spatial decision with higher confidence level (Saaty, 1980). AHP technique used for LSA in this study can be outlined into six steps i.e. (1) determination of ranks, (2) pairwise comparison, (3) calculation of weights, (4) determination of score, (5) weighted overlay analysis and (6) accuracy assessment.
3.4.1 Determination of Ranks
The experts’ opinions and literature review were used for assigning of ranks (1 to 12) of criterion. Lower rank indicates the most important level of criterion for plantation and higher rank indicates the least important level of parameters. Physiographic elements like slope, LULC, soil depth and soil texture have most influence on plantation and vegetation cover and assigned ranked 1-4, respectively. Soil moisture, texture, erosion and MWHC have moderate influence on plantation therefore assigned ranked 4 to 7, respectively. Zolekar and Bhagat (2015) reported that OC (rank 8), pH (rank 9), N (rank 10), P (rank 11), and K (rank 10) show comparatively insignificant relationship with plantation activities therefore higher ranks were assigned (Table 1).
Table 1. Ranks assigned to criterion
|
Criterion
|
Slope
|
LULC
|
Depth
|
Texture
|
Soil moisture
|
Erosion
|
MWHC
|
OC
|
pH
|
N
|
P
|
K
|
|
Rank
|
1
|
2
|
3
|
4
|
5
|
6
|
7
|
8
|
9
|
10
|
11
|
12
|
3.4.2 Pairwise Comparison Matrix
The pairwise comparison matrix (PCM) was formed for determination the weights of parameters according to the AHP techniques. The judgments in the PCM (relative levels of importance of the parameters) were formed basis on experts’ opinion and literature. Consistency Ratio (CR) calculates logical inconsistency of the judgments and facilitates detection of possible error. Saaty (1997) reported that a CR value up to 0.1 is acceptable for PCM judgment. CR value of the PCM judgments was calculated as zero therefore calculated weights of selected criterion are acceptable for LSA of plantation. Sub-criterions were also assigned scored within the range of 1-10, with the help of experts’ opinions and literature survey (Table 2).
Table 2. Pairwise comparison matrix
|
Criteria
|
Slope
|
LULC
|
Depth
|
Texture
|
Soil Moisture
|
Erosion
|
MWHC
|
SOC
|
pH
|
N
|
P
|
K
|
Weights
|
|
Slope
|
1/1
|
2/1
|
3/1
|
4/1
|
5/1
|
6/1
|
7/1
|
8/1
|
9/1
|
10/1
|
11/1
|
12/1
|
0.32
|
|
LULC
|
1/2
|
2/2
|
3/2
|
4/2
|
5/2
|
6/2
|
7/2
|
8/2
|
9/2
|
10/2
|
11/2
|
12/2
|
0.16
|
|
Depth
|
1/3
|
2/3
|
3/3
|
4/3
|
5/3
|
6/3
|
7/3
|
8/3
|
9/3
|
10/3
|
11/3
|
12/3
|
0.11
|
|
Texture
|
1/4
|
2/4
|
3/4
|
4/4
|
5/4
|
6/4
|
7/4
|
8/4
|
9/4
|
10/4
|
11/4
|
12/4
|
0.08
|
|
Soil moisture
moisture
|
1/5
|
2/5
|
3/5
|
4/5
|
5/5
|
6/5
|
7/5
|
8/5
|
9/5
|
10/5
|
11/5
|
12/5
|
0.06
|
|
Erosion
|
1/6
|
2/6
|
3/6
|
4/6
|
5/6
|
6/6
|
7/6
|
8/6
|
9/6
|
10/6
|
11/6
|
12/6
|
0.05
|
|
MWHC
|
1/7
|
2/7
|
3/7
|
4/7
|
5/7
|
6/7
|
7/7
|
8/7
|
9/7
|
10/7
|
11/7
|
12/7
|
0.05
|
|
SOC
|
1/8
|
2/8
|
3/8
|
4/8
|
5/8
|
6/8
|
7/8
|
8/8
|
9/8
|
10/8
|
11/8
|
12/8
|
0.04
|
|
pH
|
1/9
|
2/9
|
3/9
|
4/9
|
5/9
|
6/9
|
7/9
|
8/9
|
9/9
|
10/9
|
11/9
|
12/9
|
0.04
|
|
N
|
1/10
|
2/10
|
3/10
|
4/10
|
5/10
|
6/10
|
7/10
|
8/10
|
9/10
|
10/10
|
11/10
|
12/10
|
0.03
|
|
P
|
1/11
|
2/11
|
3/11
|
4/11
|
5/11
|
6/11
|
7/11
|
8/11
|
9/11
|
10/11
|
11/11
|
12/11
|
0.03
|
|
K
|
1/12
|
2/12
|
3/12
|
4/12
|
5/12
|
6/12
|
7/12
|
8/12
|
9/12
|
10/12
|
11/12
|
12/12
|
0.03
|
3.4.3 Determination of Score
Several researchers have assigned the score for sub-criterion from 1 to 10 based on land qualities, favourable conditions and limitations for plantation practices. In the present study, the scores are assigned on the basis of favourable condition for plantation, field work, experts opinion, land quality and literature survey. The higher score indicates maximum influence of sub-criteria whereas lesser score shows least suitability for plantation (Akinci et al., 2013; Zolekar, 2018).
Slopes show negative relations with soil qualities and agriculture productivity (Akinci et al., 2013). Therefore, maximum (10) score was assigned gentle slopes and minimum (1) to steep slopes (FAO, 1976). The 8th score was assigned to stiff slopes with deep soils and slightly eroded but less flat than gentle to moderate slopes (Bandyopadhyay et al., 2009). Score, six was assigned to steep slopes (6º to 12º) with moderate deep soil and slightly undulating topography (Akinci et al., 2013; Zolekar, 2016). Some patches of very steep to extra steep sloping lands (12º to 30º) show potentials of terracing but there are limitations like not easy accessible, thin soils, less SM, highly dissected and maximum percolation (Zolekar and Bhagat, 2014). These classes were classified in the class, ‘marginal suitable’ with score four (Table 3).
Table 3. Weights and scores for plantation
|
Criterions
|
Weight
|
Influence
(%)
|
Sub-criterion
(with ranges)
|
Score for plantation
|
|
Slope (º)
|
0.32
|
32
|
Gentle (0-1)
Moderate (1-3)
Stiff (3-6)
Steep (6-12)
Very steep (12-20)
Extra steep (20-30)
Precipitous (30-90)
|
10
10
8
6
4
4
1
|
|
LULC
|
0.16
|
16
|
Agriculture
Fallow land
Sparse forest
Scrub land
Barren land
Dense forest
Settlement
Rocky land
Water body
|
1
10
7
4
1
1
1
1
Restricted
|
|
Depth (cm)
|
0.11
|
11
|
Deep soil
Moderate depth
Marginal depth
Shallow soil
Thin soil
|
10
7
6
4
1
|
|
Texture
|
0.08
|
8
|
Loam soils with moderate to gentle slope
Clay loam
Loam soils on steep slope
|
10
7
4
|
|
Soil moisture
|
0.06
|
6
|
Good soil moisture
Medium soil moisture
Less soil moisture
Very less and dry soil moisture
|
1
7
4
1
|
|
Soil erosion
|
0.05
|
5
|
Slightly eroded
Moderately eroded
Highly eroded
|
10
7
1
|
|
Soil OC (%)
|
0.05
|
5
|
Highly suitable (0.61-1.00)
Moderately suitable (0.40- 0.60)
Marginally suitable (0.20-0.40)
Not suitable (< 0.20)
|
10
7
5
1
|
|
MWHC
|
0.04
|
4
|
High (> 400)
Moderate (200 - 400)
Low (200 - 100)
Very low (< 100)
|
10
7
4
1
|
|
pH
|
0.04
|
4
|
Highly suitable (5.00 - 7.3)
Moderately suitable (7.3 - 8.0)
Not suitable (> 8)
|
10
7
1
|
|
N (Kg/ha.)
|
0.03
|
3
|
Highly suitable (> 225)
Moderately suitable (181 - 225)
Marginally suitable (95 - 180)
|
10
7
4
|
|
P (Kg/ha.)
|
0.03
|
3
|
Moderately suitable (31 - 65)
Marginally suitable (16 - 30)
Not suitable ( < 15)
|
7
4
1
|
|
K (Kg/ha.)
|
0.03
|
3
|
Highly suitable (> 360)
Moderately suitable (181 - 360)
Marginally suitable (121 - 180)
|
10
7
4
|
The field observations were used to assign scores to LULC classes. Lands with gentle to moderate slopes with deep soils are highly suitable for agriculture. Rice is dominant crop and major staple food to the tribal people in the region. These lands have to be kept for agriculture therefore assigned lower score (1) for agriculture in LULC. . Further, about 10% lands in the region are fallow and 22% are grazing lands. The people of the region are living below poverty line. The government agencies are giving 100% financial supports to farmers of the region for horticulture to improve the income. Therefore, present analysis has been performed to detect potential lands for plantation mainly on fallow and barren lands. Deep soil is source of nutrients and minerals to plants therefore higher score (10) given to deep soil and lower score to shallow soil (4) and thin (1). Similar strategy also used for the sub-criteria of soil moisture and MWHC.
Some patches of the scrub lands with shallow soils are marginally suitable for plantation therefore given 4 score to its. The barren and rocky lands are not permanently not suitable for plantation activities so lower score (1) assigned. Score one is assigned to water bodies due to restricted area (Table 3). The protected dense forests are classified into the class ‘not suitable’. Thus, score 1 has been assigned to agricultural lands, barren lands, dense forests, settlements and rocky lands. The score have assigned to sub-criteria of pH, OC, N, P and K basis on its content in soils.
3.4.4 Weighted Overlay Analysis
After the calculation of criterion weights and assigned scores to sub-criterion were appointed to the related layers in the Arcmap 10 environment, raster maps of 12 criterions were overlaid using the weighted overlay analysis, and land suitability map for plantation was generated. The Weighted Overlay Analysis (WOA) is a powerful tool for solving complex spatial problems in suitability analysis based on common measurement of diverse and dissimilar inputs (Kuria et al., 2011). Selected raster maps were overlaid by converting their cell values to common scale, assigning a weight to each criterion and then adding weighted cell values together (Mojid et al., 2009; Zolekar and Bhagat, 2015). The cell values of each input raster are multiplied by the raster’s weight (Zolekar and Bhagat, 2015).
\(S = \sum_{i=1}^n Wi Xi\) (after Zolekar and Bhagat, 2015) (1)
where,
\(S\) : total LS score,
\(Wi\) : weight of LS criteria,
\(Xi\) : sub-criteria score of i land suitability criteria,
\(n\) : total number of land suitability criteria.
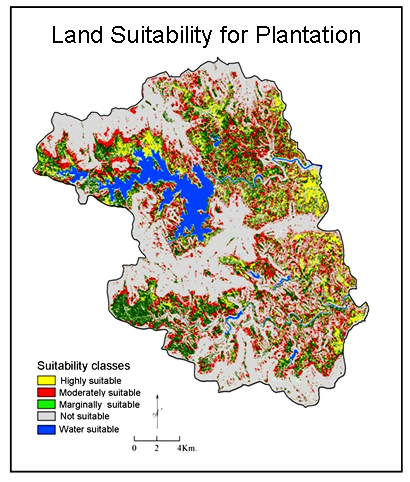
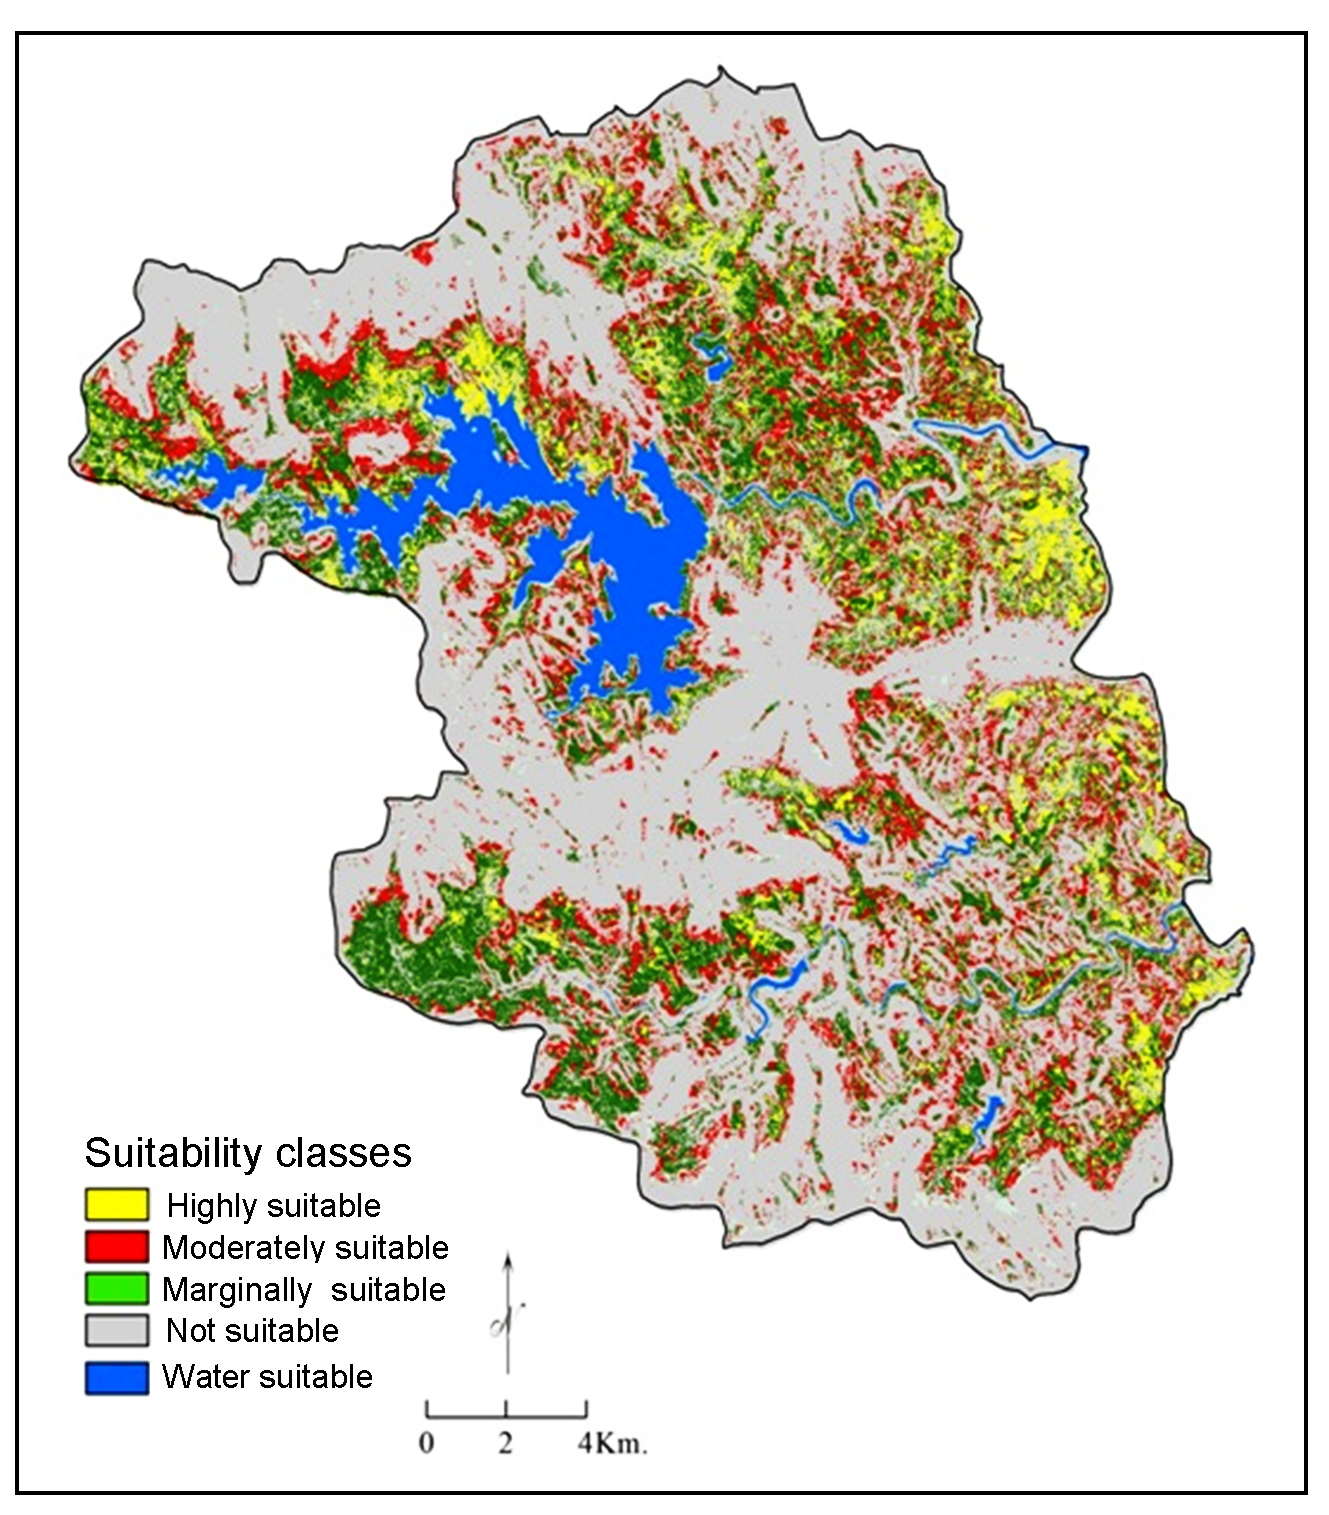
Then output raster map was generated and assigned scores were averagely calculated into four classes i.e. 9, 7, 4 and 1. Lastly, these classes were reclassified basis on FAO (1976) into the four suitability class i.e. highly suitable, moderately suitable, marginally suitable, and not suitable.


 ,
Vijay Bhagat 2
,
Vijay Bhagat 2