2.1 Study Area
Khuzestan State is one of the 31 provinces of Iran (Figure 1). The capital of Khuzestan is Ahvaz and it also covers an area of 63,238 km2. Khuzestan has excellent potentials for farming expansion. The abundance of water and fertile soil has caused the area to become suitable land for cultivation such as Wheat, Barley, Husks, Corn, Pea, Lentil, Sunflower, Cotton, Sugar Beet, Watermelon, Cucumber, Potato, Onions, Tomatoes, Canola, Beans, Soya Bean and Rice. The weather of Khuzestan is usually hot (summertime temperatures regularly exceed 40°C) and sometimes humid. While winters are much more cold (sometimes temperature drops below 0°C) and dry.
In 2016, only four crops (Wheat, Barley, Sugar Beet and Soybeans) were cultivated in very low levels in the study area.
2.2 Methodology
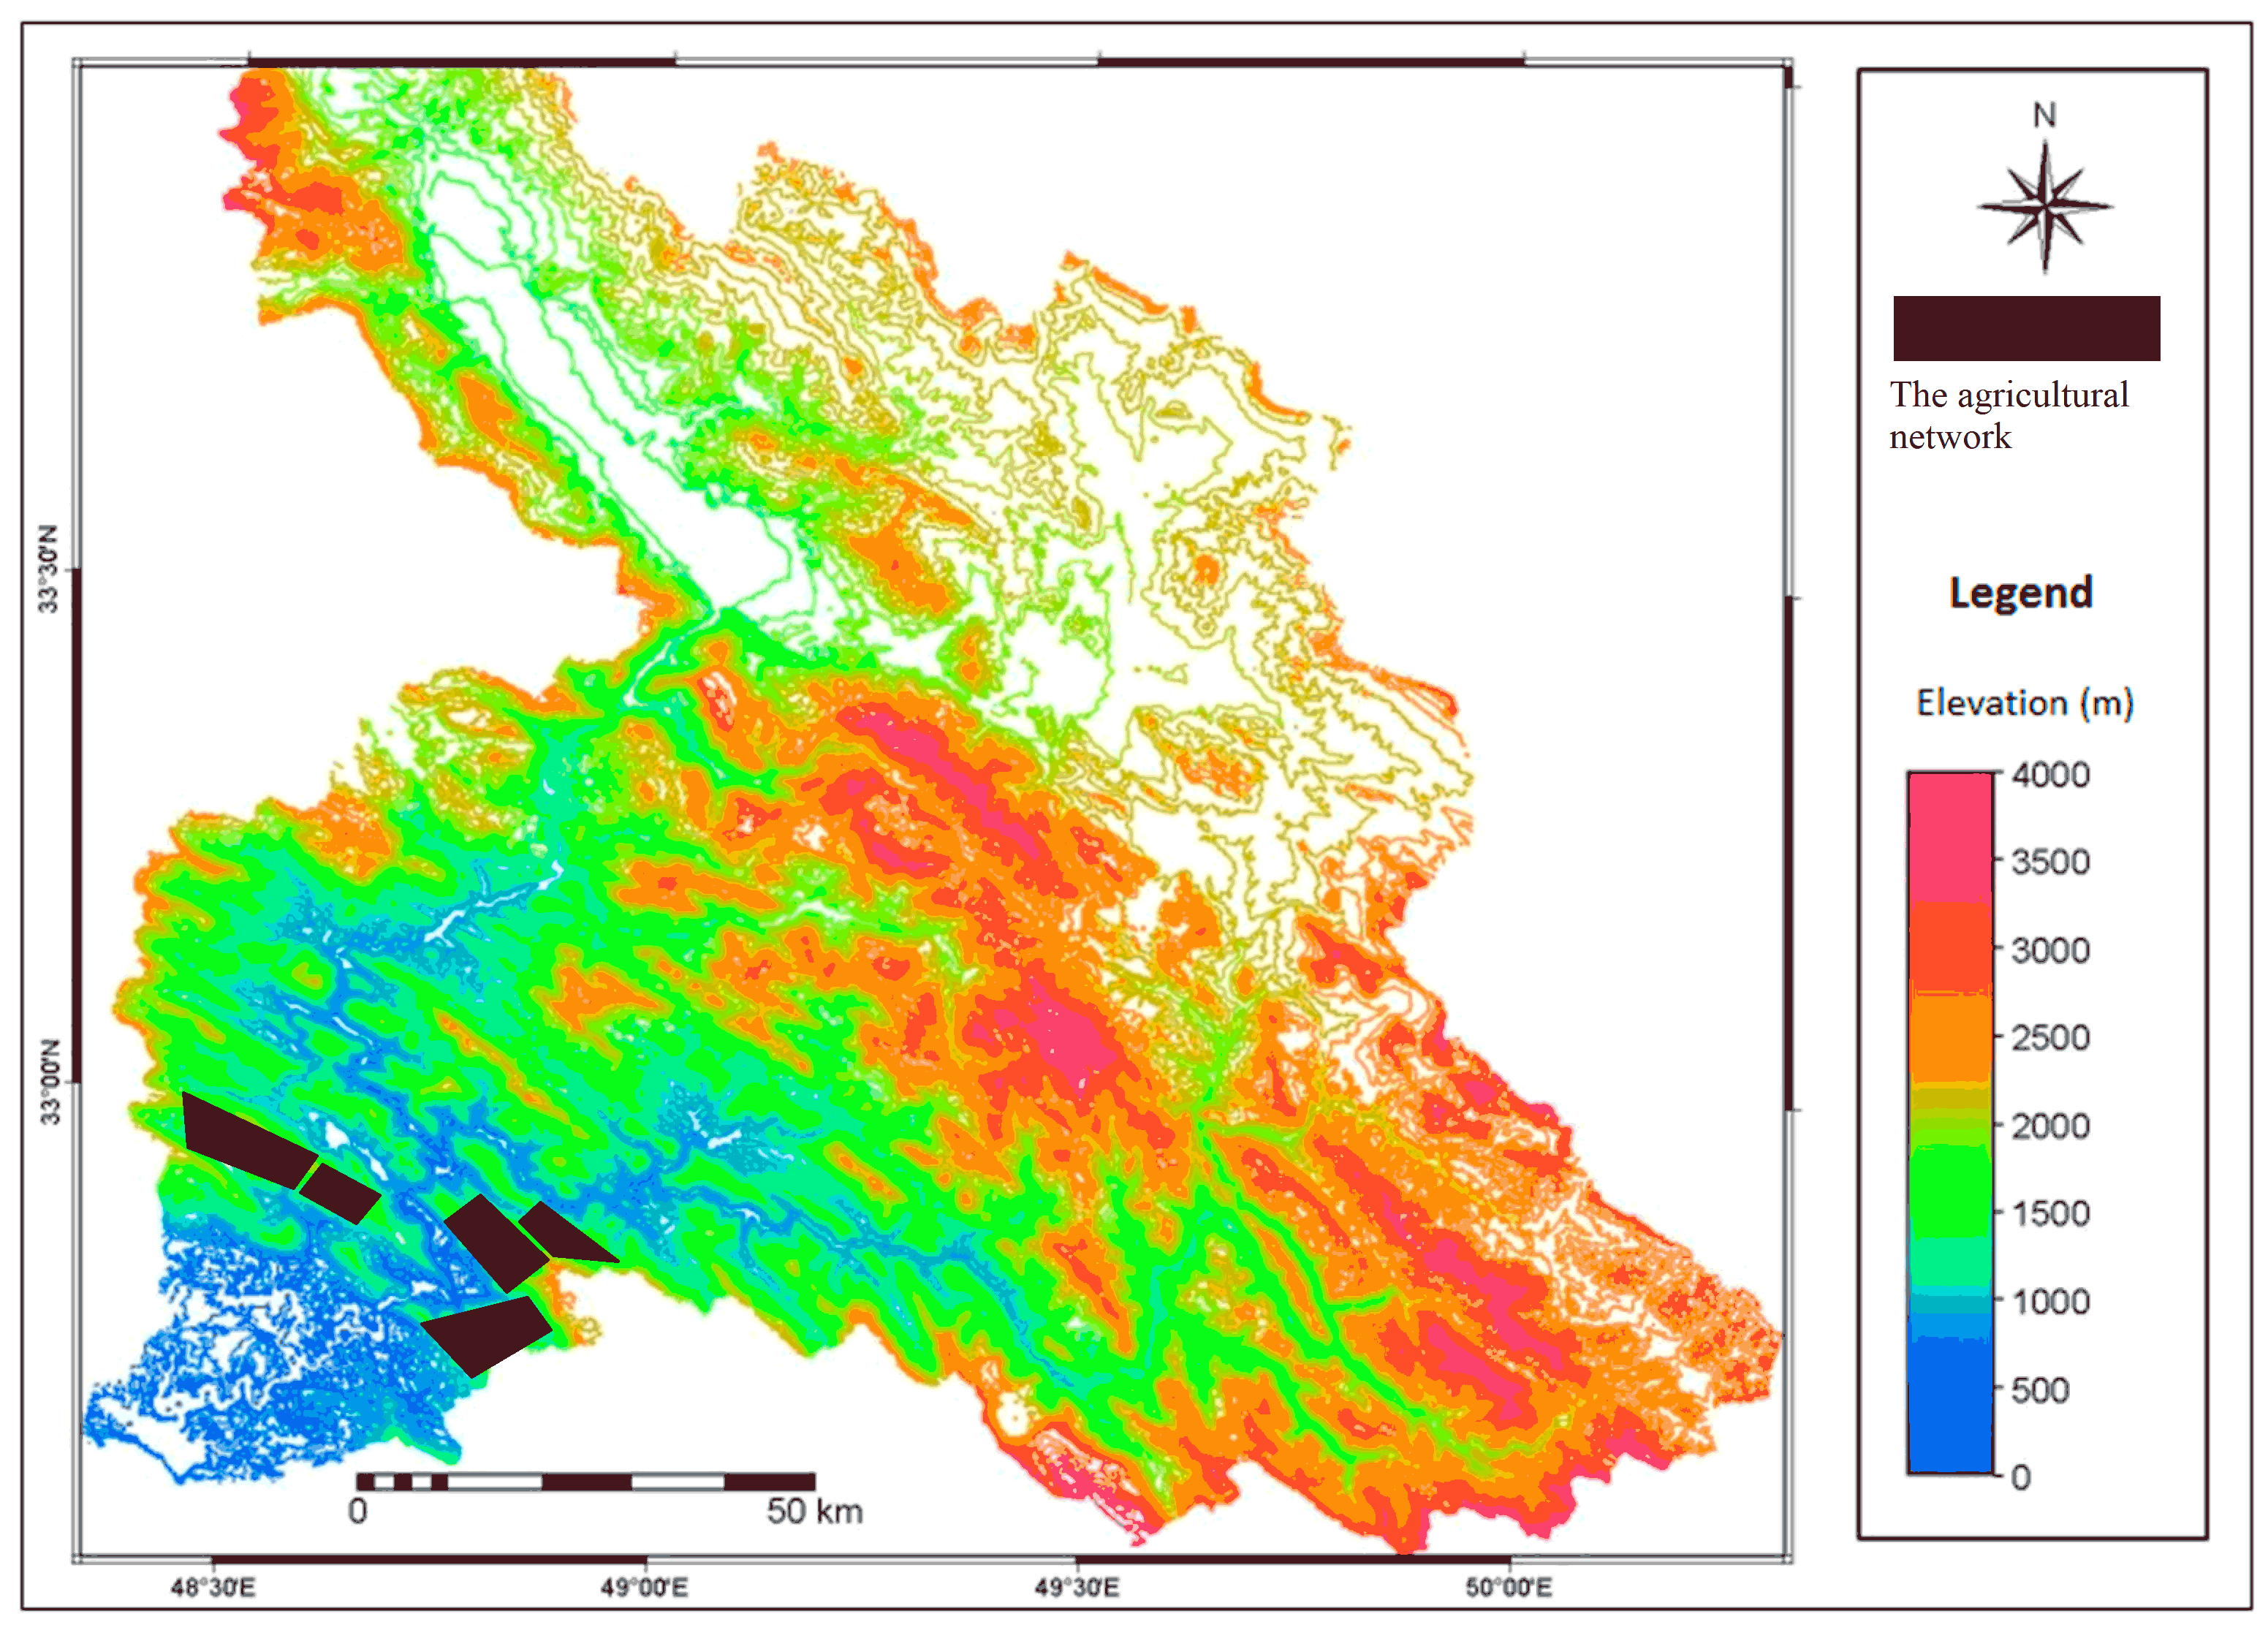
The methodology is shown in the flowchart (Figure 2). Design cultivated and processes are influenced by many factors that study about that force the designer pattern to collect a wealth of data and information. It is crucial to pay particular attention to the projects’ effective operation to obtain the utmost benefits and satisfaction from all the goals set earlier (Heydari et al., 2015).
The first requirement in the study of water resources projects in an area is knowledge of water resources and ability to estimate it in the region (Salarian et al., 2013). So the topography, agricultural land, drainage and soil properties of study area were considered and classified into 6 classes. Only 2100 acres of the best farming land (Class I) was studied (Table 1). The volume of assigned water to the described land was about 6 million cubic meters (MCM). 17 agricultural products of the region, including Wheat, Barley, Husks, Corn, Pea, Lentil, Sunflower, Cotton, Sugar Beet, Watermelon, Cucumber, Potato, Onions, Tomatoes, Canola, Beans, Soya bean and Rice were used for this modeling.
Table 1. Soil classes
|
Classes
|
I
|
II
|
III
|
IV
|
V
|
VI
|
Total Reported
|
|
Karun III downstream (ha)
|
2100
|
10600
|
13400
|
440
|
21300
|
20960
|
68800
|
|
Total (ha) (Khuzestan)
|
--
|
--
|
--
|
--
|
--
|
--
|
931256
|
|
Area (%)
|
0.23
|
1.14
|
1.44
|
0.05
|
2.29
|
2.25
|
17.93
|
2.2.1 Pre Modeling
The required data for modeling were prepared in the form of constants, the upper and lower limits values and computational values in the pre modeling phase. Table 2 shows the mentioned data, ( \(∀i=1,2,3,…,17\) ):
Minimum land required for production i = (Minimum tonnage i)/(Average production per hectare i) (1)
Minimum water required to provide the desired capacityi = (Min land required)i * (Minimum required water) (2)
Value per hectarei = (The product value per ton) i * (Average production per hectare) i (3)
Table 2. Inputs*
|
Agricultural Products
|
Units
|
Wheat
|
Barley
|
Husks
|
Corn
|
Pea
|
Lentil
|
Cotton
|
Sugar beet
|
Watermelon
|
Cucumber
|
Potato
|
Onions
|
Tomatoes
|
Canola
|
Beans
|
Soy spring
|
Rice
|
|
Constants
|
The minimum required water
|
m3/ha
|
4340
|
3730
|
4180
|
5060
|
3940
|
4630
|
9160
|
4710
|
11850
|
3800
|
2970
|
4530
|
4625
|
6590
|
4930
|
3220
|
8890
|
|
Average production per hectare
|
ton/ha
|
2.68
|
2.71
|
4.25
|
6.39
|
1.05
|
1.2
|
2.37
|
42.02
|
27.69
|
19.48
|
29.03
|
37.18
|
37.69
|
2.08
|
1.67
|
2.34
|
4.23
|
|
The product value per tone
|
1000 Toman
|
1050
|
780
|
850
|
870
|
1900
|
2000
|
2200
|
210
|
374
|
300
|
300
|
200
|
200
|
1900
|
1800
|
1700
|
2700
|
|
Constraints
|
Maximum available agricultural land
|
ha
|
400
|
300
|
40
|
20
|
200
|
200
|
200
|
30
|
40
|
40
|
40
|
40
|
40
|
140
|
200
|
60
|
110
|
|
The minimum land required for production
|
ha
|
374
|
185
|
24
|
8
|
57
|
59
|
8
|
2
|
3
|
2
|
3
|
3
|
5
|
72
|
60
|
56
|
95
|
|
Computational value
|
Value per hectare
|
1000 Toman
|
2.81
|
2.11
|
3.62
|
5.56
|
2
|
2.39
|
5.21
|
8.82
|
10.35
|
5.84
|
8.71
|
7.44
|
7.54
|
3.95
|
3.01
|
3.97
|
11.42
|
|
The minimum land required for production
|
ha
|
374
|
185
|
24
|
8
|
57
|
59
|
8
|
2
|
3
|
2
|
3
|
3
|
5
|
72
|
60
|
56
|
95
|
|
Minimum water required to provide the desired capacity
|
1000
m3
|
1622.4
|
688.2
|
98.3
|
39.6
|
225.1
|
271.2
|
77.3
|
9.0
|
19.0
|
7.8
|
10.2
|
14.6
|
8.8
|
475.5
|
295.2
|
179.3
|
840.9
|
* The data is assumed only for the case study and annual distribution is considered.
2.2.2 Optimization Modeling
The optimization problem had been modeled with the purpose of maximizing the final value of farming and subject to minimum water required, the optimal farming land and the supplying the minimum demand of any agricultural product (equation 4 to 8).
Objective Function:
Maximum Z = Ʃ(Optimal area of agricultural land for production * Value per hectare)i \(∀i=1,2,3,…,17 \) (4)
Constraints:
Minimum water required to provide the desired capacityi \(≤\) the total allocated water \(∀i=1,2,3,…,17 \) (5)
The optimal area of agricultural landi \(≤\) Maximum available agricultural land i \(∀i=1,2,3,…,17 \) (6)
The optimal area of agricultural land i \(≥\) Minimum land required for production i \(∀i=1,2,3,…,17 \) (7)
The minimum tonnagei \(≥\) Average production per hectare i \(∀i=1,2,3,…,17 \) (8)
2.2.3 Implementation
The explained model solved through Linear Programming in MS Excel (Solver). Excel includes an effective tool called Solver for optimization problems. The solver can solve the vast majority of optimization problems like linear programming, nonlinear programming and integer programming.
2.2.4 The cost estimation:
The predicted expenses of the fertilizer of farming, including phosphate fertilizer, nitrogenous fertilizer, and potash fertilizer were the last phase. Considering that the objective function determined the best cropping pattern in terms of the number of acres of every crop, we are able to estimate and forecast the cost of the each fertilizer. For this specific purpose, we need to multiply the obtained result of cultivation pattern in hector to cost breakdown values in tables obtained from ministry of agriculture of Iran (Table 3).
Table 3. The average consumed and cost of fertilizer
|
|
Phosphate
|
Nitrogen
|
Potash
|
other
|
total
|
|
|
Cost per kg
|
Weight (kg/ha)
|
Cost per kg
|
Weight (kg/ha)
|
Cost per kg
|
Weight (kg/ha)
|
Cost per kg
|
Weight (kg/ha)
|
Cost per kg
|
Weight (kg/ha)
|
|
Wheat
|
78
|
152
|
66
|
232
|
61
|
18
|
126
|
8
|
72
|
410
|
|
Barley
|
75
|
152
|
60
|
180
|
64
|
9
|
120
|
9
|
68
|
350
|
|
Husks
|
109
|
249
|
43
|
398
|
92
|
22
|
349
|
11
|
65
|
680
|
|
Corn
|
83
|
144
|
73
|
331
|
77
|
19
|
286
|
7
|
81
|
502
|
|
Pea
|
79
|
48
|
62
|
50
|
54
|
6
|
179
|
0
|
69
|
104
|
|
Lentil
|
80
|
89
|
74
|
98
|
54
|
6
|
1500
|
0
|
77
|
188
|
|
Sunflower
|
81
|
162
|
73
|
215
|
60
|
26
|
133
|
5
|
76
|
408
|
|
Cotton
|
80
|
191
|
65
|
244
|
63
|
14
|
612
|
2
|
74
|
452
|
|
Sugar beet
|
94
|
246
|
73
|
275
|
66
|
45
|
128
|
23
|
83
|
589
|
|
Watermelon
|
91
|
187
|
75
|
194
|
81
|
16
|
184
|
46
|
90
|
443
|
|
Cucumber
|
92
|
254
|
79
|
411
|
82
|
56
|
205
|
70
|
90
|
791
|
|
Potato
|
89
|
269
|
81
|
361
|
69
|
70
|
316
|
12
|
90
|
713
|
|
Onions
|
99
|
233
|
94
|
333
|
67
|
28
|
185
|
29
|
98
|
623
|
|
Tomatoes
|
102
|
238
|
94
|
379
|
81
|
16
|
232
|
33
|
102
|
687
|
|
Canola
|
83
|
183
|
66
|
225
|
67
|
19
|
341
|
5
|
78
|
433
|
|
Beans
|
93
|
148
|
78
|
162
|
79
|
10
|
157
|
5
|
86
|
325
|
|
Soya bean
|
62
|
107
|
46
|
157
|
67
|
45
|
1582
|
3
|
67
|
311
|
|
Rice
|
136
|
162
|
102
|
219
|
71
|
27
|
189
|
3
|
114
|
412
|


 ,
Faridah Othman 1
,
Faridah Othman 1