2.1 Study area
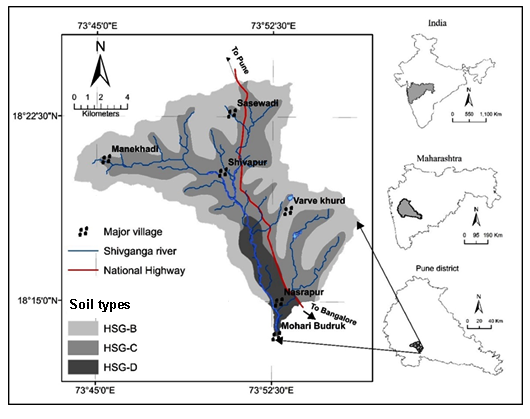
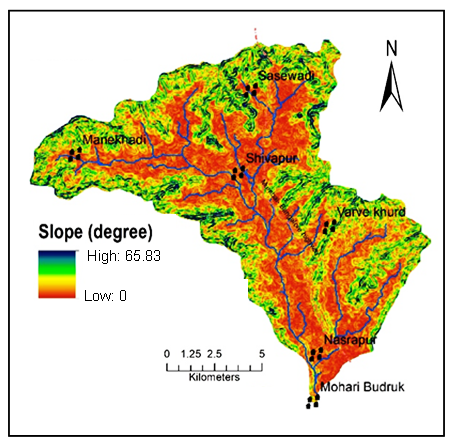
The small mountainous sub-watershed in Shivganga river basin (BM-57) of Upper Nira watershed, in catchment of Upper Bhima is selected for this study. The areal extent of Shivganga watershed is 173.93 km2 which is a part of Pune district, Maharashtra, India (Figure 1). The area show topography with high runoff characteristics of Western Ghats, with an average height of 815m from MSL [mean sea level] and Northwest ground slopes. It receives an annual average rainfall of 950 mm (last 65 years average) and shows a semi-arid climatic condition. The watershed is majorly having waste land followed by vegetation/forest and agriculture land as land use pattern. As semi-urbanised watershed built-up land is also increase along national high way passing through the area. The entire catchment has rugged terrain and basaltic under rocks which favors shallow soils and high soil loss at a places where green growth is less (Kadam et al., 2017). The river basin exhibits different landforms namely a Butte, Escarpment, mesa, Plateau highly dissected, Plateau moderately dissected, Plateau shallow weathered, Plateau slightly dissected and Plateau weathered. Butte, Escarpment and mesa show high loss and high surface runoff present at the fringe of study stretch. Plateau highly dissected indications less runoff rate results into the low potential of loss (Kadam et al., 2018).
Major soil types of Shivganga river basin are forest soils developed on basaltic rocks under the tropical forest cover. Major soil series of Shivganga river basin are the clay and clay loams. Shivganga river basin shows a high species diversity eco-region.
2.2 Average Annual Soil Loss
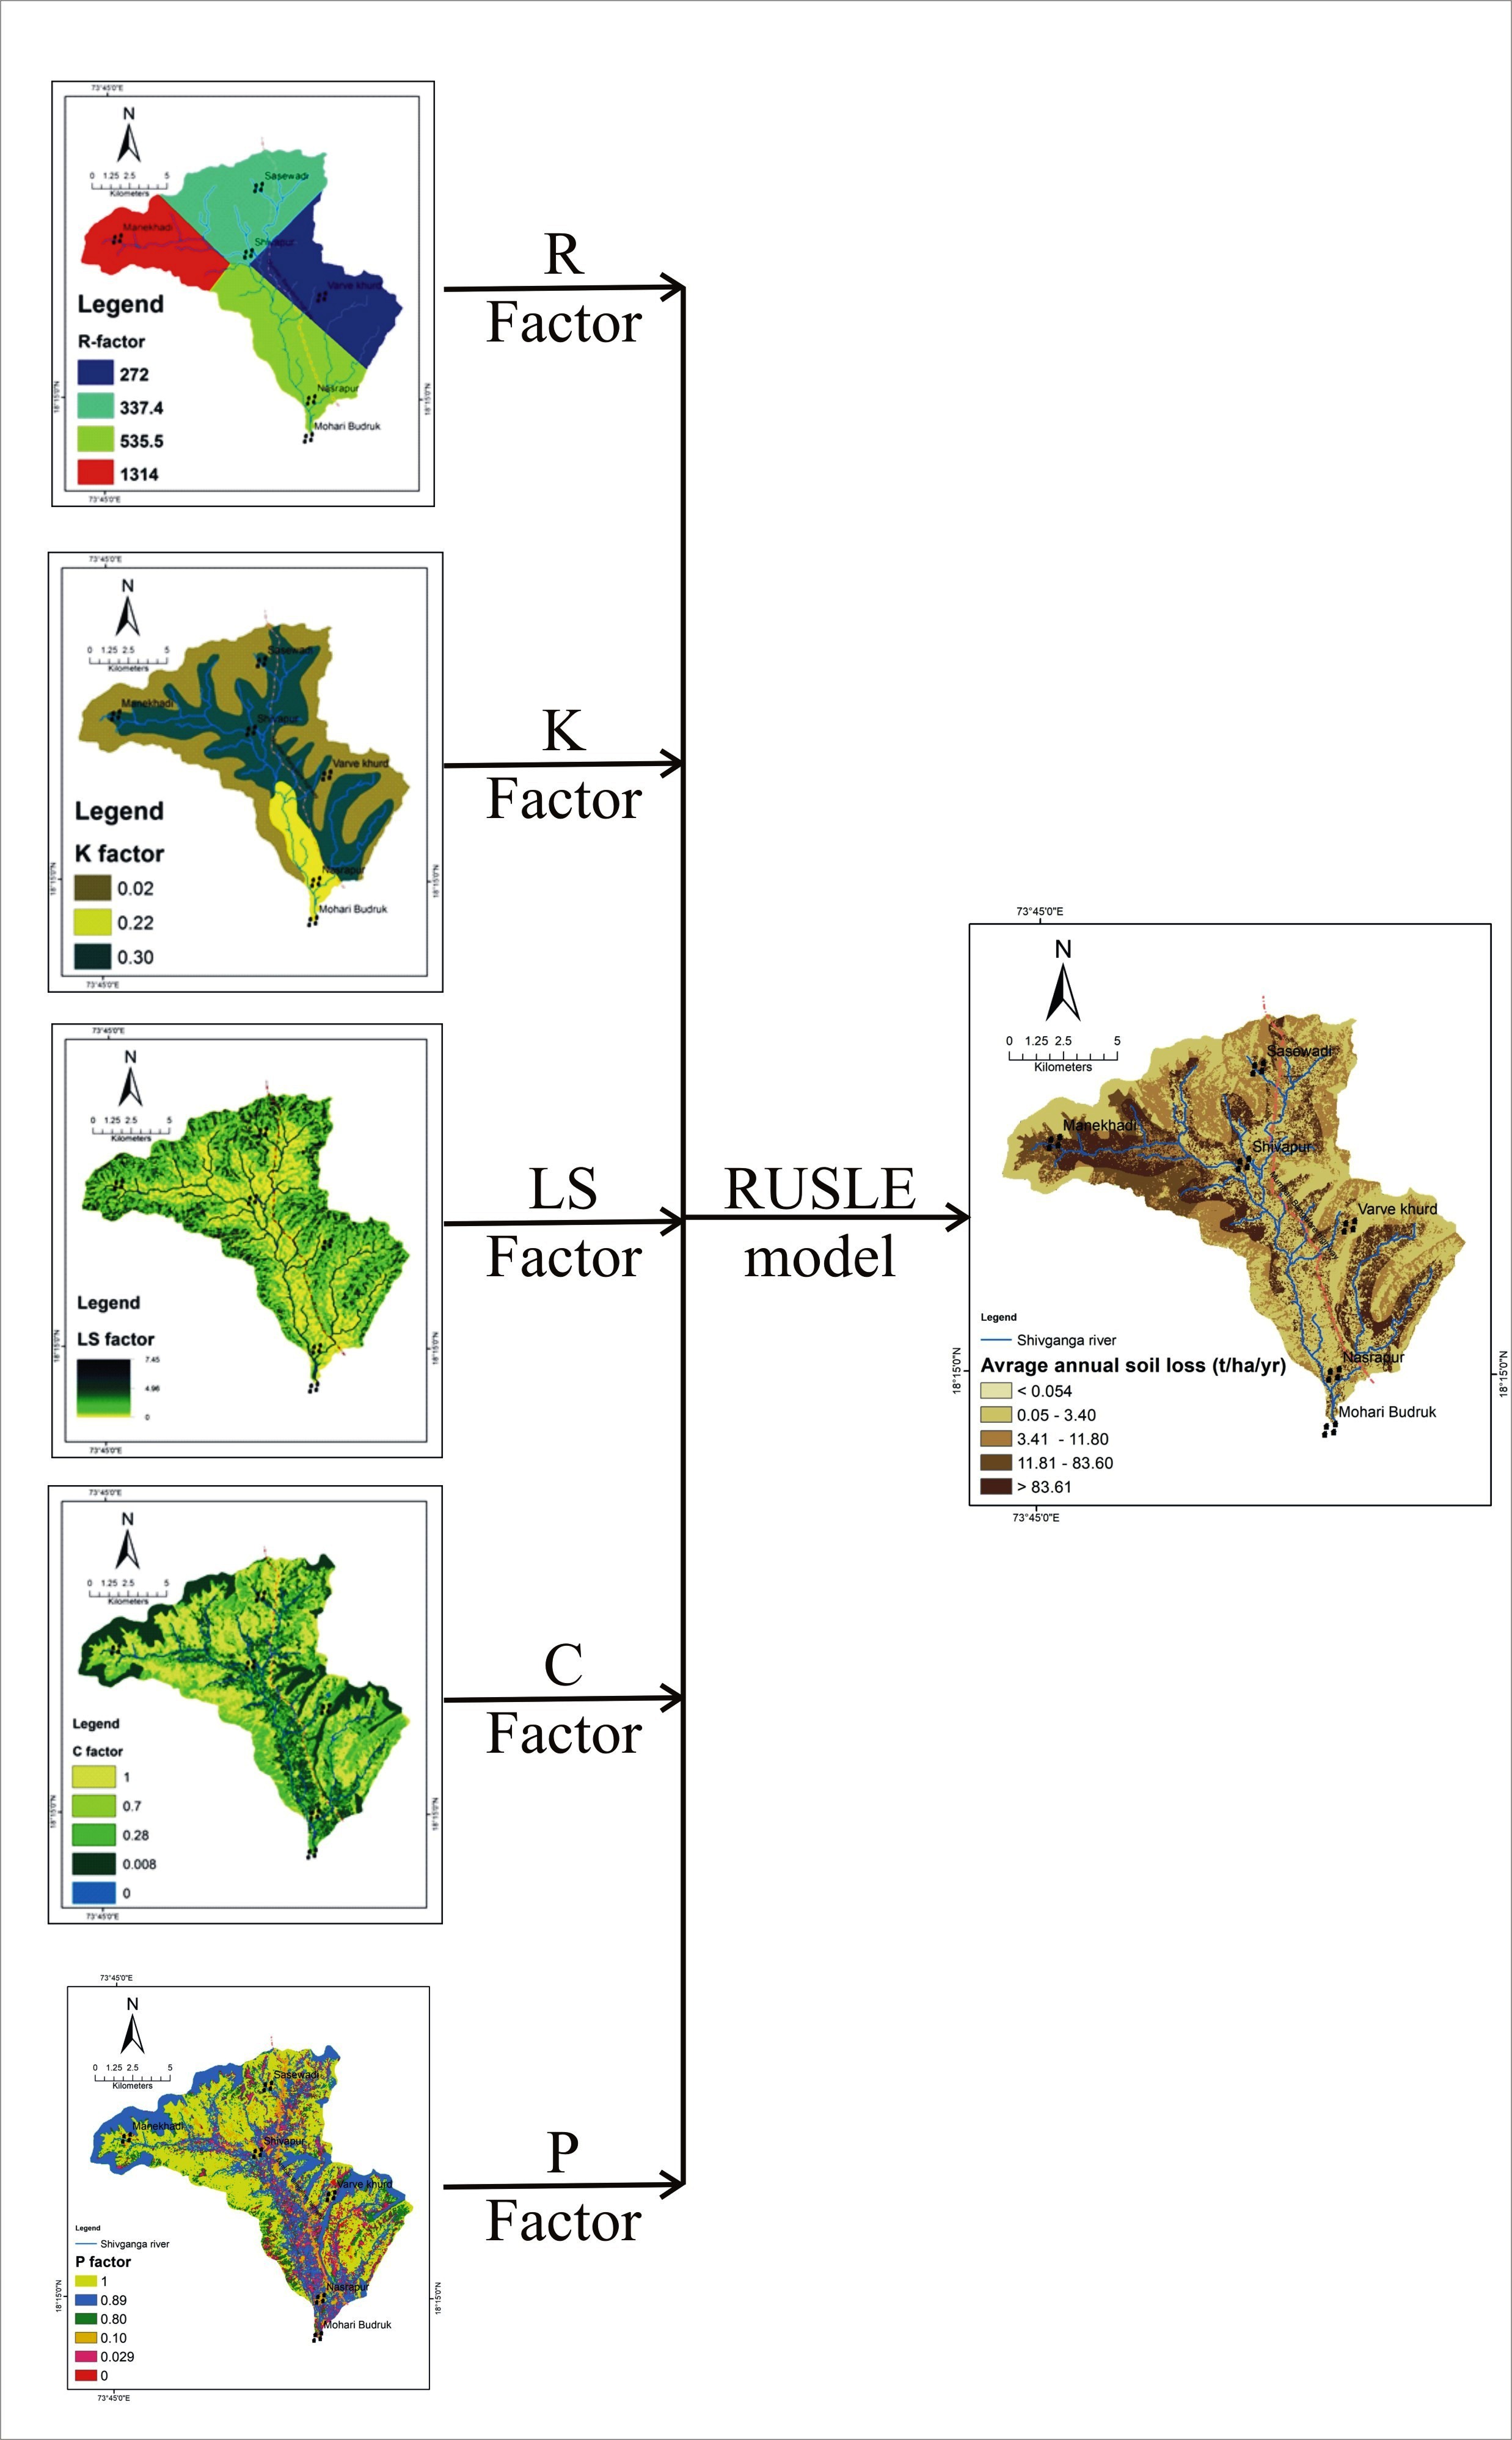
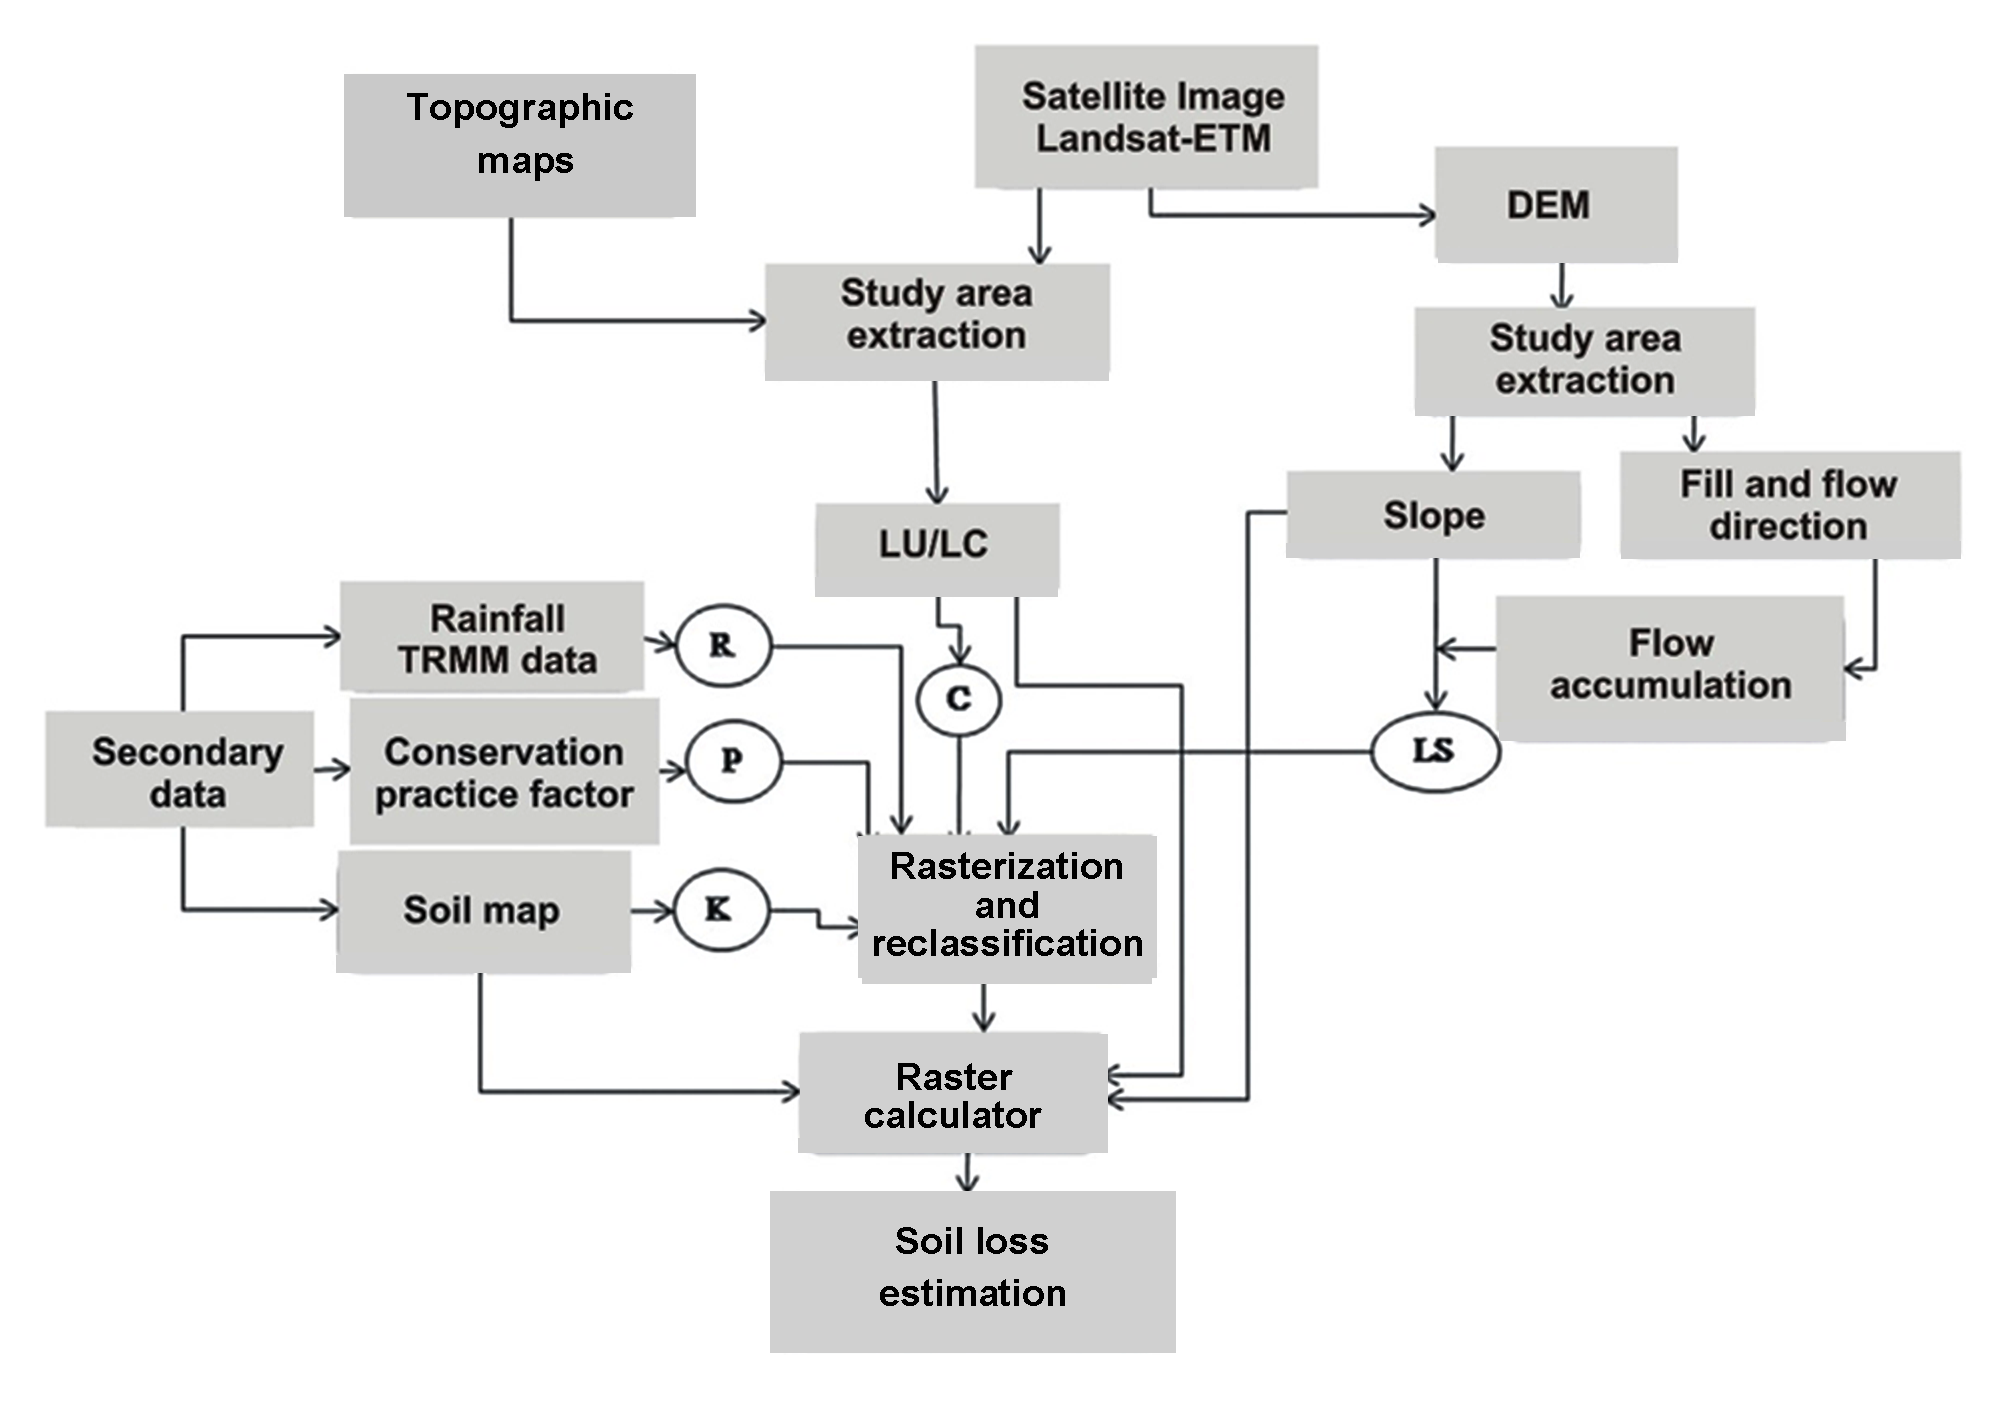
Revised universal soil loss equation (RUSLE) (equation (1)) is used to calculate the average annual soil loss and sediment yield by different types of erosion.
\(A = R×K×LS×C×P \) (1)
where, A is an average annual soil loss in t/ha/yr, R is rainfall-runoff erosivity factor in MJ.mm/ha.h.yr, K is soil erodibility factor in t.ha.h/ha.MJ.mm, LS is topographic or slope length/steepness factor, C is cover and cropping management factor, and P is factor of supporting practices (land use).
2.3 Rainfall Runoff Erosivity Factor (R)
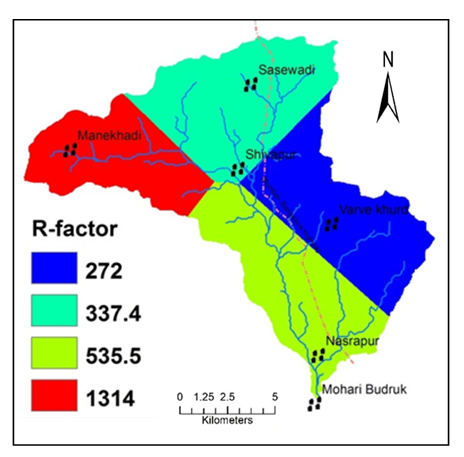
The rainfall-runoff factor reveals the influences of numerous precipitation physiognomies such as period and intensity and soil loss (Markose and Jayappa, 2016). R-factor signifies the main culprit of different erosion by rainfall-runoff (Naqvi et al., 2013). The river basin experiences wide difference in precipitation intensity. Monthly precipitation data (1985 to 2015) of four rain gauge station (Pune city, Bhor, Velhe, and Purandhar) collected from IMD, Pune. The rainfall map was prepared by theisen polygon method in GIS environment (Figure 2) and updated with remote sensing based Tropical Rainfall Measuring Mission (TRMM) monthly rainfall data from NASA. It was used for the calculation of R-factor. Then, the TRMM precipitation grid-based data was added and averaged by ‘grid add’ and ‘grid average’ functions of GIS environment to produce annual average rainfall map of the study area. R-factor was computed using the formula proposed by Arnoldus (1980) (equation (2)).
\(R = P× 0.5\) (Roose, 1975) (2)
where, R is the rainfall erosivity factor and P is the mean annual precipitation in mm.
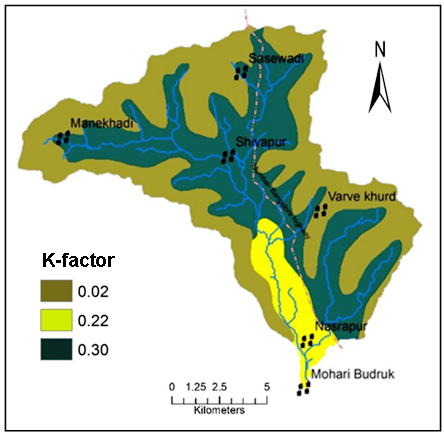
2.4 Soil Erodibility Factor (K)
The soil erodibility factor (K) signifies the properties of soil and its physiognomies to the soil attrition (Markose and Jayappa, 2016). The soil erodibility is function textural properties of soil (sand, silt, and clay composition), percent orogenic material, and perviousness of soil and also the elemental concentration Fe, Al, and Na in soil (Markose and Jayappa, 2016, Kadam et al., 2012).
Soil map from National Bureau of Soil Survey and Land Use Planning (NBSS&LUP), Nagpur (1:500,000) (Table 1) was used to derive ‘K’ factor. The map shows clayey (HSG-D) (8.01%), clay loamy (HSG-C) (42.37%) and sandy clayey loamy (HSG-B) (49.63%) types of soils (Figure 3). Stone and Hilborn (2000) were given K values for soil groups as: 0.22 for HSG-D, 0.3 for HSG-C, and 0.02 for HSG-B.
Table 1. Data used
|
Data
|
Sources
|
Map
|
Description
|
|
Topo-sheet
|
Survey of India (SOI), 1: 50,000 scale
|
Study area boundary
|
Topo-sheet was used to demarcate watershed boundary.
|
|
Rainfall
|
Tropical Rainfall Measuring Mission (TRMM)
|
Rainfall map
|
Rainfall map was used to calculate the R-factor
|
|
Soil series data
|
National Bureau of Soil Survey and Land Use Planning (NBSS and LUP), Nagpur.
|
Soil map
|
Soil map was used for calculation of K-factor (soil erodibility)
|
|
ASTER- GDEM
|
NASA’s Land Processes Distributed Active Archive Center (LP DAAC)
|
Digital elevation model (DEM) and Slope
|
Digital elevation map (DEM) and slope map was used to calculate the LS-factor
|
|
Satellite imagery
|
Landsat-8 (2016)
|
Land use / land cover (LULC)
|
LULC map was used for calculation of P- and C-factors.
|
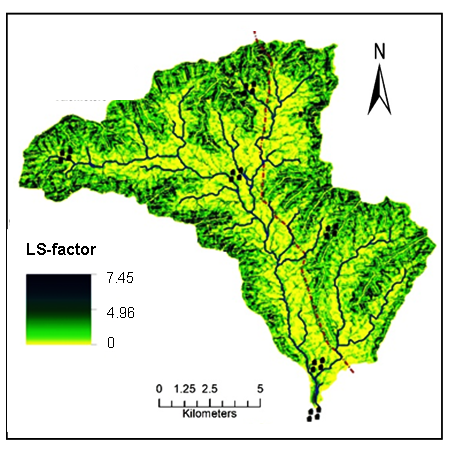
2.5 Slope Length and Steepness Factor (LS)
LS-factor symbolizes the impact of slope length (L) and its steepness (S) on the soil erosion. LS-factor in USLE characterizes the ratio of soil loss on given slope length and steepness to soil loss (Remortel et al., 2001; Pham et al., 2018). ASTER-GDEM was used to calculate for LS-factor in the model maker using ArcGIS environment. LS-factor calculated as (equation (3)):
\(LS = Power (flow \ accumulation × pixel \ size / 22.1,0.4) × \)
\(Power (Sin (slope \ in \ degree × 0.01745) / 0.09,1.4) × 1.4 \) (3)
where, LS is collective slope length and steepness factor. Flow accumulation was derived from DEM having cell size 30 m and sin slope is nothing but sin of slope angle in degrees. LS-factor varies from 0 to 7.45 (Figure 4).
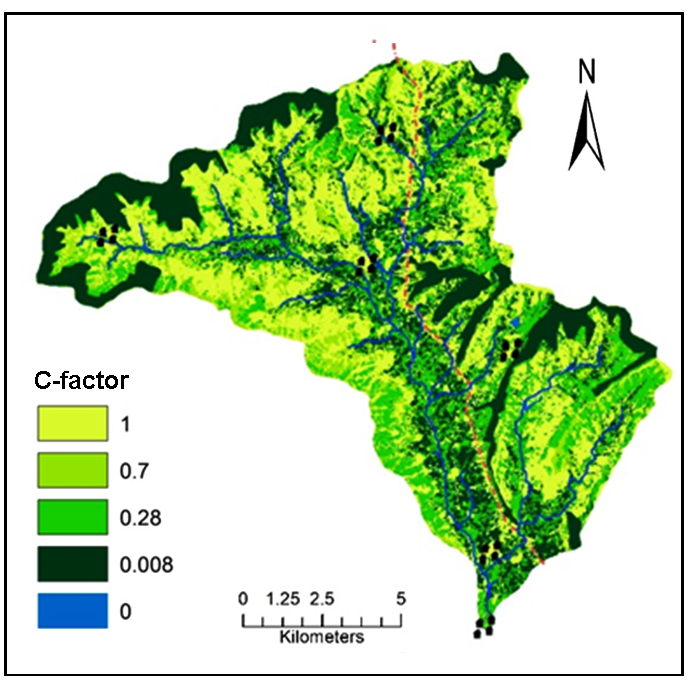
2.6 Cropping Management Factor (C)
C-factor is another most significant factor that regulates topsoil loss hazard (Patil et al., 2014; Devatha et al., 2015; Pham et al., 2018), and it replicates the consequence of harvesting and administration practices on the soil loss amount (Anache et al., 2014; Devatha et al., 2015; Singh and Panda, 2017; Pham et al., 2018). C-factor is most significant for crop management. Subsequently, C-factors values are not calculated or identify for maximum of Indian crops. Therefore, C-factors suggested by Karaburun (2010) were used to show the outcome of cropping and management practices on rate of soil loss in cultivated lands. The effects of plants canopy and ground covers on deceasing soil loss in forested regions (Renard et al., 1997) changes with period and crop yield scheme. The periodic difference of C-factor rests on numerous aspects such as precipitation, cultivated exercise, type of crops, etc. However, the present practices measured a yearly difference as there is no farming in rabbi season (November-April) in the study area and similarly, no precipitation after October. The comparative influence of management possibilities can simply be likened with variations in C-factor which fluctuates from near zero for a well-protected land use to 1 for barren areas.
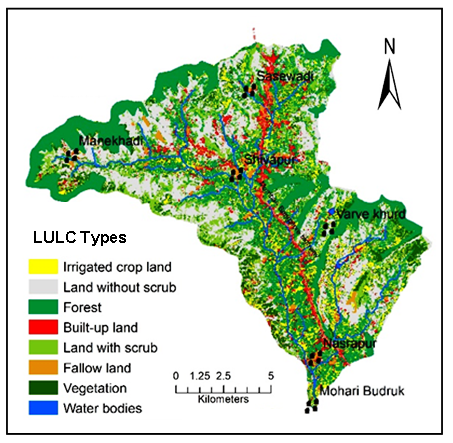
Landsat 8 image was classified using supervised classification technique in ERDAS Imagine 9.1 software. The supervised classification technique requires ground truth information for each LULC category which was collected using global position system (GPS) and trained the process for eight LULC class. The overall accuracy of the classification was about 83%.
Shivganga basin was classified into eight LULC classes: water body, forest area, built-up area, land with and without scrubs, agriculture lands, fallow lands and vegetated area (Figure 5). The area related with each LULC classes were premeditated and C-factors were assigned (Table 1). The map of crop management factor (Figure 7) was prepared from LULC map. C-values were used in the present study proposed by Kim et al. (2005). LULC map was reclassified based on C-factors to map the C-factor.
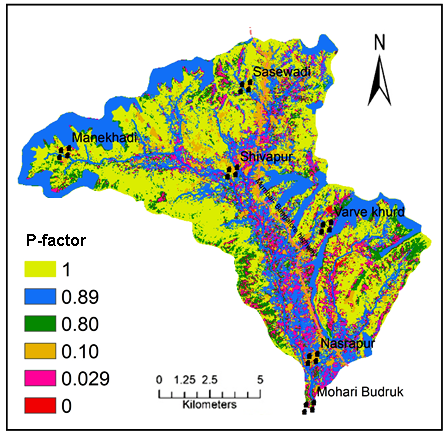
2.7 Conservation Practice Factor (P)
The factor of support practices (P-factor) is the soil-loss ratio with a definite support exercise to the matching soil losses with up and down slope of land for growing crops (Renard et al., 1997). In this approach, P-factor map was prepared from LULC and slope map with support factors. The slope map (%) was prepared using DEM in GIS environment and it was merged with LULC using ‘union function’. P-values (Table 2) were then assigned to the merged classes to prepare the map of P-factor. P-factor values vary from 0 to 1, where uppermost value is allocated to zones with no management practices (barren land); the lowest values to built-up-land and vegetated area with strip and contour cropping. More operative the preservation practices show the lowest P-value. Subsequently, there is no ground data available concerning with the conservation practices done in the Shivganga basin.
Table 2. LULC classes
|
Land use/land cover
|
Description
|
% Area
|
C-factor values
|
|
Built-up land
|
areas characterized by buildings, asphalt/concrete structures, city gardens, and a systematic street pattern
|
6.38
|
0.08
|
|
Irrigated crop land
|
redefined to describe land producing crops requiring annual replanting
|
14.07
|
0.7
|
|
Fallow land
|
cropland that is not cultivated for a season; it may or may not be ploughed
|
31.07
|
0.7
|
|
Water bodies
|
the part of the Earth’s surface arresting water naturally or artificially
|
0.57
|
0
|
|
Forest
|
is a large area covered with trees or other woody vegetation
|
14.27
|
0.008
|
|
Vegetation
|
one crop is specifically planted for widespread commercial sale
|
13.84
|
0.008
|
|
Land with scrub
|
A land in which plant community characterised by vegetation / shrubs
|
16.94
|
0.28
|
|
Land without scrub
|
The sloping or hilly land without biomass
|
2.22
|
0.28
|
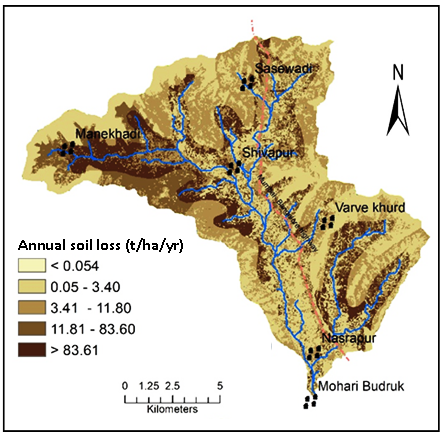
2.8 Assessment of Possible Soil Erosion
In RUSLE modeling, the precipitation erosivity, soil erodibility and ground aspect can be measured as certainly happening aspects causal to soil loss processes. They can be considered as the erosion vulnerability or possible soil loss for the zone.
2.9 Demarcation of Soil Loss Zones
Annual soil loss from the study area was calculated by integrating the R, K, LS, C and P factors for this catchment, using the raster calculator function available in the ArcGIS for each pixel. Major aspects are considered to be prompting soil loss comprise of LULC, soil characteristics, precipitation strength and gradient. The weightages for discrete layer were allocated by considering part in the soil loss. The maximum value is given to the feature with maximum vulnerability and the least being to the lowest susceptible feature. The analysis for soil loss estimation was done using GIS environment, and spatial data (Figure 6).


 ,
BHAVANA Umrikar 2
,
BHAVANA Umrikar 2