2 (2018), 2, 83-90

Hydrospatial Analysis

2582-2969

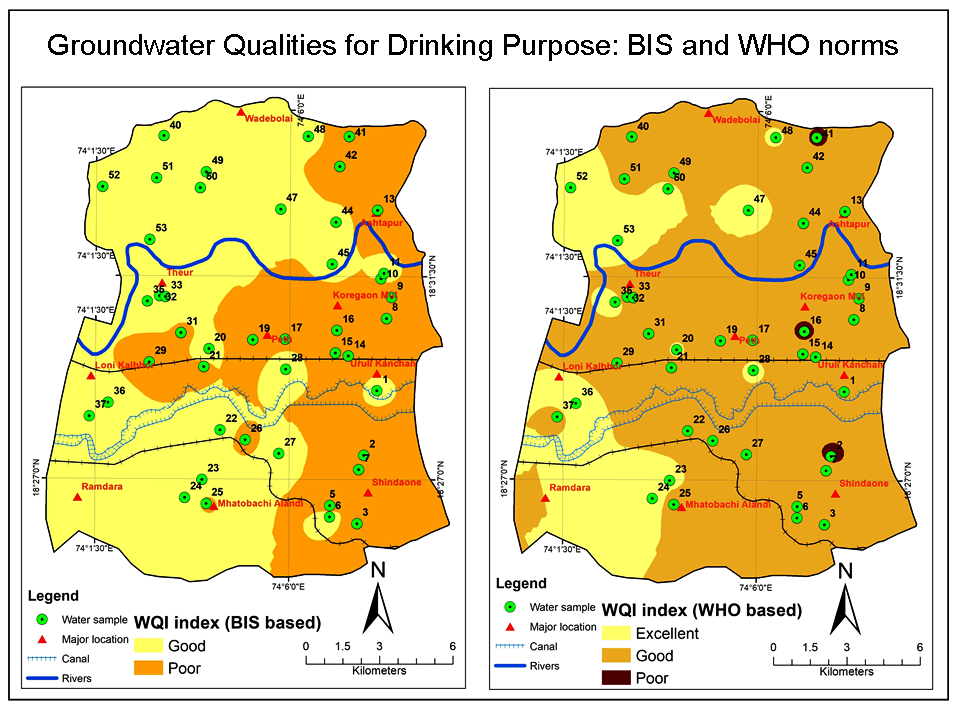
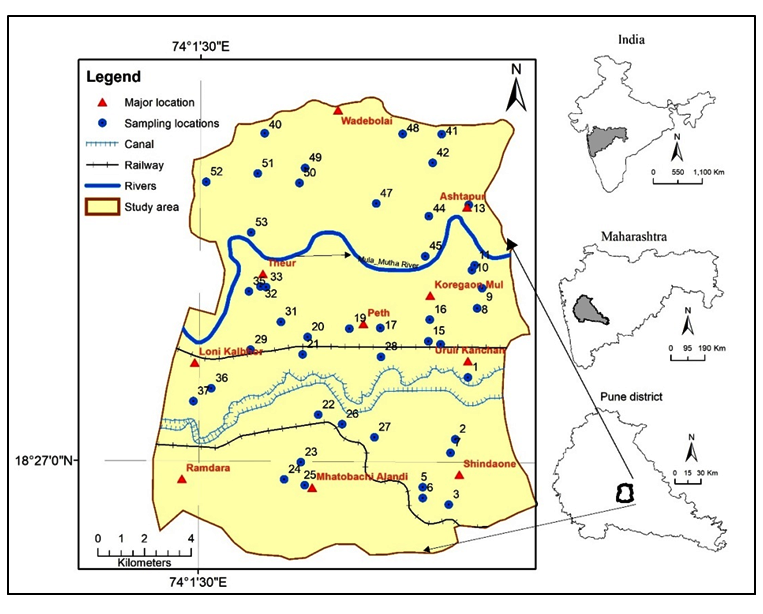
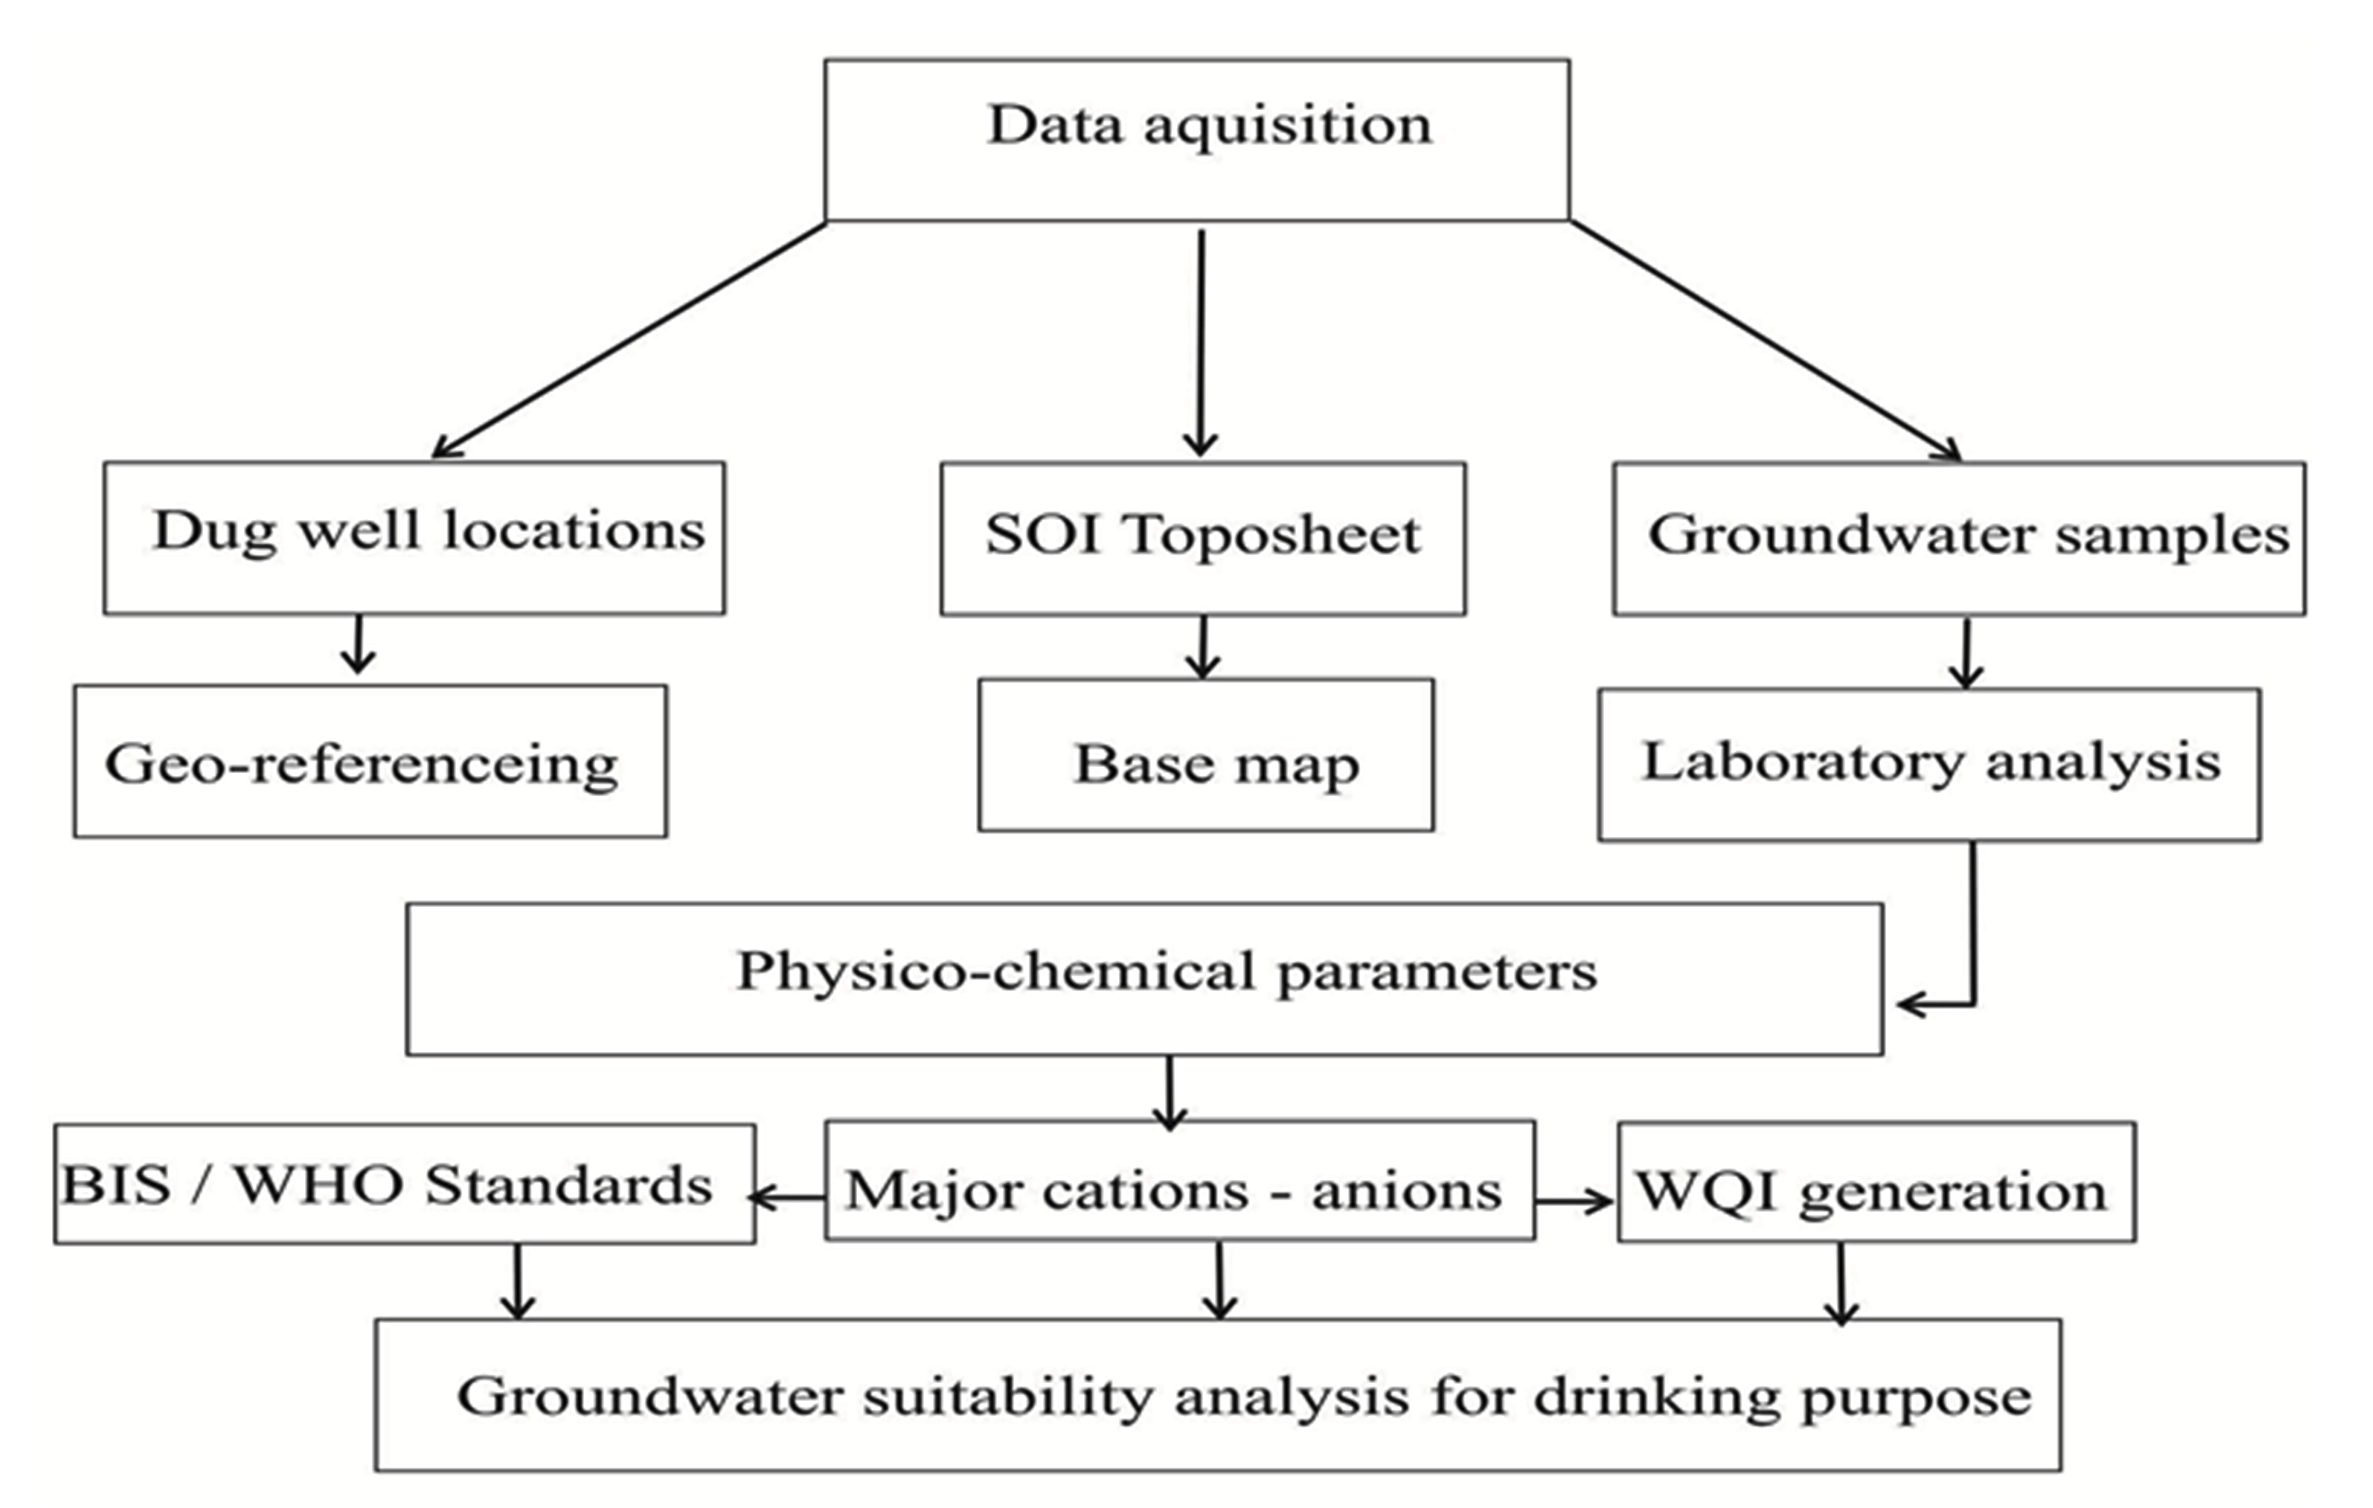
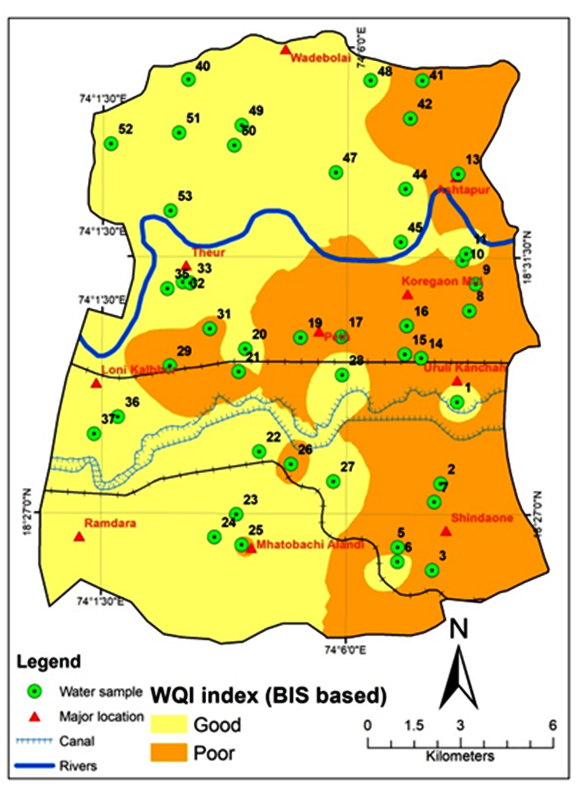
Suitability Assessment of Groundwater Quality for Drinking Purpose by Physicochemical Characterization and Water Quality Index from Haveli Region India

Smita Lad 1 , Swati Mukherjee 2 , BHAVANA Umrikar 2

1.Department Of Environmental Science, Savitribai Phule Pune University, Pune 411007

2.Department of Geology, Savitribai Phule Pune University, Pune - 411 007 (India).

Miss.Smita Lad*

*.Department Of Environmental Science, Savitribai Phule Pune University, Pune 411007

Dr.Pramodkumar Hire 1

1.Department of Geography, HPT Arts and RYK Science College, Nashik - 422 005.

17-02-2019
12-01-2019
10-02-2019
15-02-2019

Graphical Abstract

Highlights

  1. WQI method is used for evaluation of groundwater quality for drinking purpose.
  2. The groundwater quality indexing is performed based on BIS and WHO standards.
  3. Groundwater samples from dug wells taping basaltic water table located in Haveli taluka adjoining Pune city were collected and analysed for major cations and anions.
  4. About 43% samples were reported in poor category according BIS standards.
  5. About 38%, 57%, 6% samples were representing excellent, good and poor groundwater as per WHO standards, respectively.
  6. Groundwater sample from agricultural land-use is a more contaminated due return flow of agriculture.

Abstract

The emulsification of major constituents in groundwater is accentuated to highlight the impact that is anticipated to be the prime concern due to depleting quality of this resource used for drinking purpose. In view of this, 53 groundwater samples of dug wells taping basaltic water table aquifer located in Haveli taluka adjoining Pune city of Maharashtra, India were collected and analyzed for major cations and anions to evaluate the suitability using water quality index (WQI). The parameters such as pH, Total Hardness (TH), Sodium (Na) and Sulphate (SO4) were assigned with weight 5 and the weight 1 considered as lowest level was assigned to Calcium (Ca++), Magnesium (Mg++), Potassium (K+), Carbonate (CO3--), Bicarbonate (HCO3-) and Phosphate (PO4) and observations were made to know the groundwater quality of the study area. Using these values, the WQI was calculated that revealed according to BIS standards 57% of samples falls in good category, and 43% samples in poor category, while according to WHO standards 38%, 57%, 6% were representing excellent, good and poor category, respectively.

Keywords

Weights , Pune City , Permissible Limit , Groundwater Quality Index , Groundwater pollution , BIS

1 . INTRODUCTION

Water is the most precious and prime natural resource for the socio-economic development of the nation. Aquatic resource is one of the furthermost delicate and sensitive; hence an in-depth understanding of the spatio-temporal setting is necessary for the sustainable development (Foster et al., 2002; Wakode et al., 2014). Apart from this, the threat of contamination of this precious resource is increasing day by day due to both geogenic and anthropogenic sources (Jat et al., 2009; Khan et al., 2015; Wagh et al., 2018; Kale and Pawar, 2017). As a result the availability and supply of safe and pure drinking water is the major challenge for the developers and planners.

India, being the monsoonal country, surface water becomes scars especially in summer months and hence dependability on groundwater increases for drinking and domestic purposes particularly in rural areas (Tiwari et al., 2015). While, the activities such as rapid urbanization, industrialization, green revolution and increasing population are forcing to change the physicochemical characteristics of groundwater besides the natural soil water interaction process (Rubia et al., 2015). The water quality also varies with the depth of groundwater table, seasonal changes, and deposition of dissolved salts (Gaikwad et al., 2019; Babiker et al., 2007) depending upon sources of the salt and sub-surface environment. Thus, there is a swift change in groundwater characteristics, the risk of health has increased potentially (Thivya et al., 2015; Hussain et al. 2017; Wagh et al., 2019). Along with water borne diseases, the health issues arising due to water contamination are on hike (Cheepi, 2012). Consumption of contaminated groundwater further indulge in affecting human health resulting methemoglobinemia (blue babies) due to high nitrates, sulphate may induce diarrhoea and intestinal disorders, hardness relates to the kidney functioning disorders etc. Hence there is a prior need to assess the quality of groundwater as well as extent of pollution since once deteriorated, then it is truly difficult to recreate its original form and even may take years to get it normalized (Kale et al., 2010; Tamma et al., 2015). To control the groundwater pollution is very challenging and entirely depends on the geo-environmental set up and land use practices. Hence, the groundwater quality assessment has become an important task to understand its suitability for drinking purpose as well as for resource management.

The study area is located near Pune city and experiencing rapid urbanization and industrialization with consequential necessity of water. However, the deterioration of waters in rivers has caused an alarming phenomenon with a subsequent action to be taken towards analyzing and maintaining this precious resource in order to support the sustainable growth of the area. Keeping this in view, the aim of the present study is to deal with the task of groundwater quality assessment for drinking purpose to frame the policy and management plan for protecting it from the contamination and further deterioration.

2 . STUDY AREA

The study area (Figure 1) belongs to Deccan Basaltic Province, spreading over approximately 274 km2 (eastern part of Haveli Taluka, Pune District) and drained by Mula-Mutha river further meets Bhima river, entangling from 74º01ʹ10.13"E to 74º09ʹ34.03"E longitudes and 18º24ʹ47.05"N to 18º35ʹ31.88"N latitude. The area falls in semi-arid region and receives average rainfall of about 760mm annually. The maximum evaporation is observed in the month of May i.e. 267.32 mm and the minimum evaporation (98mm) takes place in August. Majority of the study area is flat to gently sloping topography. Highly dissected plateaus are observed towards the southern part of the study area.


Figure 1. Study area with locations of sampling stations


The water table aquifer comprises of vesicular / weathered, jointed and fractures basalt covered with alluvium in the proximity of Mula-Mutha River flowing through the study area. The alluvium acts as soft rock aquifer with good storativity and transmissivity whereas massive basalt with fractures and joints show low to moderate aquifer characteristics. The southern part of the study area is occupied by barren and waste land, whereas the central part of area experiences intense agricultural practices.

3 . MATERIAL AND METHODS

Survey of India (SOI), Toposheets (47 F/14, 47 J/2, 47 J/3 and 47 F/15) were geo-referenced and digitized to prepare base map of the study area. ArcGIS®10 software is used to analyze the data for the evaluation of groundwater quality. The area was equally divided into grids for assisting demonstrative groundwater sample collection and studying the spatial 

variations in groundwater quality. The study was conducted based on the samples collected from 53 dug well locations during the post-monsoon i.e. December 2015. Sample location points were fixed at the time of sampling and demarcated by using GPS (Global Positioning Systems). Groundwater samples were collected by following the collection, handling and preservation standard procedures (APHA, 1995) to ensure quality. High-density polyethene bottles were used for collection of the groundwater samples. Each polyethylene bottle was rinsed properly with same water to prevent contamination from the bottle during storage. The samples were filled up to the brim and were immediately sealed to avoid exposure to air and were labelled by sample coding systematically. The pH and electrical conductivity (EC) were measured using digital conductivity meters immediately after sampling in the field. The samples were properly stored in refrigerator after collection from the fields. The labelled samples were analyzed in the laboratory for twelve physicochemical parameters like pH, TDS, TH, Ca2+, Mg2+, Na+, K+, HCO3, Cl, SO42− NO3 and PO4- using standard methods prescribed by (APHA 1995; Sarath Prasanth et al., 2012). Total analysis was carried out with freshly prepared double distilled water. The detailed systematic flow chart involving field and Laboratory work has been included in figure 2 to explain the methodology adopted for the study. The instruments used for cation-anion analysis are: Flame-photometer-Elico-CL-361 (sodium and Potassium), Spectrophotometer-Shimadzu-UV-1800 (sulphate, phosphate, and nitrate) were calibrated properly prior to the initiation of lab work. Ion balance errors were scrutinized for major cations and anions after all calculations of analytical work to know the exactness of chemical analysis. The charge balance of the analyzed data (cations and anions) is well within the acceptable range (± 5% of error). All mathematical calculations like average, minimum, maximum, standard deviations were performed for physico-chemical parameters using MS Office, Excel software. The suitability of groundwater for drinking purposes was evaluated by water quality index (WQI) and comparing the values of different water quality parameters with those of the world health organisation (WHO, 2004) and bureau of Indian standard (BIS, 1991) guidelines (Sarath Prasanth et al., 2012; Magesh and Chandrasekar, 2011).


Figure 2. Methodology


Following steps are involved in computation of \(WQI\) :

  1. Assigning Weights (Max. 5): Each parameter has been evaluated according to relevance in drinking quality of groundwater (Table 1)
  2. Relative weights, \(RW_i=AW_i/ \sum AW_i\)  

where, \(AW_i\)  = Assigned weight.

Quality rating, \(Q_i=(C_i/S_i)\times 100 (mg/l)\)  

where, \(Q_i\)  = Quality rating for ith parameter, \(C_i\)  = Concentration of ith parameter in groundwater sample, and \(S_i\)  = desirable limit set by BIS/WHO.

  1. Sub-index, \(S_i=RW_i \times Q_i\)  
  2. Water quality index, \(WQI= \sum SI_i\)  (Wagh et al., 2016)


Table 1. Relative weights of parameters assigned for obtaining WQI

Parameters

 pH

TDS

TH

 Ca

Mg

Na

 K

HCO3

Cl

NO3

SO4

PO4

Total

Weights

3

5

3

2

2

3

2

2

5

5

3

2

37

BIS (1991)

8.5

500

300

75

30

100

10

200

250

45

200

0.3


WHO (2004)

8.5

1500

100

75

30

200

12

200

200

45

200

0.1


Relative weight ( \(RW_i\) )

0.08

0.14

0.08

0.05

0.05

0.08

0.05

0.05

0.14

0.14

0.08

0.05

1.00

Note: BIS/WHO values denote maximum permissible limit.


4 . RESULTS AND DISCUSSIONS

The laboratory analytical results were assessed to determine the suitability of groundwater in the study area for drinking uses as per BIS and WHO standards (Dhakate et al. 2015). Total 14 physicochemical parameters of the groundwater samples were considered for statistical analysis including minimum, maximum, average and standard deviation of major cations and anions (Table 2).


Table 2. Statistical details and BIS-WHO standard limits for cations and anions

Parameter

Standard Limit

Post-monsoon

December-2015

BIS

WHO

Average

Min

Max

SD

pH

6.5-8.5

7.0-8.5

7.93

7.50

8.91

0.24

EC

400

--

1321

680

2900

472

TDS

500

1500

783

418

1636

264

Calcium

75

75

55.20

28.10

103.87

17.31

Magnesium

30

30

39.09

22.01

90.34

12.65

Sodium

100

200

122.91

22.03

364.88

76.41

Potassium

10

12

1.04

0.01

9.87

2.39

Alkalinity

200

200

308

140

570

86

Sulphate

250

250

65.71

9.66

218.29

42.59

Phosphate

0.3

0.1

0.34

0.07

4.48

0.71

Chlorides

250

200

147.99

45.28

382.20

69.15

Nitrate

10

10

41.19

0.09

104.83

28.07

Note: All the parameters are measured in mg/L (except pH, EC)


The statistical summary of physicochemical analysis depict the pH maximum value 8.91 (PL 8.5) which is slightly alkaline nature (sample no 29 and 43) due to recharge from Mula-Mutha river and agricultural land use pattern. TDS show average 783mg/L and BIS/WHO standards indicate, all sites are well within the PL, except sample no 16 due to agricultural activity in the area and sewage of irrigated water. While, calcium has average 55.2 mg/L and maximum value 103.87mg/L, where sample numbers: 16, 21, 30, 41, 51, 52 and 53 are above PL (75mg/L). Whereas, magnesium averaged 39.09mg/l with maximum 90.34mg/L showing almost all sites except sample numbers: 6, 12, 24, 28, 34, 35, 36, 39, 40, 43 and 46 are above PL (30mg/L). Although, sodium shows average value of 122.91mg/L, exceeding BIS limit (100mg/L) where more than 50% samples are above PL and for WHO standards (200mg/L) 15% samples have crossed the standard limit (sample numbers: 2, 3, 5, 8, 9, 16, 19 and 29). Mostly, rock-water interaction shows sodium input in water. On the other hand, Potassium and Sulphate have less concentration in groundwater showing maximum 9.87mg/L (10 PL) and 218.29mg/L (250 PL), respectively. Even though WHO/BIS PL for alkalinity is 200mg/L, it ranges from 140-570mg/L except sample numbers 4, 12 and 46 all 96% samples have exceeded the PL. Phosphate depicts average 0.37mg/L which is above the BIS/WHO standards (PL 0.3/0.1 mg/L). However, chloride had maximum concentration of 382.2mg/L, and sample numbers: 2, 3, 16 and 19 crossed BIS permissible limit (250mg/L), whereas sample numbers: 5, 10, 13, 14, 15 and 29 are above WHO standards (200mg/L), high chloride content cause health issues related to stomach. Nitrate concentration in 80% samples is above PL (10mg/L) except samples:  4, 6, 24, 33, 35, 36, 39, 46, 50, 52 and 53. Drastic high levels of Nitrate may be due to dense agricultural zone and return flow. The GWQI (BIS and WHO) standards and the category in which samples fall are shown in Table 3. There are five categories: excellent, good, poor, very poor and unfit.


Table 3. WQI category for BIS and WHO

Categories

Water Type

BIS

WHO

Samples

Samples

Total

%

Numbers

Total

%

Numbers

<50

Excellent


0


20

38

4, 6, 20, 22, 23, 24, 27, 28, 33, 35, 36, 38, 39, 43, 44, 47, 48, 50, 52 and 53.

50-100


Good


30


57


1, 4, 6, 7, 11, 20, 22, 23, 24, 27, 28, 32, 33, 34, 35, 36, 37, 38, 39, 40, 43, 44, 45, 46, 47, 48, 50, 51, 52 and 53.

30


57


1, 2, 3, 5, 7, 8, 9, 10, 11, 13, 14, 15, 16, 17, 18, 19, 21, 2, 26, 29, 30, 31, 32, 37, 40, 41, 42, 4, 49 and 51.

100-200

Poor

23

43

2, 3, 5, 8, 9, 10, 12, 13, 14, 15, 16, 17, 18, 19, 21, 25, 26, 29, 30, 31, 34, 42 and 49.

3

6

12, 34 and 46

200-300

Very poor

-

-

-

-

-

-

>300

Unfit

-

-

-

-

-

-


Total

53

100


53

100

-


Results of WQI using the BIS standards show that 57% of samples fall in good category while 43% in poor category. In continuation with this, when all samples were checked for WHO standards indicate excellent 38%, 57% good while 6% poor category.

The BIS based WQI values range from 52.5 to 195 whereas for WHO from 30.3 to 98.3 (Figure 3a and b). The highest index value has been observed near village Shindavane by both standards near river as well as at sources part (sample 41) where dug well taping in perched basaltic aquifer. Overall results show that according to WHO standard WQI shows maximum samples in non-effective category, while Astapur, Theor, Malwadi (Jagtapmala) and Mula-Mutha surface water samples in Theor (12, 34 and 46) represent poor category because of return flow, rock-water interaction, and agricultural practices. Whereas, the BIS limits indicate 43% of the samples in poor category. The locations of the villages in study area (Table 4) are  indicating poor category based on BIS standards, most of the samples present in the intensive agricultural zone which may increase the risk of contamination in groundwater due to percolation after irrigation, some are in the proximity of river and pump the water directly to well hence increase the risk of changes in ionic characteristics of well water, while some locations show contamination due to seepage or return flow. Thus, there is a need to minimize the risk of future health hazard and groundwater deterioration due to contamination.


Table 4. Villages with poor category of WQI

Sr. No

Sample type

Longitude

Latitude

Name of the village

1

Dug Well

74.07.44

18.27.32

Uralikanchan

2

Dug Well

74.07.35

18.26.01

Shindavane

3

Dug Well

74.06.58

18.26.25

Walati Khopade vasti

4

Dug Well

74.08.15

18.30.34

Venkateshnagar

5

Dug Well

74.08.22

18.31.02

Kad vasti

6

Dug Well

74.08.07

18.31.27

Bhavarapur bhagyodaya society

7

Surface Water

74.07.51

18.32.36

Astapur

8

Dug Well

74.08.02

18.32.58

Astapur

9

Dug Well

74.07.22

18.29.44

Koregaon

10

Dug Well

74.07.04

18.29.48

Koregaon

11

Dug Well

74.07.06

18.30.18

Uralikanchan

12

Dug Well

74.05.54

18.30.06

Peth

13

Bore Well

74.05.47

18.29.58

Peth

14

Dug Well

74.05.09

18.30.05

Pethnaygao road

15

Dug Well

74.04.1

18.29.29

Kunjirwadi

16

Dug Well

74.04.05

18.26.27

Mhatobachi alandi

17

Dug Well

74.04.60

18.27.52

Chorage vasti

18

Dug Well

74.02.45

18.29.36

Gadhave Mala

19

Bore Well

74.03.35

18.30.80

Tambe Vasti tarmala-Theor Rd

20

Dug Well

74.03.29

18.30.14

Tambe Vasti

21

Surface Water

74.02.16

18.31.45

Theor bridge

22

Dug Well

74.07.09

18.33.56

Kholshet Vasti

23

Dug Well

74.04.03

18.33.48

Wade


Figure 3a. Spatial distribution of water quality based on BIS standard


Figure 3a. Spatial distribution of water quality based on BIS standard


5 . CONCLUSION

The groundwater quality study conducted for eastern part of Haveli region depicts that the pH value of the ground water is slightly alkaline in nature and bears the value within the permissible limit and suitable for drinking purpose at all locations. However, the concentration of TDS in the groundwater suggests that it is within the classification of fresh water, involving many samples of the study area. Most of the parameters like magnesium, sodium, alkalinity, phosphate and nitrate have high concentrations due to ion exchange process as well as fertilizer intake.

Based on WQI calculated for the representative samples as per WHO standards, majority of the groundwater samples indicate that water is safe. Whereas, BIS standard indicates, the area besides river as well as dense agricultural zone indicate groundwater with high WQI, which is because of magnesium, sodium, alkalinity, phosphate and nitrate concentrations in groundwater samples due to agriculture and use of chemical fertilizers. As the groundwater is the main source in most of the villages, even the zone is intensively irrigated there may be future declining trend of WQI is possible. This study suggests that the possible contamination sources of groundwater such as domestic waste and fertilizers must be controlled by recycling and constant monitoring to keep this valuable resource reserve for forthcoming generations.

Conflict of Interest

The authors declare no conflict of interest.

Acknowledgements

Anonymous reviewers thanked for comments and suggestions useful to improve the manuscript.

Abbreviations

BIS: Bureau of Indian Standards; BW: Bore Well; DW: Dug Well; EC: Electrical Conductivity GPS: Global Positioning Systems; GWQI: Groundwater Quality Index; PL: Permissible Limit; SW: Surface Water; TDS: Total Dissolved Solids; TH: Total Hardness; WHO: World Health Organization; WQI: Water Quality Index.

References

1.

APHA, A. WEF, 2005. Standard methods for the examination of water and wastewater, 21, 258-259.

3.

BIS [Bureau of Indian Standards], 1991. Specification for drinking water (IS 10500: 1991).

6.

Foster, S., Hirata, R., Gomes, D., D’Elia, M. and Paris, M. 2002. Ground-water quality protection: a guide for water utilities, munciple authorities and environment agencies. The international Bank for Reconstruction and Development/World Bank Technical Paper. Washington, D.C

8.

GSI, 2007. District Resource Map (DRM). Geological Survey of India. Govt. of India, Pune.

16.

Rubia, J, D. C. and Singh, V. K., 2015. Urbanization and its impact on groundwater: An overview. Workshop on Groundwater Issues and Challenges in Chhattisgarh State with Special Reference to its Conservation, Security and Quality. Central Ground Water Board, NCCR, Ministry of Water Resources, River Development and Ganga Rejuvenation. Govt. of India, 127-136

25.

WHO [World Health Organization], 2004. Guideline for drinking water quality, 3rd edn. Recommendation World Health Organization, Geneva.