1 . INTRODUCTION
A major paradigm shift which occurred after the Second World War was the development of statistical and quantitative geomorphology. Analysis of interrelationships between forms and processes in different spatial and temporal scale is a major thrust area of this field.
As per Strahler, erosion and deposition of connected stream networks produces different fluvial landforms (Joji, et al., 2013). The morphology, hydrology and evolutionary history of any basin can be best understood through different mathematical morphometric characteristics of such basin (Sharma and Sarma, 2013). The size of the basin, its shape and other dimensions can also be evaluated through different morphometric indicators. The relationship between various drainage parameters and its underlying geology, geomorphology, hydrology and structure has also been well established through the work of different geologists and geomorphologists (Strahler, 1952). Finally, it is also possible to explain the difference in hydrological behaviour of any basin using these techniques.
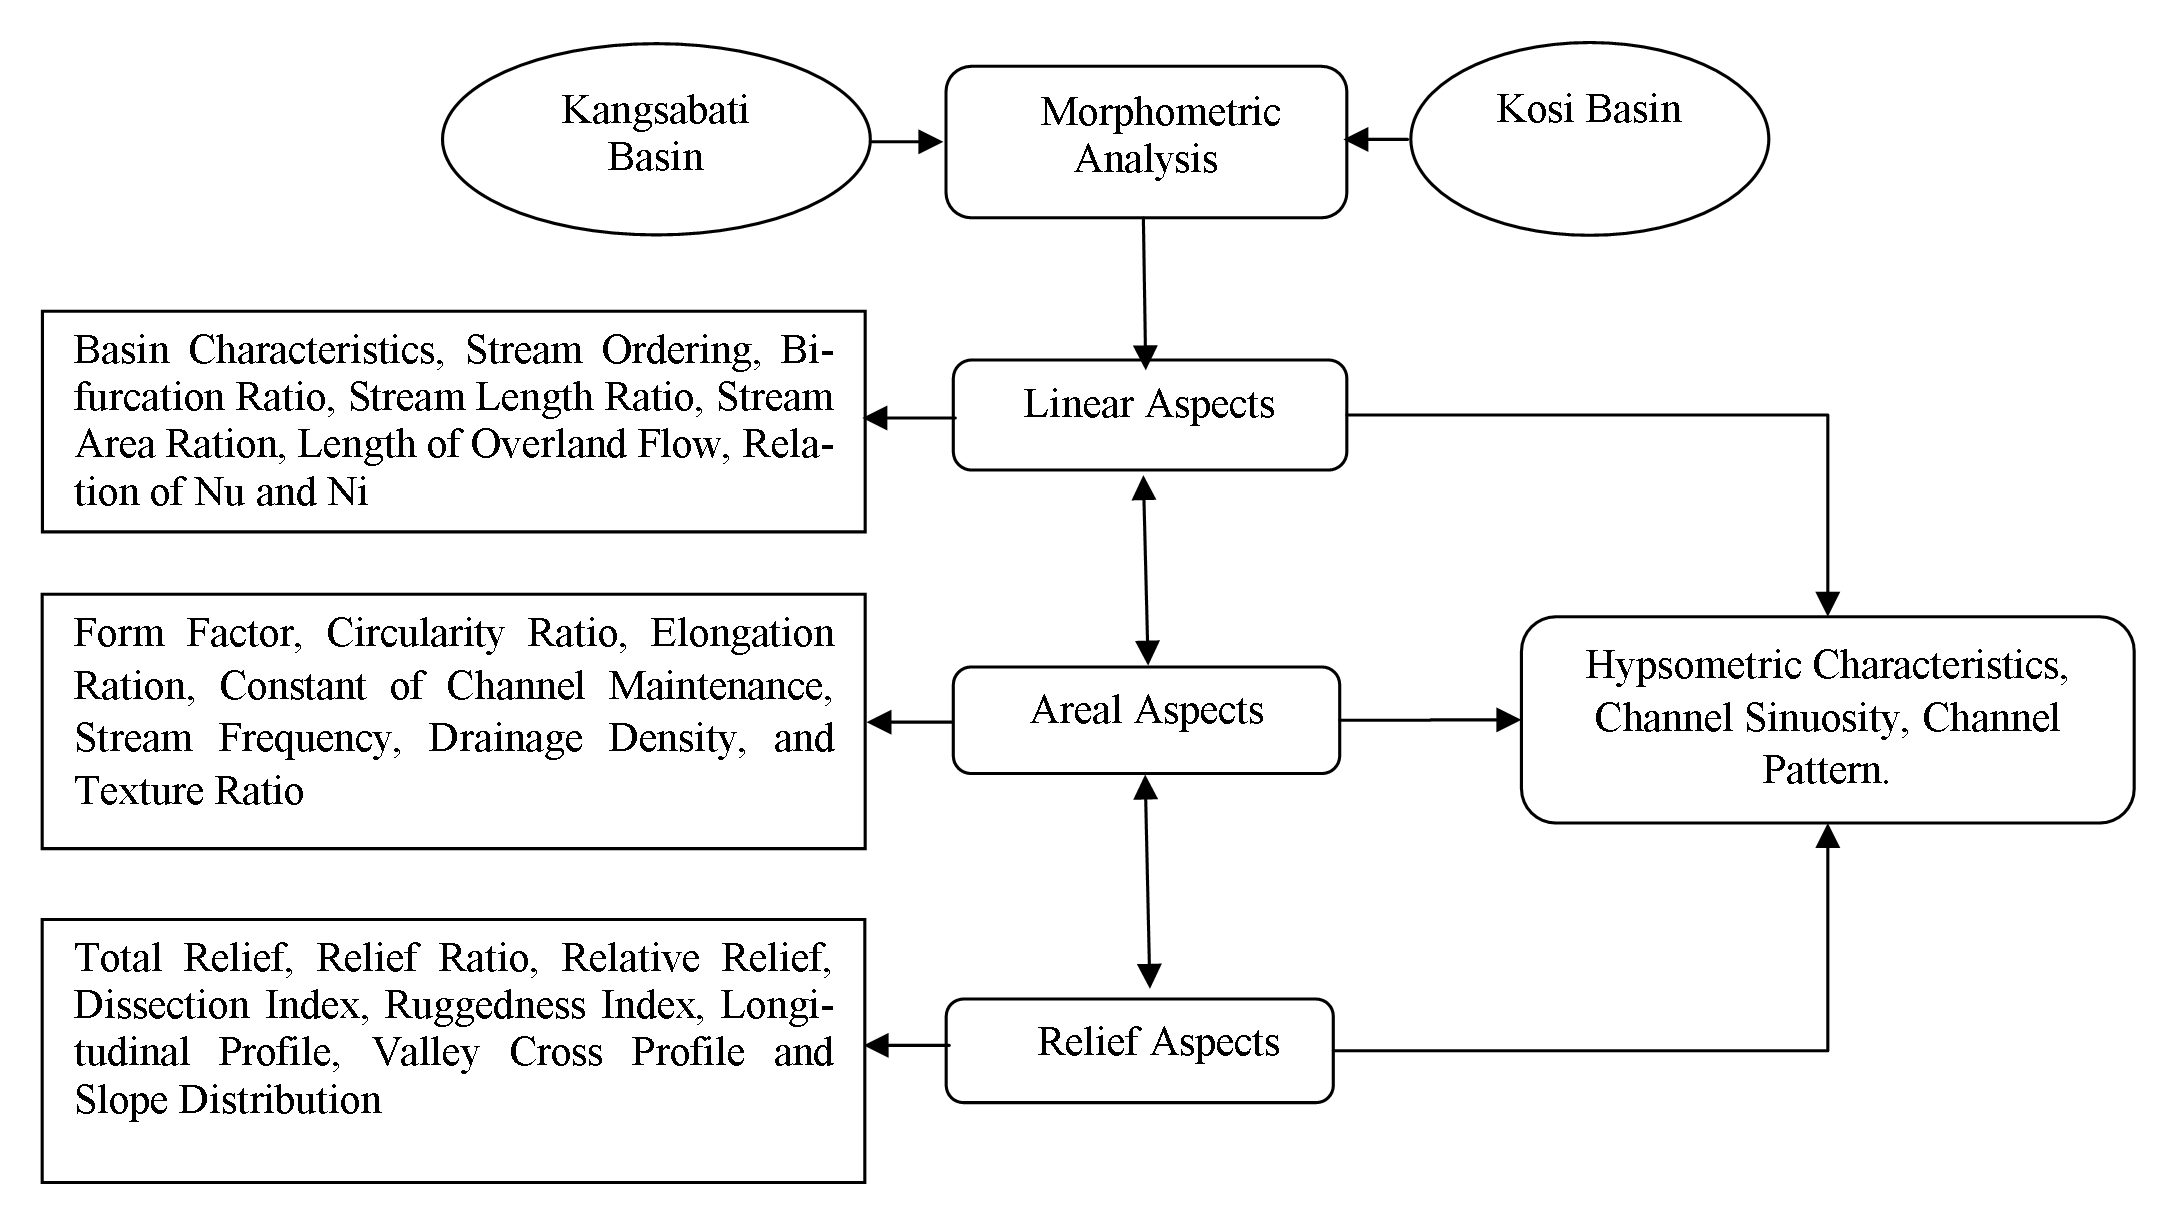
Among the different morphometric characteristics: drainage parameters (stream orders, stream numbers, bifurcation ratio, strength length, mean stream length), basin parameters (circularity ratio, elongation ratio, drainage density and drainage frequency), relief parameters (dissection index, ruggedness index, hypsometric characteristics) are the most important. Thus, it is clear that identifying the morphological evolution and stages of development of any basin provide significant opportunities for further research into this field.
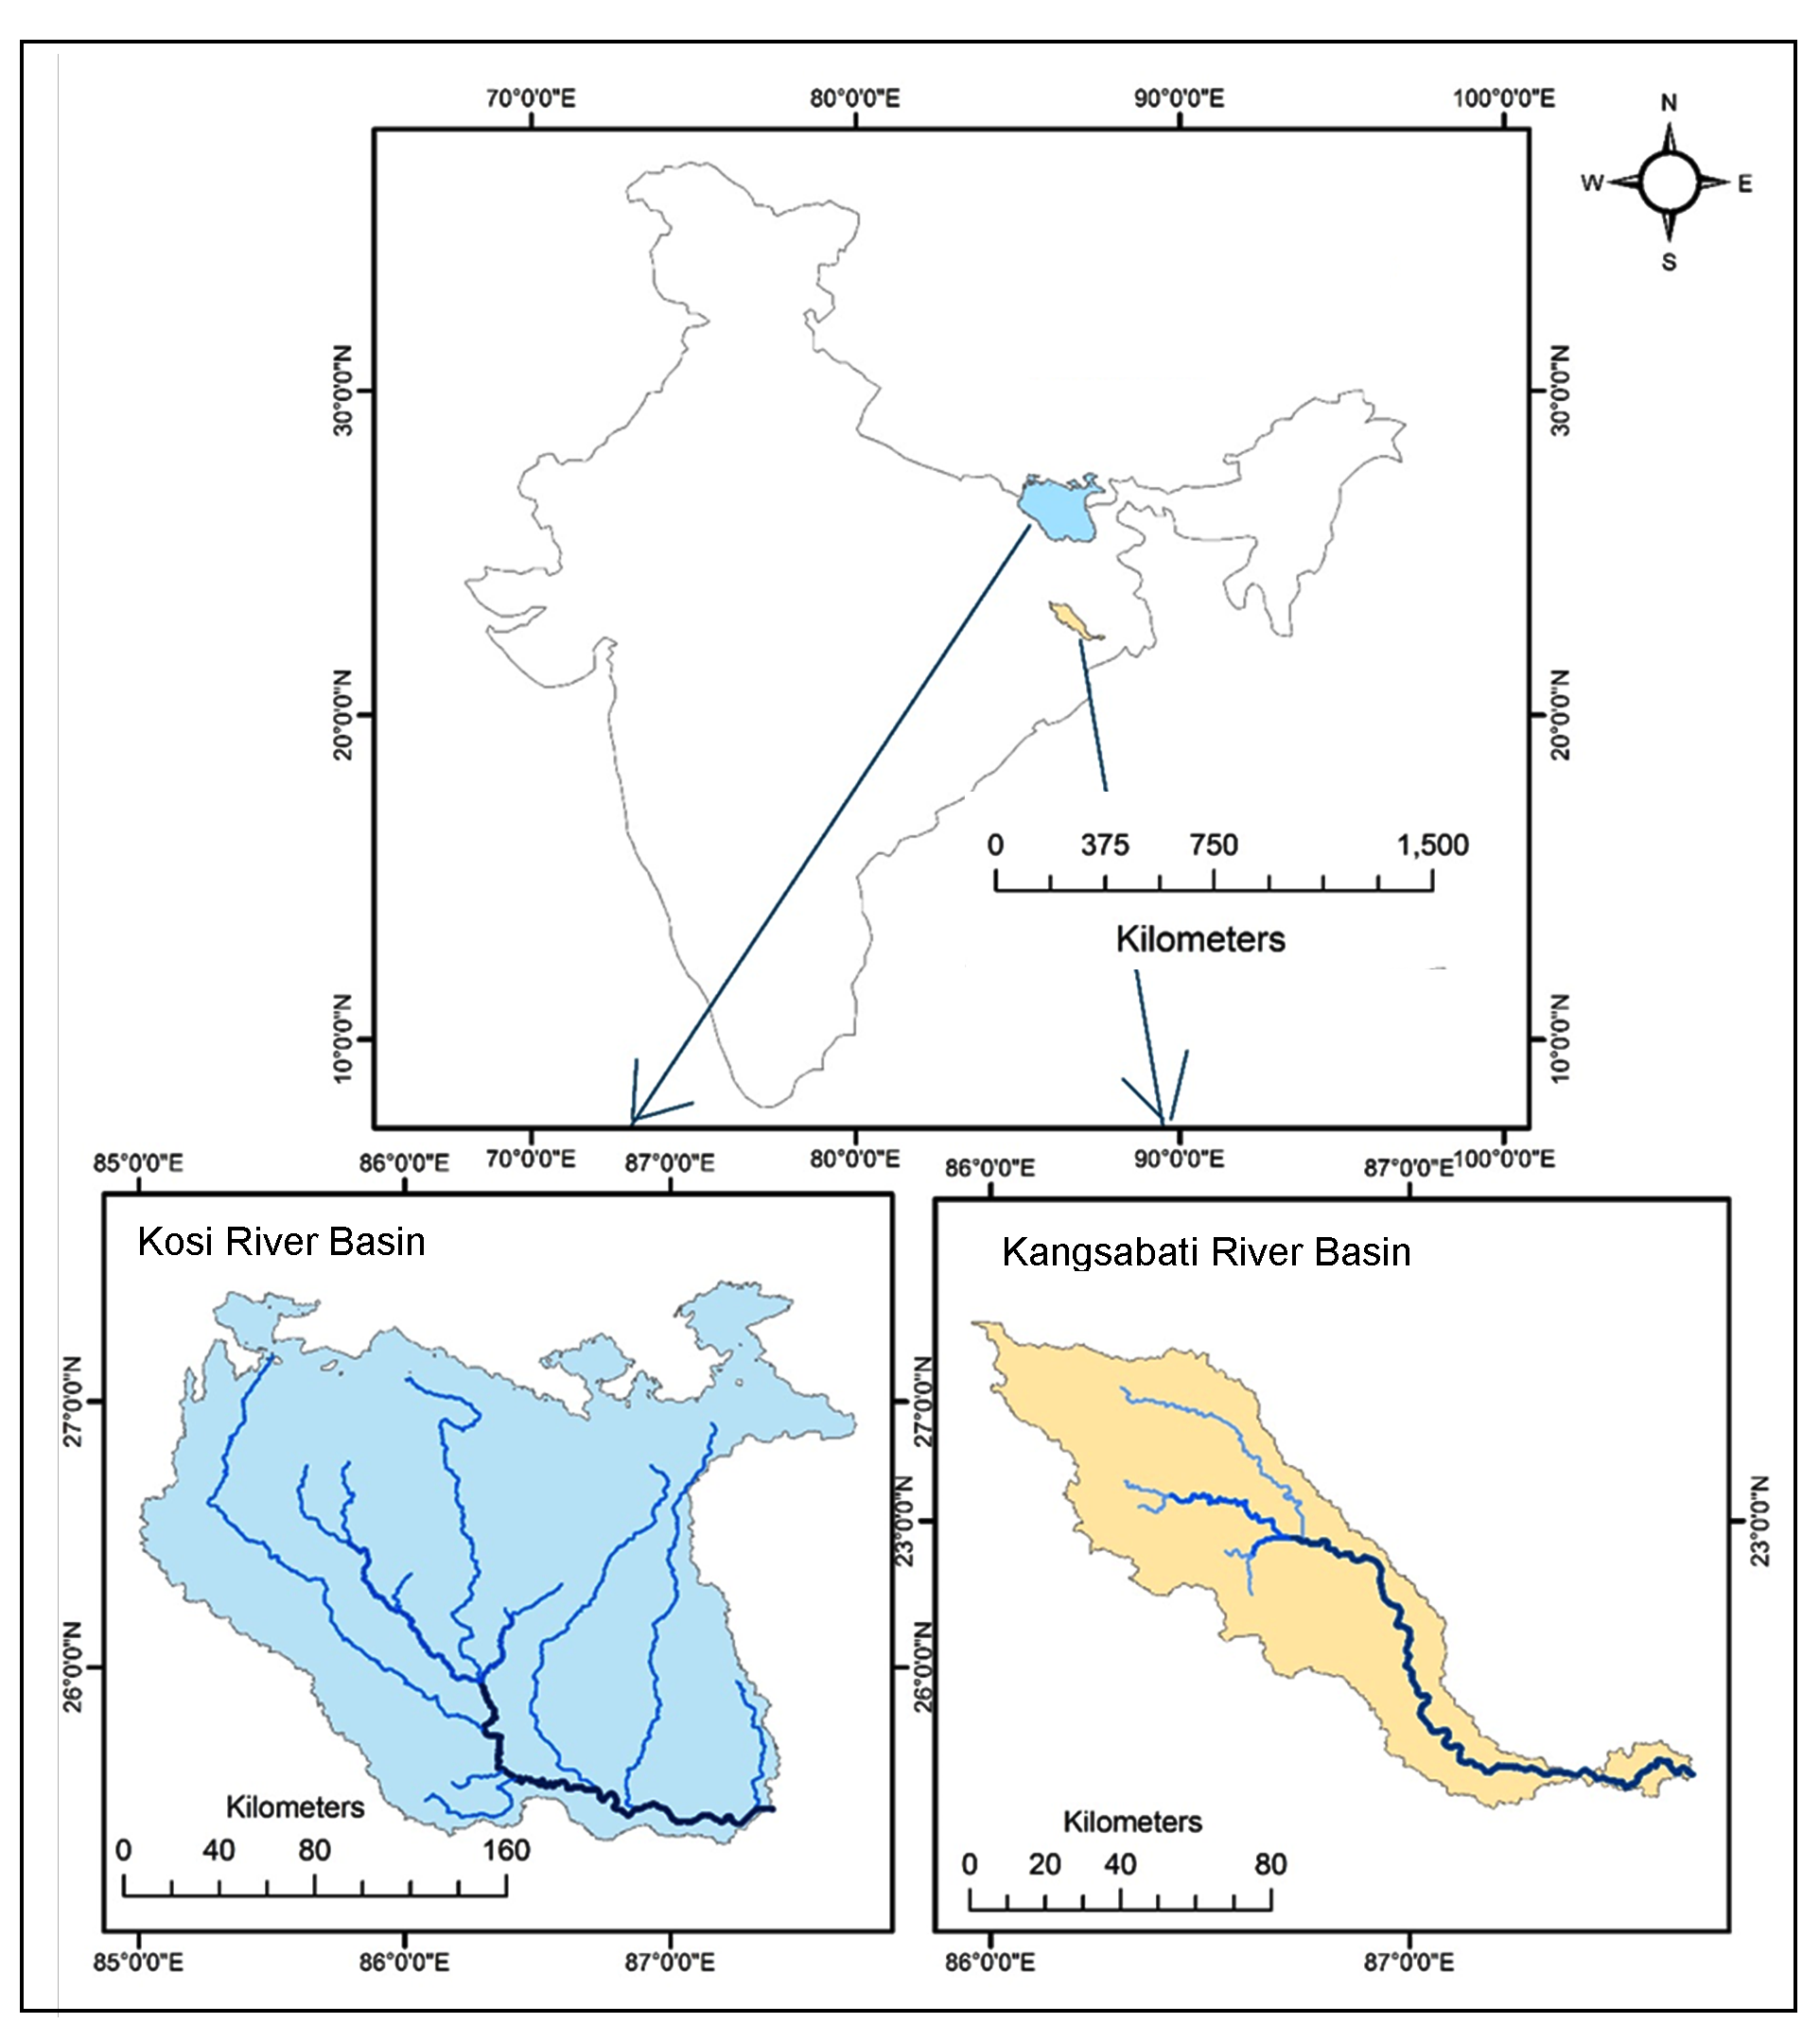
Several scholars have used remote sensing data and GIS on morphometric parameters and have concluded that remote sensing can be used as a powerful tool to analyzing drainage morphometric characteristics (Nag and Lahiri, 2012; Ansari, et al., 2012; Magesh and Chandrasekar, 2014). Remote sensing and GIS techniques have also been used to measure the morphometric characteristics of the region (Figure 1). The Kangsabati basin lies in the eastern part of the Chotanagpur plateau which is more or less stable.
Originating from the ‘Ajodhya hill’ of the eastern Chotanagpur plateau, it flows eastwards through the plateau fringe regions of West Bengal (Nag and Lahiri, 2012). Different geomorphic characteristics of the Kangsabati basin indicate that it is in a mature stage of geomorphic development (Pan, 2013; Dutta and Roy, 2012). It is also less prone to flood calamities due to its elongated areal characteristics (Gayen et al., 2013). As opposed to Kangsabati, the Kosi basin covers an area of neo-tectonic upliftment in the Himalayan lowlands. Frequent flooding and rapid avulsion are known characteristics of this basin (Sinha, 2009). Known also as ‘Sorrow of Bihar’ it enters Bhimnagar after crossing the part of the Himalayas which lie in Nepal. It then joins Ganga near Kursela after flowing 320 km through northern Bihar. Kosi is also an example of an inland delta building agent (Gole and Chitale, 1966). It also seems to have changed its main course eastward by a hundred kilometers in August 2008 due to a major avulsion process there (Sinha et al., 2008) Which some geomorphologist have referred as disaster (Shrestha et al., 2010). However, earlier, it had followed the same path before it was abandoned 200 years ago. Also, while the Kosi Basin area comes under the Indo-Gangetic plain geologically, the Kangsabati basin lies under Archean Gneiss and Schist.
The present study mainly aims to understand the evolutionary stages of development for two different morpho-climatic settings namely Kosi river basin for mountain-plain region and Kangsabati river basin for plateau-plain region. These are regions for which no detailed work of this kind is presently known. The study also aims to understand the geologic, geomorphic and hydrologic influence on basin morphometry and construct the geomorphic evaluation stage of this two different morpho-climatic setting.
3 . RESULTS AND DISCUSSIONS
Both Himalayan glaciers and precipitation deeply influence the hydrology of Kosi River. The Kosi is notorious for its high sediment load and migratory trends with antecedent river characteristics. The failure of the Kosi embankments to control floods and the recent avulsions are characteristics of the Kosi basin which can be explained through the local geological adjustment, plate motions, geotectonic etc. (Arogyaswamy, 1971; Agarwal and Bhoj, 1992). Recently, Kosi has left its westward extension to flow directly through the north-south extension from the Himalayan foothills up till the Ganga confluence. On the othe hand, the Kangsabati river receives water from rainfall only. It flows through the semi-arid region of Chotanagpur plateau. In fact, it remains dry often (Gayen et al., 2013).
As argued before, the morphometric analysis is a useful tool to understand the hydrological behaviour of any river basin (Castillo et al., 1988; Thomas et al., 2010). Hydro-sedimentary characteristics are also determined by basin characteristics (Raux et al., 2011).
3.1 Linear Aspects
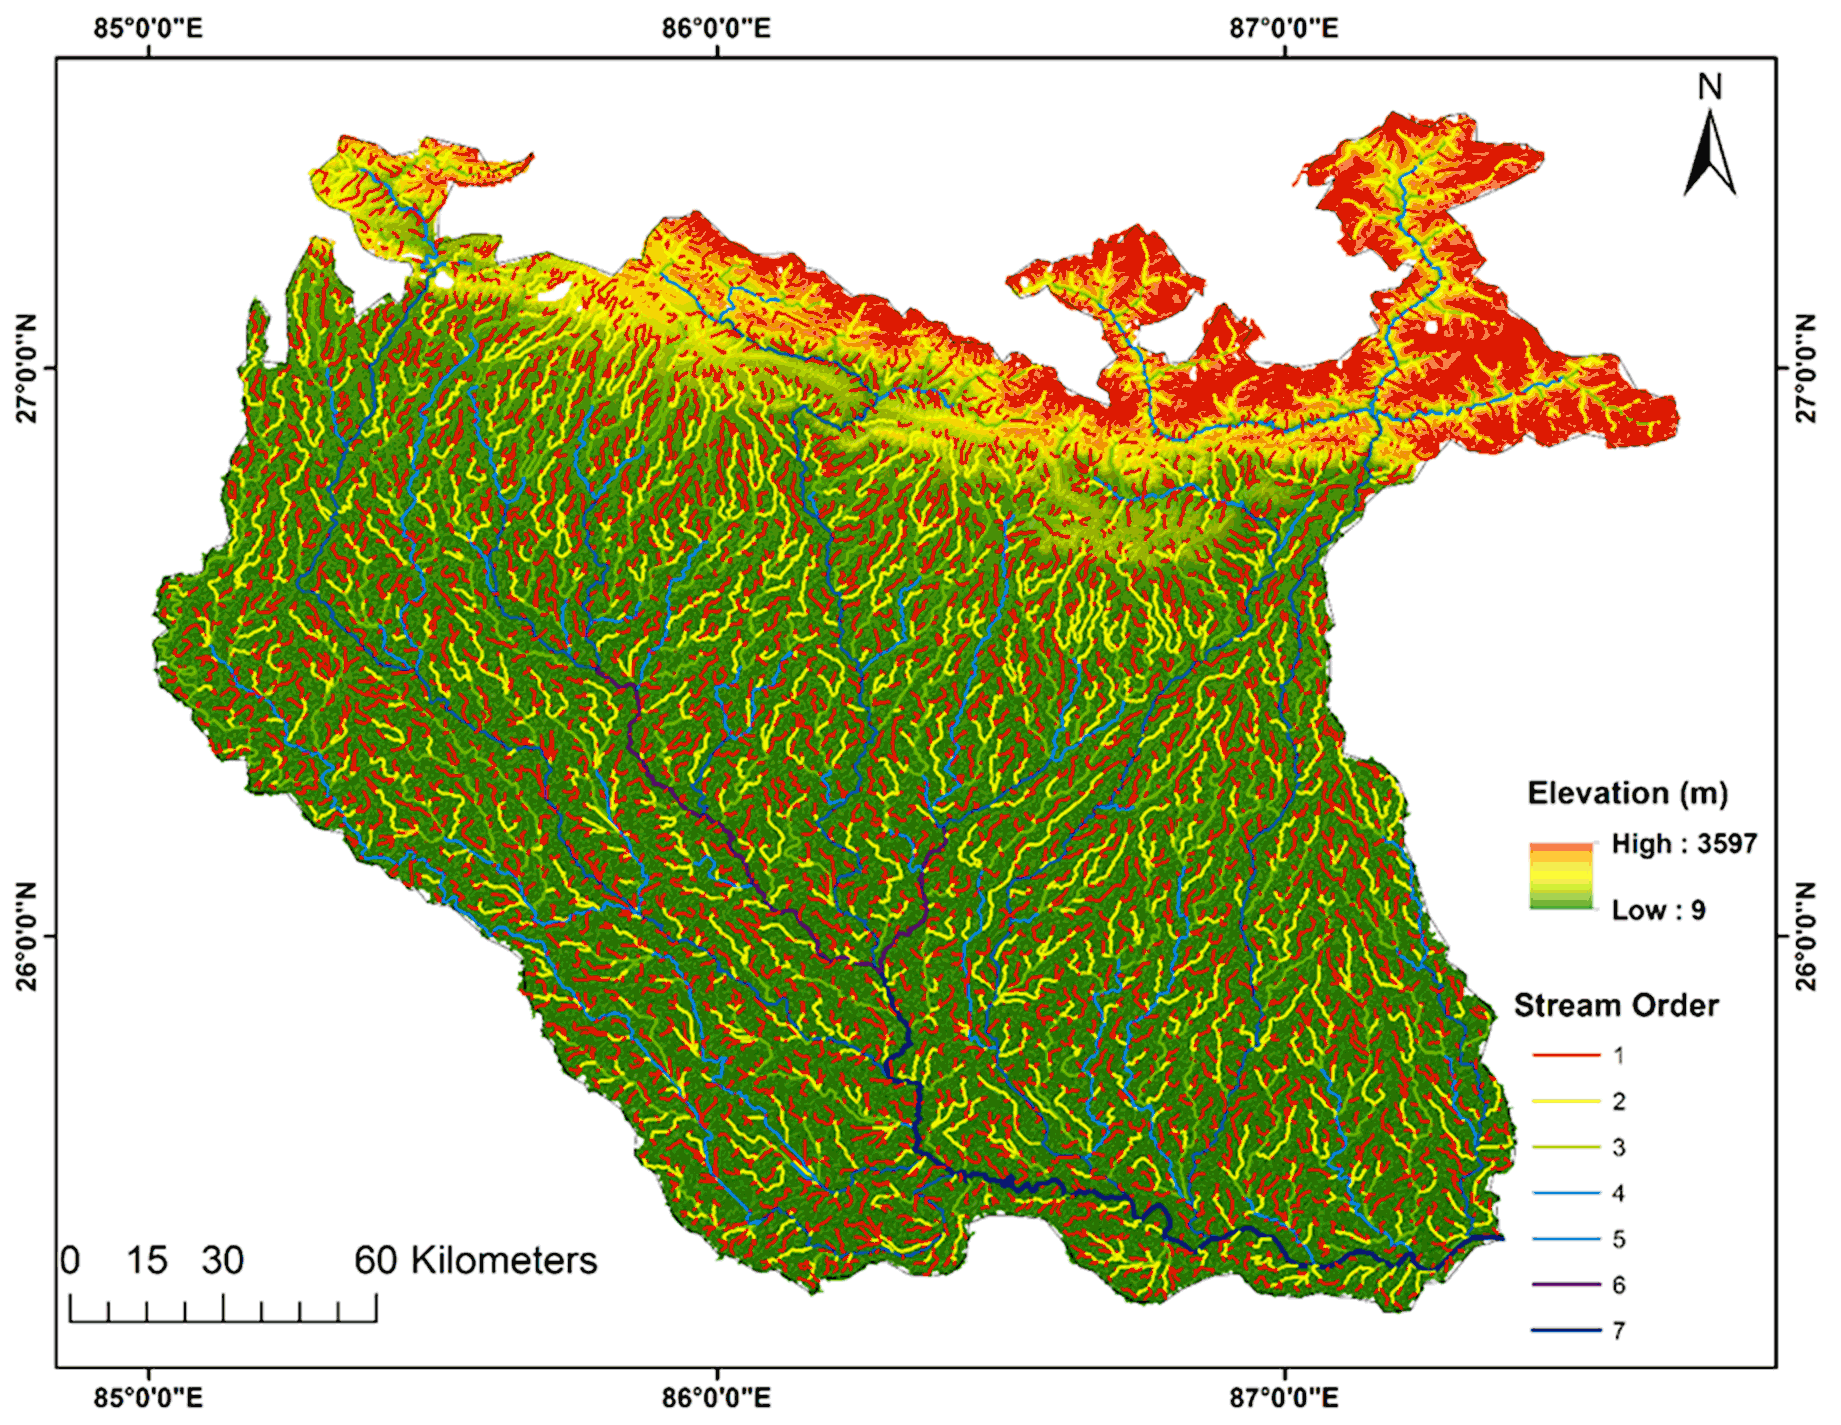
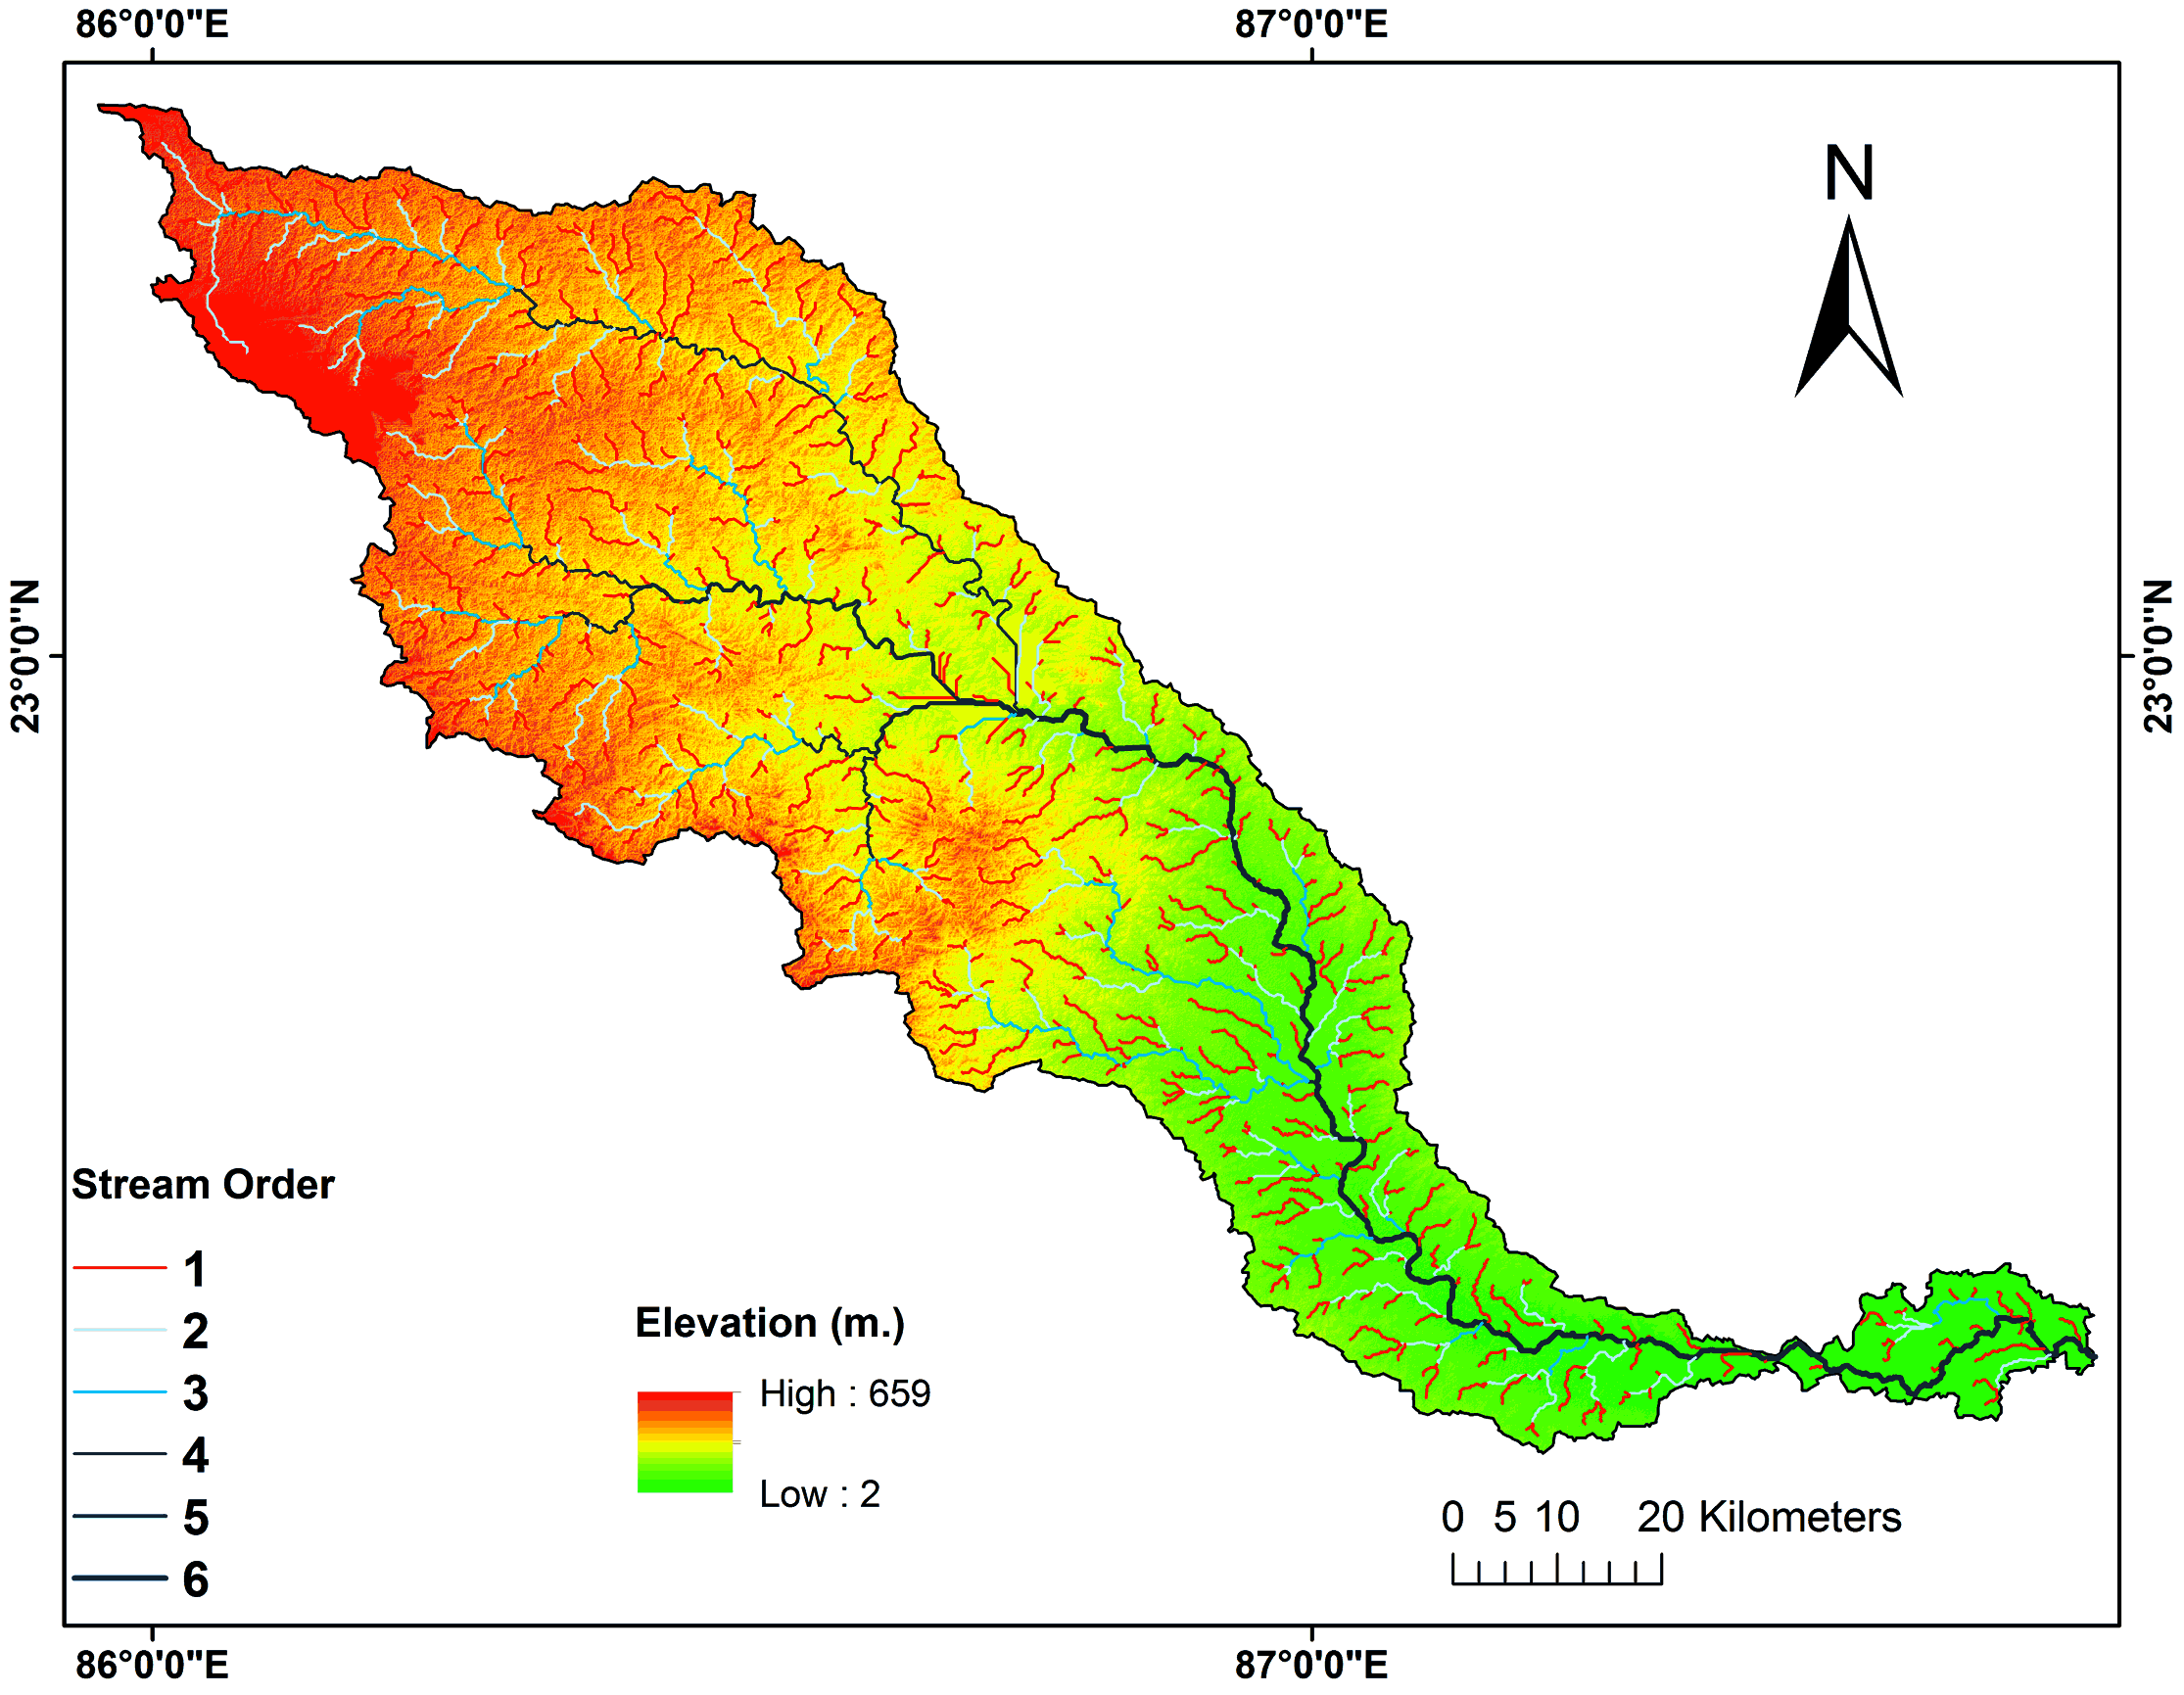
Stream order (\(N_u\)) is designated as the first step of morphometric analysis as introduced by ‘Strahler’ in 1952. The smallest tributaries of the upper reaches of any basin are named as its 1st order streams. A 2nd order stream is formed when two 1st order stream join (Magesh and Chandrasekar, 2014). The stream order depends on the basin shape, size and relief characteristics of the basin under consideration (Haghipour and Burg, 2014). The total number of streams of Kosi basin add up to 10591 of which 5315, 2449, 1338, 768, 551, 71, and 99 streams belongs to 1st, 2nd, 3rd, 4th, 5th, 6th, and 7th order respectively (Table 2; Figure 3). The greater number of the1st and 2nd order streams is due to its mountain origin. The number of streams decreases as stream-order increases. After its Himalayan course (upper reaches), Kosi enters the plain area of North Indian causing a sudden change of slope which is reflected in the sudden decrease in the number of 3rd and 4th order treams. The high number of lower order streams (1st, 2nd, 3rd order) collects great amount of water which ultimately creates pressure on higher order streams in the lower basin. (5th, 6th order).
Table 2. Linear Morphometric Aspects
|
Morphometric Parameters
|
Kangsabati Basin
|
Kosi Basin
|
|
Stream Order ( \(u\) )
|
I
|
II
|
III
|
IV
|
V
|
VI
|
I
|
II
|
III
|
IV
|
V
|
VI
|
VII
|
|
Stream numbers ( \(N_u\) )
|
609
|
279
|
152
|
68
|
25
|
83
|
5315
|
2449
|
1338
|
768
|
551
|
71
|
99
|
|
Bifurcation Ratio ( \(R_b\) )
|
-
|
2.18
|
1.83
|
2.23
|
1.30
|
0.30
|
-
|
2.17
|
1.83
|
1.74
|
1.39
|
7.76
|
0.71
|
|
Mean Bifurcation
Ratio ( \(R_{bm}\) )
|
1.56
|
2.6
|
|
Stream Length ( \(L_{u}\) ) in km.
|
1559
|
790
|
350
|
154
|
62
|
194
|
12396
|
6595
|
3463
|
1756
|
1327
|
162
|
216
|
|
Mean Stream Length ( \(L_{um}\) )
|
2.55
|
2.83
|
2.30
|
2.26
|
2.48
|
2.33
|
2.33
|
2.69
|
2.59
|
2.29
|
2.41
|
2.28
|
2.18
|
|
Stream Length Ratio ( \(R_t\) )
|
-
|
0.90
|
1.23
|
1.01
|
0.91
|
1.06
|
-
|
0.86
|
1.04
|
1.13
|
0.95
|
1.06
|
1.04
|
The total number of streams of the Kangsabati basin add up to 1216 of which 609, 279, 152, 68, 25 and 83 streams which belong to the 1st, 2nd, 3rd, 4th, 5th and 6th order streams, respectively (Table 2; Figure 3). The 1st, 2nd and 3rd order streams of the Kangsabati basin are less in number as it originates from a mature plateau formation with multiple dissected hills marking its surface.. The 4th and 6th order streams are also less in number as it enters the plain Higher order streams face less water pressure due to low number of lower order streams which are also of a rainfed origin.
Bifurcation ratio ( \(R_b\) ) is defined as the ratio of stream segments of an order in relation to the next higher order. It is considered to be an important parameter which denotes the flood potentiality of any basin. It normally ranges between 2 to 5 (Joji et al., 2013). High bifurcation value of 1st and 2nd order stream indicates origin from higher altitudes. Less Rb reflects less distorted drainage network and structurally mature condition (Kim and Jung, 2015). The bifurcation ratio for different order of streams in Kosi basin is 2.17 for 1st to 2nd, 1.83 for 2nd to 3rd, 1.74 for 3rd to 4th, 1.39 for 4th to 6th, 7.76 for 5th to 6th, 0.71 for 6th, 5th and 7th, respectively (Table 2). These values indicate that the watershed does not fall under normal category. The irregularities are indicative of geological and lithological discrepancies of the basin. Hence, high bifurcation ratio in higher order streams represents the large amount of water collected by the low order streams as well as high water flow. The less number of streams which mark the lower reaches denote their low water carrying capacity.which is supported by its mean bifurcation value which is 2.60. This ultimately results in a heavy flood potentiality in Kosi Basin.
For the Kangsabati basin the bifurcation value, is 2.18 for 1st to 2nd, 1.83 for 2nd to 3rd, 2.23 for 3rd to 4th, 1.30 for 4th to 5th and 0.30 for 5th and 6th order stream (Table 2). These values indicate watershed falls under geomorphologically mature areas. A constant decrease of Rb through out the different stream order, as well as a low mean Rb (1.56), indicate a low flood potentiality for this basin.
Stream length ( \(L_{u}\) ) is indicative of the successive stages of development of stream segments (Castillo et al., 1988). A direct geometric sequence can be approximated from the varying lengths of the different stream orders. The stream length for different orders of the present basin are: 1st stream order (12396 km), 2nd stream order (6595 km), 3rd stream order (3463 km), 4th stream order (1756 km), 5th stream order (1327 km), 6th stream order 162 km), and 7th stream order (216 km) (Table 2). The inconsistency of the stream length between 6th and 7th order indicates irregularities in basin characteristics. This is also indicative of a lithological control on drainage basin.
The stream length values for the Kangsabati basin are: 1st stream order (1559 km), 2nd stream order (790 km), 3rd stream order (350 km), 4th stream order (154 km), 5th stream order (62 km) and 6th stream order (194 km) (Table 2). Sequence of stream length for Kangsabati basin also indicates its mature geomorphological condition.
Mean stream length ( \(L_{um}\) ) indicates the characteristic size of drainage network component. It is an important dimensionless component of linear morphometric characteristics. In general, Lum increases with increasing order (Haghipour and Burg, 2014). The mean stream length of Kosi basin is 1st stream order (2.33 km), 2nd (2.69 km), 3rd (2.59 km), 4th (2.29 km), 5th (2.41 km), 6th (2.28 km), and for 7th stream order (2.18 km) (Table 2). The mean stream length of the Kosi basin denotes the youthful stage of its geomorphic development. The anomalies are due to the change in slope and geological setup. These anomalies themselves, cause discrepancies in surface flow discharge and sedimentation.
The mean stream length for the Kangsabati basin are: 1st stream order (2.55 km), 2nd (2.83 km), 3rd (2.30 km), 4th (2.26 km), 5th (2.48 km) and 6th stream order (2.33), respectively (Table 2). Lum values are more or less similar to plain and plateau areas.
Stream length ratio ( \(R_t\) ) is an important indicator of surface flow, erosional stage, and discharge characteristics of the basin. It is the ratio between mean stream lengths of one order relative to the next higher order. It tends to be similar throughout the different orders. The stream length ratio of Kosi basin starts with 0.86 for 1st to 2nd order, 1.04 for 2nd to 3rd order, 1.13 for 3rd to 4th order, 0.95 for 4th to 5th order, 1.06 for 5th to 6th order, and 1.04 for 6th to 7th order (Table 2). The changes in stream length ratio denote that the area is in early stage of geomorphic development and that the area has a high potentiality for frequent changes in the future.
For the Kangsabati basin the Rl is 0.90 for 1st to 2nd, 1.23 for 2nd to 3rd, 1.01 for 3rd to 4th, 0.91 for 4th to 5th and 1.06 for 5th to 6th order stream, respectively. The Rl is more constant in plateau areas (Kangsabati basin) than in plain areas (Kosi basin).
3.2 Areal Aspects
Stream frequency ( \(S_f\) ) is the number of streams present in per unit area. It provides the response of the drainage basin to the runoff processes. Stream frequency depends on the rainfall, relief, initial rock resistivity, drainage density of the basin. Lower value of Sf indicates poor drainage network (Thomas et al., 2010). Stream frequency of the Kosi basin is 0.27, which can be categorized as a moderate stream frequency (Table 3). Such a lower stream frequency is the result of its lying in the plain area. Also, lower stream frequency of Kosi basin is indicative of its frequent flood state due to its inability to drain the water from the large basin.
In contrast, the \(S_f\) of Kangsabati basin is very low (0.17). The granite-gneiss geology dominated plateau course of river does not permit rivers to create a higher stream frequency. Also semi-arid environment and low relative relief contributes to the lower Sf in Kangsabati basin.
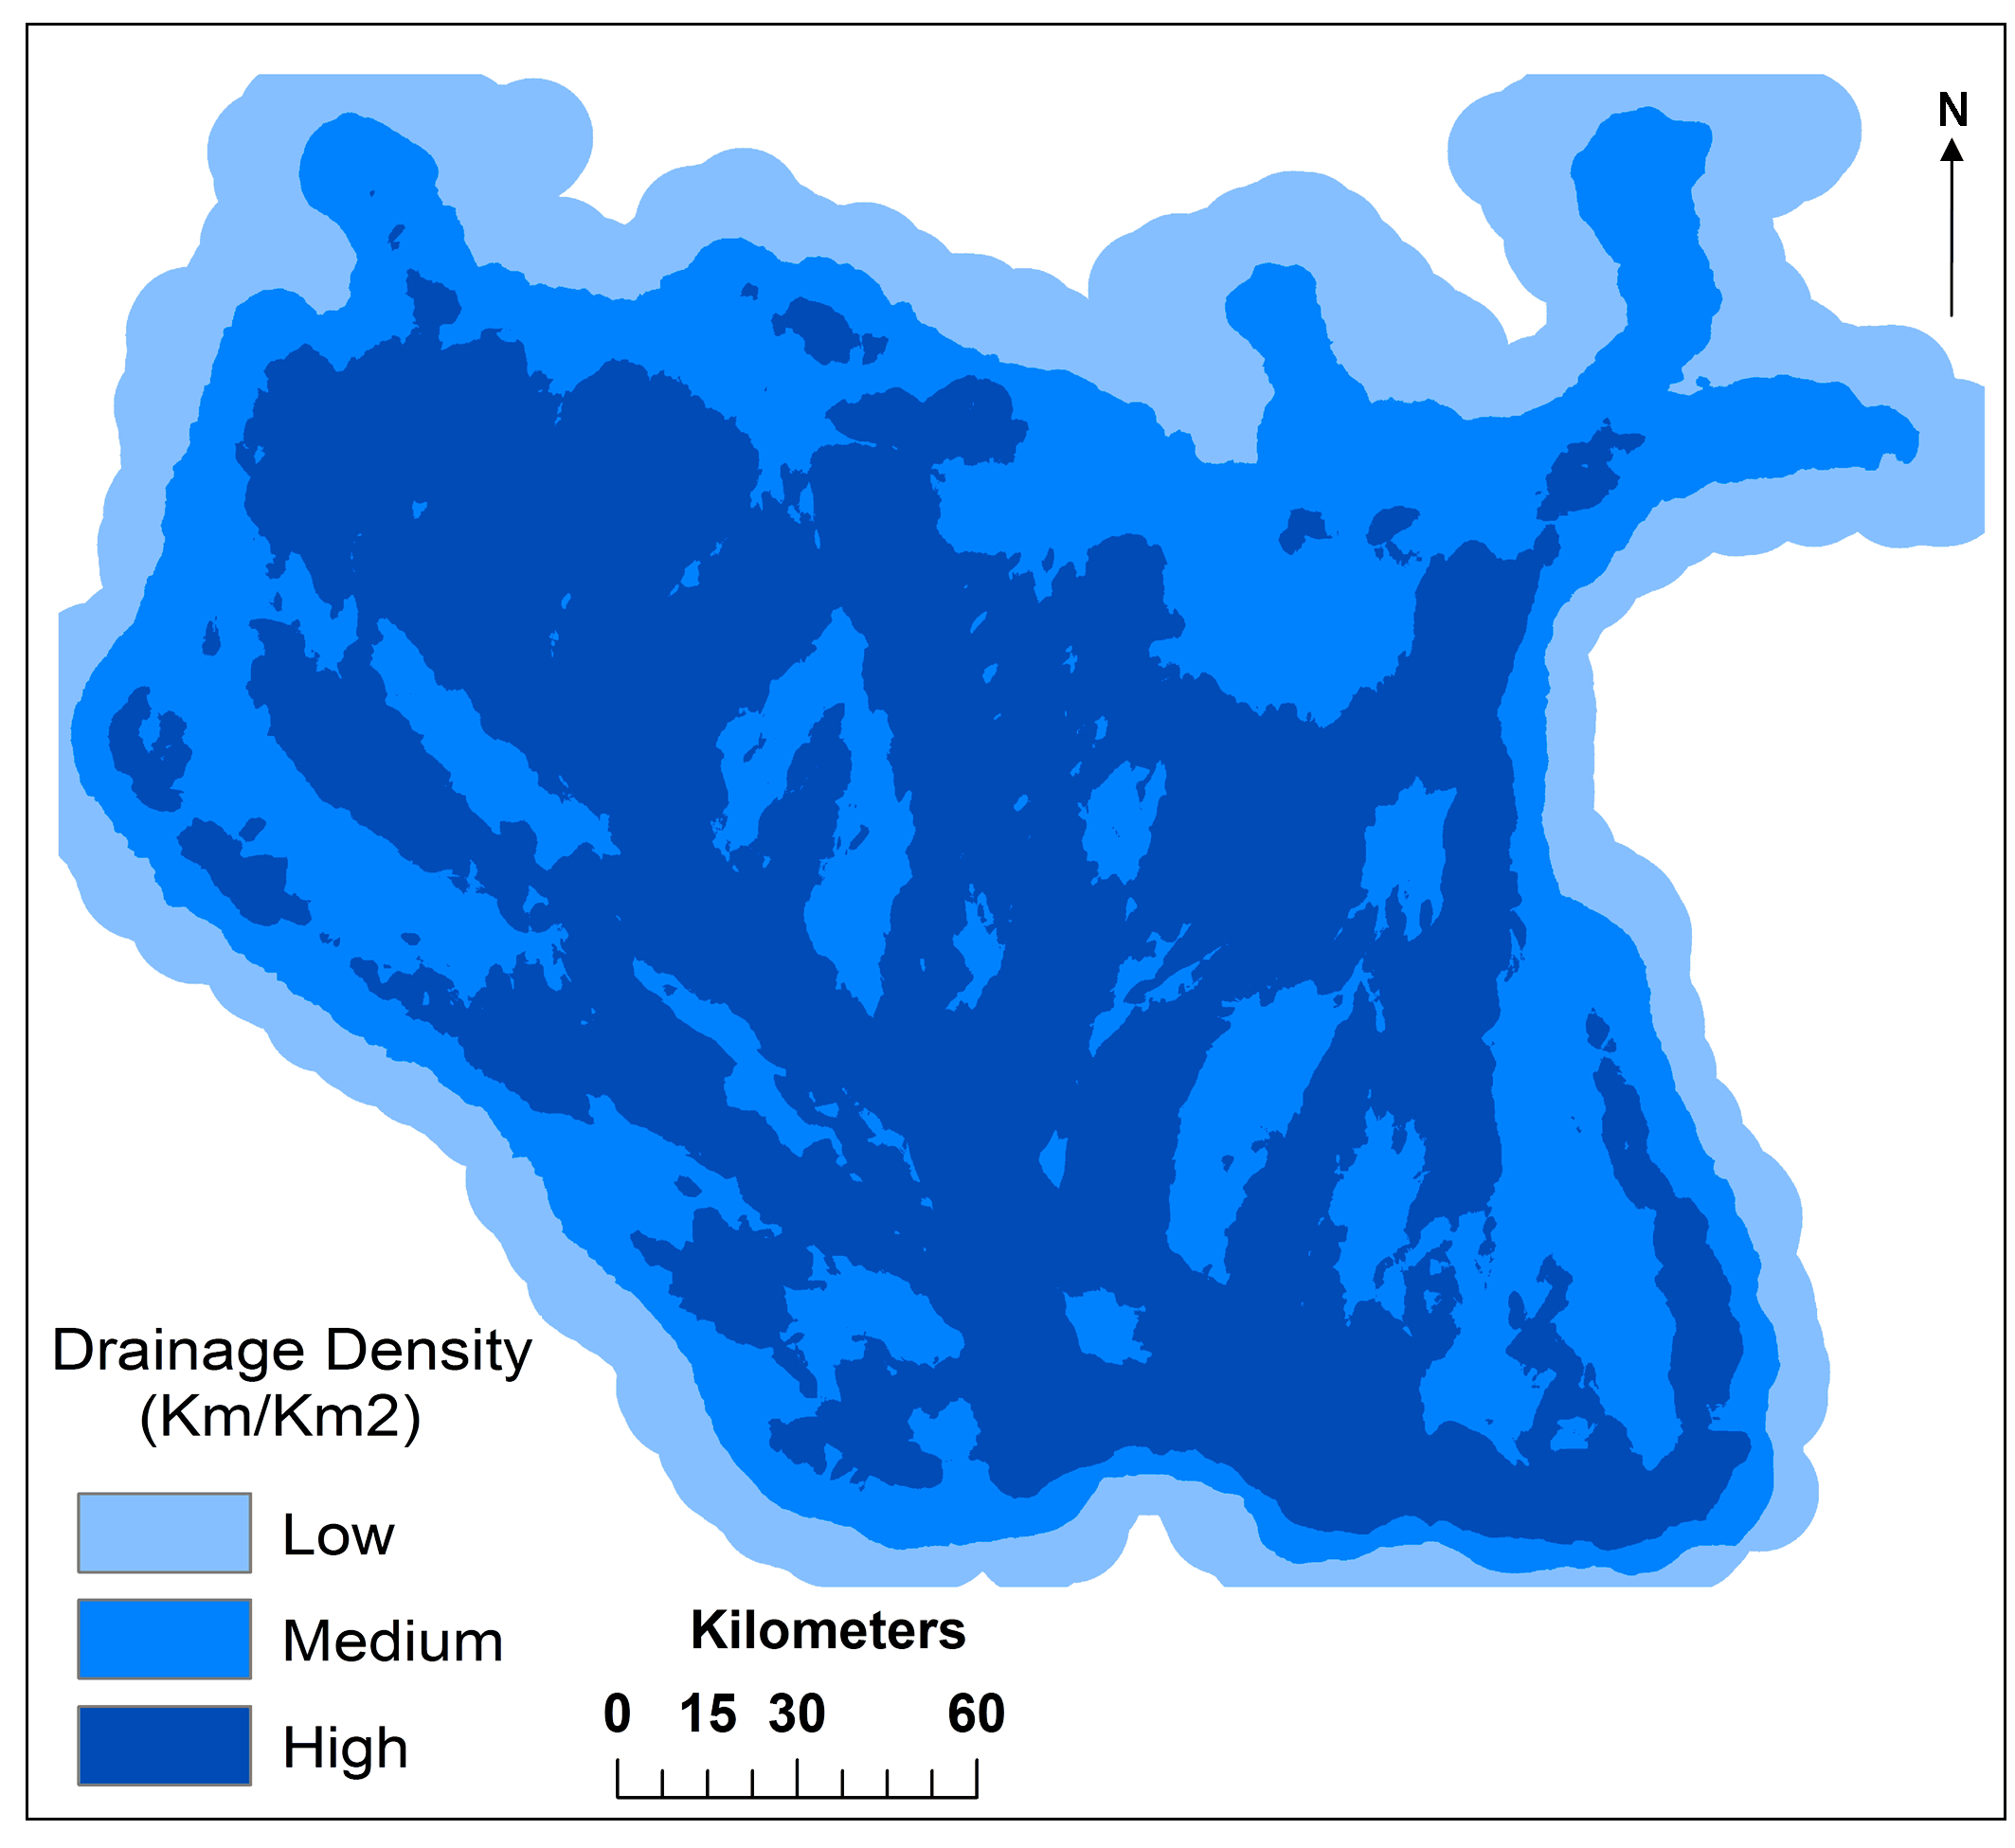
Drainage density ( \(D_d\) ) is the ratio of stream length to the basin area. It is a key factor in determining the drainage of any area. It ranges from 0.27 to 8 km/km2 (Joji et al., 2013). The capability of any basin to drain its excess water in the monsoon season is dependent upon the drainage density of the area. Drainage density itself depends upon the underlying geology, relief, geomorphology, climate, vegetation etc. Specifically, a high drainage density means an increase in the draining capacity of any region and vice-versa. The overall drainage density of Kosi basin is 0.67 (km/km2) which is very low (Table 3). It shows a direct relationship between drainage frequency and drainage density. High drainage density is found in upper reaches of the basin (Figure 4). It is due to its Himalayan location and the relative high relief. Low drainage density can be observed in the lower reaches of the plain areas of the basin. This causes a higher runoff with great velocity, resulting in increased flood potentiality in the downstream basin.
Table 3. Areal Aspects
|
Areal Aspects
|
Kosi Basin
|
Kangsabati Basin
|
|
Basin Perimeter ( \(P\) ) (km)
|
1392
|
736
|
|
Basin Area ( \(A\) ) (km2)
|
38689
|
7073
|
|
Form Factor ( \(F_f\) )
|
0.45
|
0.12
|
|
Circularity Ratio ( \(R_c\) )
|
0.26
|
0.16
|
|
Elongation Ratio ( \(R_e\) )
|
1.52
|
1.00
|
|
Compactness constant ( \(C_c\) )
|
2.00
|
2.46
|
|
Constant of channel maintenance ( \(CCM\) )
|
1.49
|
2.27
|
|
Stream Frequency ( \(S_f\) )
|
0.27
|
0.17
|
|
Drainage Density ( \(D_d\) )
|
0.67
|
0.43
|
|
Texture ratio ( \(T_r\) )
|
7.60
|
1.65
|
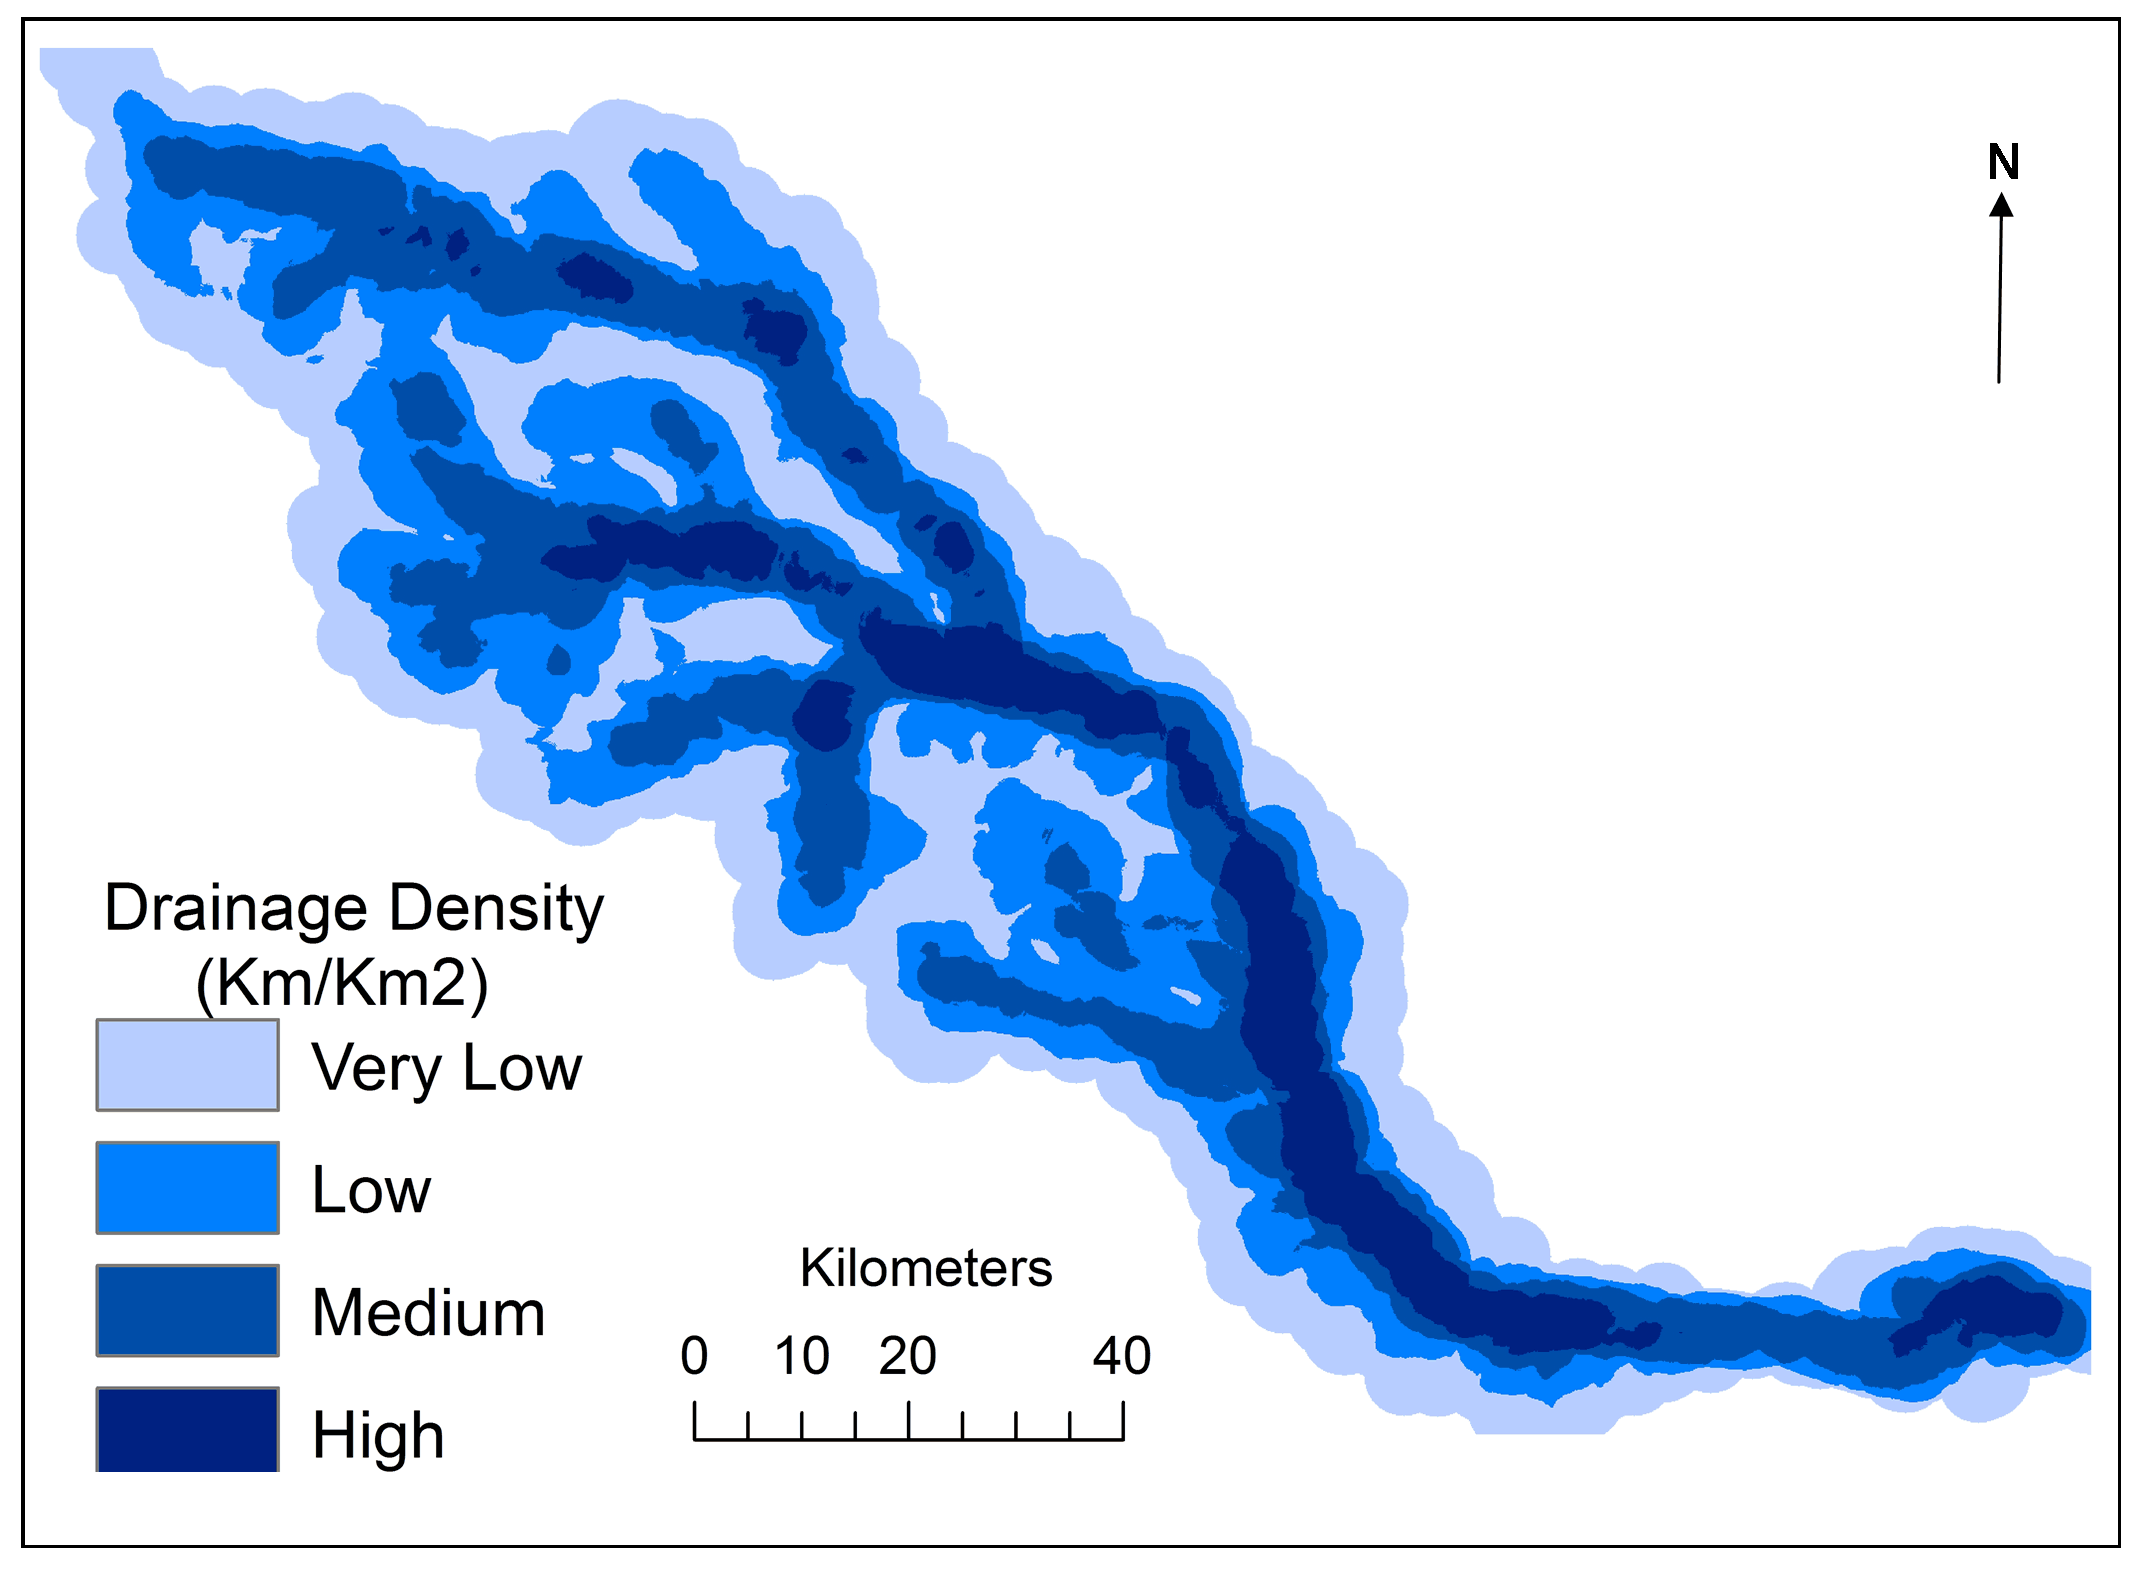
For Kangsabati basin the overall \(D_d\) is 0.43 which is very low (Figure 4; Table 3). As discussed earlier the low relief, low drainage frequency, granite-gneiss geology as well as low vegetation cover and rainfall does not allow rivers to have a high drainage density. Low drainage density, as well as frequency, is indicative of low draining capacity and frequent flood.
Texture ratio ( \(T_r\) ) is also an important fluvial parameter which denotes the relative spacing of drainage network of any basin. It is the product of stream frequency and drainage density (Gayen et al., 2013). Collectively drainage density and drainage frequency can be called drainage texture. It depends upon a number of geological and geomorphological factors. The drainage texture of Kosi basin is 7.60 which is indicative of a coarse drainage texture (Table 3), indicative of the low capacity of the basin to drain out the extra amount of water.
\(T_r\) for Kangsabati basin is as low as 1.65. It is the result of its elongated basin characteristics, low stream frequency, Archean geology as well as its semi-humid environment.
Form factor ( \(F_f\) ) is the ratio of the area of basin to the square of basin length. It indicates the flow characteristics of a basin (Castillo et al., 1988; Horton, 1932). The value ‘0’ indicates elongated characteristics of basin and ‘1’ indicates the near to circle characteristics of the basin with high peak flow. Flood flows of an elongated basin can be easily managed in comparison to a circular basin. \(F_f\) value of Kosi basin is 0.45 which indicates the basin is close to a circle shape (Table 3). It also indicates higher peak flow in limited times. Large basin area with a greater circular shape and a low drainage density cause the Kosi to become a critical flood-prone basin in India.
On the other hand, \(F_f\) value of Kangsabati basin is 0.12, which is indicative of an elongated shape with less peak flow. Its comparatively less basin area, low rainfall and elongated shape of the basin results in a low frequency of floods occurring here.
Elongation ratio ( \(R_e\) ) is the ratio of diameter of a circle having the same area as of basin to the maximum basin length. It is also a significant index of basin shape (Gayen et al., 2013). It helps to give the idea about the hydrological character of a drainage basin. The value ‘0’ indicates its elongation characteristics whereas ‘1’ indicates its closeness to a circular pattern. The Re value of the Kosi basin is 1.52 which denotes the perfect circular characteristics of this basin (Table 3). Due to its greater catchment area and low drainage frequency, this circular basin has greater flood potentiality. The Re value of Kangsabati basin is 1.00 which indicates its elongated characteristics. Less drainage catchment area and low amount of rainfall causes the Kangsabati to become a less flood-prone.
Circularity ratio ( \(R_c\) ) is the ratio of area of drainage basin to the area of a circle having the same perimeter as of basin (Joji et al., 2013). It is and forms an express outline of the basin. Higher circular basin is affected by peak discharge in high rainfall season. \(R_c\) value is mainly concerned with the perimeter and total area of the basin which ultimately depends upon underlain geology, relief, geomorphology, climatic and edaphic characteristics of the region. \(R_c\) value of the Kosi basin is 0.25 which denotes its high peak flood runoff in monsoon season (Table 3).  value of Kangsabati basin is 0.16 which indicates its elongated characteristics.
Compactness constant ( \(C_c\) ) denotes the relationship of circular basin with that of its hydrological characteristics (Haghipour and Burg, 2014). It gives the value equal to unity if watershed would near to circular. The Cc value of the Kosi basin is 2.00 which denotes its flooding potentiality (Table 3). For Kangsabati basin, Cc value is 2.46, and it indicates its less compacted nature which ultimately helps give it a low flood potentiality.
Constant of channel maintenance ( \(CCM\) ) is the required minimum area for the maintenance and development of a channel (Dutta and Roy, 2012). It denotes the basin area needed for a linear length of channel. The CCM of the Kosi basin is 1.49 (Table 3). The value shows less channel availability to drain out the excess amount of water. In other words, excess area availability for channel maintenance will ultimately create a flood situation. The CCM value for Kangsabati basin is 2.27 which indicate that a slightly large area is available to feed a tributary than in the Kosi basin. But low rainfall in Kangsabati basin does not create any flood situation.
3.3 Relief Aspects
Basin relief ( \(R\) , \(H\) ) which includes absolute relief ( \(R\) ) and relative relief ( \(H\) ) provides an important parameter to understand basin evolutionary characteristics. Relative relief is used for determining overall basin characteristics. (Gayen et al., 2013). Basin relief depends upon the underlain geology, geomorphology and dissection characteristics of the region. The highest relief of Kosi basin is 3597 m which is found near the Himalayan peaks (Table 4). The Relative relief is 3588 m. which seems very high for erosional activity. \(H\) value of Kosi shows abrupt changes when it enters into plain areas in Himalayan foothills. On the other hand, Kangsabati flows through the plateau fringe region. Therefore, the \(R\) and \(H\) value for Kangsabati is as low as 659 and 657 respectively. Dissection hills, undulating plateau, occasional scrapes are landform features in upper reaches of Kangsabati basin. These types of landform cause a greater degree of relief undulation but the lower reaches of the basin are, almost flat.
Table 4. Relief Aspects
|
Relief Aspect
|
Kosi Basin
|
Kangsabati Basin
|
|
Absolute Relief ( \(R\) )
|
3597
|
659
|
|
Relative Relief ( \(H\) )
|
3588
|
657
|
|
Relief Ratio ( \(R_r\) )
|
0.012
|
0.0028
|
|
Dissection Index ( \(D_t\) )
|
0.990
|
0.996
|
|
Ruggedness Index ( \(R_i\) )
|
2.40
|
0.282
|
Relief ratio ( \(R_r\) ) denotes the ratio between total relief to the length of principal drainage line (Lindsay and Seibert, 2013). It indicates the overall steepness of the drainage basin and related degradation processes. The Rr of Kosi basin is 0.012 which falls under moderate category (Table 4). \(R_r\) is highest in its Himalayan reaches but as it enters in plain areas it decreases. \(R_r\) value for Kangsabati basin is as low as 0.0028. The reason for this low \(R_r\) is that Kangsabati flows through the plateau fringe region and enters into extensive plain. The basin is prone to waterlogging due to its low \(R_r\) value.
Dissection index ( \(D_t\) ) is the ratio between relative reliefs to its absolute relief. It indicates the vertical erosion and dissected characteristics of a basin (Haghipour and Burg, 2014). The stages of landform development of any basin or physiographic region can be understood through \(D_t\) . The value of \(D_t\) ranges between ‘0’ (absence of vertical dissection) to ‘1’ (Vertical areas). \(D_t\) value of Kosi basin is 0.99 which indicates its young or rejuvenated stage of geomorphic evolution (Table 4). It is also indicative of the possibility of its further development. \(D_t\) value of Kangsabati basin is also around nine, but this is indicative not of a young stage of evolution but of its plain land extension. Kangsabati is in more or less a mature stage as opposed to the Kosi basin.
Ruggedness index ( \(R_i\) ) indicates the stages of landform development as well as instability of the region or basin. The high value of \(R_i\) occurs when both drainage density and relative relief are large, and slope is also steep (Ansari et al., 2012; Chorley et al., 1985). The Ruggedness index depends upon underlain geology, geomorphology, slope, steepness, vegetation cover, climate etc. of that region. It is measured in consideration of relative relief and drainage density. Higher the value of \(R_i\) , the more youthful the area is physiographically and vice-versa. High value of \(R_i\) (2.40) for Kosi basin showing a youthful stage of basin development (Table 4). \(R_i\) value of Kangsabati is quite low at 0.282. This is explainable because after originating from plateau top areas of eastern Chotanagpur plateau, Kangsabati flows through the dissected plateau fringe region in an eastward direction fallings under the Precambrian gneiss and schist geology. The erosion caused by different rivers over millions of years has transformed the area into a rolling plateau fringe. Thus, it shows an old stage of geomorphic development.
Channel gradient indicates the stages of geomorphic evolution as well as its potentiality for further erosion. A greater channel gradient is seen during the mountainous course of a river and the number reduces during the plain course of river. As a consequence, valley deepening is a more prominent phenomenon in mountainous course of a river while valley widening is extensive in the plain. The Kosi River is almost vertical from source region up to Himalayan foothill areas. It is near horizontal from Himalayan foothills up to the river mouth. These kind of gradient characteristics have the potentiality of frequent flooding and consequent embankment failure. On the other hand, Kangsabati River shows constant slope characteristics in upper reaches of the basin and is near flat in its lower reaches. As Kangsabati is a representative of the mature plateau fringe region, its slope is more or less constant throughout the reaches.
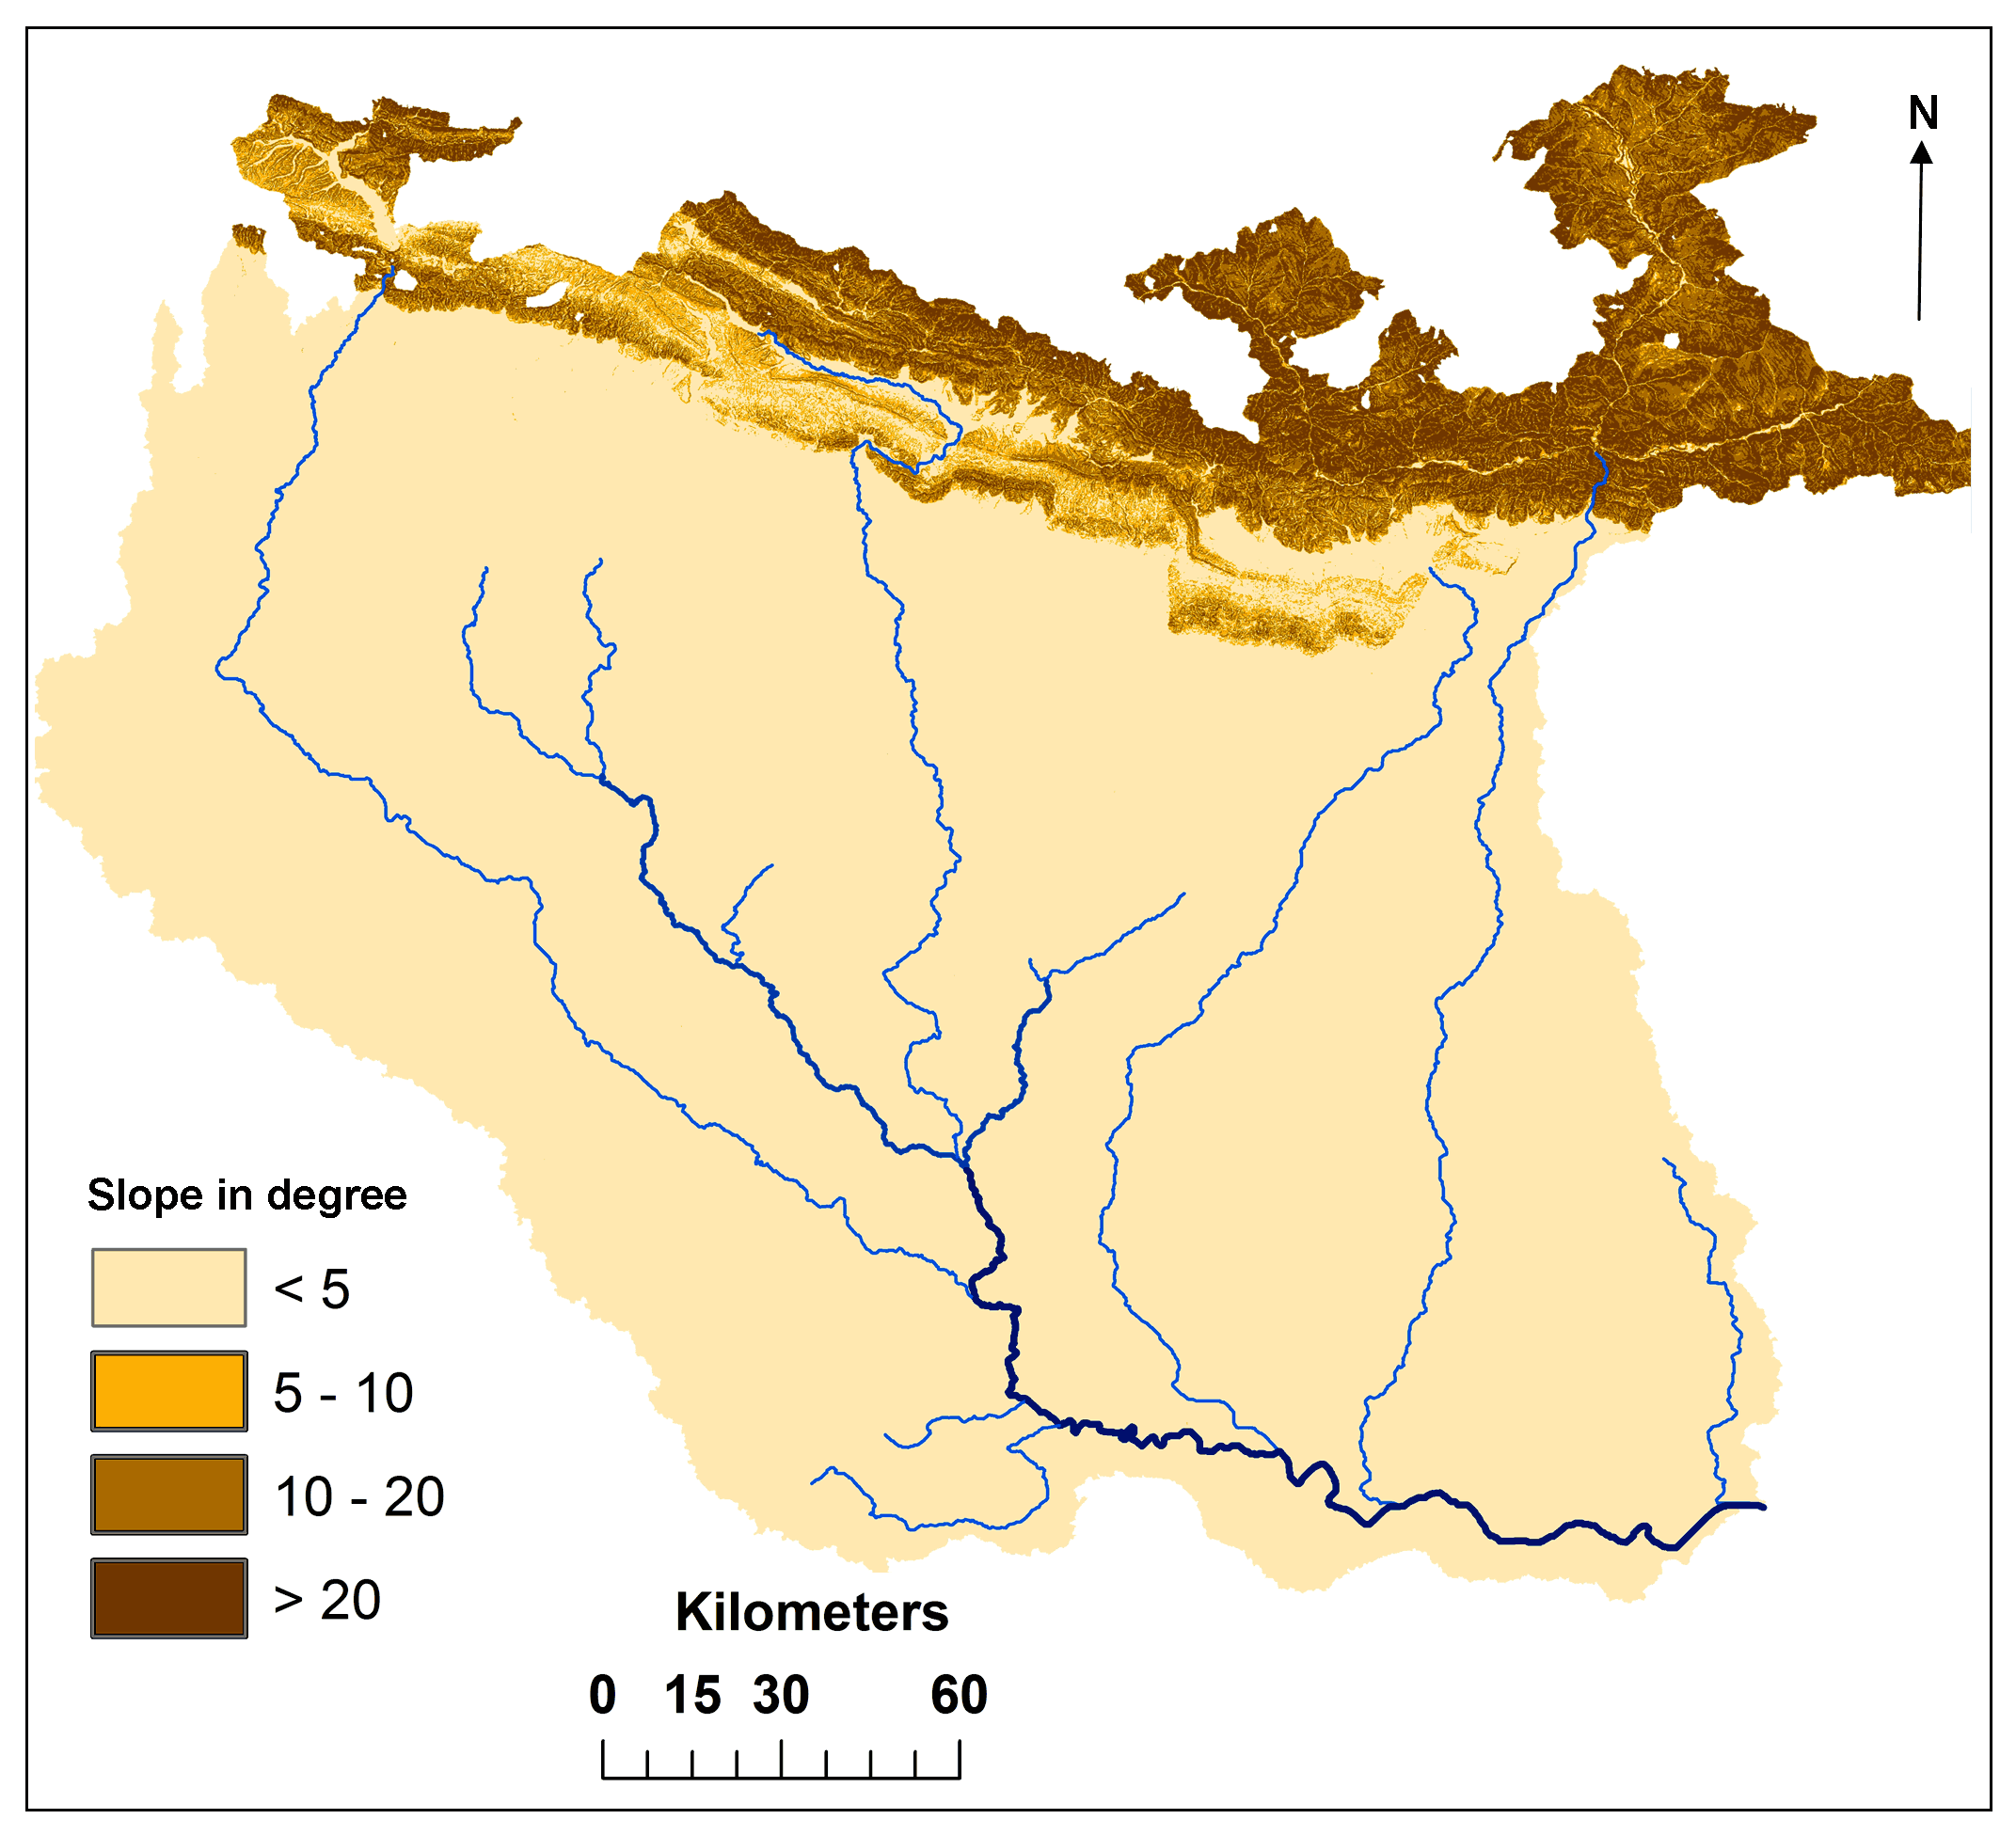
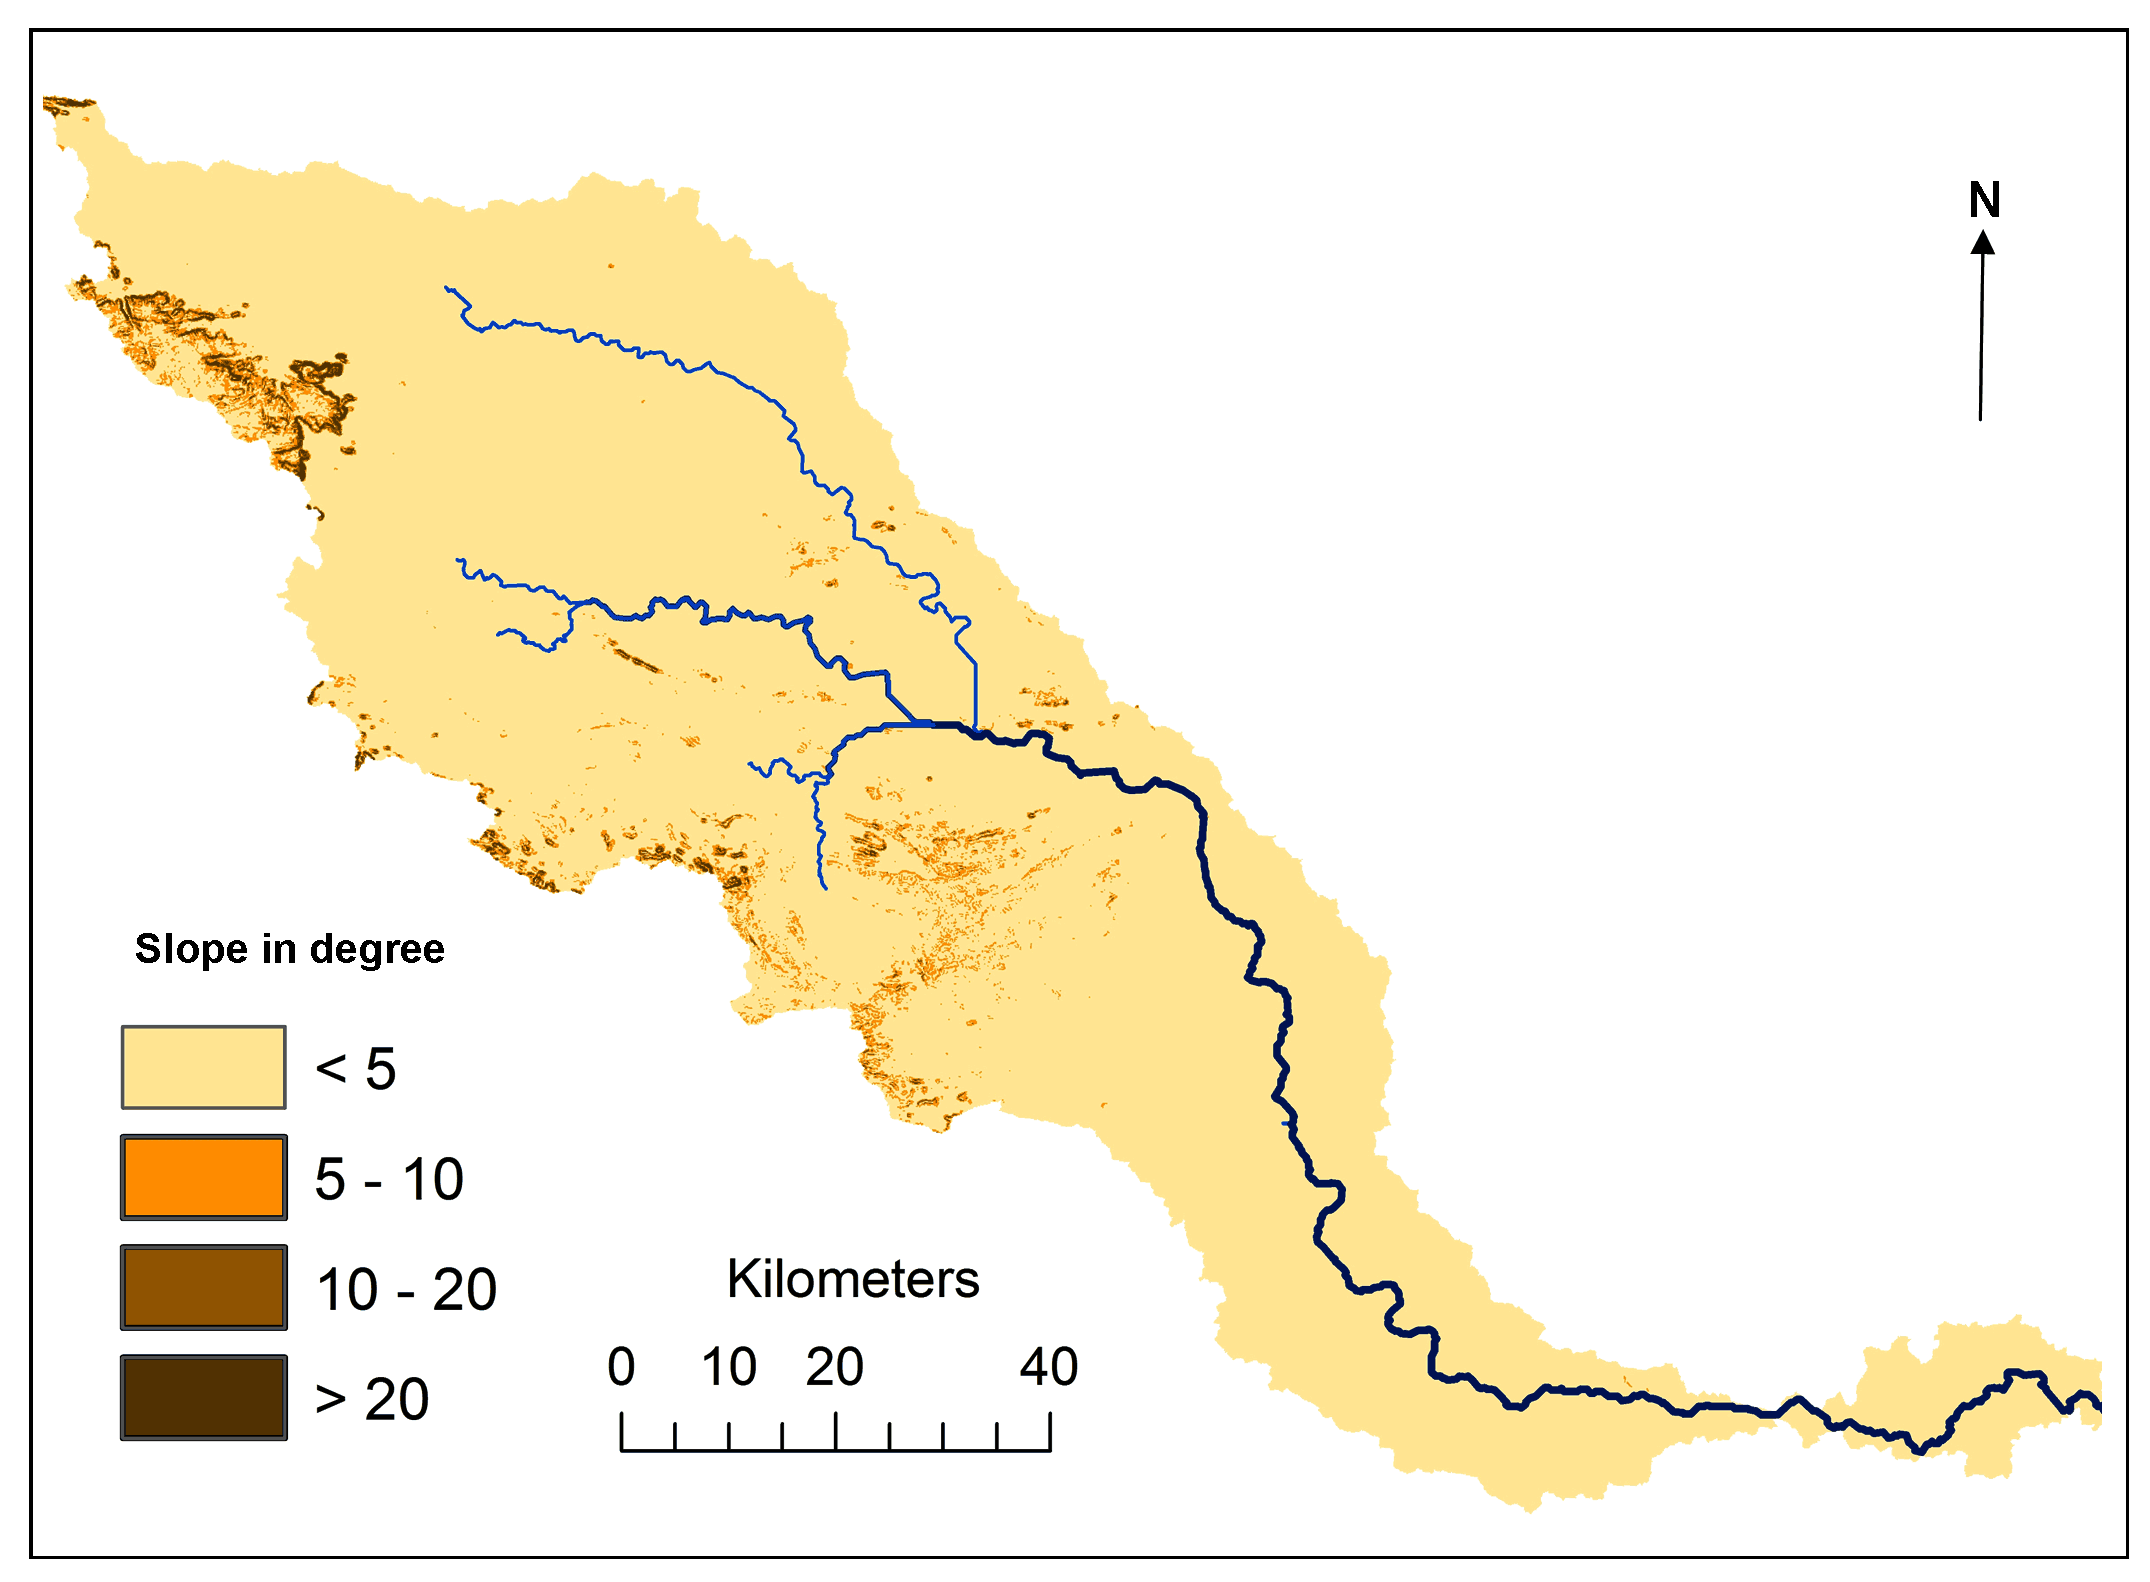
Slope characteristics of any basin represent its overall geomorphic condition. The very high slope (>40º) which dominates the upper reaches of the Kosi basin is a true representative of a young or rejuvenated geomorphic area (Figure 5). However, the slope of the basin decreases dramatically as Kosi enters in the foothill plain areas. This decreasing slope tendency in indicates a high potentiality for further geomorphic evolution of the Kosi basin. On the other hand, for the Kangsabati basin the slope is more or less low (< 10º) throughout the basin indicating low potentiality for further geomorphic evolution (Figure 5).
3.4 Determination of Geomorphic Stages of Development
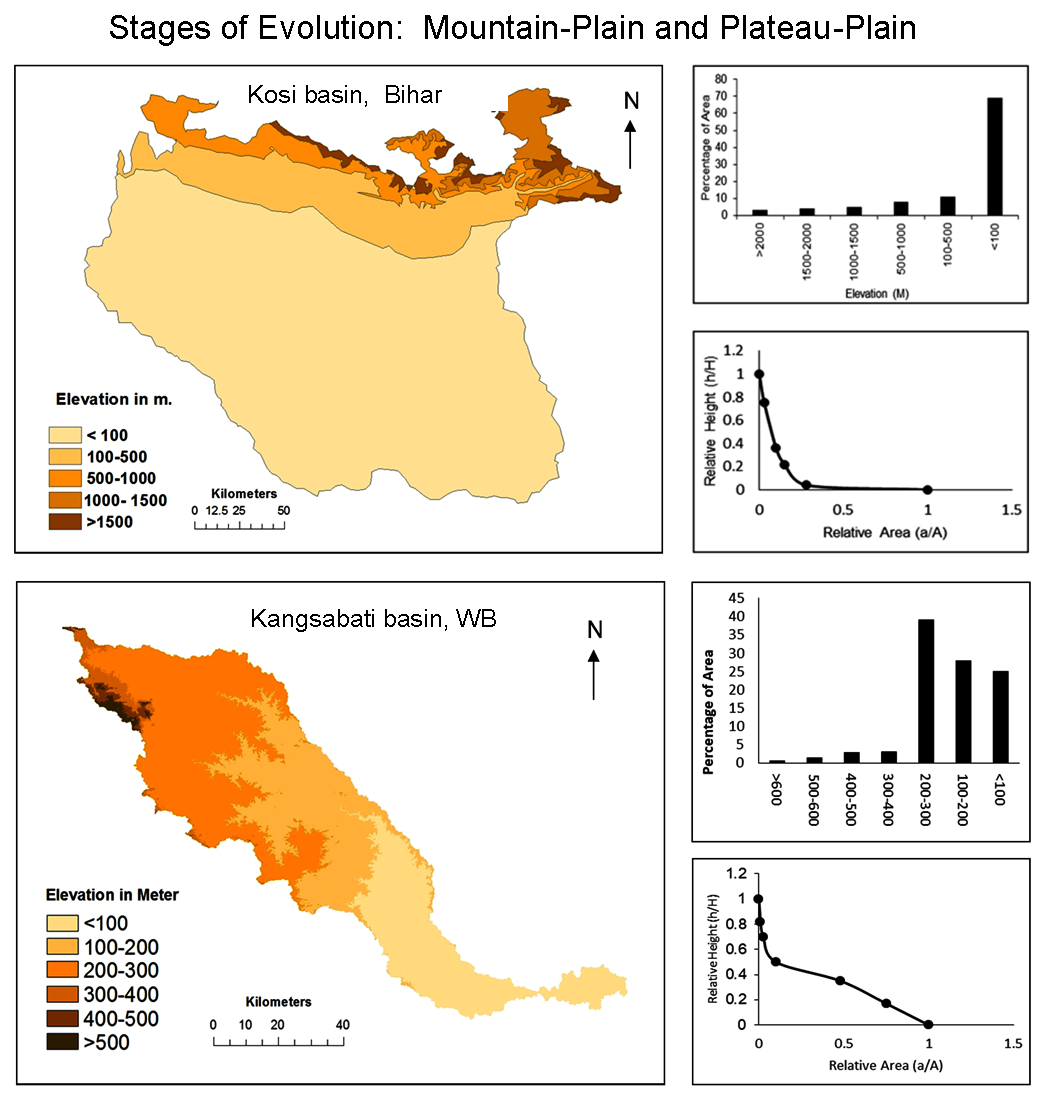
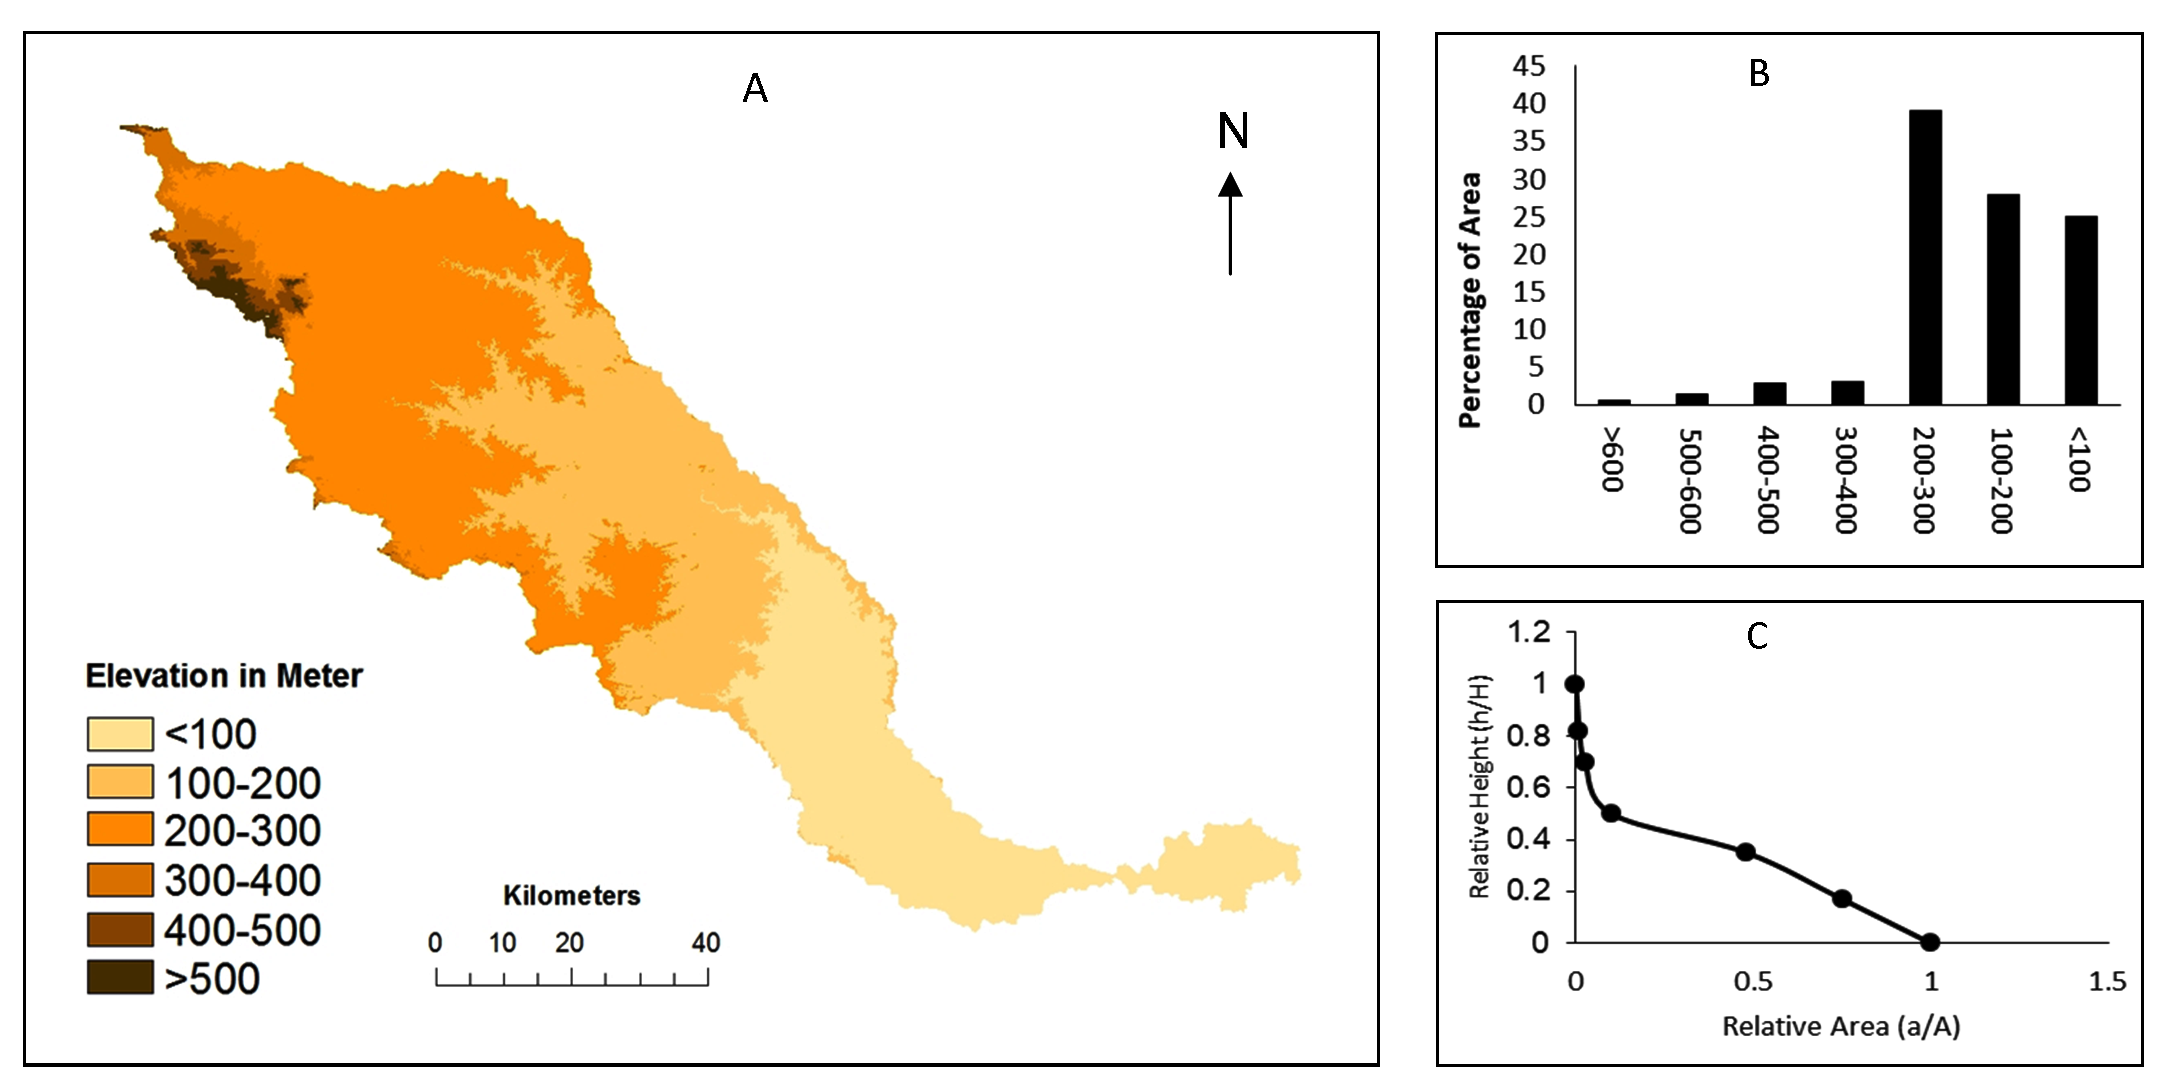
Through the use of area-altitude relationship in general and hypsometric curve in particular, the geomorphic stages of erosional surface have been better understood. The hypsometric curve provides assessmemt of different elevation zones along with corresponding areal coverage expressing it through youthful, mature and old topography parameters. Area-altitude relationship depicts that >70% of area of Kosi river basin falls under <100-meter elevation (Figure 6). Though it indicates that the basin belongs to mature stages of geomorphic evolution the Kosi River has experienced multicycle erosional surface due to its high mountain origin and frequent river course changes, reflecting a more youthful stage of evolution.
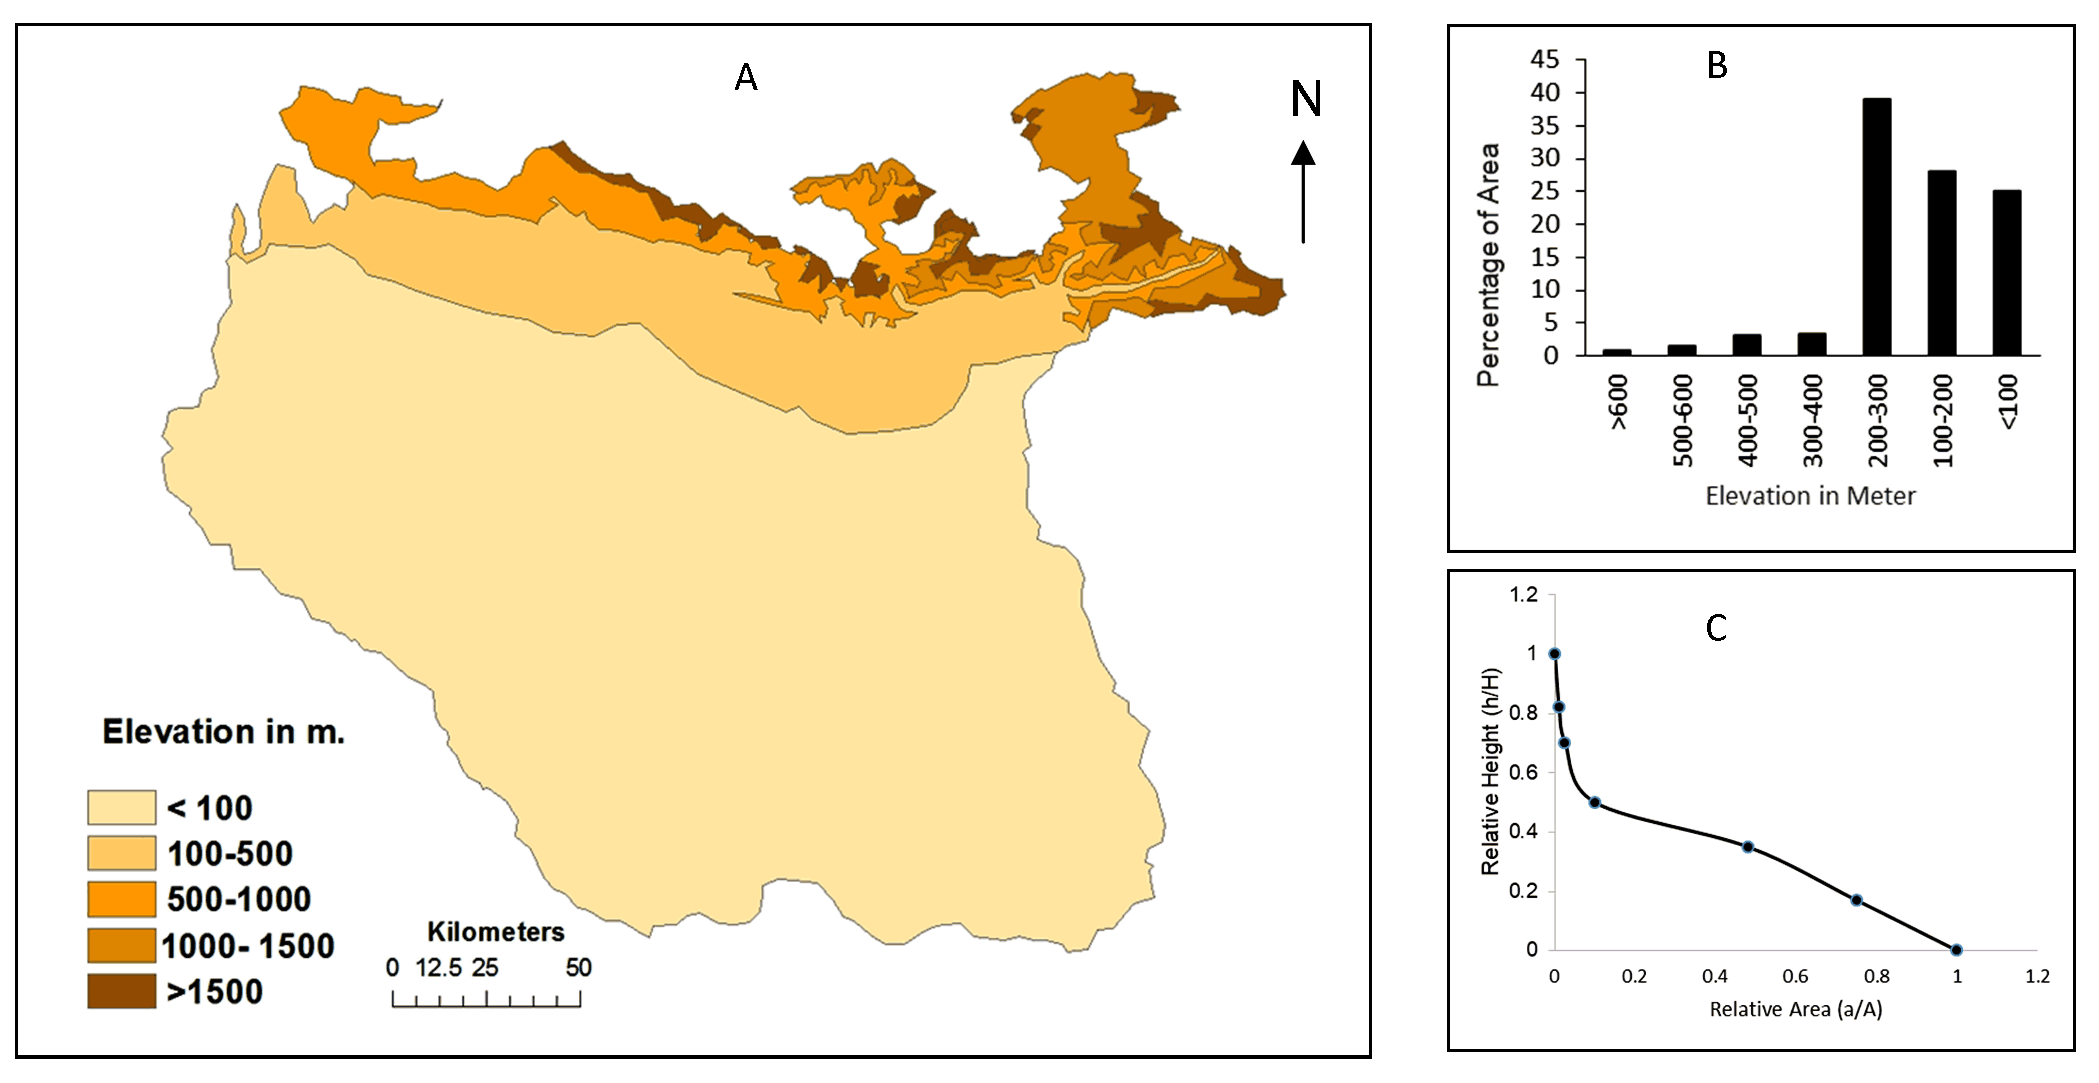
Area-altitude relationship for Kangsabati basin depicts the fact that major area coverage i.e. >65% area is under the elevation zones 300-100 m which indicates that the whole basin belongs to a range of mature to senile topography (Figure 7). Kangsabati river flows through one of old plateau fringe regions of tropical India, i.e. Chotanagpur plateau. Upper reaches of the basin have been transformed to dissected erosional plateau fringe region through continuous erosion, whereas the lower reaches have suffered particularly from sand deposition. As Kangsabati River flows through one of the most stable regions of India, it has not experienced any large upliftment in its geological history. As a result, this basin does not bear any evidence of multi-cyclic landforms.


 ,
Varuni Pathak 1
,
Varuni Pathak 1