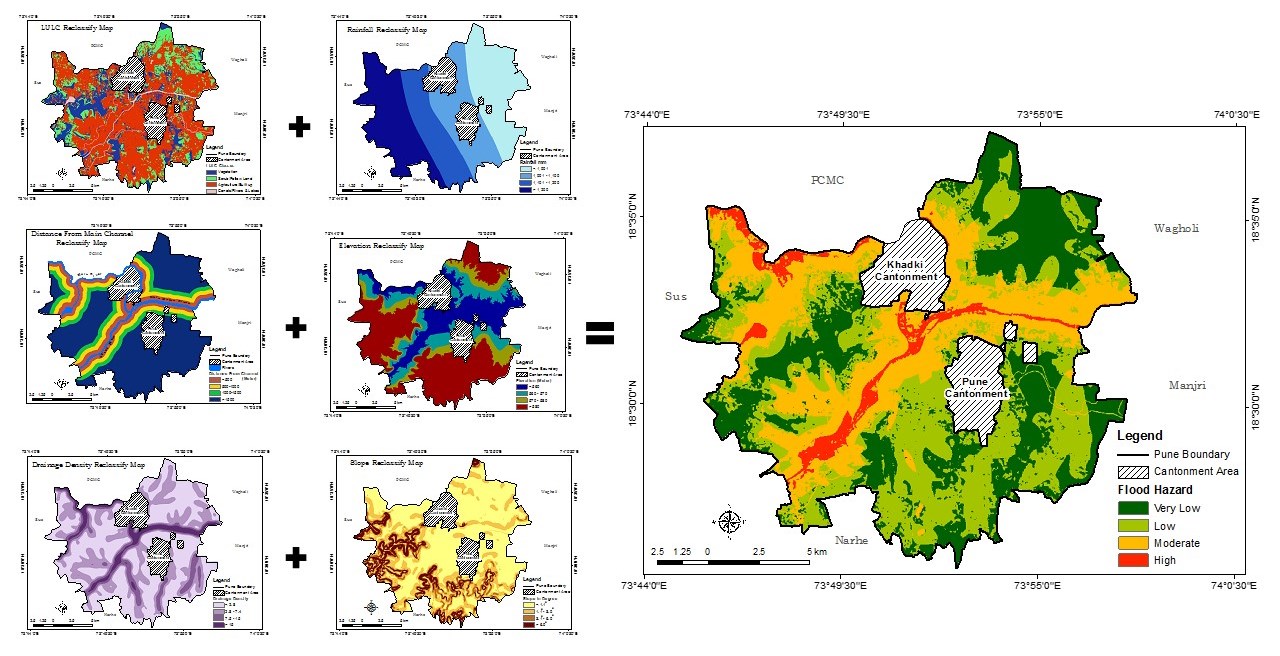
Multi-criteria analysis is effective geospatial techniques for identifying the flood vulnerability zones and disaster risk reduction in Pune city.
Six major criterion are considered for mapping of flood vulnerability: land use/ land cover, distance from channel, drainage density, rainfall, elevation, and slope.
The weights for criterion are assigned based on expert’s opinion and previous case studies.
The flood vulnerability is classified into four classes: very low, low, moderate and high flood risk.
About 5% of study areas shows higher vulnerability for floods in Pune City.
Abstract
Floods are natural risk with a very high frequency, which causes to environmental, social, economic and human losses. The floods in the town happen mainly due to human made activities about the blockage of natural drainage, haphazard construction of roads, building, and high rainfall intensity. Detailed maps showing flood vulnerability areas are helpful in management of flood hazards. Therefore, present research focused on identifying flood vulnerability zones in the Pune City using multi-criteria decision-making approach in Geographical Information System (GIS) and inputs from remotely sensed imageries. Other input data considered for preparing base maps are census details, City maps, and fieldworks. The Pune City classified into four flood vulnerability classes essential for flood risk management. About 5 per cent area shows high vulnerability for floods in localities namely Wakdewadi, some part of the Shivajinagar, Sangamwadi, Aundh, and Baner with high risk.
Keywords
Pune , Vulnerability , Urban , Remote Sensing , Multi-Criteria Decision Making , GIS , Flood , Hazard
1 . INTRODUCTION
Flood is one of the severe natural disasters and a common occurrence in India (Fuchs et al., 2011). A stream is stated to flood when the flow exceeds the capacity within the banks. In recent decades, flooding increased profoundly mainly due to the growth of population, diffusion of settlements over hazardous areas and changes in hydrological characteristics (Winsemius et al., 2013). These floods usually occurred in India annually during the Monsoon from July to October (Pawar et al., 2016). Foremost urban flooding in the last decade affected Mumbai, New Orleans (near the Gulf of Mexico), Yangon (largest city in Myanmar) and Dresden (capital of the eastern German state of Saxony) because of unplanned development, uncontrolled population growth and not strictly inspected construction by authorities (IFRC, 2010). In addition to other aspects play a role in the occurrence of floodings, such as the intensity of rainfall, snowmelt, deforestation, land use practices, sedimentation in riverbeds, and natural or human-made impediments. Floods destroy billions of dollars and kill thousands of people each year (Manfreda et al., 2011; Komolafe et al., 2015).
Therefore, there is a need to conduct study on natural hazard with vulnerability and risk assessments (Sowmya et al., 2015). The present research was to identify flood vulnerable areas and to make a vulnerability zonation using multi-criteria decision-making techniques. Multi-criteria decision-making techniques are valuable in reaching crucial decisions that cannot be determined straightforwardly. Nowadays, there are numbers of multi-criteria decision-making methods available for selection. The present study reviewed the role of GIS in decision-making and then outlined the evaluation approach for selected criterion in the decision process (Malczewski, 1999; Clement, 2013; Papaioannou et al., 2015; Mundhe et al., 2017).
2 . STUDY AREA
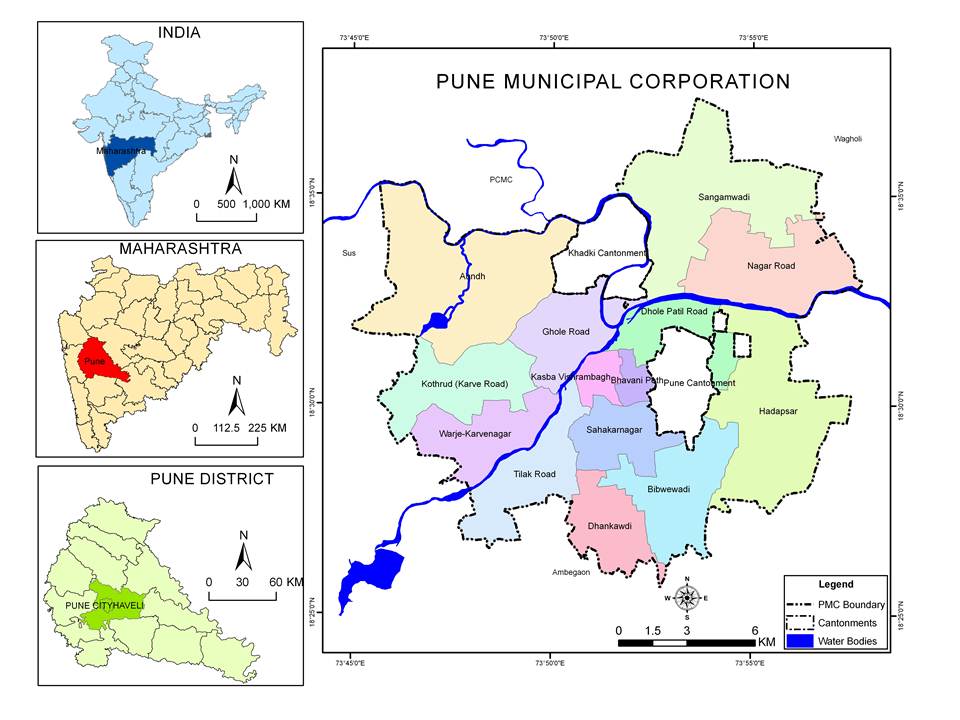
Pune City is the second largest city in Maharashtra and ranked eight at the national level in terms of population, with a population growth of 7.8 percent during 2001-11 (Census of India, 2011). The city boasts of a strong heritage and culture with picturesque historical, religious and natural zones and hence is called the ‘culture capital’ of Maharashtra.
Further, the city also processes the strengths in the educational sector with many educational institutes and a well-skilled labour force, for which, it is considered as the ‘Oxford of the East’. The extent of Pune city is between 18°25′N to 18°37′N latitudes and longitudes 73°44'E to 73°57' E. The geographical area is about 251 sq. km with a population of about 3.1 million. These population composed of 76 general electoral wards (Jaybhaye et al., 2014). Based on Census of India 2011, these wards are converted under 14 administrative wards by Pune Municipal Corporation (Figure 1). Pune city is a plateau region set near the western margin of the Deccan Plateau. It is located at an altitude of 560m above the mean sea level. The city is bounded by hills on the west and the south direction. The Sinhagad-Katraj-Dive Ghat range is the southern boundary of the urban area. The highest point surrounded by the Pune is the Vetal hill. Mula and Mutha Rivers are the main rivers in the study area. Two more rivers, Pavana and Indrayani are flowing from Northwestern direction.
Figure 1. Study area: Pune Municipal Corporation
3 . MATERIAL AND METHODS
Data required for present study is collected from various sources: governmental institutions, published reports, books, research journals, and library resources. The medium resolution (30m) remote sensing data, Landsat 8 (OLI/TIRS) acquired on January 2014 is procured from USGS earth explorer for visual interpretation of land use/land cover. ASTER Global Digital Elevation data collected from USGS Website for preparation of slope and relief maps of the study area.
Subsequently, Survey of India (SOI) toposheets at 1:50,000 scale was used for the extraction of thematic layers: contours, drainage network, water bodies, roads and rail network, forest areas and administrative boundaries, etc. The rainfall data collected from Indian MeteorologicalDepartment, Pune for preparation of rainfall map (Table 1). Demographic details of the study area were obtained from the Census of India and various reports of Pune city, which is useful for the preparation of demographic map. Ward map and administrative boundaries of the study area was collected from Pune Municipal Corporation (PMC).
Table 1. Spatial and non-spatial data
Segment : Pune city
Sources
Topographic maps : 47F/14 and 47F/18
(surveyed in 1979), Scale 1:50,000
Survey of India (SOI)
Satellite data
Landsat 8 (OLI/TIRS) – (2018)
ASTER GDEM (2011)
https://earthexplorer.usgs.gov
Other data
Population
Rainfall
Ward Boundary Map
Census of India, 2011
ESR 2016-17, PMC
Indian Metrological Department (IMD), Pune
Pune Municipal Corporation (PMC) office
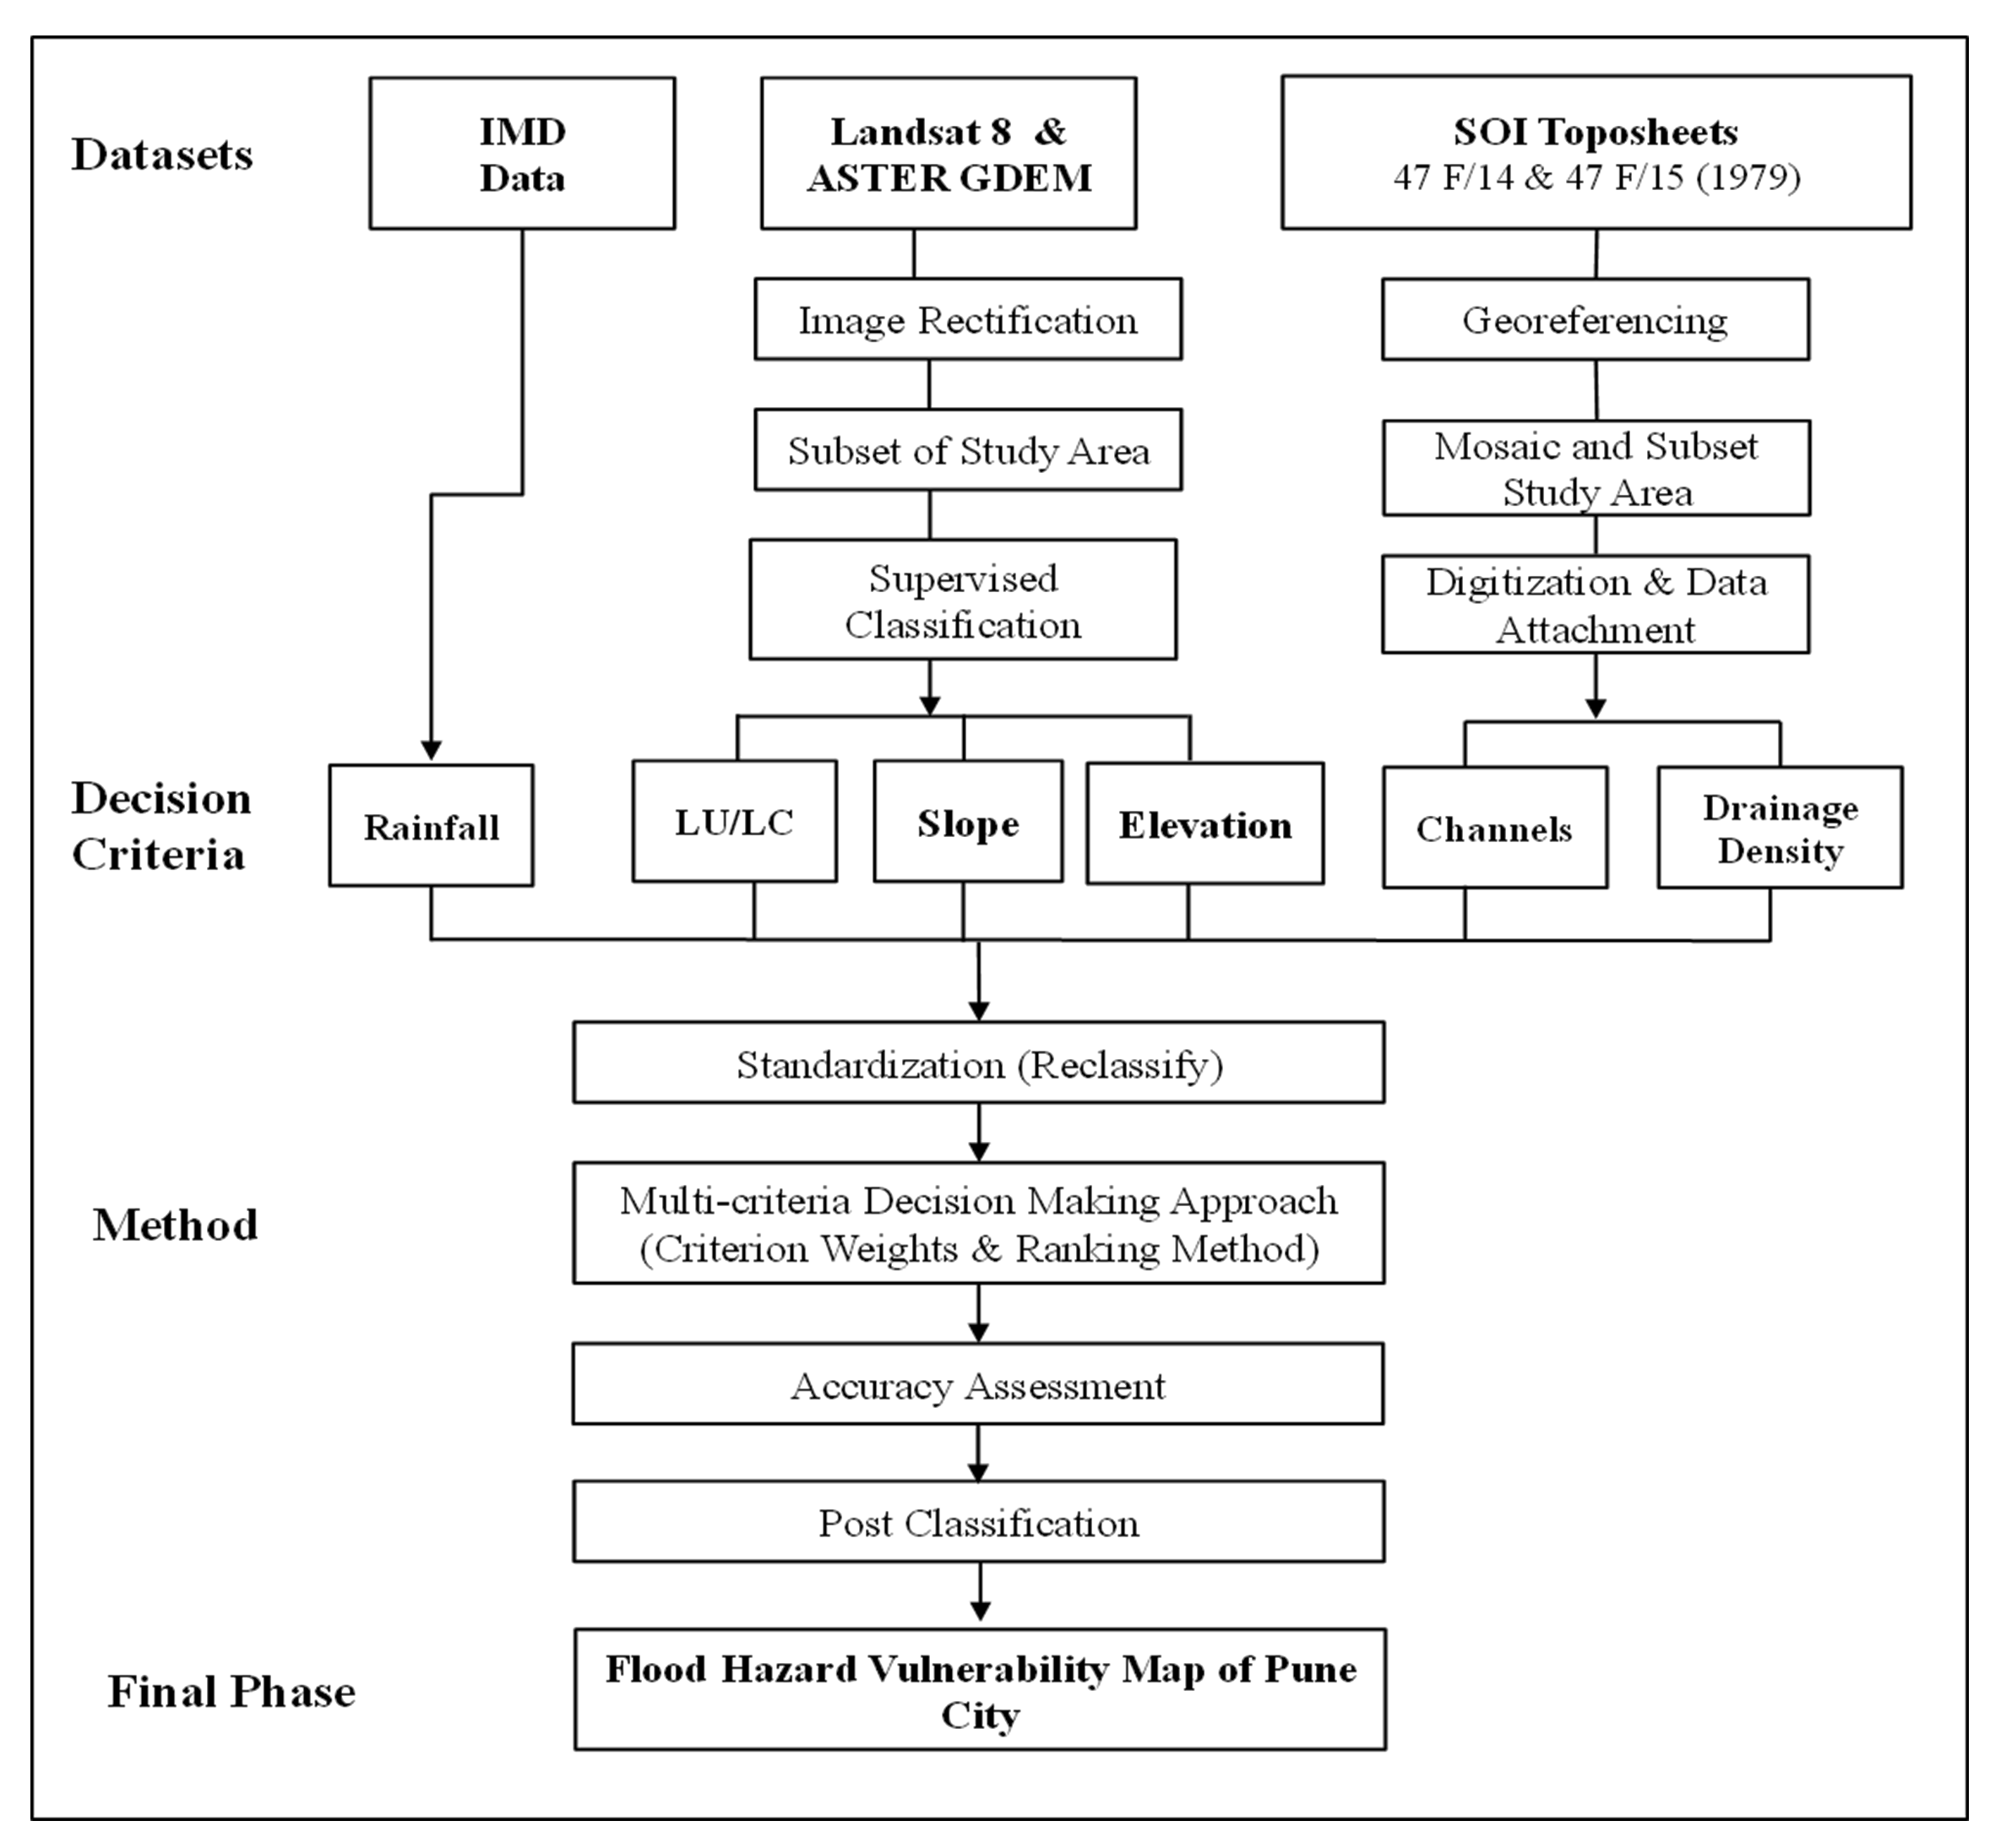
In methodology involved steps are: image pre-processing, image classification, ground truth data collection and verification, multi-criteria decision-making, accuracy assessment, post-classification, and post-processing (Figure 2).
Figure 2. Methodology
3.1 Image Pre-processing
Image pre-processing involves scanning, geo-referencing and digitization topographical maps, satellite images and other base maps. Firstly, topographical maps were geo-referenced using the UTM projection system and digitized thematic layers such as ward boundaries, road, railway line, streams, drainage block sites, contours, population density and river, etc.
The remotely sensed image acquired by the Landsat 8 (OLI/TIRS) sensor with a spatial resolution of 30m in January 2014, was used for visually interpreting the land use/land cover. Images were processed using standered techniques like rectification, enhancement, band extraction, restoration, and image subset.
3.2 Image Classification
Image classification technique is based on spectral reflectance values with an assumption of the training data being normally distributed (Behanzin et al., 2015). The hybrid image classification approach effectively integrates supplementary information into the classification process. The classification scheme of land use/land cover is based on the classification scheme developed by NRSC/ISRO in 2015. As per this scheme, remote sensing data was classified into seven classes: built-up land, agriculture land, vegetation, scrubland, fallow land, river, lakes, and canal.
3.3 Ground Truth Data Collection and Verification
Ground truth verification was done in problematic areas in the classified map of land use/ land cover. Repetative fieldwork was conducted using Global Positioning System (GPS) instrument and digital camera.
3.4 Multi-criteria Decision Making Approach
Multi-criteria approaches have the potential to reduce costs and time (Siddiqui et al., 1996; Ologunorisa, 2004; Kontos et al., 2005). In 1980, Saaty developed an analytical hierarchy process (AHP) method for determining the relative importance of the criteria in a specified decision-making problem (Heywood et al., 1993; Yalcin, 2002; Jaybhaye et al., 2014). Therefore, the present research work follows a multi-criteria decision-making approach using weights assigned to selected criterion: slope, land use/land cover, drainage density, rainfall, and elevation parameters to identify the flood vulnerable zone (Heywood et al., 1993; Yalcin, 2002).
There are many reasons to use the reclassification of criteria including replacing values based on new information, grouping entries and reclassifying values to a standard scale. The reclassification functions reclassify or change cell values to alternative values using a variety of methods. The classification was completed on various layers, and the values were assigned ranging from very low to highly vulnerable zones (Isma’il and Saanyol, 2013). While reclassification of layers was classified into four class. Where the first class, represented very low vulnerable areas, low vulnerable, moderate vulnerable and highly vulnerable zones respectively. It shows that the higher the value means higher is the flood vulnerability. However, in this case, the slope is considered as a negative factor because as the slope increases the flood vulnerability decreases and vice-versa. Finally, these layers are integrated or overlay using ‘Raster Calculator’ of the Spatial Analyst extension of ArcGIS through the map algebraic expression (Figure 2).
3.5 Accuracy Assessment
Accuracy assessment was conducted based on the visual interpretation method supported by ground truth data collected in the fieldwork. Thus, to find out how accurate and useful the resulting classification, it is helpful to conduct an accuracy assessment, primarily, when resulting maps are going to be used for decision-making process (Jensen, 2004). Quality measures derived from the error matrix, which is the cross-tabulation of referenced and classified data (Congalton and Green, 2008).
3.6 Post-classification
Post-classification process refers to the process of removing the error and improving the quality of the classified output. Furthermore, a post-classification smoothing was applied for present work. Corrections and modifications of doubtful land use/land cover are done based on ground intelligence, and the outline is given to final land use/land cover map is prepared.
3.7 Post-processing
The urban flood vulnerability zones were extracted from the classified image. This extracted layer was overlaid on the administrative boundary layer. Finally, detailed mapping of an urban flood vulnerability in the study area was prepared with the help of mined classified layer.
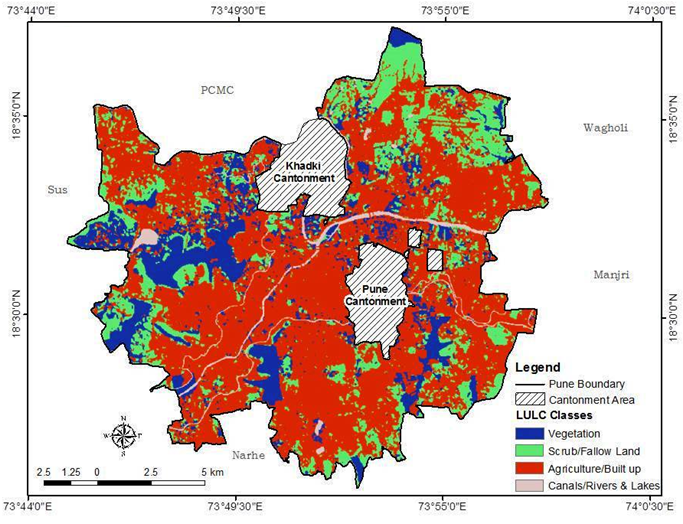
Land use/land cover map is an essential parameter for flood hazard mapping (Sawant, 1978). Land use effects on penetration rate, this interrelationship between surface and groundwater as well as debris flow (Kazakis et al., 2015). Areas with vegetation cover and scrublands show more rate of infiltration and impervious surfaces such as built and wetland area show more surface runoff. Most of the study area covered under built-up area. Agriculture land is mostly observed in the Southeast part of the city. The water body covers minimum area in the form of small dams and lakes in the Western and Southern part of the city. The classified land use and land cover map of Pune city reclassified based on flood hazard guideline in four categories: i) canals, rivers and lakes, ii) built up area, iii) agriculture, scrub, and fallow land, and iv) vegetation. The weights are assigned to these criterion as 4, 3, 2, and 1, respectively (Figure 3).
Figure 3. Reclassified map: Land use and Land cover
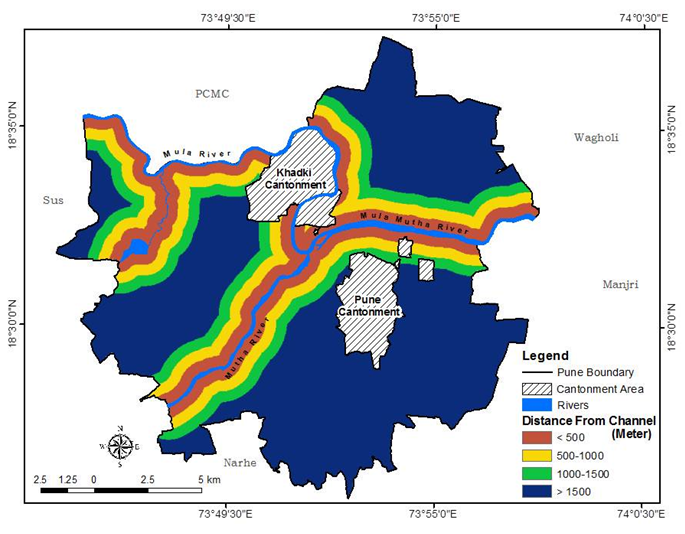
4.2 Distance from Main Channel
Flood hazard risk is more in an area close to the river main channel and its decrease the increasing distance. At the time of the flood, the surrounding area of the river is more affected. Mula and Mutha River these two rivers are the main rivers in the study area. Mula River is coming from the Northwest and Mutha River is coming from the Southwest and confluence of both streams is at Shivajinagar. Mula and Mutha Rivers have been mapped from the satellite images and topographic maps. Multiple ring buffers were created from the distances of the river channel, then buffer are divided into four classes: high (distance <500m), moderate (distance from 500m to 1000m), low (distance from 1000m to 1500m) and very low (distance >1500m) (Figure 4).
Figure 4. Reclassified map: Distance from Channel
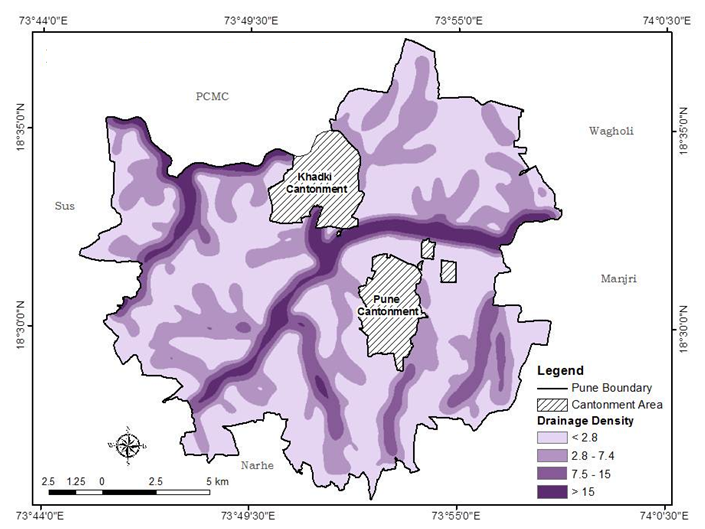
4.3 Drainage Density
Drainage density is a measure of stream spacing (Langbein, 1947). Drainage density reflects the basin’s geology and climate. Basins underline by resistant; permeable materials have low drainage density; basins emphasizes by weak, impermeable materials have high drainage density (Strahler, 1958). For the same geology and slope angle, humid regions tend to have lower density due to the growth of thick vegetation that promotes infiltration. The arid region would have managed to have higher density given in the same geology.
A higher value of drainage density indicates a relatively high density of streams. Drainage density map of Pune city is classified into four categories based on flood hazard guideline as: very low (< 2.8), low (2.8 to 7.4), moderate (7.5 to 15) and high (> 15) and weights assigned them as 1, 2, 3, and 4, respectively (Figure 5).
Figure 5. Reclassified map: Drainage Density
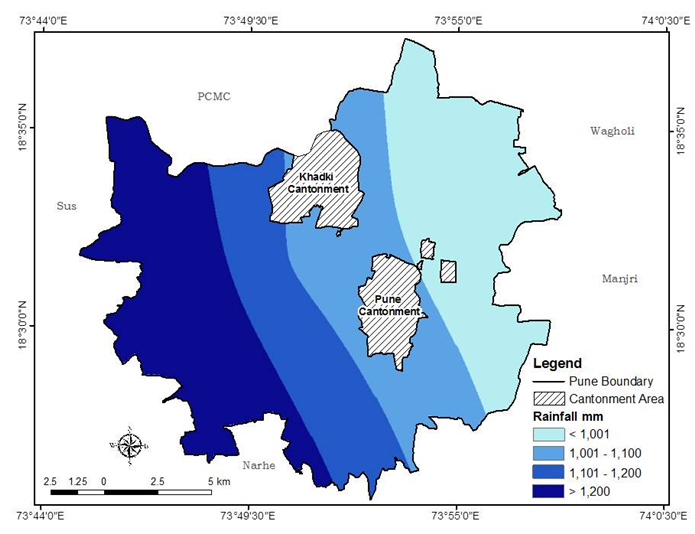
4.4 Rainfall
Rainfall is one of the significant factors that play a crucial role in creating a flood situation. Flood situation occurred when surface runoff increased with increasing rainfall at that time river channel cannot cater to the extra load of water. The distribution of rainfall in the study area is increased move to the Western side. The rainfall data was collected from 12 rain gauge stations across the Pune district. Rainfall map was prepared using Kriging spatial interpolation available in Arc GIS environment. The rainfall map reclassified into four classes: very low rainfall (<1001mm), low rainfall (1001mm to 1100mm), moderate (1101mm to 1200mm) and high rainfall (>1200mm) (Figure 6). Lowest weight 1 assigned to very low rainfall category and highest weight 4 assigned to class of higher rainfall. Maximum rainfall occurs in the Western part of Pune.
Figure 6. Reclassified map: Rainfall
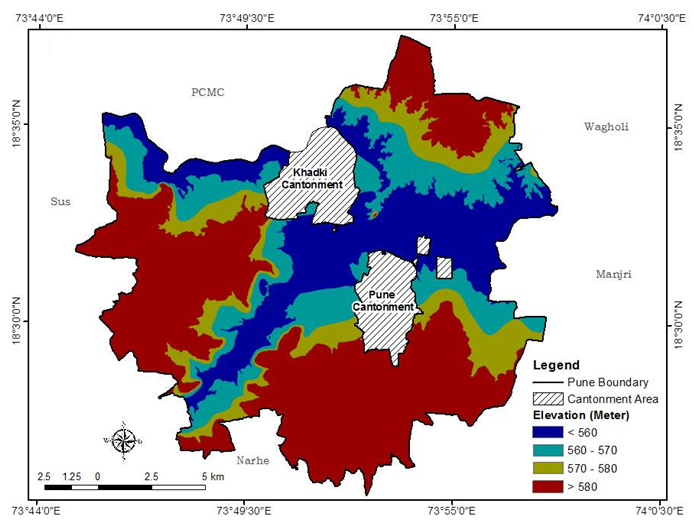
4.5 Elevation
Elevation also on the situation. Surface water always flows from the high elevated area to elevated area. Flood situation probably created in lower flat compare to a elevation. Low elevation area found in the and surrounding area of the rivers in city with gentle slopes. Higher found in North, West and Southern part of the . Elevation map created from topographical maps scaled at 1:50000 with 20m contour interval and benchmark heights by using 3D Analyst tool in Arc GIS software. On the basis flood hazard guideline, elevation map is into the four classes: high elevation (<560m), moderate (560m to 570m), low (570m to 580m) and very low (>580m) (Figure 7). Low elevation area was assigned the highest weights and high elevation region assigned the lowest weights.
Figure 7. Reclassified map: Elevation
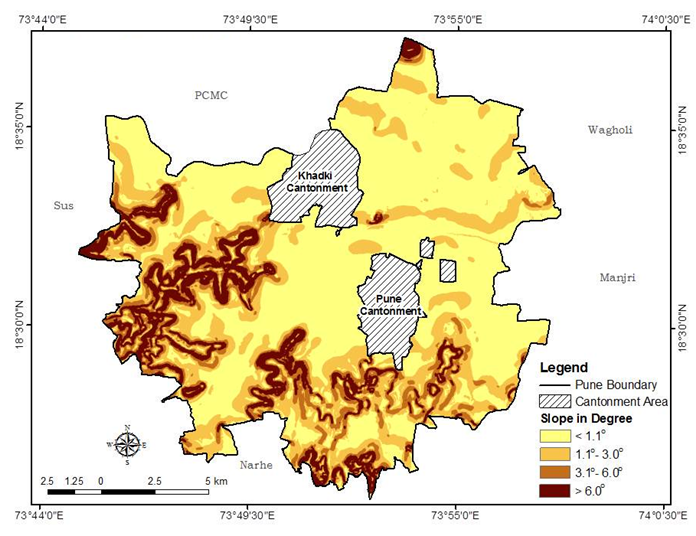
4.6 Slope
The slope is another indicator responsible for flood, which is a consideration for analysis. The lower the slope value indicates flat the terrain and the higher the slope value shows steeper the terrain. The output slope dataset can be calculated in percent or degree of slope (Jensen, 2004).
Slope map is generated based on the contour line in Arc GIS. There are four categories of the slope are identified and calculated as degree unit. Northern and middle part of the city is mostly flat. Northeast and Southwest part is covered by hilly region (Figure 8). Most of the study area falls under slope category less than 1.1º, which covered 90 percent of the total study area (Figure 8). The low degree of the slope has been assigned the highest weight, and a high degree of slope assigned the lowest weights.
Figure 8. Reclassified map: Slope
5 . RESULTS AND DISCUSSIONS
The flood vulnerability map generated by integrating the thematic layers like Slope, Elevation, Land use/land cover, Rainfall and Drainage density. The factors affecting the flood-prone area and their weights assigning based on expert’s opinion and previous case studies. The summary of assigning weight to the selected criterion is given in Table 2.
Table 2. Assigning weights for criterion
Criterion
Weights
Sub-criterion
Ranking
Land use Land Cover
31.00
Canal / Rivers and Lakes
4
Built Up
3
Agriculture/Scrub/Fallow
2
Vegetation
1
Distance from Main Channel
24.90
< 500
4
500 – 1000
3
1000 – 1500
2
>1500
1
Drainage Density
16.85
> 15
4
7.5 - 15
3
2.8 – 7.4
3
< 2.8
1
Rainfall (mm)
14.41
> 1200
4
1101 – 1200
3
1001 – 1100
3
< 1001
2
Elevation
7.71
< 560
4
560 – 570
1
570– 580
1
<580
1
Slope
5.14
< 1.1
4
1.1 – 3.0
3
3.1 – 6.0
1
> 6.0
1
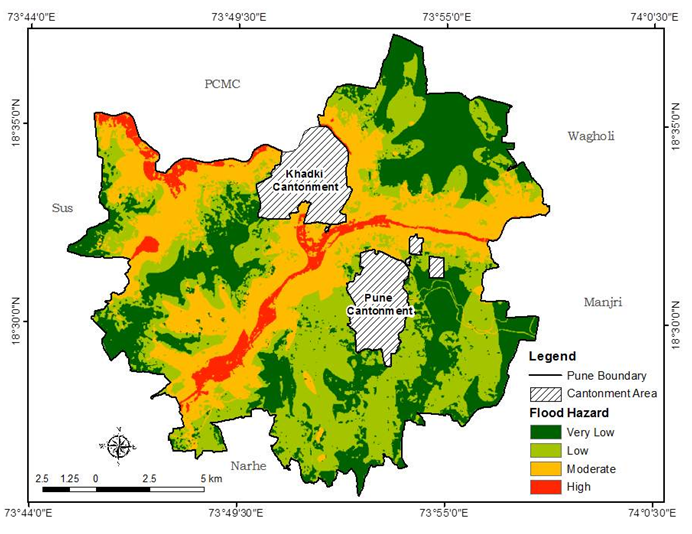
The urban flood vulnerability is divided into four classes: very low, low, moderate and high zone prepared by classifying the cumulative vulnerability score. About 66.43 per cent (166.12 sq. km) of the total area of Pune City has very low and low urban flood vulnerability (Figure 9). The result revealed that the area under moderate and high vulnerability zones together constituted 33.5 per cent of the total area of the Pune City.
Figure 9. Flood hazard vulnerability zones of Pune city
In the vulnerability zonation, 5 per cent area (12.50 sq. km) of Pune City is identified as ‘high’ vulnerable to urban flood. The major localities included in this zone are Wakdewadi, some part of the Shivajinagar, Sangamwadi, Aundh, and Baner with high risk. A quality drainage channel in these areas is very poor and they are not maintained appropriately. if channels are present those are not sufficient for draining out the instantly accumulated floodwater because the connection to the main drainage channels is lacking. Some of the identified locations have no drainage system with very compact and dense settlements. Therefore, the special planning for stormwater drainage in south Wakdewadi, some part of the Shivajinagar, Sangamwadi, Aundh, and Baner are necessary. These locations are prime areas, where schools, banks, markets, high court, hospitals, colleges, and other commercial institutions are located with high crowding. Hence, it can be observed that if any urban flood happens, that will seriously affect the common public, compared with the other locations. Apart from the above observation, 28.6 per cent of the Pune City is living in the zone, which is ‘Moderate’ vulnerable to urban flood. This zone includes areas: Yerwada, Hadapsar, Warje, Dattawadi, etc. (Figure 9).
Urbanization is very fast in Pune city; therefore, the paved area also increased. At the time of heavy rainfall, suddenly create the runoff and the flood situation in the lower part of the city. Flood hazards zones in Pune city observed that 5.00 percent (12.50 sq. km) of total area shows high flood risk zone. Wakdewadi, some part of the Shivajinagar, Sangamwadi, Aundh, and Baner areas are included in high flood hazard zone.
Water releasing capacity of Khadakwasala dam is 97,000 cusec, but flood situation created in the city only released the 50,000 cusec water due to the illegal construction and encroachment in the river channel. When water released above 55,000 cusec from the Khadakwasala dam that time, then locations in the left bank of Mutha river and seventeen locations at the right bank of Mutha river is affected by the flood.
6 . CONCLUSIONS
The study demonstrates the use of GIS and geo-spatial technology for analysis to identify the flood vulnerability zones. These identified zones can be used to take multiple measures of pre- and post-disaster management in Pune city. Flood affected areas were identified and mapped using GIS Software. The study reveals that due to closeness to river Mula and Mutha, the pervasive pattern of land use for infiltration, low relief, and housing compactness; some areas in the study area were found to be highly vulnerable to flood, and these areas observed in Wakdewadi, some part of the Shivajinagar, Sangamwadi, Warje, Aundh, and Baner, etc. The analysis is helpful for local planning authorities and planners for identification of risk areas and taking proper decision in right time. The flood vulnerability map can give planners insures and emergency services a valuable tool for assessing flood risk.
Tables
Figures
Conflict of Interest
Author proclaimed no conflict of interest.
Acknowledgements
Abbreviations
AHP: Analytical Hierarchy Process; GIS: Geographical Information System; IFRC: International Federation of Red Cross; IMD: Indian Metrological Department; ISRO: Indian Space Research Organisation; NRSC: National Remote Sensing Centre; PMC: Pune Municipal Corporation; UTM: Universal Transverse Mercator.
Isma’il, M. and Saanyol, I. O., 2013. Application of remote sensing and geographic information systems in flood vulnerability mapping: Case study of River Kaduna. International Journal of Geomatics and Geosciences, 3(3), 618-627.
Mundhe, N., Deshmukh S., and Vyas A., 2017. GIS based urban flood vulnerability analysis in Western Zone of Ahmedabad City. International Journal of Research in Geography (IJRG), 3(4), 41-51.