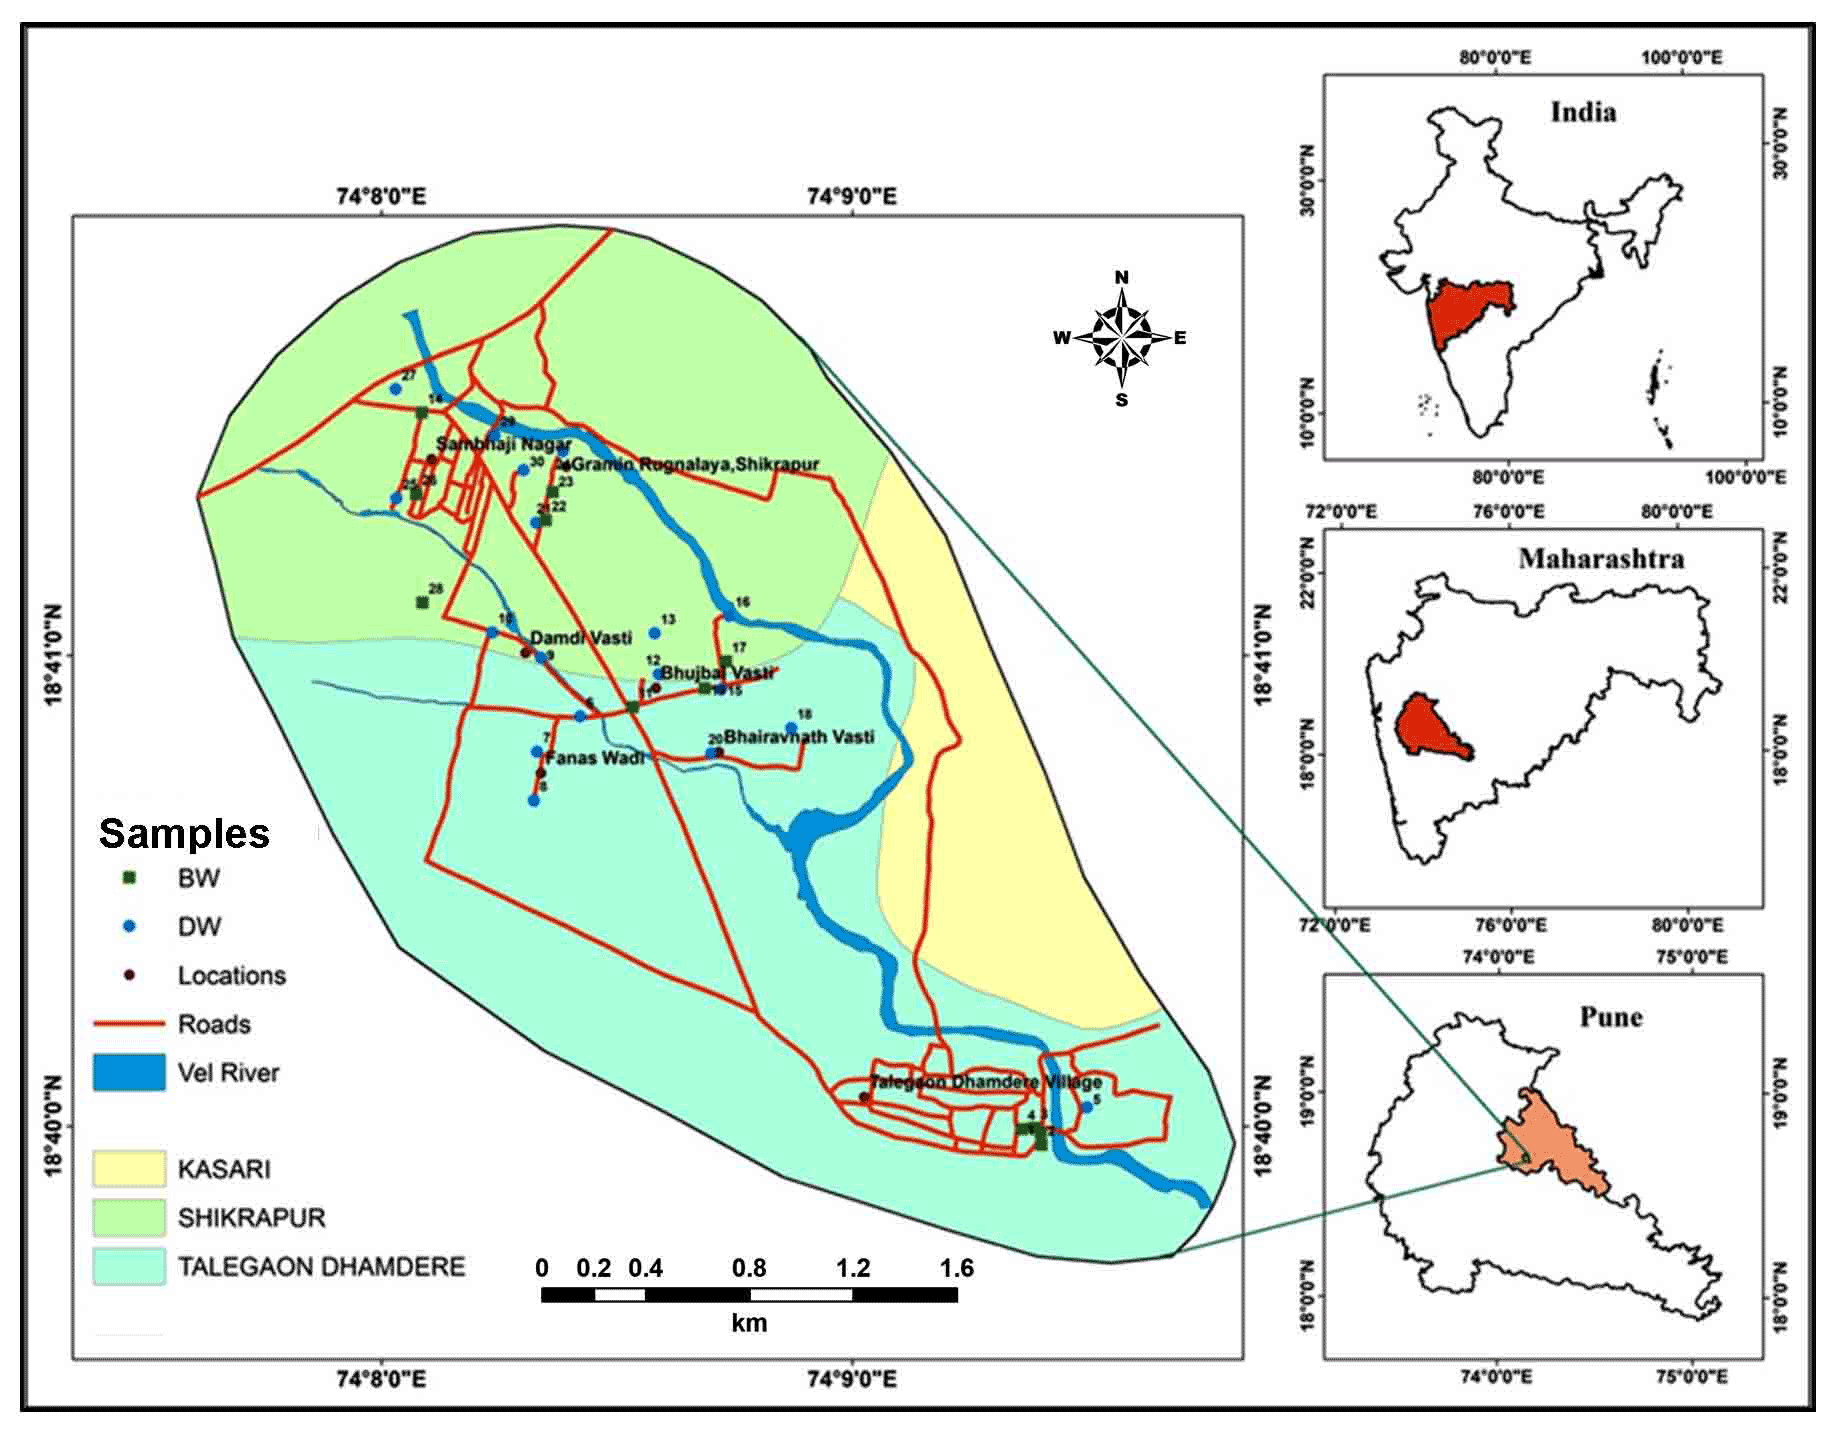
Abstract
Thirty (30) groundwater samples have been collected during Pre-monsoon season-2015 to analyze the groundwater quality of Shikrapur and Talegaon Dhamdhare area. Maps were prepared for major physicochemical elements in groundwater and geomorphologic aspects using GIS and Remote Sensing techniques. Trend in cations is Na>Ca>Mg>K while in anions is Cl>HCO3>NO3>SO4. The average, Na+Ca representing 61.37% of total cations denoting major supply from weathering of plagioclase feldspar while Ca+Mg values, 67.92 % of cations contributed from olivine and pyroxene. Anions like Cl, SO4 and NO3 in groundwater is contributed from anthropogenic activities. The results were compared with WHO norms and found higher values for Electrical Conductivity (EC), Calcium (Ca), Potassium (K), Magnesium (Mg), Chloride (Cl) and Nitrate (NO3). Other elements show low to optimum values indicating good quality for drinking purposes, excluding some pockets from lower reaches. Regular quality monitoring for groundwater with rainwater harvesting is suggested to improve the quality of groundwater in the region.
Keywords
Pune , Remote Sensing , GIS , Metropolitan Region , Groundwater quality
1 . INTRODUCTION
Globally, groundwater is the major source for domestic, agriculture as well as for industrial purposes. (Kale et al., 2010; Ravishankar et al., 2010; Gaikwad et al., 2012a; Ravikumar and Somashekar, 2013; Wagh et al., 2016; Wagh et al., 2018a; Wagh et al., 2018b; Gaikwad et al., 2019). Major elements like sodium (Na+), calcium (Ca2+), magensuim (Mg2+), potassium (K+), bicarbonate (HCO3), chloride (Cl-), sulphate (SO42-), nitrate (NO3-) and silica (Si) makes up to 99% of the dissolved constituents in groundwater (MacDonald and Davies, 2000; Ganyaglo et al., 2010). Once groundwater aquifers contaminated by anthropogenic activities, it will persists that contamination for hundreds of years due to slowest movement (Nathanson, 1986; Aksoy and Scheytt, 2007; Ravishankar et al., 2010).
Analyzed data of groundwater can be used to find out its suitability for drinking, agriculture and industrial purposes (Babiker et al., 2007). This can be analyzed easily with the help of geospatial techniques in GIS [Geographic Information System] (Mahalingam et al., 2014). GIS is useful tool to analysis the changes in land use/land cover, lineament and groundwater qualities and for monitoring the groundwater resources (Chaudhary et al., 1996; Skidmore et al., 1997; Saraf, 1999; Epstein et al., 2002; Tjandra, et al., 2003; Shankar et al., 2010; Aravindan and Shankar,2011; Wagh et al., 2016; Kadam et al., 2018).
Gaikwad et al. (2012b) have analyzed physicochemical elements in groundwater from downstream part of the Vel River Basin and reported necessity of more attention due to more industrialization, growing residential area, having water scarcity problem with zones of hard to very hard water with many kidney stone patients. Therefore, this study was undertaken with spatial analysis of groundwater qualities using GIS and RS techniques in and around Shikrapur and Talegaon Dhamdhare, Pune district, Maharashtra (India). The study is focused on analysis of water related issues.
2 . STUDY AREA
Study area is downstream part of the Vel River basin (9 Km2), a tributary of Bhima River flowing through Rajgurunagar and Shirur tehsils of Pune district (Figure 1) (Shikrapur and Talegaon Dhamdhare). The extents are from 74º07ʹ37.686" to 74º09ʹ47.506"E and 18º39ʹ43.04" to 18º41ʹ53.555"N (SOI toposheets- 47 J/2, scale- 1:50,000).
Annual rainfall is about 650 mm, receives from June to October (IMD, 2015). An average temperature ranges from 10 to 28°C. Gently rolling topography observed in the area and alluvial deposits mainly along the river course. Vel River (length 5866 m) is the major river flowing with two tributaries of 2665m and 1100m lengths (Figure 1).
The slope is estimated from ASTER images and varies 15% to 55% (Figure 2). Gentle slopes result in slower runoff and less rate of erosion with good recharge potentials (Kadam et al., 2012; Mundalik et al., 2018).
Land use and land cover (LULC) is the key factor of availability and distribution of groundwater with quality (Ghorbani et al., 2017; Singhai et al., 2017; Kadam et al., 2017). It is helpful for identifications of infiltration zones and quantification of surface runoff (Jasrotia et al., 2006; Dinesh Kumar et al., 2007). LULC modifies evapotranspiration patterns and groundwater recharge (Jasrotia et al., 2006; Manap et al., 2013).
LULC map shows dominance of land use for agricultural activities (57%) and built-up land shows 33%, fallow land observes 7% and water bodies covers 3% of the land in the study area. This map (Figure 3) was also used as base map during collection of groundwater samples.
3 . GEOLOGY
The study area is a part of Central Deccan Trap, Supergroup. Indrayani Formation and Upper Ratangarh Formation are exposed (Figure 4). Indrayani Formation is typically characterized by the presence of compact, massive, porphyritic basalts where the phenocrysts are embedded in fine-grained groundmass (GSI, 2001). Jointing nature have attributed them to be moderately good aquifers (Figure 4). They are seen occurring in low-lying flat plain areas of Vel River basin (GSI, 2001). Upper Ratangarh Formation is consisting of 3 compound pahoehoe flows (50-220m) thick in the area under investigation. It comprises mainly dark grey, fine to medium grained, massive hard and compact, non-porphyritic to porphyritic in nature with olivine phenocrysts (Godbole et al., 1996; GSI, 2001).
4 . METHODOLOGY
Sampling and Chemical Analysis
Sites for groundwater sampling were decided with consideration of geological and geomorphological variation from the study area (Figure 6). Thirty (30) groundwater samples from dug wells and bore wells, tapping diverse aquifers were collected in the month of April-2015 for major physicochemical analysis. The standard methods were adapted for collection and analyses of water samples given by APHA (1998). Anions and cations in groundwater samples were analyzed on High Performance Ion Chromatography (HPIC) and Inductively Coupled Plasma Atomic Emission Spectroscopy (ICPAES-9000; Shimadzu, Made in Japan) respectively, available in Geology department of Savitribai Phule Pune University, Pune (India).
5 . RESULTS AND DISCUSSIONS
5.1 Distribution of pH and EC
Groundwater in the region is slightly alkaline in nature (range: pH 7.12-8.19; average: 7.12) (Figure 7). The Electrical Conductivity (EC) is high (>1900 µS/cm) reported in the Central part, while lower values are estimated in the Northwest part of the region (Figure 8). Average value of EC (781 μmhos/cm) shows high mineralization in the groundwater (Pawar et al., 2008; Rubasinghe et al., 2015).
Table1. Physicochemical analysis
|
Parameters
|
Maximum
|
Minimum
|
Average
|
Variance
|
Standard Deviation
|
|
pH
|
8.19
|
7.12
|
7.65
|
0.07
|
0.26
|
|
EC
|
1921.00
|
32.00
|
781.80
|
460992.79
|
678.96
|
|
Hardness
|
1495.47
|
204.94
|
583.19
|
172159.79
|
326.97
|
|
Na
|
245.40
|
20.97
|
120.43
|
3916.96
|
62.58
|
|
K
|
87.57
|
3.84
|
14.57
|
489.66
|
22.12
|
|
Ca
|
270.90
|
45.10
|
105.08
|
3250.09
|
57.00
|
|
Mg
|
198.90
|
22.42
|
77.51
|
2096.97
|
45.79
|
|
CI
|
781.76
|
1.43
|
335.40
|
38415.9
|
195.99
|
|
HCO3
|
510.00
|
205.00
|
313.50
|
4922.67
|
70.16
|
|
SO4
|
331.09
|
20.05
|
100.01
|
8488.90
|
92.13
|
|
NO3
|
587.71
|
3.20
|
104.64
|
25198.21
|
158.73
|
|
All values given are in mg/l, except EC in μmhos/cm and pH on scale.
|
5.2 Distribution of Cations
Increase in concentration of Sodium (Na) (Figure 9) from Northwest to Southeast parts due to changes in hydro-geomorphological settings (e.g., slope) (Pawar et al., 2008) and groundwater flow except in Central part where highest Na found due to more rock-water interaction (Hem, 1959).
In many samples, low concentration of Potassium (K) is observed due to non-appearance of Potassium rich minerals (Subbarao et al., 1994; Gaikwad et al., 2019). However, increase of K in groundwater in downstream part of the study area (Figure 10) is due to use of high fertilizers and anthropogenic activities (Pawar et al., 2008; Kale et al., 2010).
Mafic minerals are principal components in the lithology from the study area contributing towards more Magnesium (Mg) as one of the major dissolved constituent in the groundwater (Hem, 1959; Subramani et al., 2010). Concentration of Mg in groundwater from study area varies from 22.42 to 198.9mg/l (Figure 11). A closely spaced contour occurs in the lower part of study area implies high salinity zone. Increase in Ca (Figure 12) in the South-Central part where deeper rock-water nitration could be the source for Ca in groundwater (Hem, 1959). Thus, Na+Ca representing 61.37% of total cations denoting major supply from weathering of plagioclase feldspar (Pawar et al., 2008). On the other hand, Ca+Mg values account 67.92% of the total cations contributing from weathering of olivine and pyroxene (Pawar et al., 2008).
5.3 Distribution of Anions
Chloride is the major anion (range: 1.43 to 781.76 mg/l; average: 335.40 mg/l) in groundwater of the study area. Higher values of chloride are reported in the Central and Southern parts (Figure 13). Cl concentration increases from upstream and downstream region (Pawar et al., 2008). Higher concentrations of chloride (Figure 13) found i. e. 781.7, 756.7 and 737.51mg/l in BW-4, BW-3 and DW-9, respectively, may be due to the accumulation of industrial waste in downstream part (Hem, 1959).
Higher values of HCO3 are observed in South-Central part of study area while lesser values noted towards Northern side (Figure 14). More HCO3 in groundwater is contributed from silicate and carbonate chemical weathering (Pawar et al., 2008; Chidambaram et al., 2011). Sulphate concentrations are predominantly higher in downstream region while in upstream region shows very less recharge of groundwater (Figure 15). Anomalous higher values of Sulphate in Central part pointing towards higher fertilizers used for irrigated agriculture (Pawar et al., 2008).
The concentration of nitrate in groundwater shows range from 3.20 to 587.71mg/l and very high compare to the permissible standards by WHO. The source of NO3 in groundwater is solid and liquid waste from human and livestock activities including agricultural runoff (Pawar et al., 2008; Brindha et al., 2010; Brindha and Elango, 2014).
Total hardness is ranges from 204.94 to 1495.47mg/l (Figure 17). Hardness exceeds total Alkalinity, it expresses the presence of both Calcium hardness and noncarbonated hardness (Chow, 1964; Subbarao et al., 2005).
5.4 Quality of Groundwater for Drinking Purposes
Water used for drinking and household purposes should not have toxic chemicals and pathogens (Nag and Das, 2017). World Health Organization (WHO, 1997) has given the standard limits for quality of water used for drinking purpose. The groundwater data compared with the WHO (1997) standards pinpointing that, except Electrical Conductivity (EC), Calcium (Ca), Potassium (K), Magnesium (Mg), Chloride (Cl) and Nitrate (NO3) all elements are showing low to optimum values.
Table1. Physicochemical analysis
|
Parameters
|
Maximum
|
Minimum
|
Average
|
Variance
|
Standard Deviation
|
|
pH
|
8.19
|
7.12
|
7.65
|
0.07
|
0.26
|
|
EC
|
1921.00
|
32.00
|
781.80
|
460992.79
|
678.96
|
|
Hardness
|
1495.47
|
204.94
|
583.19
|
172159.79
|
326.97
|
|
Na
|
245.40
|
20.97
|
120.43
|
3916.96
|
62.58
|
|
K
|
87.57
|
3.84
|
14.57
|
489.66
|
22.12
|
|
Ca
|
270.90
|
45.10
|
105.08
|
3250.09
|
57.00
|
|
Mg
|
198.90
|
22.42
|
77.51
|
2096.97
|
45.79
|
|
CI
|
781.76
|
1.43
|
335.40
|
38415.9
|
195.99
|
|
HCO3
|
510.00
|
205.00
|
313.50
|
4922.67
|
70.16
|
|
SO4
|
331.09
|
20.05
|
100.01
|
8488.90
|
92.13
|
|
NO3
|
587.71
|
3.20
|
104.64
|
25198.21
|
158.73
|
|
All values given are in mg/l, except EC in μmhos/cm and pH on scale.
|