The channel morphology is determined by the interaction of fluid flow with erodible materials.
Torsa River is experiencing severe bank erosion and course changing, regularly.
BEHI and NBS ratings are calculated for analysis of laterally and vertically instability of Torsa River channel.
35 and 19 bank segments are classified in higher categories of BEHI and NBS ratings.
Most of the sample bank segments are laterally and vertically unstable and degrading.
BEHI and NBS cab be suitable bank erosion hazard predictive models for analysis of channel stability of Torsa River.
Abstract
Fluvial processes such as bank erosion plays an important role to change the channel stability of the Torsa River in the downstream region. The present study was focused on stream stability assessment of the Torsa River. The study area is situated between the downstream of the Jaldapara Reserve Forest and confluence of Kaljani River. Data of different parameters about 64 bank segments of the Torsa River were prepared using the field work techniques for assessing the stream bank conditions using lateral, vertical and overall reach stability models. The individual results of BEHI and NBS ratings show that out of 64 bank segments only 35 and 19 bank segments classified in higher categories. Overall lateral stability analysis shows that most of the sample bank segments are in an unstable condition. All bank segments are vertically unstable and degrading. Overall reach stability analysis shows widespread instability. BEHI and NBS results are almost similar for most of the bank segments and therefore, BEHI and NBS can be suitable bank erosion hazard predictive models in the study for channel stability analysis.
Keywords
Bank stability , Bank Erosion Hazard Index , Near Bank Stress , Bank Erosion Vulnerability Zone , Remote Sensing , GIS
1 . INTRODUCTION
River scientists define that the term ‘channel stability’ evokes a deluge of different interpretations, i.e., ‘equilibrium’, ‘regime channels’ and ‘quasi-equilibrium’ etc. (Rosgen, 2001b). Stream stability is defined as the ability of stream to keep up its geometry and bathymetry without either erosion or deposition. Stability of stream channel depends on the present climatic condition, sediment load transport and water flows produced in the watershed (Rosgen, 1996 and 2001b). Stream instability wants to be evaluated on the spatial and temporal level (Rosgen, 2001b). Stream instability is too critical to recognize natural erosion and mechanics of transport versus human influences (Rosgen, 2001b). Stream instability did not make due to the extensive sediment load and corresponding record of flood (Rosgen, 2001b). River channels that have been unscientifically managed and have less cohesive bank stratigraphy as well as have less riparian vegetation are subjected to accelerated stream bank erosion vulnerability and equivalent channel adjustments are leading to channel instability (Rosgen, 2001b).
Stream bank erosion is considered as the potential threat to the riparian areas, because the resources, properties and lives associated with the land on either side of the river is devoured (Maiti, 2016). Form and course of the river channel adjustment and floodplain development depends on the stream bank erosion, which also threatens man-made structures and destroys valuable agricultural land (Knighton, 1998). Bank erosion of stream is an intricate natural process working in a river valley. Stream bank erosion is one of the principal means of sediment supply to streams (Knighton, 1998). Two predominant processes are involved in stream bank erosion, i.e. (1) Hydraulic action, and (2) Mass failure (Knighton, 1998). Hence, some major processes include in stream bank erosion, i.e. surface erosion, entrainment of flowing water (detachment of particle by flowing water at the bank toe),liquefaction or collapse, positive pore water pressure, etc. (Rosgen, 2001a). The amount and periodicity of stream bank erosion and its spatial and temporal distribution largely depend on several factors, i.e. gradients of velocity, flow velocity, river bank shear stress, near bank strong down-welling and up-welling currents, circulation of back-eddy and other mechanics of flow (Rosgen, 2001a), flow variability, composition of bank material, geometry of river channel, climatic conditions, conditions of sub-surface, biological and anthropological factors (Knighton, 1998 and Maiti, 2016). Several scholars have been worked on the mechanics of stream banks and prediction of stream bank stability analysis (Thorne, 1982; Simon and Thorne, 1996; Darby and Thorne, 1997; Thorne, 1999; Simon, et al., 1999; Rosgen, 2001b; Starr, 2009; Ghosh et al., 2016; Bandyopadhay and De, 2017). The present study has sought to delineate the stream stability assessment and to assess the bank erosion vulnerability of the Torsa River (between the confluence of Mora Torsa and Kaljani rivers) through Rosgen’s BEHI and NBS model.
2 . STUDY AREA
The Torsa River is a lower catchment tributary of Brahmaputra River, covers the countries: Tibet, Bhutan, India and Bangladesh. Though Torsa River is not so long in its length, it has great impact on Duars and Tal Region of West Bengal. Torsa River regime is very attractive and dynamic nature. The basin is demarcated by 27°56ʹ34.127" to 25°54ʹ 18.107" N latitude and 88°56ʹ 6.07" to 89°46ʹ 47.74" E longitudes with a total area of 7486.31 km2 (Figure 1). The catchment area is a part of Eastern Himalaya (Tibet and Bhutan), the Duars (India) and Tal (India and Bangladesh) region and lies between the catchments of Jaldhaka of the West and the River Sankosh of the East. The river rises from the Chumbi valley at an elevation of 5151.12 m, known as Proma Chhu, in Tibet and Amo Chu in Bhutan (Dey and Mandal, 2018a). The North-South elongated basin having 295 km length of which 99 km lies in West Bengal, India. The highest elevation (5151.12m) is observed in the Northern part near the source of the river and lowest elevation (22m) is on the Southern side near its confluence at Nageshwari in Bangladesh (Dey and Mandal, 2018a). Most part of the study area is characterized by medium to fine sands, loam, clay and alluvium soils (Figure 1). The region is interspersed with several swamps, oxbow lake, natural levees and Paleochannels (Dey and Mandal, 2018b). The area of the present study is located between the downstream of Jaldapara reserve forest (26°30ʹ 0.09"N, 89°19ʹ 20.3"E) and confluence of Kaljani river (26°15ʹ 0.11´´N, 89°37ʹ 01.19"E) (Figure 1). The study area includes three Blocks (Mathabhanga-II, Cooch Behar-I, Cooch Behar-II, Tufanganj I and one urban center i.e. Cooch Behar municipality which is suffering from flood and bank erosion severely (Dey and Mandal, 2018b).
Figure 1. Study area
3 . MATERIALS AND METHODS
3.1 Data
The methodology is concerned with the assessment of stream channel stability of the Torsa River valley. Topographic maps (SOI) at scale 1:50,000 and Geological Quadrangle maps (GSI) at scale 1:250,000 were transferred into digital format and rectified together with satellite images using Universal Transverse Mercator (UTM) Projection and World Geodetic System (WGS) 84 datum with North 45 zone in Arc GIS (10.3.1) (Table 1). The satellite data: OLI_TRIS and ASTER DEM for the year of 2011 and 2018 were used in the study (Table 2 and 3).
Table 1. Conventional data
Data
Source
Index / map no.
Spatial coverage
Publication year
Scale
Geological Quadrangle Map
Geological Survey of India
78F
Cooch Behar, Alipurduar
2002
1: 250000
Topographical Maps
Survey of India
78 F/7, 78F/11
Jalpaiguri and Koch, Bihar Districts
1977
1:50000
Table 2. Satellite data
Satellite
Sensor
Path
Row
Acquisition Date
No. of Bands
Spatial Resolution(in m)
LANDSAT-8
OLI_TRIS
138
042
28/02/2018
11
30
Table 3. ASTER DEM data
Entity Id
Agency
Sensor
Resolution
Ellipsoid
Acquisition Date
Version
ASTGDEMV2_0N25E089
NASA/METI
ASTER
1 ARC-SECOND
WGS84
17/10/2011
2.0
ASTGDEMV2_0N26E089
NASA/METI
ASTER
1 ARC-SECOND
WGS84
17/10/2011
2.0
ASTGDEMV2_0N27E088
NASA/METI
ASTER
1 ARC-SECOND
WGS84
17/10/2011
2.0
ASTGDEMV2_0N27E089
NASA/METI
ASTER
1 ARC-SECOND
WGS84
17/10/2011
2.0
3.2 Stream Stability Analysis
Thirty-two cross sections were selected to derive data from 64 sites using field survey for determining the channel stability of the Torsa River with the help of various measuring instruments: GPS, leveling staff, Eco-sounder, digital water current meter, clinometer and dumpy level (Figure 2). Profiles of the stream banks were overlaid to determine the toe-pin area changes due to the processes of erosion. The vulnerability map of the Torsa River through image processing was performed in ArcGIS Software version 10.3.1. Various data have been generated from the field for assessment of stream stability viz. vertical stability, lateral stability, and overall reach stability (Starr, 2009).
Figure 2. Cross sections across the Torsa River
3.2.1 Lateral Stability
Three parameters have been used to determine lateral stability of stream, i.e., Width-Depth ratio, Bank Erosion Hazard Index (BEHI) and Near Bank Stress (NBS). Overall Lateral Stability has been derived on the basis of the individual assessment of parameters (Starr, 2009).
A. Bank Erosion Hazard Index (BEHI)
The bank erosion hazard index (BEHI) assessment technique is used to predict the vulnerability of River bank erosion along transect of a river based on a combination of numerous physical parameters (Rosgen, 2001a and 2001b). Assessment of BEHI parameters is assigned a geometric value which corresponds to an overall bank erodibility (very low, low, moderate, high, very high and extreme) for the river bank (Rosgen, 2001a). BEHI ratings were assigned considering the following seven parameters:
1. Ratio of Bank Height and Bank-full Height
This ratio has been measured using bank height and bank-full height. Bank height has been measured using measuring tape from the bank toe to the top of the bank in lean season. On the other hand, the bank-full height has been measured from the bank toe to water level in the peak monsoon season. When the ratio is more than 2.8, the risk of bank erosion is extreme and vice versa (Rosgen, 2006; Starr, 2009).
2. Ratio of Riparian Root Depth to Stream Bank Height
This ratio was derived considering the average root depth of plants and the height of bank to estimate the adherence of bank material by the riparian vegetation. Very high ratio is resulting with very low BEHI scores (Rosgen, 2006; Starr, 2009).
3. Root Density
Root density is expressed in percentage. It is measurement of visual assessment, the proportion of river bank segments covered by plant root. Very high value of weighted root density can be resulted in very low BEHI scores (Rosgen, 2006; Starr, 2009).
4. Bank Angle
The bank angle has been measured with the help of clinometer from the base of the bank at the waterline during base flow to the bank top. Steep bank angle was predicted to have an extreme vulnerability of bank failure due to the shear stresses and the gravitational force. Banks become more than 90 degree angle due to undercut.
5. Surface Protection
Surface protection is defined as the proportion of stream bank which are covered and protected by plant roots, woody debris, downed logs, branches of roots, revetment, bed rocks, etc. This protection controls the erosional forces. For example, utmost surface protections on the river banks indicate the less bank erosion vulnerability. On the other hand, easily erodible material such as sand, silt, etc. increases the bank erosion vulnerability as well as raising the BEHI score.
6. Bank Material Adjustment
The composition of bank material was noted to account for erosion variables that take place because of differential erosion vulnerabilities which depend on size of sediment. Bank material adjustment points are added, subtracted or no adjustment to the BEHI score depending on composition of bank materials.
7. Stratification Adjustment
Stratification adjustments points are also added to the BEHI score depending on more than one bank strata.
B. Near Bank Stress (NBS)
Near bank stress (Rosgen, 2006) was also used to determine the lateral stability of the stream. Measured values of near bank stress were converted to a risk rating system as very low to extreme rating (Rosgen, 2006). Near bank stress was determined on the basis of ratio of near bank maximum depth to bank-full mean depth (Rosgen, 2006).
C. Width Depth Ratio
Width depth ratio defined as the ratio of bank-full channel width to the bank-full mean depth (Rosgen, 1994 and 1996). Width depth ratio stability ratings are based on Rosgen’s stream type (Rosgen, 1996 and Starr, 2009).
3.2.2 Vertical Stability
Five parameters were used to determine vertical stability of the stream, i.e., Incision Ratio, Head Cut, Bed Control, Depositional and Bed Features (Starr, 2009).
1. Incision Ratio
Incision ratio is measured as the ratio of the bank height to the (from base to top of the bank) bank-full height of the cross section. The rating of incision ratio was assigned based on Rosgen, 2001b.
2. Head Cut
Head cut processes generate due to vertical as well as nearly vertical retreating of the channel bed toward upstream. Its location can control the vertical stability of the streams (Starr, 2009).
3. Bed Control
There are two types of bed control such as natural and man-made. Stream stability controls if the bed control exits within the assessment reach.
4. Depositional Features
The varieties of depositional features were used to determine the aggradation of stream bed (Rosgen, 2001b and 2006). Vertical degradation occurs due to lack of depositional features as well as in the presence of bed features (Starr, 2009).
5. Bed Features
Bed features (pools, riffles, etc.) are resultant determinants of the stream bed stability. In the stream reach, a pool area is an indicator of aggradation due to accretion process and scour is a potential indicator of stream bed degradation (Starr, 2009).
3.2.3 Overall Reach Stability
Four parameters have been applied to determine the overall reach stability of stream, i.e., stream sensitivity, supply of potential sediment, potential of recovery, and trends of evolution stability (Starr, 2009). Stream sensitivity, supply of potential sediment and potential of recovery are based on Rosgen’s stream type. These three parameters were used to determine the overall reach stability (Starr, 2009). Ratings (Rosgen, 1996) of these three parameters were based on their stability conditions and stream type.
3.3 Statistical Analysis
Statistics indicate the correlation between the variables such as BEHI and NBS ratings. Both bank of the Torsa river reach was correlated by statistics including Pearson correlation of coefficients.
4 . RESULTS AND DISCUSSIONS
4.1 Lateral Stability Assessment
4.1.1 BEHI Assessment
From the value of bank height and bank-full height ratio, it is clearly found that the ratio is moderate to extreme in most of bank segments due to rise of the water level in the study reach during pick period of monsoon season. Moreover, very low ratio is found only in 12 bank segments (Figure 3A). In case of ratio of root depth and bank height, it was found that maximum segments (44 sample segments) are experienced with less than 0.05. Only two bank segments along the left bank of the Torsa river at the Putimari Baksibas village and Cooch Behar municipality ward no. 15 attributing the ratio between 0.9-1 (Figure 3B).
Figure 3. Parameters of BEHI
In case of root density, 44 bank segments cover below 5%. Maximum (80 - 100%) root density is found in Cooch Behar Municipality ward no. 16 and Putimari Baksibas village due to presence of dense protected forest (Figure 3C). Moreover, 13 bank segments have bank angle between 0º and 20º as well as maximum and minimum bank segments having bank angle between 21º and 60º and 81º and 90º, respectively. Only 11 bank segments, the bank angle ranges from 61º to 80º (Figure 3D). Most of the bank areas (37 sample bank segments) are covered without any kind of surface protection. 24 bank segments are registered with 80 to 100% surface protection. Most of the bank segments are protected with concrete embankment and boulder netting (Figure 3E). In the study, both sides of the bank are composed of alluvial sand, silt and clay materials. It has also been noticed that the root density and surface protection are high but bank angle is low in most of the cases.
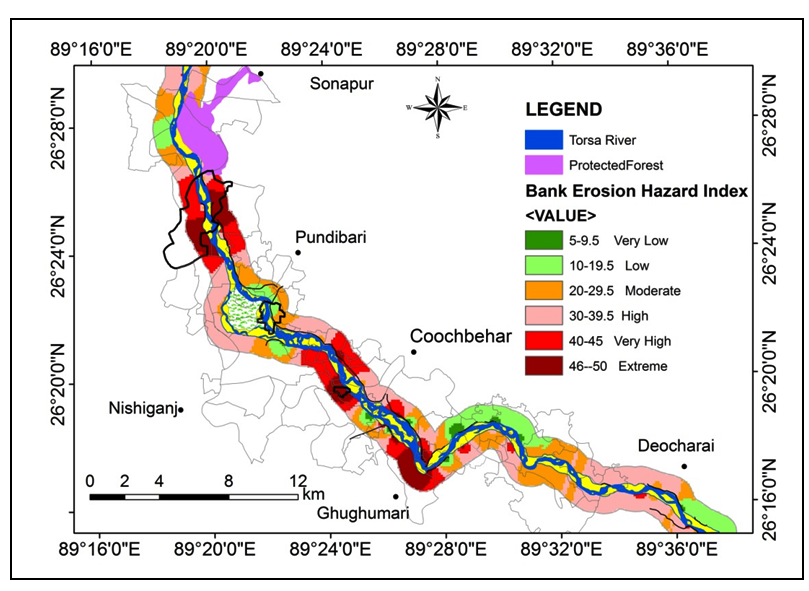
Based on the ratings of above variables and considered BEHI scores for every bank segment, a Bank Erosion Hazard Zone Map was prepared (Figure 4). The result shows that Basdaha Natibari, Salmara Tritiakhanda, Sajherpar Ghoramara, Damodarpur, Karisal and Ghughumari villages are extremely vulnerable to bank erosion hazard due to toe erosion caused due to helical flow. On the other hand, near Patla khawa protected forest and in most of the left bank of the Torsa River vulnerability is low to very low due to presence of riparian vegetation and engineering construction such as embankments, spur, etc. In left bank, due to less surface protections and lack of root density the possibilities of bank erosion are very high to extreme.
Figure 4. Bank erosion hazard zones
4.1.2 NBS Assessment
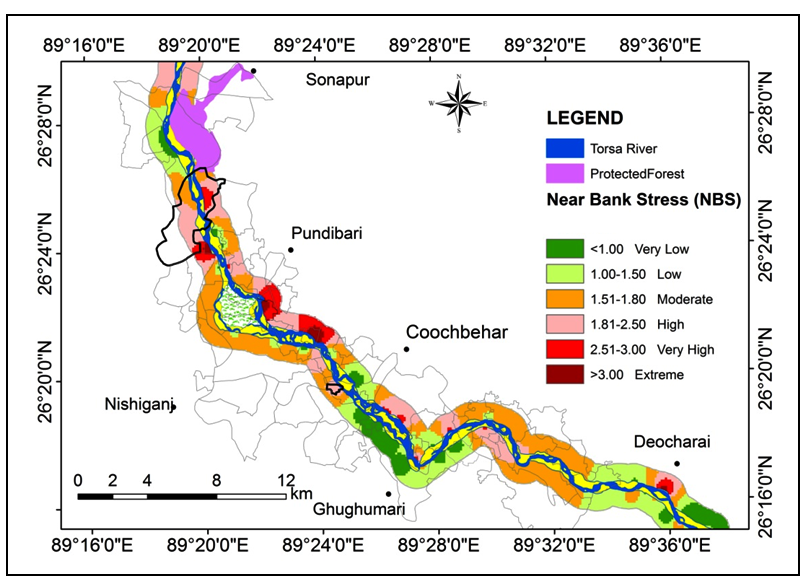
River bank erosion is accelerated due to changes of Near Bank Stress (NBS) ratings (Rosgen, 2001a; Ghosh et al., 2016). Based on the field generated data, final NBS rating and rating zone have been determined to assist bank erosion vulnerability (Table 4; Figure 5). Most of the bank segments having high (19 segments) ratio of near bank maximum depth to the bank-full mean depth. On the other hand, 18 bank segments having the ratio of the near bank maximum depth of the bank-full mean depth is low (Table 4). Results show that Basdaha Natibari, Salmara Tritiakhanda, Haripur, Madhupur, Jatrapur and Deocharai villages are very high to extremely vulnerable to bank erosion (Figure 5). The rest of the bank segment is very low to moderate vulnerability to erosion due to presence of riparian vegetation and anthropogenic constructions; such constructions are controlling the bank erosion (Figure 5).
Figure 5. Near bank stress rating zones
Table 4. Results of near bank stress along the Torsa River
Mouza Name/ Ward Nos. (Segments)
Bank Side
Ratio of Near Bank Max Depth and Mean Depth
Near Bank Stress
Mouza Name/ Ward Nos. (Segments)
Bank Side
Ratio of Near Bank Max Depth and Mean Depth
Near Bank Stress
Downstream Jaldapara (S1)
Left
1.79
Moderate
Takagachh (S17)
Left
1.54
Moderate
Right
2.02
High
Right
1.09
Low
Chhat Singimari (S2)
Left
1.83
High
18 Ward
(S18)
Left
2.15
High
Right
2
High
Right
1.24
Low
Putimari Baksibas
(S3)
Left
0.6
Very Low
16 Ward
(S19)
Left
2.65
Very high
Right
1.45
Low
Right
0.59
Very Low
Basdaha Natibari 1
(S4)
Left
1.82
High
16 Ward
(S20)
Left
1.7
Moderate
Right
1.36
Low
Right
1.7
Moderate
Basdaha Natibari 2
(S5)
Left
2.55
Very High
15 Ward (S21)
Left
2.37
High
Right
1.6
Moderate
Right
0.25
Very Low
Basdaha Natibari 3
(S6)
Left
2.35
High
Gudam Maharaniganj
(S22)
Left
2.08
High
Right
1.53
Moderate
Right
1
Low
Sajherpar Ghoramara 1
(S7)
Left
1.78
Moderate
Gudam Maharaniganj
(S23)
Left
2.25
High
Right
1.92
High
Right
0.95
Very Low
Sajherpar Ghoramara 2
(S8)
Left
0.63
Very Low
Harinchaowra
(S24)
Left
1.32
Low
Right
2.05
High
Right
1.16
Low
Sajherpar Ghoramara 3
(S9)
Left
1.22
Low
Guriahati
(S25)
Left
2.16
High
Right
3.74
Extreme
Right
1.06
Low
Salmara Tritiokhanda
(S10)
Left
2.5
High
Jhinaidanga
(S26)
Left
1.32
Low
Right
0.83
Very Low
Right
2.21
High
Hokakura (S11)
Left
1.7
Moderate
Dauaguri
(S27)
Left
1.71
Moderate
Right
1.14
Low
Right
2
High
Haripur (S12)
Left
3.09
Extreme
Balarampur 1
(S28)
Left
1.25
Low
Right
1.55
Moderate
Right
1.76
Moderate
Kawalipara
(S13)
Left
1.9
High
Balarampur (S29)
Left
1.62
Moderate
Right
1.43
Low
Right
1.28
Low
Kamarangaguri
(S14)
Left
3.8
Extreme
Balarampur (S30)
Left
3
Very high
Right
1.09
Low
Right
1.5
Low
Jatrapur (S15)
Left
1.18
Low
Balarampur (S31)
Left
1.77
Moderate
Right
2.06
High
Right
0.63
Very Low
Damodarpur
(S16)
Left
1.02
Low
Balarampur (S32)
Left
0.75
Very Low
Right
2.04
High
Right
1.87
High
4.1.3 Relation between BEHI and NBS Ratings
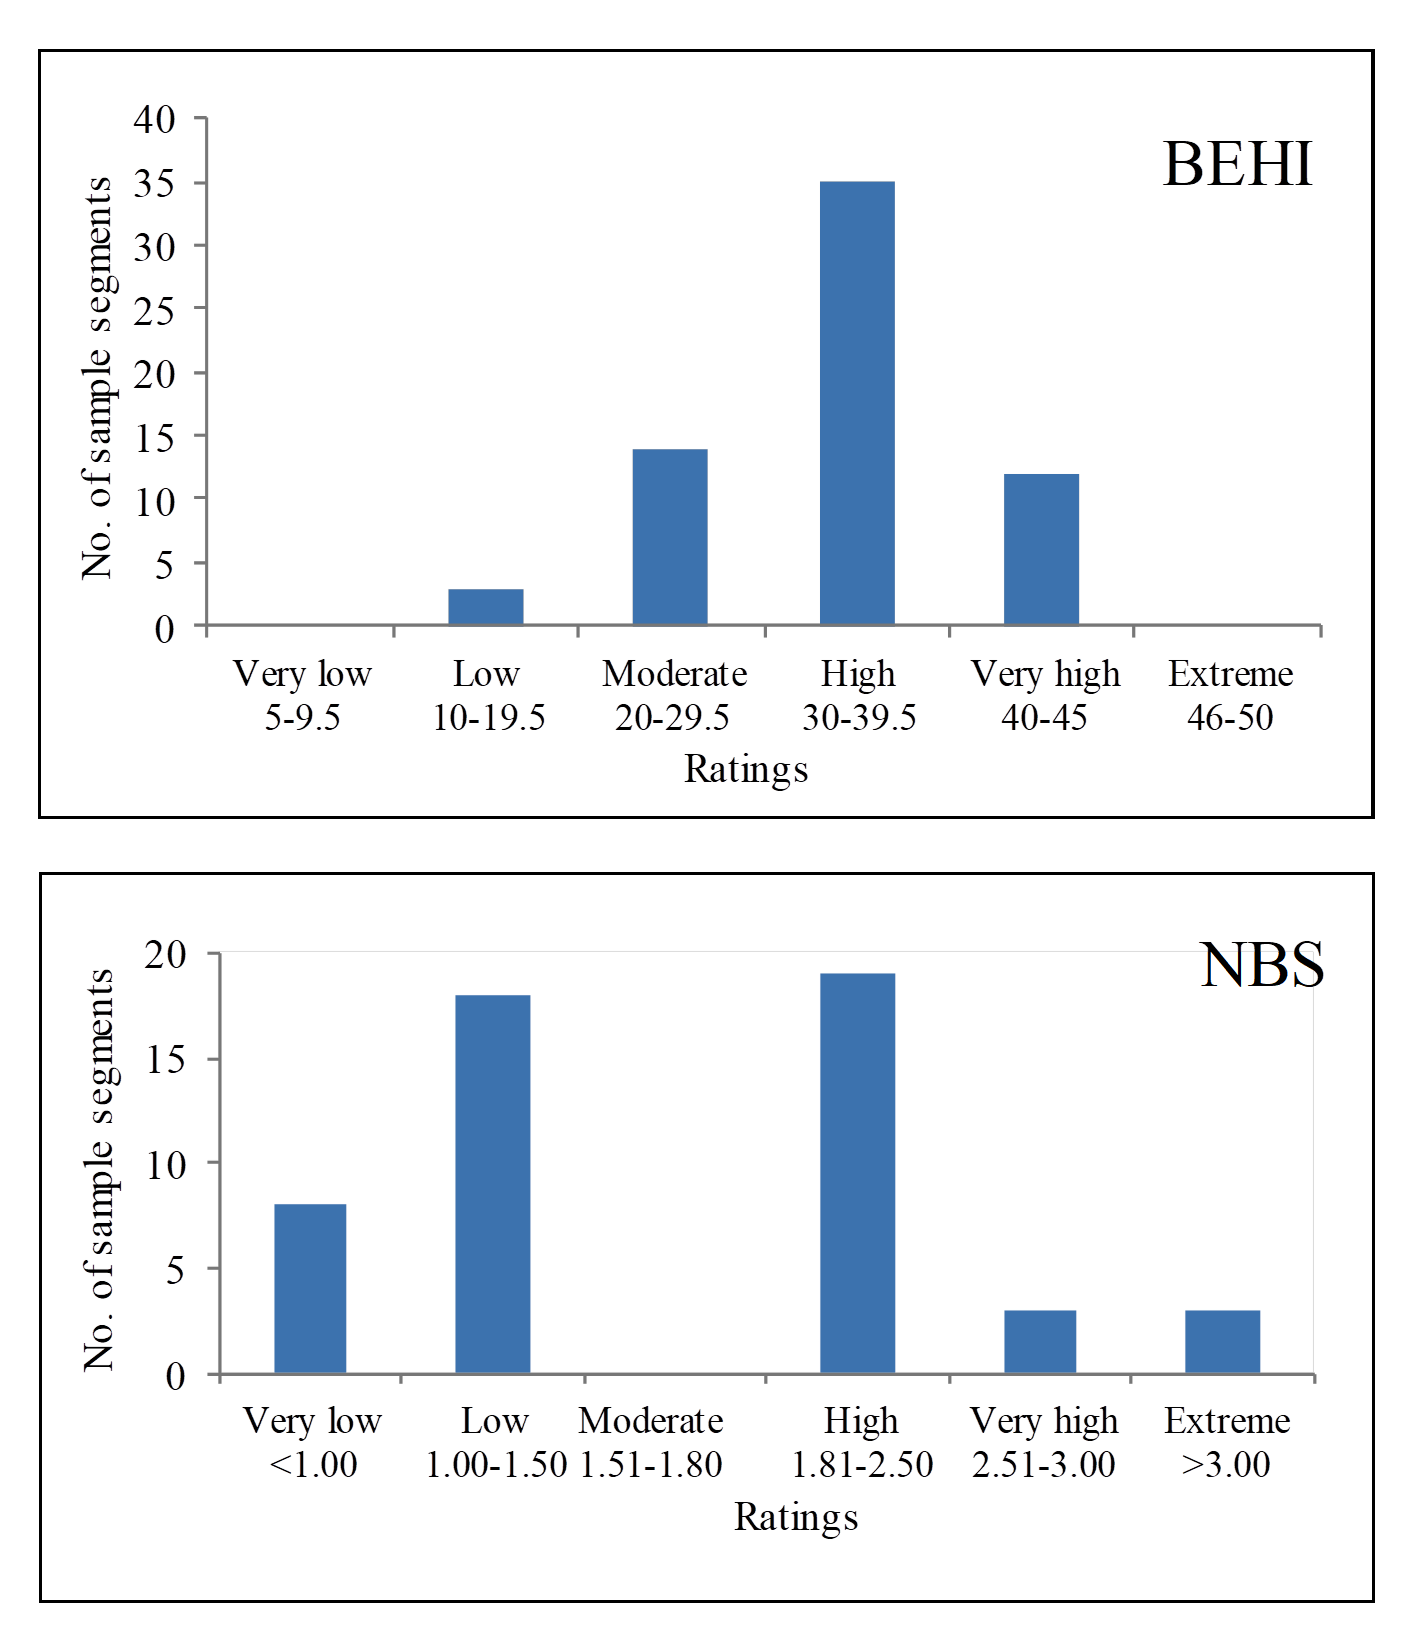
The individual BEHI and NBS ratings have been plotted in Figure 6 from where 35 bank segments indicate high BEHI ratings, 12 segments experience very high BEHI ratings, 14 bank segments belong to moderate BEHI ratings and 3 segments possesses low BEHI ratings (Figure 6; Table 5). On the other hand, out of 64 bank segments only 19 segments possess high category NBS rating, 18 segments indicates the low NBS rating, 8 segments indicate a very low NBS category, 3 segments possess very high category NBS ratings and 3 segments possess extreme category NBS ratings (Figure 6; Table 5).
Figure 6. BEHI and NBS distributions
Table 5. Overall lateral stability
Mouza Name/ Ward nos.
(Segments)
Width Depth Ratio
Selected Point
Deposition Pattern
Selected Point
Bank Side
BEHI Rating
NBS Rating
Dominant BEHI/
NBS
Lateral Stability Category Point
Overall Lateral Stability Category
Downstream
Jaldapara (S1)
361.92
8
B7
4
Left
Low
Moderate
2
14
Unstable
Right
Very High
High
8
20
Unstable
Chhat Singimari
(S2)
285.26
8
B7
4
Left
High
High
8
20
Unstable
Right
High
High
8
20
Unstable
Putimari Baksibas
(S3)
277.58
8
B7
4
Left
Low
Very Low
2
14
Unstable
Right
High
Low
6
18
Unstable
Basdaha Natibari 1 (S4)
416.2
8
B7
4
Left
High
High
8
20
Unstable
Right
High
Low
4
16
Unstable
Basdaha Natibari 2(S5)
532.24
8
B7
4
Left
High
Very high
8
20
Unstable
Right
High
Moderate
6
18
Unstable
Basdaha Natibari 3 (S6)
177.26
8
B7
4
Left
Very High
High
8
20
Unstable
Right
High
Moderate
6
18
Unstable
Sajherpar Ghoramara 1
(S7)
548.72
8
B7
4
Left
Very High
Moderate
8
20
Unstable
Right
High
High
8
20
Unstable
Sajherpar Ghoramara 2
(S8)
404.74
8
B7
4
Left
High
Very Low
6
18
Unstable
Right
Very High
High
8
20
Unstable
Sajherpar
Ghoramara 3
(S9)
175.76
8
B7
4
Left
High
Low
6
18
Unstable
Right
Very High
Extreme
8
20
Unstable
Salmara Tritiokhanda
(S10)
189.41
8
B7
4
Left
Moderate
High
4
16
Unstable
Right
High
Very Low
6
18
Unstable
Hokakura
(S11)
189.93
8
B2
1
Left
Moderate
Moderate
4
13
Unstable
Right
High
Low
6
15
Unstable
Haripur (S12)
717.38
8
B6
4
Left
Moderate
Extreme
6
18
Unstable
Right
High
Moderate
6
18
Unstable
Kawalipara
(S13)
357.48
8
B5
4
Left
High
High
8
20
Unstable
Right
Moderate
Low
4
16
Unstable
Kamarangaguri
(S14)
183.91
8
B7
4
Left
High
Extreme
8
20
Unstable
Right
High
Low
6
18
Unstable
Jatrapur (S15)
159.82
8
B7
4
Left
High
Low
4
16
Unstable
Right
High
High
8
20
Unstable
Damodarpur
(S16)
427.27
8
B2
1
Left
High
Low
4
13
Unstable
Right
Very High
High
8
17
Unstable
Takagachh (S17)
437.73
8
B5
4
Left
High
Moderate
6
18
Unstable
Right
Moderate
Low
4
16
Unstable
Ward-18
(S18)
195.05
8
B5,B7
4
Left
High
High
8
20
Unstable
Right
High
Low
4
16
Unstable
Ward-16
(S19)
158.41
8
B5,B7
4
Left
High
Very high
8
20
Unstable
Right
Low
Very Low
2
14
Unstable
Ward-16
(S20)
576.39
8
B5,B7
4
Left
Very High
Moderate
8
20
Unstable
Right
Moderate
Moderate
4
16
Unstable
Ward-15 (S21)
268.83
8
B5,B7
4
Left
Moderate
High
4
16
Unstable
Right
Very High
Very Low
6
18
Unstable
Gudam Maharaniganj
(S22)
157.29
8
B4
2
Left
Very High
High
8
18
Unstable
Right
Very High
Low
6
16
Unstable
Gudam Maharaniganj (S23)
181.49
8
B1
1
Left
Very High
High
8
17
Unstable
Right
Very High
Very Low
6
15
Unstable
Harinchaowra
(S24)
505.59
8
B7
4
Left
High
Low
4
16
Unstable
Right
Moderate
Low
4
16
Unstable
Guriahati
(S25)
221.07
8
B7
4
Left
Moderate
High
4
16
Unstable
Right
High
Low
4
16
Unstable
Jhinaidanga
(S26)
243.22
8
B7
4
Left
Moderate
Low
4
16
Unstable
Right
High
High
8
20
Unstable
Dauaguri (S27)
347.36
8
B7
4
Left
Moderate
Moderate
4
16
Unstable
Right
High
High
8
20
Unstable
Balarampur 1
(S28)
378.57
8
B7
4
Left
High
Low
4
16
Unstable
Right
High
Moderate
6
18
Unstable
Balarampur (S29)
199.69
8
B7
4
Left
Moderate
Moderate
4
16
Unstable
Right
High
Low
4
16
Unstable
Balarampur (S30)
601.7
8
B7
4
Left
High
Very high
8
20
Unstable
Right
High
Low
6
18
Unstable
Balarampur (S31)
124.61
8
B7
4
Left
Moderate
Moderate
4
16
Unstable
Right
High
Very Low
6
18
Unstable
Balarampur (S32)
128.43
8
B7
4
Left
Moderate
Very Low
2
14
Unstable
Right
High
High
8
20
Unstable
Correlation between BEHI and NBS ratings along the left and right bank show that the positive correlation, 0.220 and 0.245, respectively. But most of the sample segments as per BEHI ratings are more vulnerable (47 sample segments) to bank erosion than the NBS (25 sample segments) ratings (Figure 6). Out of 64 bank sample segments only 14 segments are perfectly matched with each other. 24 sample segments which are not matched with each other (Table 5). Result of overall lateral stability category shows that the most of the sample bank segments are in unstable condition (Table 5). Torsa River is stabilized along the left bank side due to the presence of dense protected forest and construction of embankment.
4.1.4 Width-Depth Ratio Assessment
Width-depth ratio of all sample bank segments has been found more than hundred which indicate that the stream bank is highly unstable (Table 5). The overall lateral stability category has been show to an unstable bank condition which is based on lateral stability assessment (Table 5).
4.2 Vertical Stability Assessment
It is clearly identified that incision ratio is very high in most of those 64 sample bank segments due to the water level rises during monsoon season (Rosgen, 2001). The highest incision ratio (8.4) is found along the right bank near the Ghughumari railway bridge and along the right bank highest incision ratio (8.21) is found in Karishal village. In case of incision ratio, a very high incision is found at 52 bank segments and no incision is found at 12 bank segments. Most of the bank segments are highly unstable due to very high incision (Table 6). The field observation show found that only 6 bank segments reveal the presence of head cut (Table 6) at the confluences of Kaljani, Mora Torsa and Bura Torsa river which is caused as a result of helical flow and continuously drilling of stream bed. It was found that only 10 bank segments having bed control due to construction of check dams and bridges. Most of the segments are being noticed no presence of bed control (Table 6). Based on Rosgen’s (1996) stream depositional pattern (Rosgen, 2001 and 2006) it was found that 6 bank segments attributed with stable, 2 segments with moderately unstable and rest of bank segments with highly unstable bed condition (Table 6). It is found that 16 bank segments having pools and 48 sample bank segments having riffles features. In such cases a pool area is an indicator of stream bed aggradation due to accretion process and the scour is a potential indicator of stream bed degradation (Starr, 2009). Based on the variables and results, the study depicted that of 64 bank segments are vertically unstable and degrading.
Table 6. Vertical stability
Sites
Bank sides
Incision Ratio
Rating
Presence of Head cut
Presence of Bed control
Description
Depositional pattern
Bed Condition
Bed Features
Vertical Stability
Downstream Jaldapara (S1)
L
4.7
Very high incision
No
No
B7
Highly unstable
Riffles
Degrading
R
8.11
Very high incision
No
No
B7
Highly unstable
Riffles
Degrading
Chhat Singimari
(S2)
L
4.1
Very high incision
No
No
B7
Highly unstable
Riffles
Degrading
R
4.1
Very high incision
No
No
B7
Highly unstable
Riffles
Degrading
Putimari Baksibas
(S3)
L
4.25
Very high incision
No
No
B7
Highly unstable
Riffles
Degrading
R
4.8
Very high incision
No
No
B7
Highly unstable
Riffles
Degrading
Basdaha Natibari 1
(S 4)
L
6.23
Very high incision
Yes
No
B7
Highly unstable
Riffles
Degrading
R
6.21
Very high incision
Yes
No
B7
Highly unstable
Riffles
Degrading
Basdaha Natibari 2
(S5)
L
4.95
Very high incision
Yes
No
B7
Highly unstable
Riffles
Degrading
R
6.7
Very high incision
Yes
No
B7
Highly unstable
Riffles
Degrading
Basdaha Natibari 3
(S6)
L
6
Very high incision
No
Yes
Three Bridges
B7
Highly unstable
Pools
Degrading
R
7
Very high incision
No
Yes
Three Bridges
B7
Highly unstable
Pools
Degrading
Sajherpar
Ghoramara 1 (S7)
L
6
Very high incision
No
No
B7
Highly unstable
Riffles
Degrading
R
6
Very high incision
No
No
B7
Highly unstable
Riffles
Degrading
Sajherpar
Ghoramara 2 (S8)
L
6.23
Very high incision
No
No
B7
Highly unstable
Riffles
Degrading
R
4.65
Very high incision
No
No
B7
Highly unstable
Riffles
Degrading
Sajherpar
Ghoramara 3 (S9)
L
10
Very high incision
No
No
B7
Highly unstable
Pools
Degrading
R
6.21
Very high incision
No
No
B7
Highly unstable
Pools
Degrading
Salmara Tritiokhanda
(S10)
L
1
no incision
No
No
B7
Highly unstable
Riffles
Degrading
R
8.13
Very high incision
No
No
B7
Highly unstable
Riffles
Degrading
Hokakura
(S11)
L
1
no incision
No
No
B2
Stable
Riffles
Degrading
R
1
no incision
No
No
B2
Stable
Riffles
Degrading
Haripur
(S12)
L
1
no incision
No
No
B6
Highly unstable
pools
Degrading
R
1
No incision
No
No
B6
Highly unstable
Pools
Degrading
Kawalipara
(S13)
L
1
no incision
No
No
B7
Highly unstable
Pools
Degrading
R
1
no incision
No
No
B7
Highly unstable
Pools
Degrading
Kamarangaguri (S14)
L
1
no incision
No
Yes
Bridge
B5
Highly unstable
Riffles
Degrading
R
4.65
Very high incision
No
Yes
Bridge
B5
Highly unstable
Riffles
Degrading
Jatrapur (S15)
L
1
no incision
No
No
B7
Highly unstable
Riffles
Degrading
R
1
no incision
No
No
B7
Highly unstable
Riffles
Degrading
Damodarpur
(S16)
L
7.5
Very high incision
No
Yes
Check Dam
B2
Stable
Riffles
Degrading
R
7.09
Very high incision
No
No
B2
Stable
Riffles
Degrading
Takagachh (S17)
L
8.21
Very high incision
No
Yes
Check Dam
B5
Highly unstable
Riffles
Degrading
R
10
Very high incision
No
No
B5
Highly unstable
Riffles
Degrading
Ward -18
(S18)
L
5.4
Very high incision
No
No
B5,B7
Highly unstable
Riffles
Degrading
R
7.5
Very high incision
No
No
B5,B7
Highly unstable
Riffles
Degrading
Ward-16
(S19)
L
1
no incision
No
No
B5,B7
Highly unstable
Pools
Degrading
R
6.23
Very high incision
No
No
B5,B7
Highly unstable
Pools
Degrading
Ward -16
(S20)
L
5
Very high incision
No
No
B5,B7
Highly unstable
Riffles
Degrading
R
5.4
Very high incision
No
No
B5,B7
Highly unstable
Riffles
Degrading
Ward- 15 (S21)
L
7.5
Very high incision
No
Yes
Check Dam
B5,B7
Highly unstable
Riffles
Degrading
R
10
Very high incision
No
No
B5,B7
Highly unstable
Riffles
Degrading
Gudam Maharaniganj
(S22)
L
7.5
Very high incision
No
Yes
Check Dam
B1
Stable
Riffles
Degrading
R
8.4
Very high incision
No
No
B1
Stable
Riffles
Degrading
Gudam Maharaniganj
(S23)
L
7.09
Very high incision
No
No
B4
Moderately unstable
Riffles
Degrading
R
5.4
Very high incision
No
No
B4
Moderately unstable
Riffles
Degrading
Harinchaowra (S24)
L
5.4
Very high incision
No
No
B7
Highly unstable
Pools
Degrading
R
4.65
Very high incision
No
No
B7
Highly unstable
Pools
Degrading
Guriahati
(S25)
L
5.4
Very high incision
No
No
B7
Highly unstable
Pools
Degrading
R
5.4
Very high incision
No
No
B7
Highly unstable
Pools
Degrading
Jhinaidanga
(S26)
L
6.08
Very high incision
No
Yes
Check Dam
B7
Highly unstable
Riffles
Degrading
R
4.25
Very high incision
No
No
B7
Highly unstable
Riffles
Degrading
Dauaguri
(S27)
L
4.25
Very high incision
No
No
B7
Highly unstable
Riffles
Degrading
R
4.25
Very high incision
No
No
B7
Highly unstable
Riffles
Degrading
Balarampur 1
(S28)
L
1
no incision
Yes
No
B7
Highly unstable
Riffles
Degrading
R
6.23
Very high incision
Yes
No
B7
Highly unstable
Riffles
Degrading
Balarampur (S29)
L
6.23
Very high incision
No
No
B7
Highly unstable
Pools
Degrading
R
6.23
Very high incision
No
No
B7
Highly unstable
Pools
Degrading
Balarampur (S30)
L
6.23
Very high incision
No
No
B7
Highly unstable
Riffles
Degrading
R
10
Very high incision
No
No
B7
Highly unstable
Riffles
Degrading
Balarampur (S31)
L
10
Very high incision
No
No
B7
Highly unstable
Riffles
Degrading
R
10
Very high incision
No
No
B7
Highly unstable
Riffles
Degrading
Balarampur (S32)
L
4.65
Very high incision
No
No
B7
Highly unstable
Pools
Degrading
R
7.13
Very high incision
No
No
B7
Highly unstable
Pools
Degrading
4.3 Overall Reach Stability Assessment
The rating of overall lateral stability has widespread instability. Ratings of overall vertical stability and evolution stability have aggrading or degrading subsequently the stream has widespread instability (Starr, 2009). Extreme stream sensitivity is found in Salmara Tritiokhanda village (Table 7). Only 14 cross section segment having very high stream sensitivity and 17 cross section segments are having moderately stream sensitivity (Table 7). 17 cross section segments having a moderate potential sediment supply, 6 cross section segments having a high potential sediment supply and 9 cross section segments having very high potential sediment supply. Poor recovery potential is found at 6 cross section segment, 1 cross section segment having a very poor recovery potential, 5 cross section segments having fair recovery potential, 3 cross section segments having good recovery potential and 17 cross section segments having excellent recovery potential (Table 7). Based on Rosgen’s (2001b) various stream types evolution scenarios, it was found that 13 cross section segments attributed to recovery evolution, 5 cross section segments with stable evolution, 9 cross section segments with degrading evolution and 5 cross section segments with aggrading evolution (Table 7). Based on the variables (Rosgen, 1996; Starr, 2009) the study depicted that the overall reach stability of 32 cross section segments is widespread instability (Table 7).
Table 7. Overall reach stability
Cross Section Segment
Stream Type
Stream Sensitivity
Potential Sediment Supply
Recovery Potential
Evolution Stability
Overall Reach Stability
Downstream Jaldapara (S1)
B4
Moderate
Moderate
Excellent
Recovery
Widespread Instability
Chhat Singimari (S2)
F5
Very High
Very High
Poor
Degrading
Widespread Instability
Putimari Baksibas (S3)
B5
Moderate
Moderate
Excellent
Degrading
Widespread Instability
Basdaha Natibari 1 (S4)
B5
Moderate
Moderate
Excellent
Recovery
Widespread Instability
Basdaha Natibari 2 (S5)
F5
Very High
Very High
Poor
Degrading
Widespread Instability
Basdaha Natibari 3 (S6)
B5
Moderate
Moderate
Excellent
Recovery
Widespread Instability
Sajherpar Ghoramara 1 (S7)
B5
Moderate
Moderate
Excellent
Aggrading
Widespread Instability
Sajherpar Ghoramara 2 (S8)
B5
Moderate
Moderate
Excellent
Aggrading
Widespread Instability
Sajherpar Ghoramara 3 (S9)
B5
Moderate
Moderate
Excellent
Recovery
Widespread Instability
Salmara Tritiokhanda (S10)
G5
Extreme
Very High
Very Poor
Degrading
Widespread Instability
Hokakura (S11)
D5
Very High
Very High
Poor
Aggrading
Widespread Instability
Haripur (S12)
B5
Moderate
Moderate
Excellent
Recovery
Widespread Instability
Kawalipara (S13)
B5
Moderate
Moderate
Excellent
Recovery
Widespread Instability
Kamarangaguri (S14)
C5
Very High
Very High
Fair
Stable
Widespread Instability
Jatrapur (S15)
B5
Moderate
Moderate
Excellent
Recovery
Widespread Instability
Damodarpur (S16)
B5
Moderate
Moderate
Excellent
Recovery
Widespread Instability
Takagachh (S17)
B5
Moderate
Moderate
Excellent
Recovery
Widespread Instability
18 Ward (S18)
B5
Moderate
Moderate
Excellent
Recovery
Widespread Instability
16 Ward (S19)
D5
Very High
Very High
Poor
Aggrading
Widespread Instability
16 Ward (S20)
C5
Very High
Very High
Fair
Stable
Widespread Instability
15 Ward (S21)
B5
Moderate
Moderate
Excellent
Aggrading
Widespread Instability
Gudam Maharaniganj
(S22)
F5
Very High
Very High
Poor
Degrading
Widespread Instability
Gudam Maharaniganj
(S23)
F5
Very High
Very High
Poor
Degrading
Widespread Instability
Harinchaowra (S24)
F6
Very High
High
Fair
Degrading
Widespread Instability
Guriahati (S25)
F6
Very High
High
Fair
Degrading
Widespread Instability
Jhinaidanga (S26)
F6
Very High
High
Fair
Degrading
Widespread Instability
Dauaguri (S27)
B6
Moderate
Moderate
Excellent
Recovery
Widespread Instability
Balarampur 1 (S28)
C6
Very High
High
Good
Stable
Widespread Instability
Balarampur (S29)
C6
Very High
High
Good
Stable
Widespread Instability
Balarampur (S30)
B6
Moderate
Moderate
Excellent
Recovery
Widespread Instability
Balarampur (S31)
C6
Very High
High
Good
Stable
Widespread Instability
Balarampur (S32)
B6
Moderate
Moderate
Excellent
Recovery
Widespread Instability
4.4 Validation of Stream Stability Model with Field Data
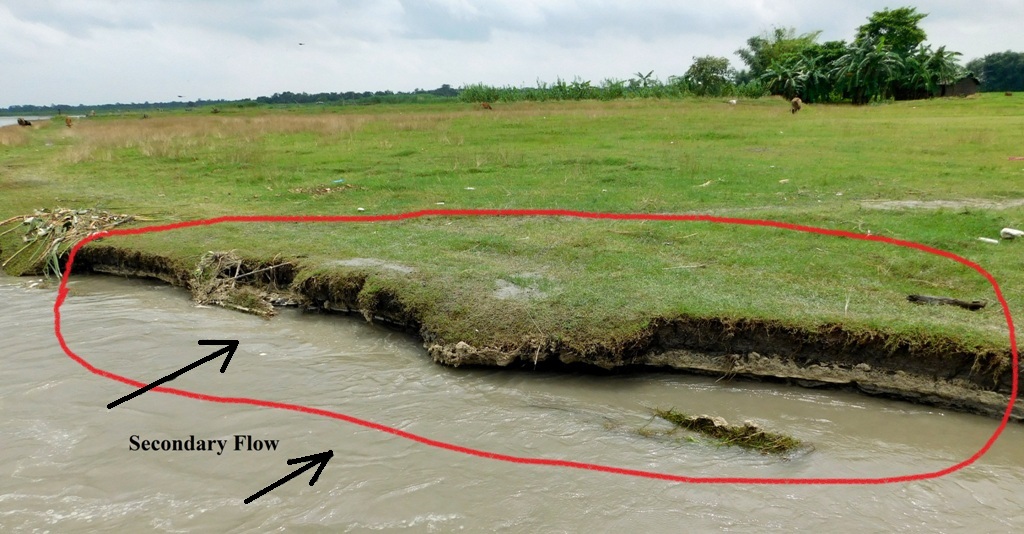
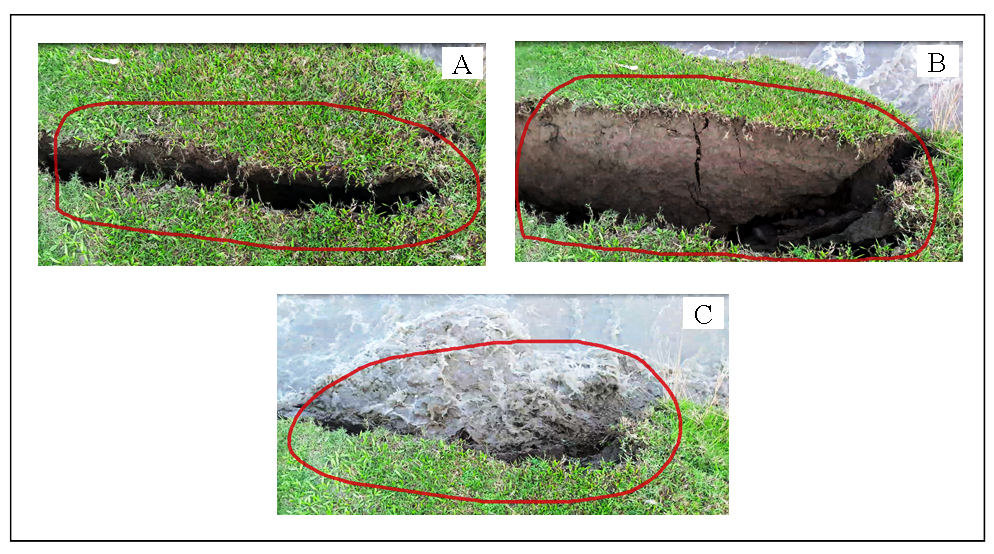
BEHI and NBS models, the bank erosion vulnerability study has been made by field verification to estimate the accuracy level. All the data have been derived during the peak monsoon season with the help of GPS survey (Table 8). All the bank segments are found to be more or less unstable condition during monsoon season due to generation of helical flow as well as secondary flow (Figure 7). Primary flow directly attacks the outer bend and secondary flow directly hits at the base of the bank (Figure 7). As a result, the bank materials are removed from the base. After removal of the basal support, the bank top is collapsed due to gravitational force and this material are gradually washed away (Figure 8) by steady flow (Maiti, 2016). This type of erosion process is frequently observed in the Torsa river reach. Within a very short span of time, hectares of land regularly erode during monsoon season due to these processes (Table 8). Results of lateral, vertical and overall reach stability show that the stability of the Torsa river reach is widespread unstable in nature (Table 5, 6 and 7). Finally, the stability model has completely been validated with field verification.
Figure 7. Mechanism of secondary flow to generate bank erosion
Figure 8. Stages of removal bank material and toppling process
Table 8. Bank erosion and land loss
JL. / Ward Nos.
Mouza Name / Ward Nos. (Segments)
Date of Bank Erosion
Duration
Total Erosion in Hectare
2
Basdaha Natibari (S5)
28th July to 2nd August, 2016
6 days
1.34
8th September, 2018
1 day
0.60
59
Salmara Tritiakhanda (S8)
27th October, 2016
1 day
0.32
68
Haripur (S12)
01 July, 2018
1 day
2.01
136
Damodarpur (S16)
9th July, 2018
1 day
3.48
12th and 13th September, 2018
2 days
1.59
12th September, 2018
15 minutes
0.07
16 & 18
Coochbehar municipality (S18-21)
14th August 2017
1 day
3.09
5 . CONCLUSION
The present study dealt with an inventory of channel stability of the Torsa River. The study is basically dealt with the quantitative measurements of lateral, vertical and overall reach stability. All parameters of stability analysis predicted the bank stability and the erosion vulnerability of the Torsa River. The stability parameters and BEHI and NBS method significantly predicted the present river vulnerability which is properly validated by field investigation. Moreover, BEHI model is a more effecting predictor of bank erosion hazard than the NBS model. Another parameter of NBS methods can be applied in order to determine the further stability assessment in Torsa River. The study explores that expansion of human settlement should be considered beyond bank erosion hazard zone. This type of model can be performed and adopted in stream erosion vulnerability assessment.
Tables
Figures
Conflict of Interest
Authors declare no conflict of any interest.
Acknowledgements
The authors wish to thank the personnel of the Geological Survey of India, Survey of India and USGS for data and maps. The authors also thankful to Prakash Dhar, Pankaj Das and Moumita Dutta for their support during the field work, data analysis and computer graphics.
Abbreviations
BEHI: Bank Erosion Hazard Index; GPS: Global Positioning System; GSI: Geological Survey of India; NBS: Near Bank Stress; SOI: Survey of India; USGS: United States Geological Survey; UTM: Universal Transverse Mercator; WGS: World Geodetic System.
Dey, S. and Mandal, S., 2018a. Assessment of channel shifts hazard of the River Torsa in the Eastern Himalayan Foothills, India. International journal of basic and applied research, 8 (7). 742-758.
Simon, A., Curini, A., Darby, S. and Langenden, E., 1999. Stream bank mechanics and the role of bank and near-bank processes. Darby, S., Simon, A. (Eds.) Incised river channels. Wiley, NewYork, 123-152.
15.
Starr, R.R., 2009. Stream Assessment Protocol Anne Arundel County, Maryland. Stream Habitat Assessment and Restoration Program. U.S. Fish and Wildlife Service. Chesapeake Bay Field Office.
16.
Thorne, C. R., 1982. Processes and mechanisms of river bank erosion. Hey, R. D., Bathurst, J. C., Thorne, C. R. (Eds.) Gravel-bed rivers. Wiley, Chichester, 227 -271.
17.
Thorne, C. R., 1999. Bank processes and channel evolution in North Central Mississippi. Darby, S., Simon, A. (Eds.) Incised river channels. Wiley, New York, 97-121.


 ,
Sujit Mandal 2
,
Sujit Mandal 2