1 . INTRODUCTION
Natural and anthropogenic activities are the obvious factors responsible for the land use land cover (LULC) changes leading to changing landscape. Land is the section of earth surface having chemical, biological and physical properties play significant role in availability and use of resources (UNCCD, 2017). Further, land characteristics vary due to landscape, climate, hydrology, vegetation and fauna as well as human activities including land management like terracing, drainage scheming and agro-biological activities. In recent centuries, it has been observed that the changes in land use and land cover is drastically increasing (Houghton, 2003). In this background many effort have been made to measure the global to local levels extent and magnitude of changes on land use and land cover that is caused by human activities. Among the various anthropogenic activities, the agriculture has been considered as a primary mode of modification that have made in natural ecosystem (Ramankutty and Foley, 1999). Modification of land along with expansion of human footprints and global changes has lead huge problems in land surface throughout the world. In this background land degradation is a great threat to world and which is not only issue that is connected with ecology but also associated with social and economic value too (Dudley et al., 2015; Deng and Li, 2016).
The changes in LULC are either because of natural factors like earthquakes, landslides, drought, flood, etc. or anthropogenic activities with advance technology expanse as the human footprints on earth surface. Increasing in consumption of fossil fuel and rapid industrialization in late 1980’s was lead to increase the greenhouse gasses in atmosphere with new threats like global warming and significant impacts on global system (IPCC, 2007). Arid and semi-arid environments are characterized by climate variation and drought with further anthropogenic drivers like deforestation, wetland drainage, overgrazing, unsustainable land use practices, and the expansion of agricultural land, industries and urban area have been functioning as a catalyst for significant proximate causes of global land degradation where climate change has cumulating additional factor (IPCC, 2007).
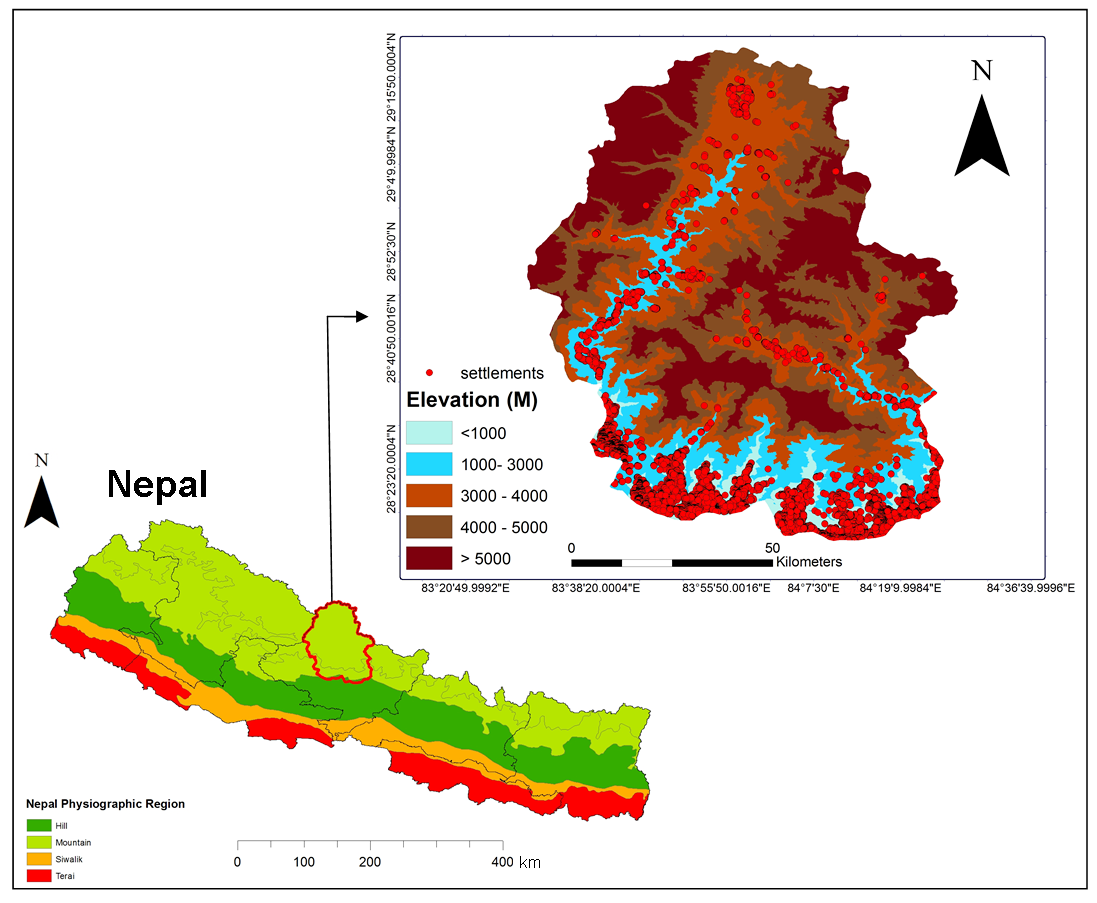
The interaction between different driving cross cutting factors with climate changes at various spatial and temporal scales have further speeding the complex process of land degradation. Nepal is located in a central Himalaya of South Asia with diverse physiographic zones with unique diversity in elevation and climatic condition. The position, climatic condition, land use practices and land degradation are major environmental problems in Nepal. Majority of terrestrial land surface of country is hilly in the middle belt of the country followed by the mountain in the Northern part and least by the Terai and Inner Terai in the Southern belt (LRMP, 1986).
Hagen (1998) has classified Nepal into seven zones from Southern plain to Northern high Himalaya Namely Terai lowland, Siwalik hill zone, Mahabharata lakh, Midlands, Himalaya, Inner Himalaya, and Marginal and High Mountains. Average annual precipitation is about 1630mm with half of the country receives 1500-2000mm precipitation (Chyurlia, 1984). Spatial and temporal variations in precipitation are distinct mainly in months of June and September, monsoon season. The recorded average annual precipitation ranges from merely 163mm at Lomanthang of Mustang district to 5244mm at Lumle of Kaski district (Timilsina, 2015). These locations are in the periphery of Annapurna landscape.
The first land resource mapping report carried out in 1986 by interpreting aerial photographs taken during 1978-79 showed that nearly 20% land were under cultivation, followed by 37.8% under forest, 4.6% under shrub land, 6.6% was uncultivated field within cultivated area, 11.8% was pasture land, 3.4% was under snow and ice, 0.1% under lake and pond, 0.1% was used for urban activities and 15.7 % land occupied by sandstones and rocky surface (LRMP, 1986). In the case of forestry sector more recent (DFRS, 2015) report showed 40.36% area is covered by forest, 4.38% is composed with other wooded land and 55.26% by other land cover types.
Similarly, previous forest resource assessment carried out by national forest inventory (NFI) in 1994 indicated that total forest area was 29% and shrub land of 10.6% making total of 39.6%, agriculture was 21%, non-cultivated land was 7%, grassland was 12% and rest 20% which includes the Himalaya, barren rocks, rivers and roads of the geographical area of the country (DFRS, 1999; CBS, 2011). It showed that the total forest area is increasing in the country. The reason behind increasing the amount of forest cover may be the expansion of community forest particularly the Middle Hills (Branney and Yadav, 1998; Gautam et al., 2003; FRA, 2015). However, Himalayan region is thought to be most fragile and sensitive mountain range in the world and increasingly threatened by large scale of anthropogenic and natural factors such as climate change, disaster, intensive farming on steep slopes, pressure over natural resources, construction and development activities like dams, expansion of roads, settlements, tourism, alien species, etc. have resulted in overall environmental degradation.
Similarly, the theory of Himalayan Environment Degradation also stated that high population growth rate, many economic activities pedestal on the natural resources, and high poverty rate have accelerated the mass forest degradation and leading to adverse impacts on Himalayan ecosystem and environment (Sharma, 1994; Collins and Jenkins, 1996; Ives and Messerli, 1989). Likewise, environmental fragility with the seasonality of anthropogenic activities such as tourism, and other development activities create more vulnerability on soil, vegetation, trampling waste dumping, etc. (Brohman, 1996).
This relates to any part of Nepal Himalaya including the Annapurna Conservation Area (ACA) and increased pressure of tourism-related activities on forest resources and the alpine shrub vegetation in Nepal have already been documented (Stevens, 2003). Very few studies have examined decadal changes in the land cover and degradation of its fragile ecosystems where ecosystem services, function, growing economic and development issues are strongly linked. The lack of knowledge about multiple driving factors associated with land cover change, degradation, forest structure, and composition, as well as anthropogenic impacts on the ecosystem has often limited the execution of sustainable management plan (MoFSC, 2009; Rijal and Meilby, 2012). Similarly, in recent decade’s population, urbanization and semi-urbanization at different areas have increased rapidly where construction of numerous rural road, hydropower dam, transmission line, other development activities are happening around or adjacent the protected area leading to an unparalleled speed on forest land degradation, urban land expansion, and the decline of grassland likewise climate change effects have put additional driving factor through melting or decreasing snow and glacier cover, all of which are directly related to land cover change and degradation issues (Lambin et al., 2003; Batunacun et al., 2018).
Earth observation data application becomes important source for understanding the dynamic and response of vegetation to climate and anthropogenic interaction (De Fries, 2008). For this purpose, geospatial data obtained from remote sensing techniques are important components for spatial and temporal monitoring and understanding, because of their repetitive and synoptic observations over a large area (Hill et al., 2004). Remote sensing data with vegetation index and land surface albedo has been studied (Zeng et al., 2006). Additionally, vegetation cover is an important indicator for evaluating the extent of vegetation restoration in degraded sandy grasslands (Zhang et al., 2004). The availability of Moderate-resolution Imaging Spectroradiometer (MODIS) derived Normalized Difference Vegetation Index (NDVI) and Enhanced Vegetation Index (EVI) with better spatial and temporal information. Many earlier studies have tested the validity and reliability of the MODIS data for detecting the forest degradation (Tucker et al., 2005). Normalized Difference Vegetation Index (NDVI)/Enhance Vegetation Index (EVI) are considered as standard vegetation parameter that serves as an important proxy for land degradation assessment and mapping (Stellmes et al., 2015).
MODIS remote sensing imagery derived variables has been successfully used to detect land and forest degradation in the tropics. This study, therefore, gathered quantitative data on using a multi-time series of LULC, NDVI data and analyzed for greenness variations over time. The findings of this analysis enable a new assessment of possible conservation and management strategy options for sustainable management of natural ecosystem in the study area and elsewhere in the world.
2 . METHODS
2.1 Study Area
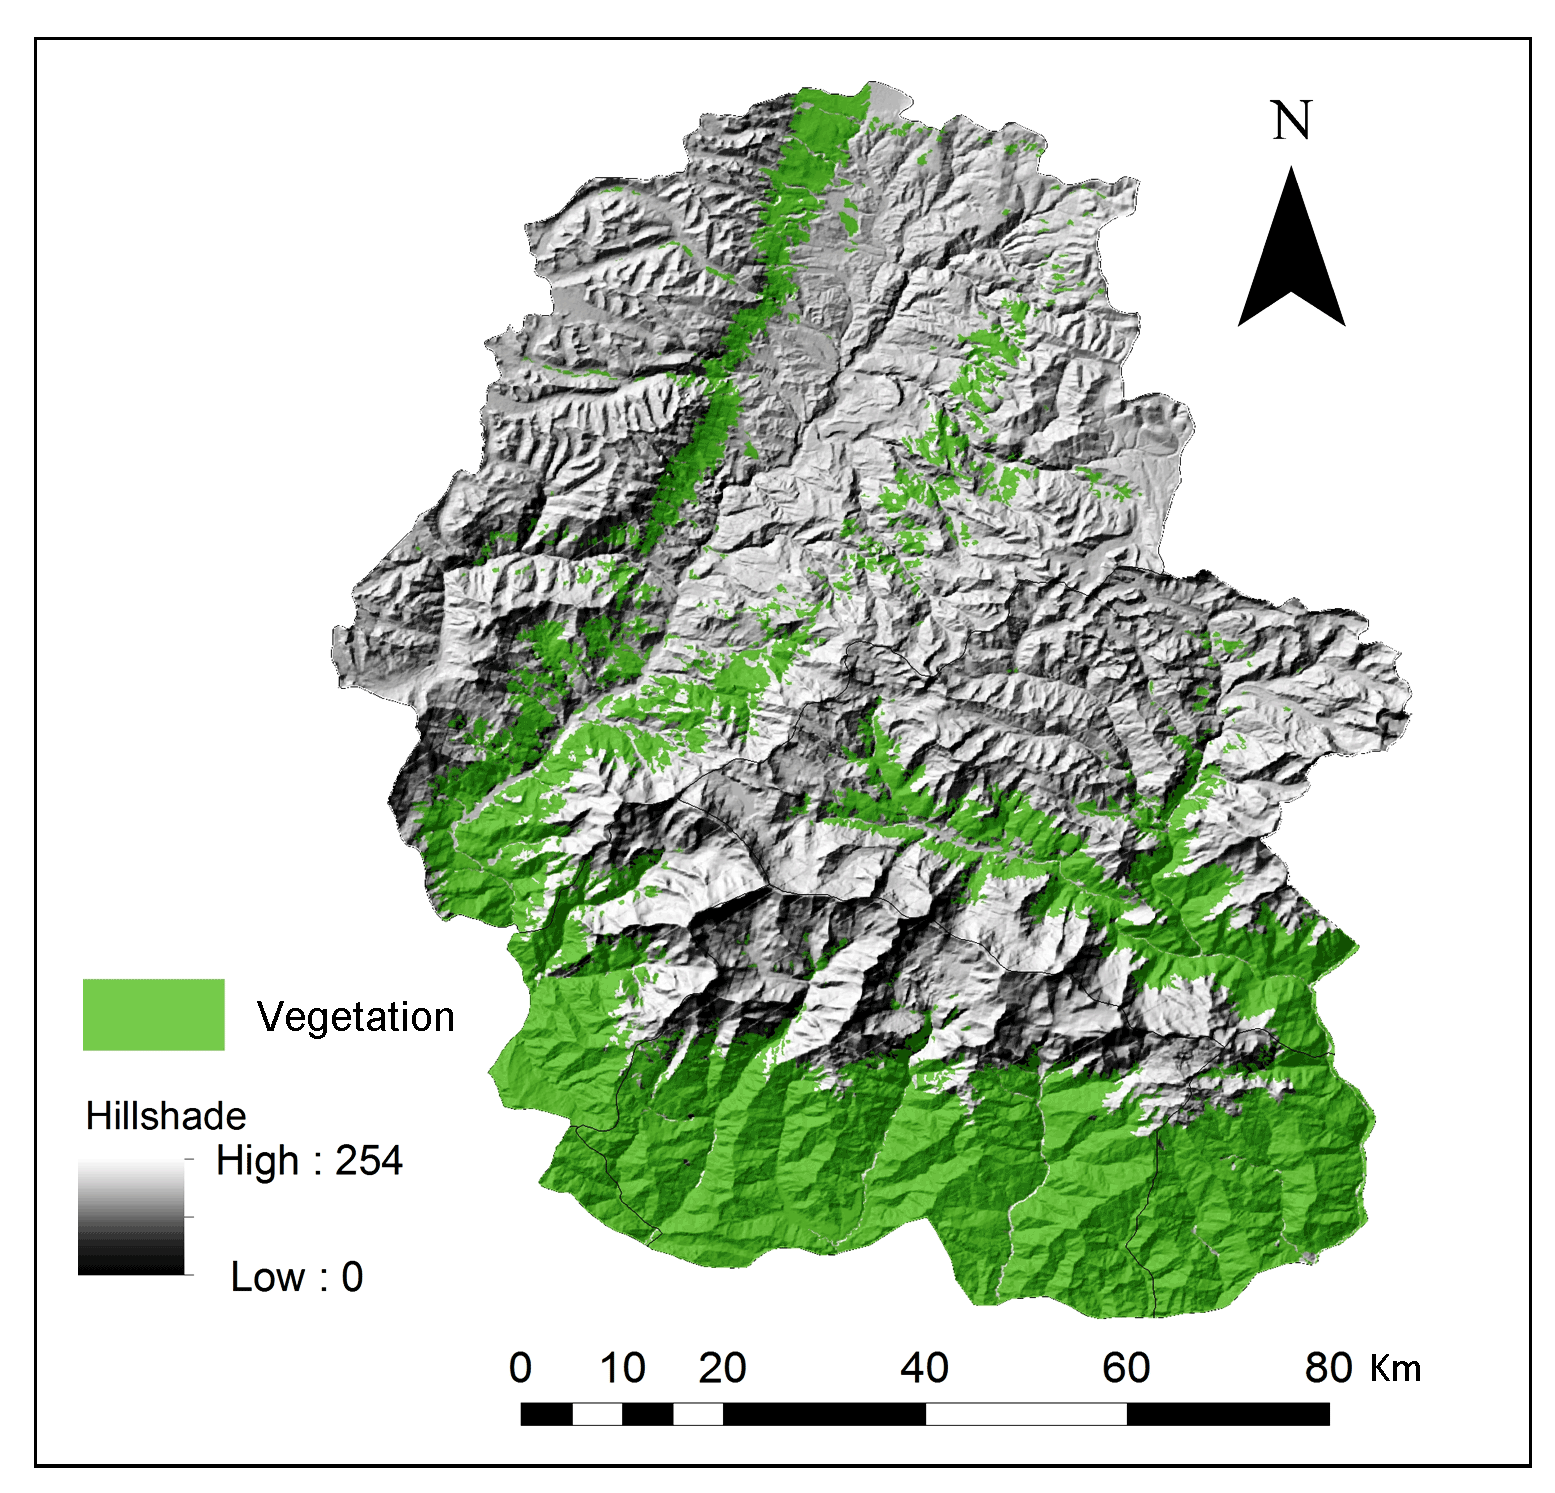
Annapurna Conservation Area (Figure 1) is Nepal’s first conservation area model in which management principles are based on the participatory conservation with multiple land use precincts (Heinen and Kattel, 1992; Job and Thomaser, 1996) under the national trust for nature conservation and Annapurna Conservation Area (ACA) project and formerly known as King Mahendra Trust for Nature Conservation (Bajracharyae et al., 2007; Thakali, 2012). ACA covers an area of 7,629 sq. km of Manang, Mustang, Kaski, Myagdi, and Lamjung districts of Gandaki province (Figure 1) with the warm subtropical climate at Southern part with cold and semi-desert in the Northern part with an altitude ranging from 790 m to 8036 m (Annapurna I peak).
The region has a unique ecosystem with high diverse flora and fauna. According to ACA harbors record 1226 species of plants, 38 species of orchids, 9 species of rhododendrons, 101 species of mammals 474 species of birds, 39 species of reptile and 22 species of amphibians and 10 ethnic groups inhabit in the region. Thakali, Manangi, Bhotia, Tibetan, Magar, Tamang, Brahmin, Chhetri, Kami, Damai, and Sarki are some important ethnic communities in the region (ACAP, 2002). In the lower part just above and around the settlements there is subtropical broadleaved forest dominated by Schima wallichii, Castanopsis indica, Pinus roxburghii and Alnus nepalensis are found.
Altitude around 1500m to 3000m are covered by mixed broadleaved temperate forests of Quercus and Rhododendron species and coniferous forests of Abies spectabilis, Pinus wallichiana, and Tsuga dumosa. Betula utilis, Pinus wallichina and Juniper species in the sub alpine zone (3000m-4000m), and Rohododendron and grassland/bugal, Juniper scrub in the alpine zone above 4000m (Inskipp and Inskipp, 2001; ACAP, 2002)
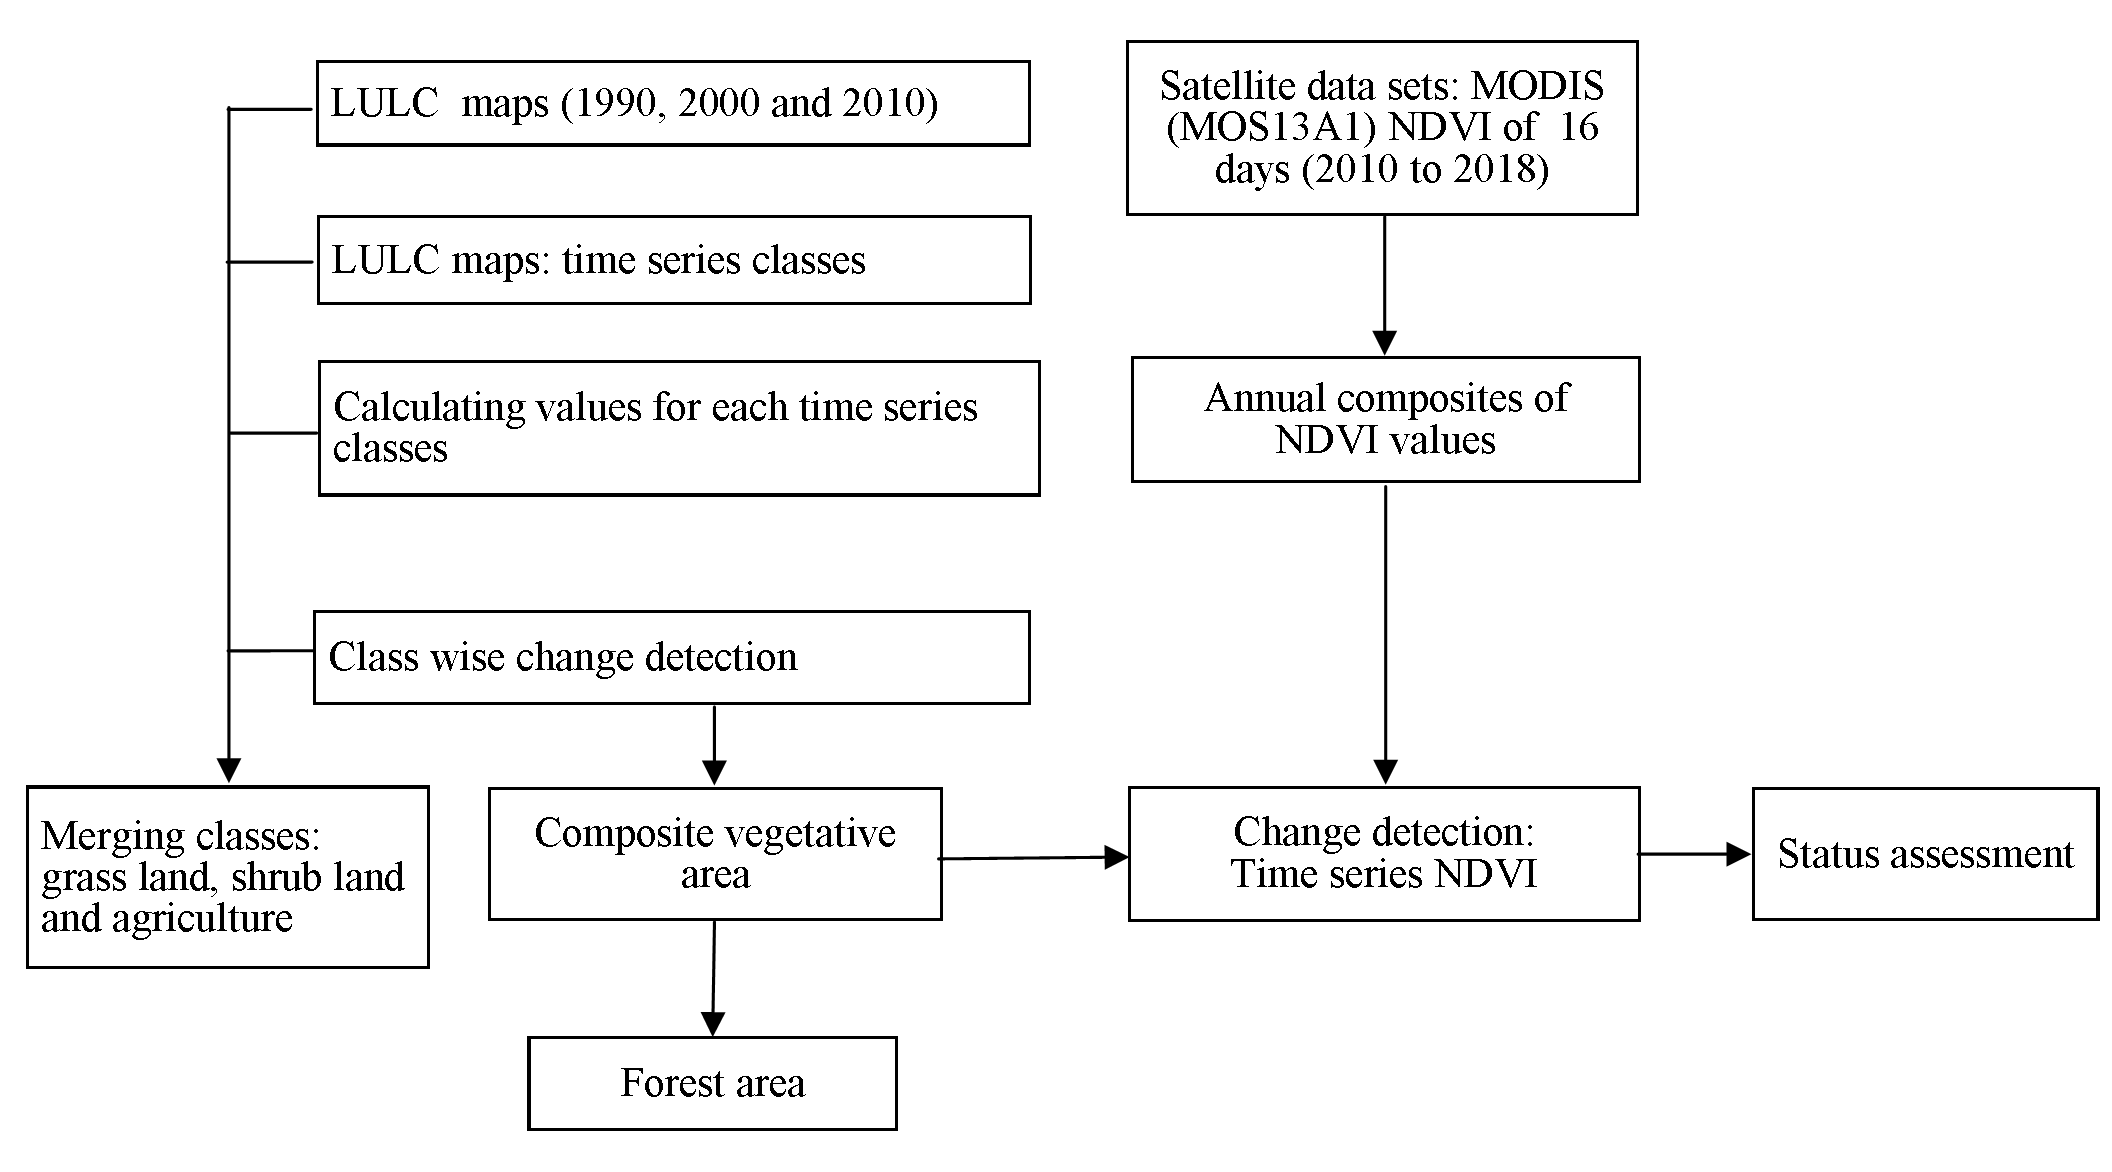
2.2 Datasets
This study used various spatial and non-spatial datasets and documents that have been published and collected from various website, research institution and various government agencies. Data of LULC (1990, 2000 and 2010) was used for detection of changes in land cover over the selected period. Moderate Resolution Imaging Spectroradiometer (MOD13A1), 16-day composite time series NDVI data at 500m resolution was used for estimations of recent changes. Further, to make NDVI as more representative of the land and vegetation pre-processing and NDVI an image based atmospheric correction was chosen. Precision correction of images mosaic generation was also carried out. Information about roads, rivers, settlements, and administrative boundary, etc. was obtained from the department of survey, government of Nepal (Table 1). Topographic information such as elevation, terrain was derived from SRTM Digital Elevation Model (DEM) with a geometric resolution of 30m.
Table 1. Datasets
|
Data
|
Sources
|
|
Land Use Land Cover (LULC)
|
LULC datasets (1990, 2000 and 2010) downloaded from http://geoportal.icimod.org
|
|
Topographical map (1:250,000)
|
Obtained from Department of survey, Nepal.
|
|
DEM
|
SRTM products from NASA.
|
|
Moderate Resolution imaging Spectroradiometer (MODIS) (MOD13A1) datasets at 500m resolution (2010-2018).
|
Downloaded from https://lpdaac.usgs.gov
|
2.3 Land Use Land Cover and NDVI Analysis
LULC datasets have an overall accuracy of the classification 85.13% with producer’s and user’s accuracies at 81% and 82%, respectively. Kappa statistics value was 0.82. These datasets were categorized into major LULC classes such as agricultural land, snow cover, water body, bare land, forest cover, and grassland.
NDVI (Normalized Difference Vegetation Index) is one of the most extensively used vegetation indices for its sensitivity to the presence, density and condition of vegetation (Pan and Qin, 2010). It is a simple numerical indicator that can be used by remote sensing measurements. NDVI provides a crude estimate of vegetation health and acts as a means of monitoring changes in vegetation over time. NDVI has been used as a cost-effective and reliable approach for national reporting on several UNCCD core indicators and has been most commonly used to map spatial and temporal variation in vegetation (Tucker, 1979). Thus, this study used NDVI (equation (1)) as an indicator of land degradation.
\(NDVI = {NIR-RED \over NIR+RED}\) (1)
The NDVI values range from -1 to 1. Negative values approaching -1 corresponds to water or clouds. Similarly, a value close to zero (-0.1 to 0.1) generally corresponds to barren areas of rock, sand, or snow. Low (approximately 0.2 to 0.4) positive values represent shrub and grassland at the same time as higher values indicate the dense forest with approximately 1 (Yengoh et al., 2014; Beisel, 2018).
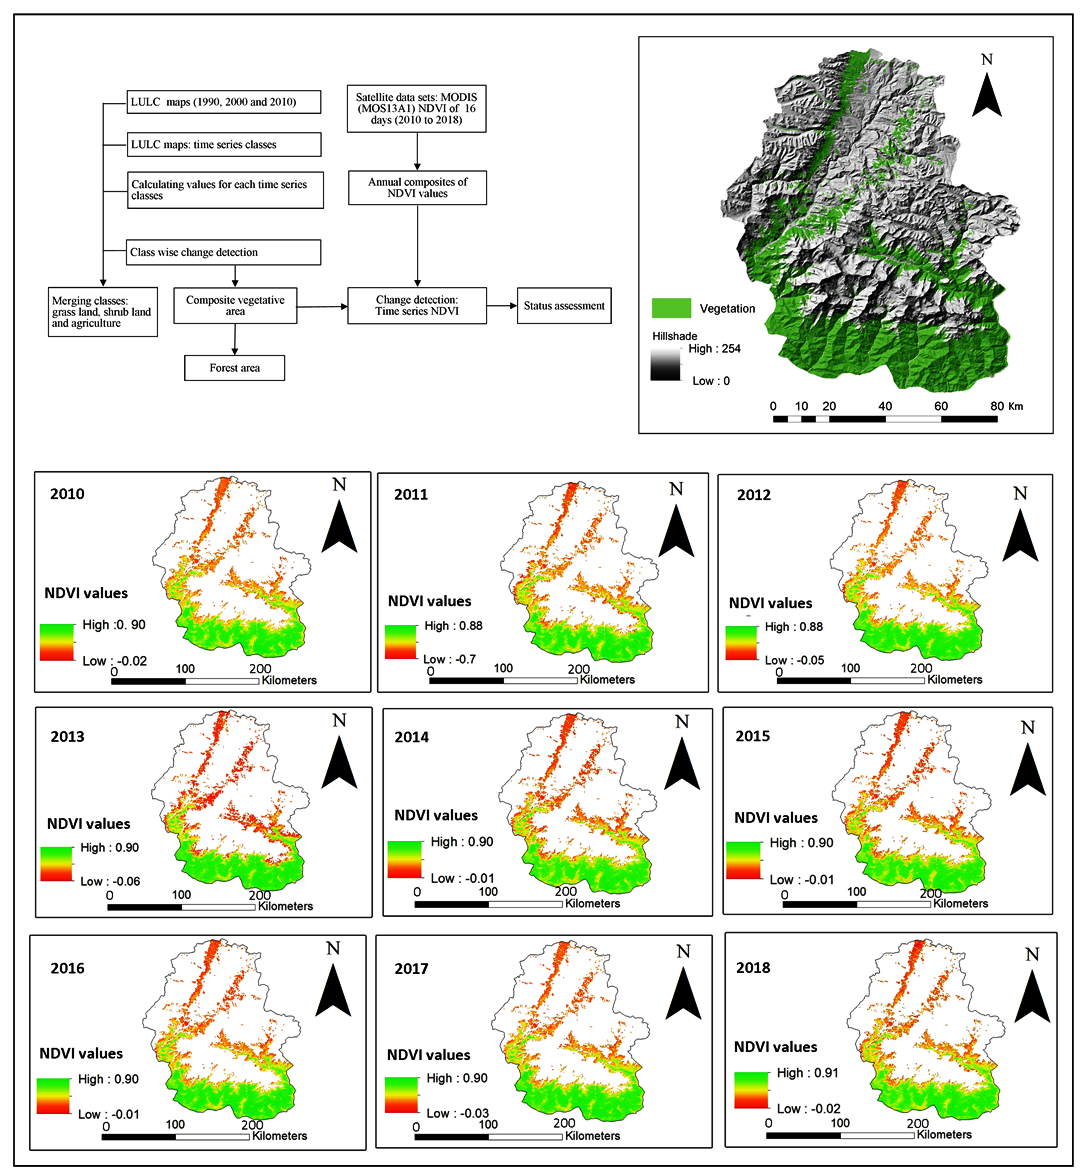
Time series annual NDVI datasets were processed with the help of ArcGIS 10.5 and finally those data were analyzed for the distribution, calculation of changes and mapped accordingly (Figure 2).
3 . RESULTS AND DISCUSSIONS
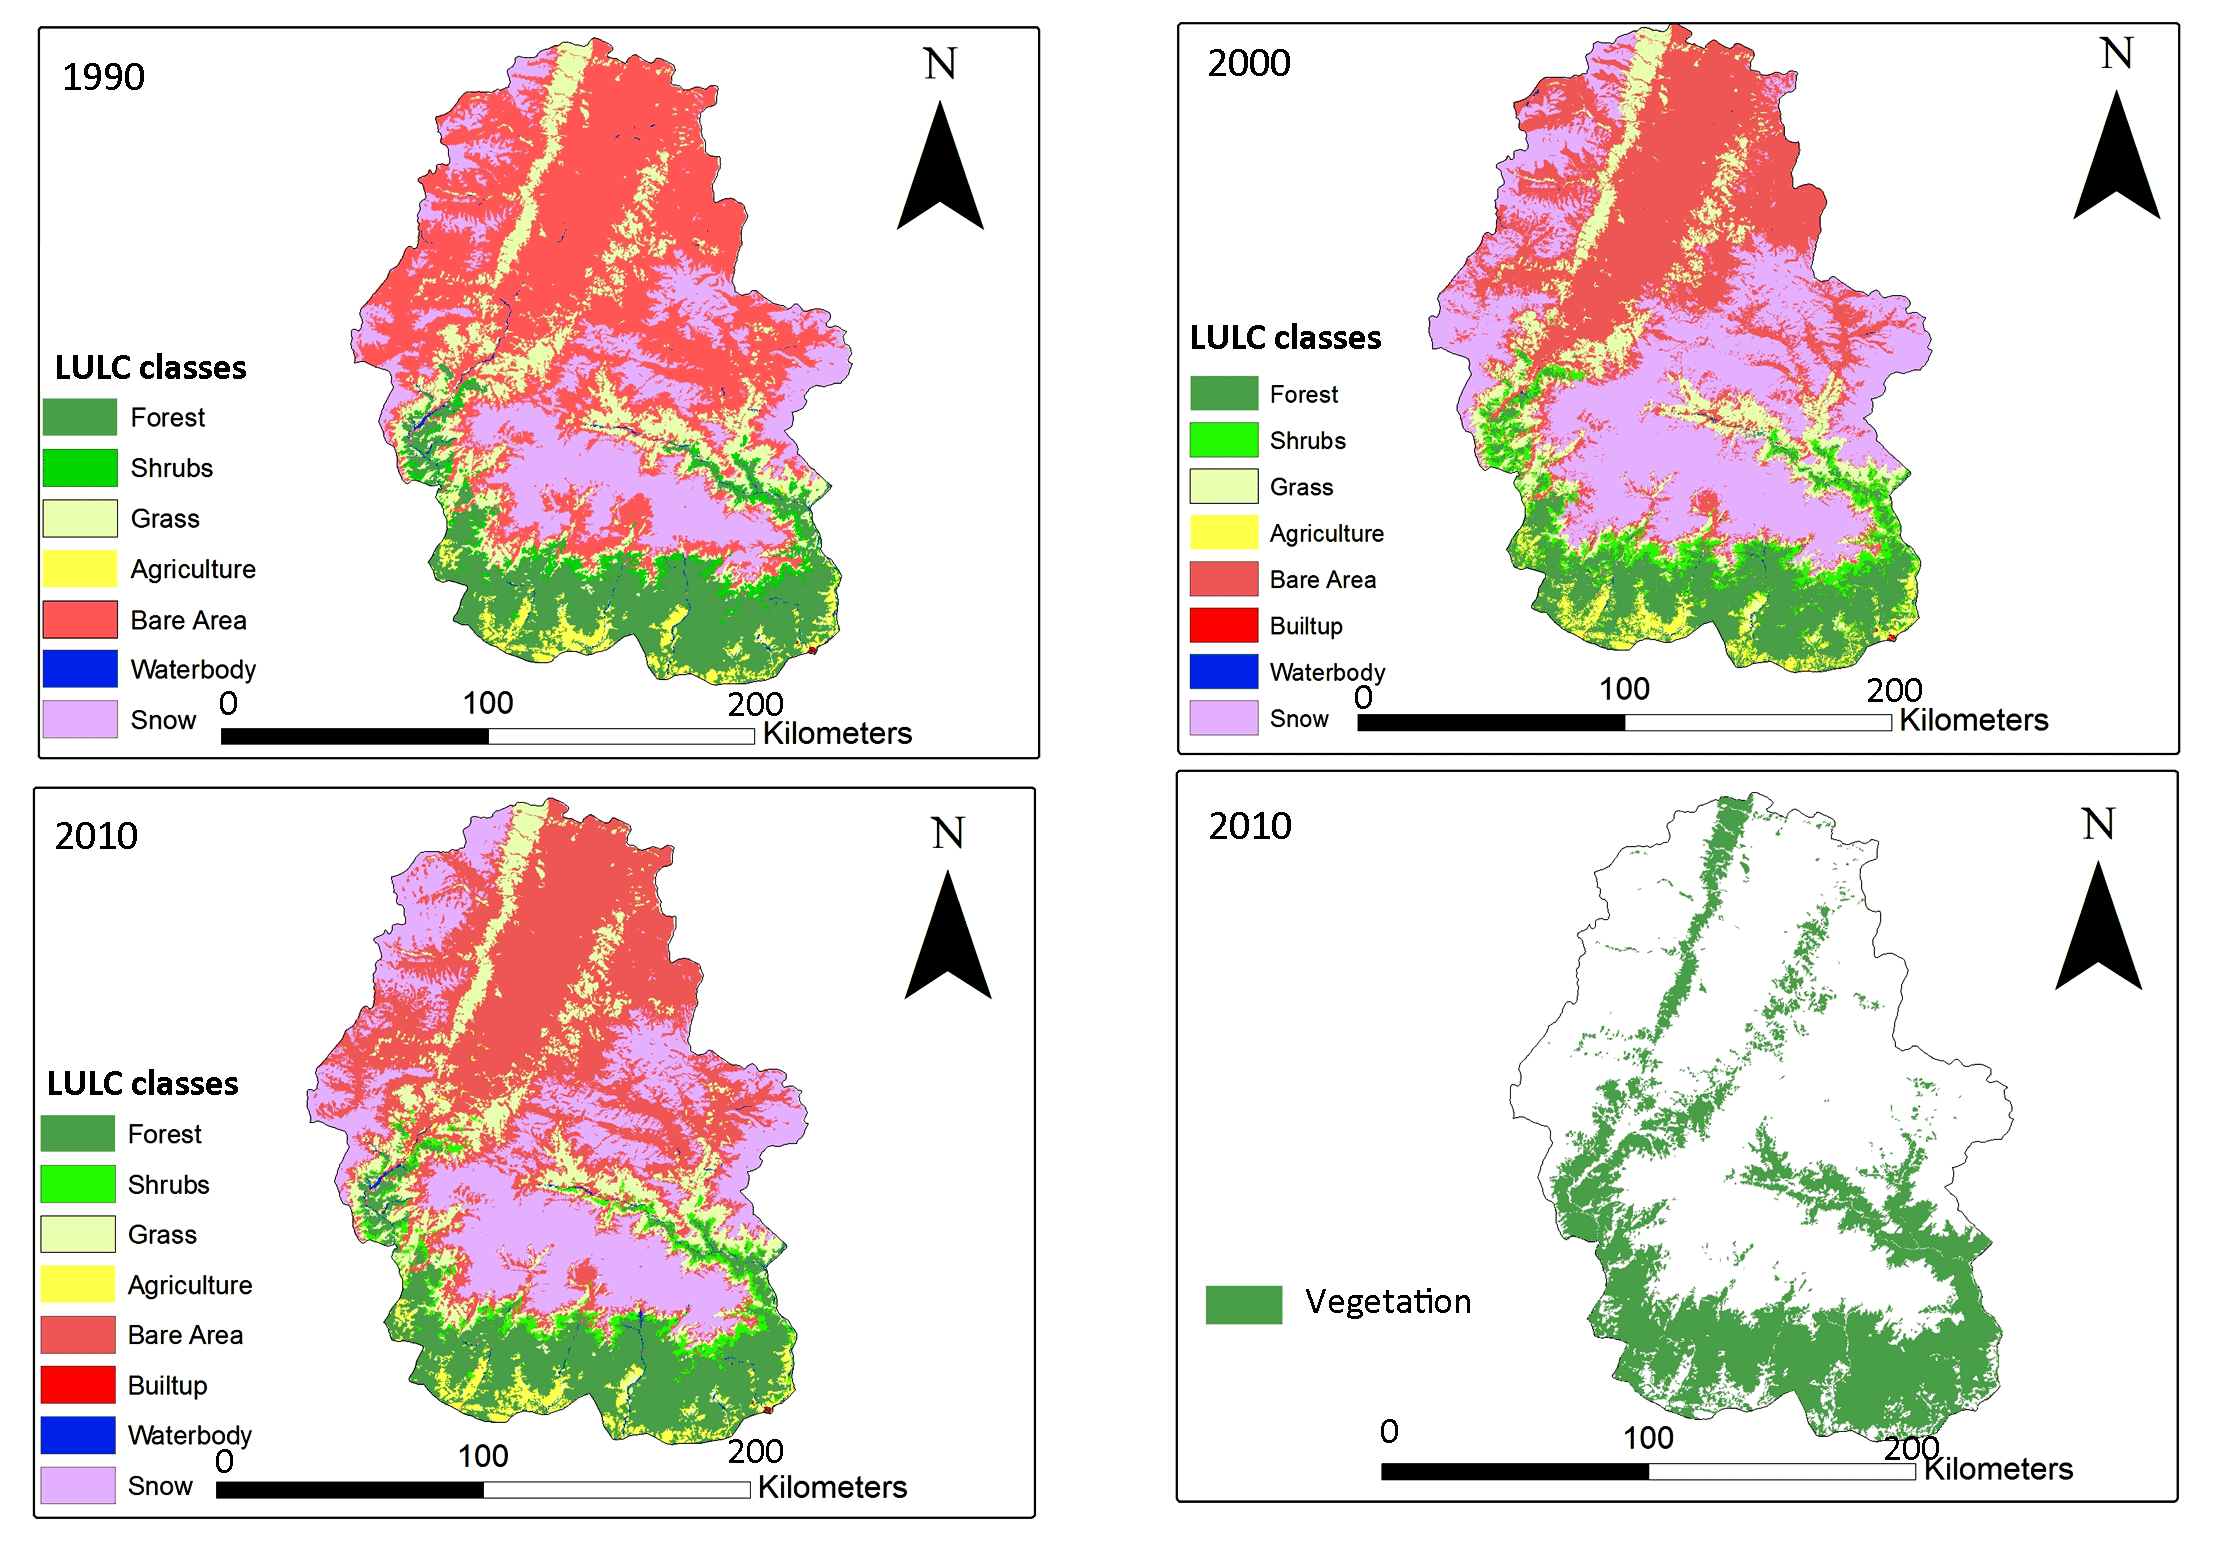
3.1 Land Use Land Cover
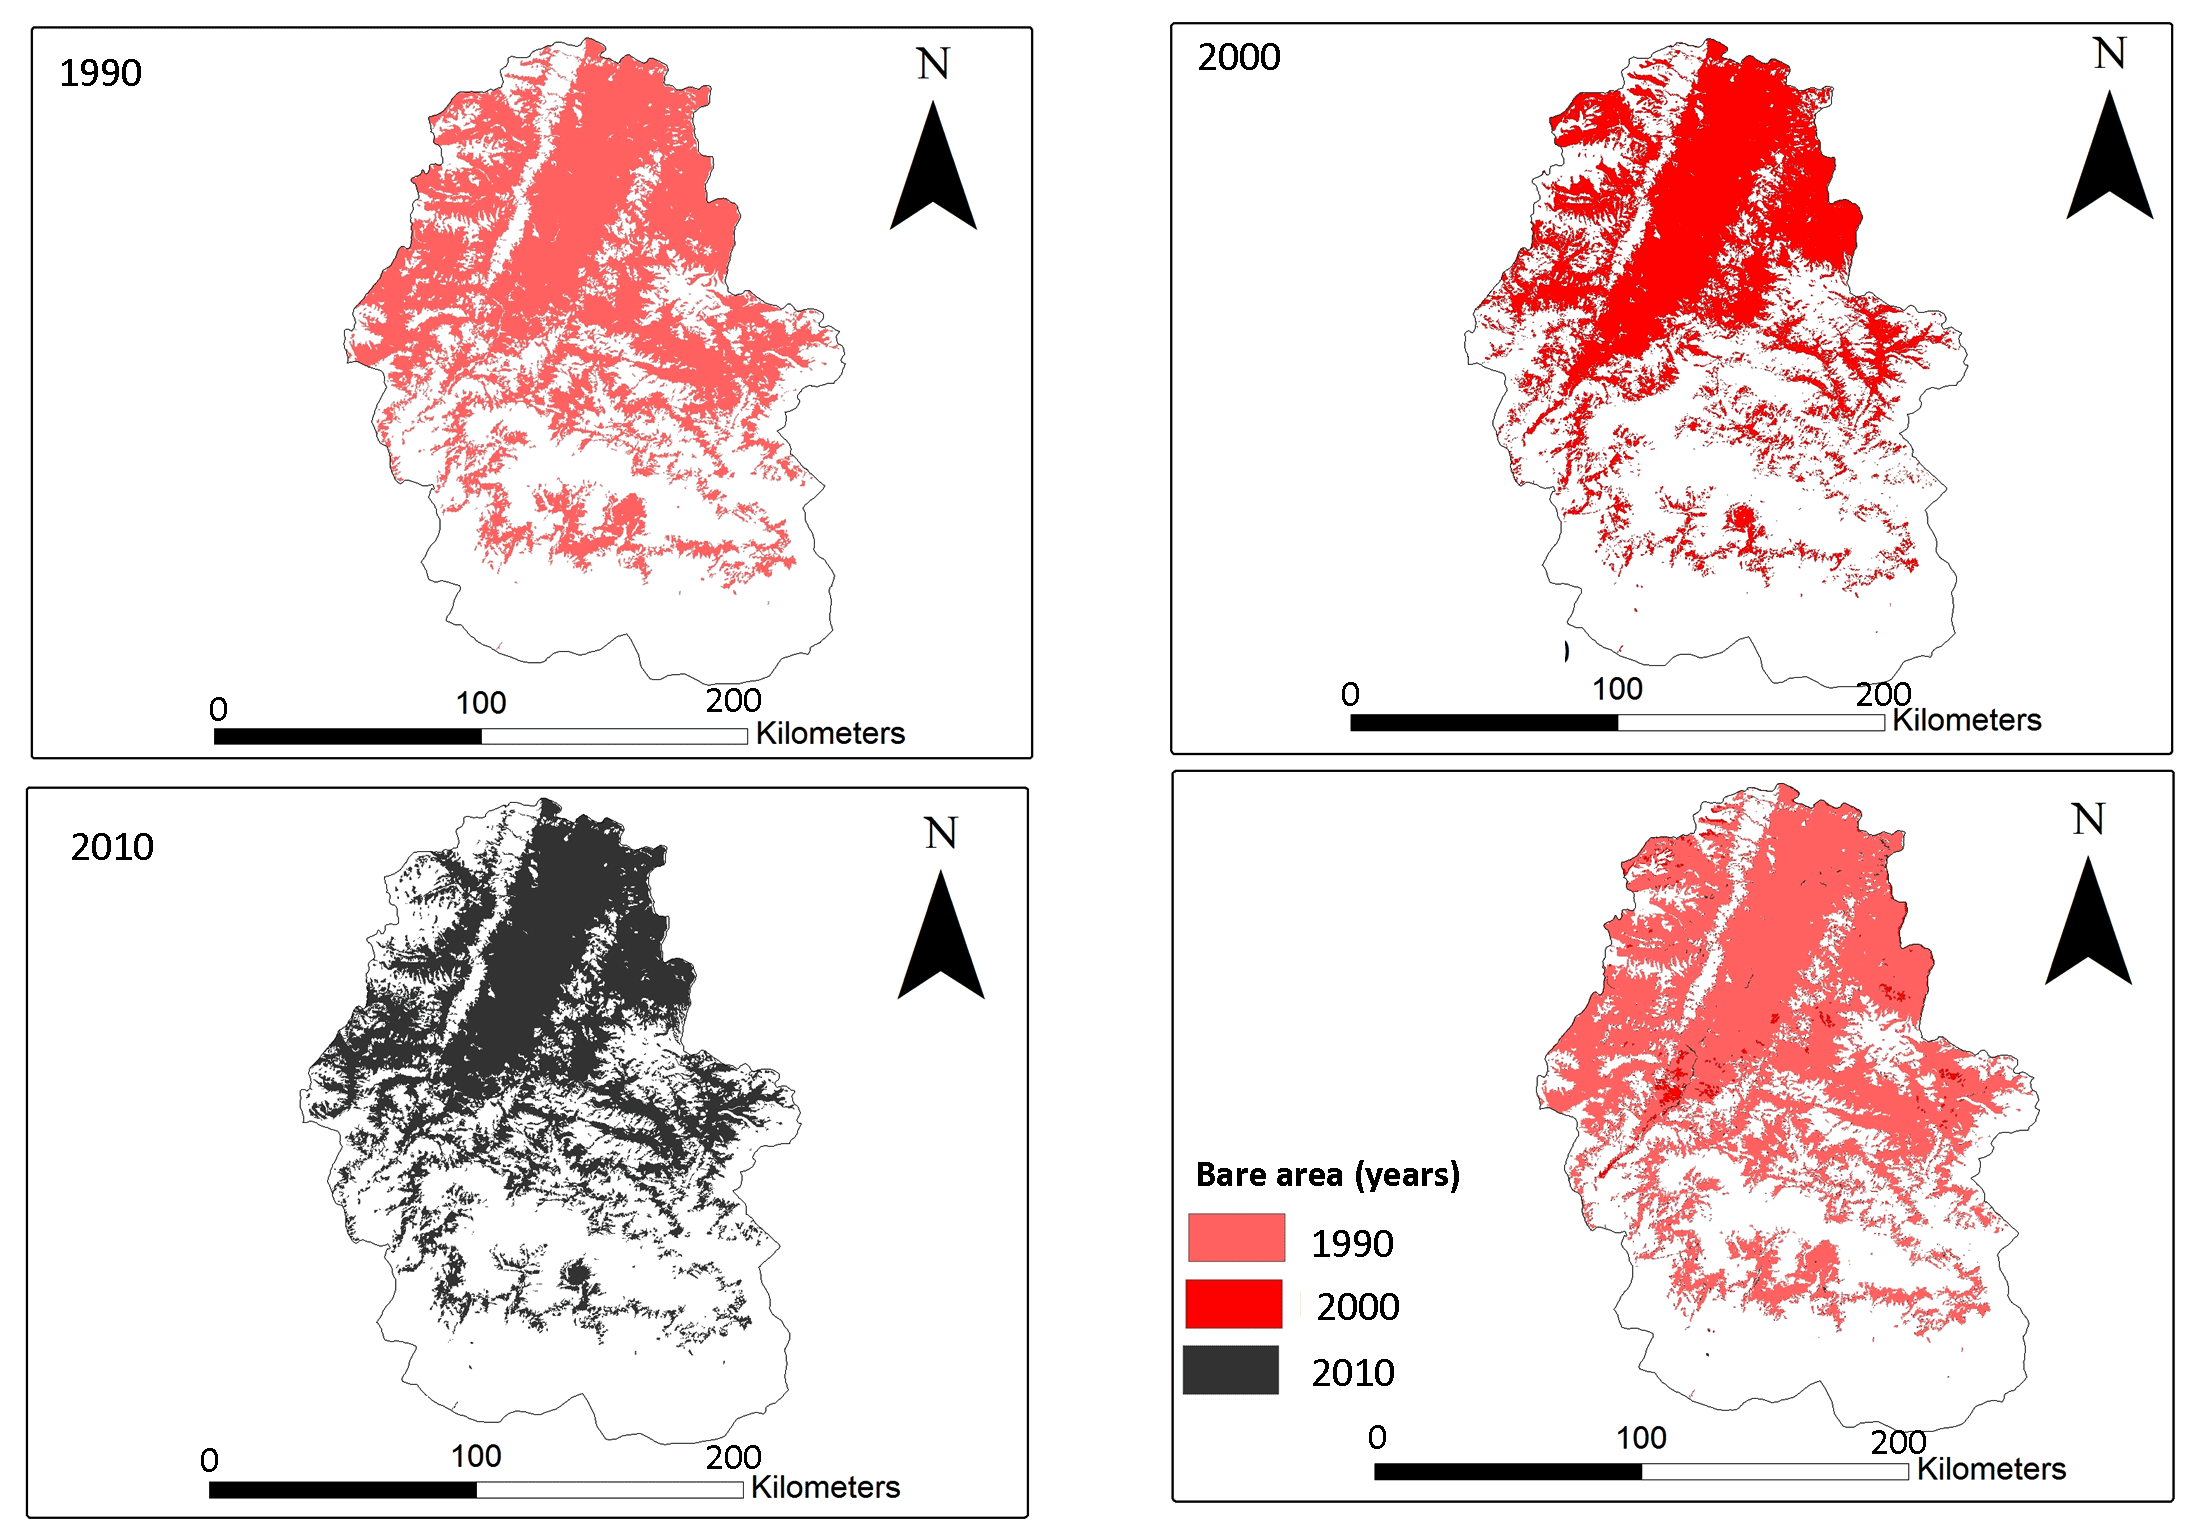
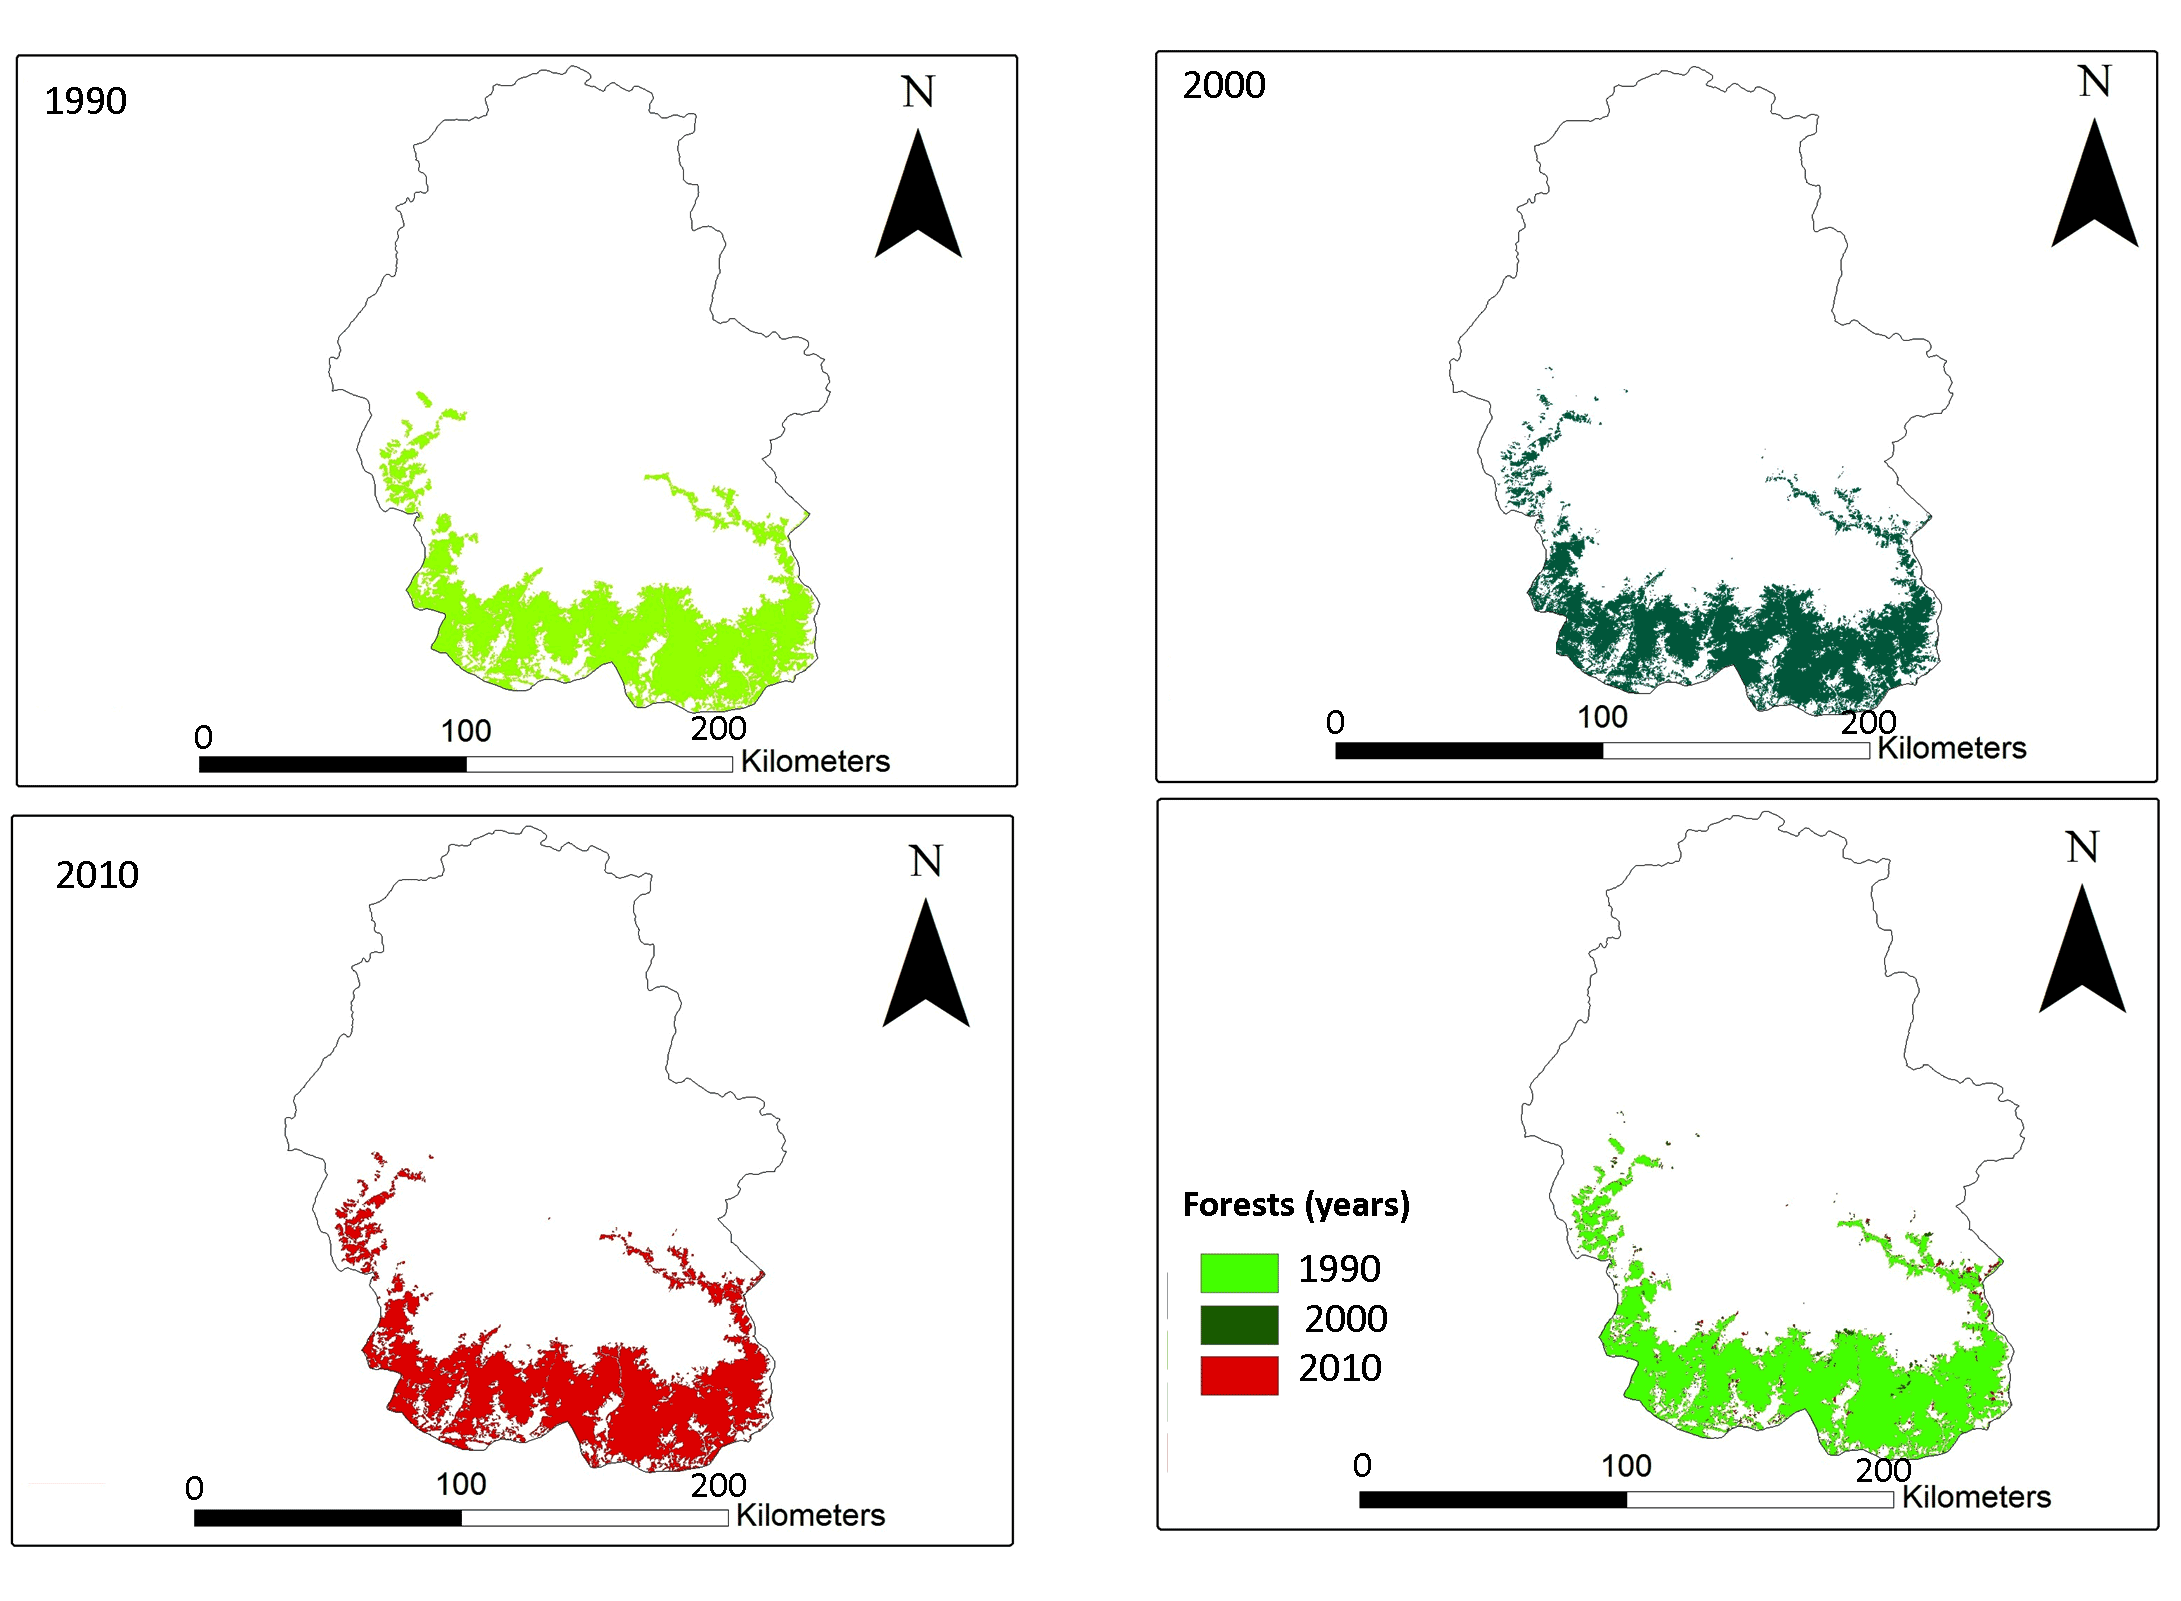
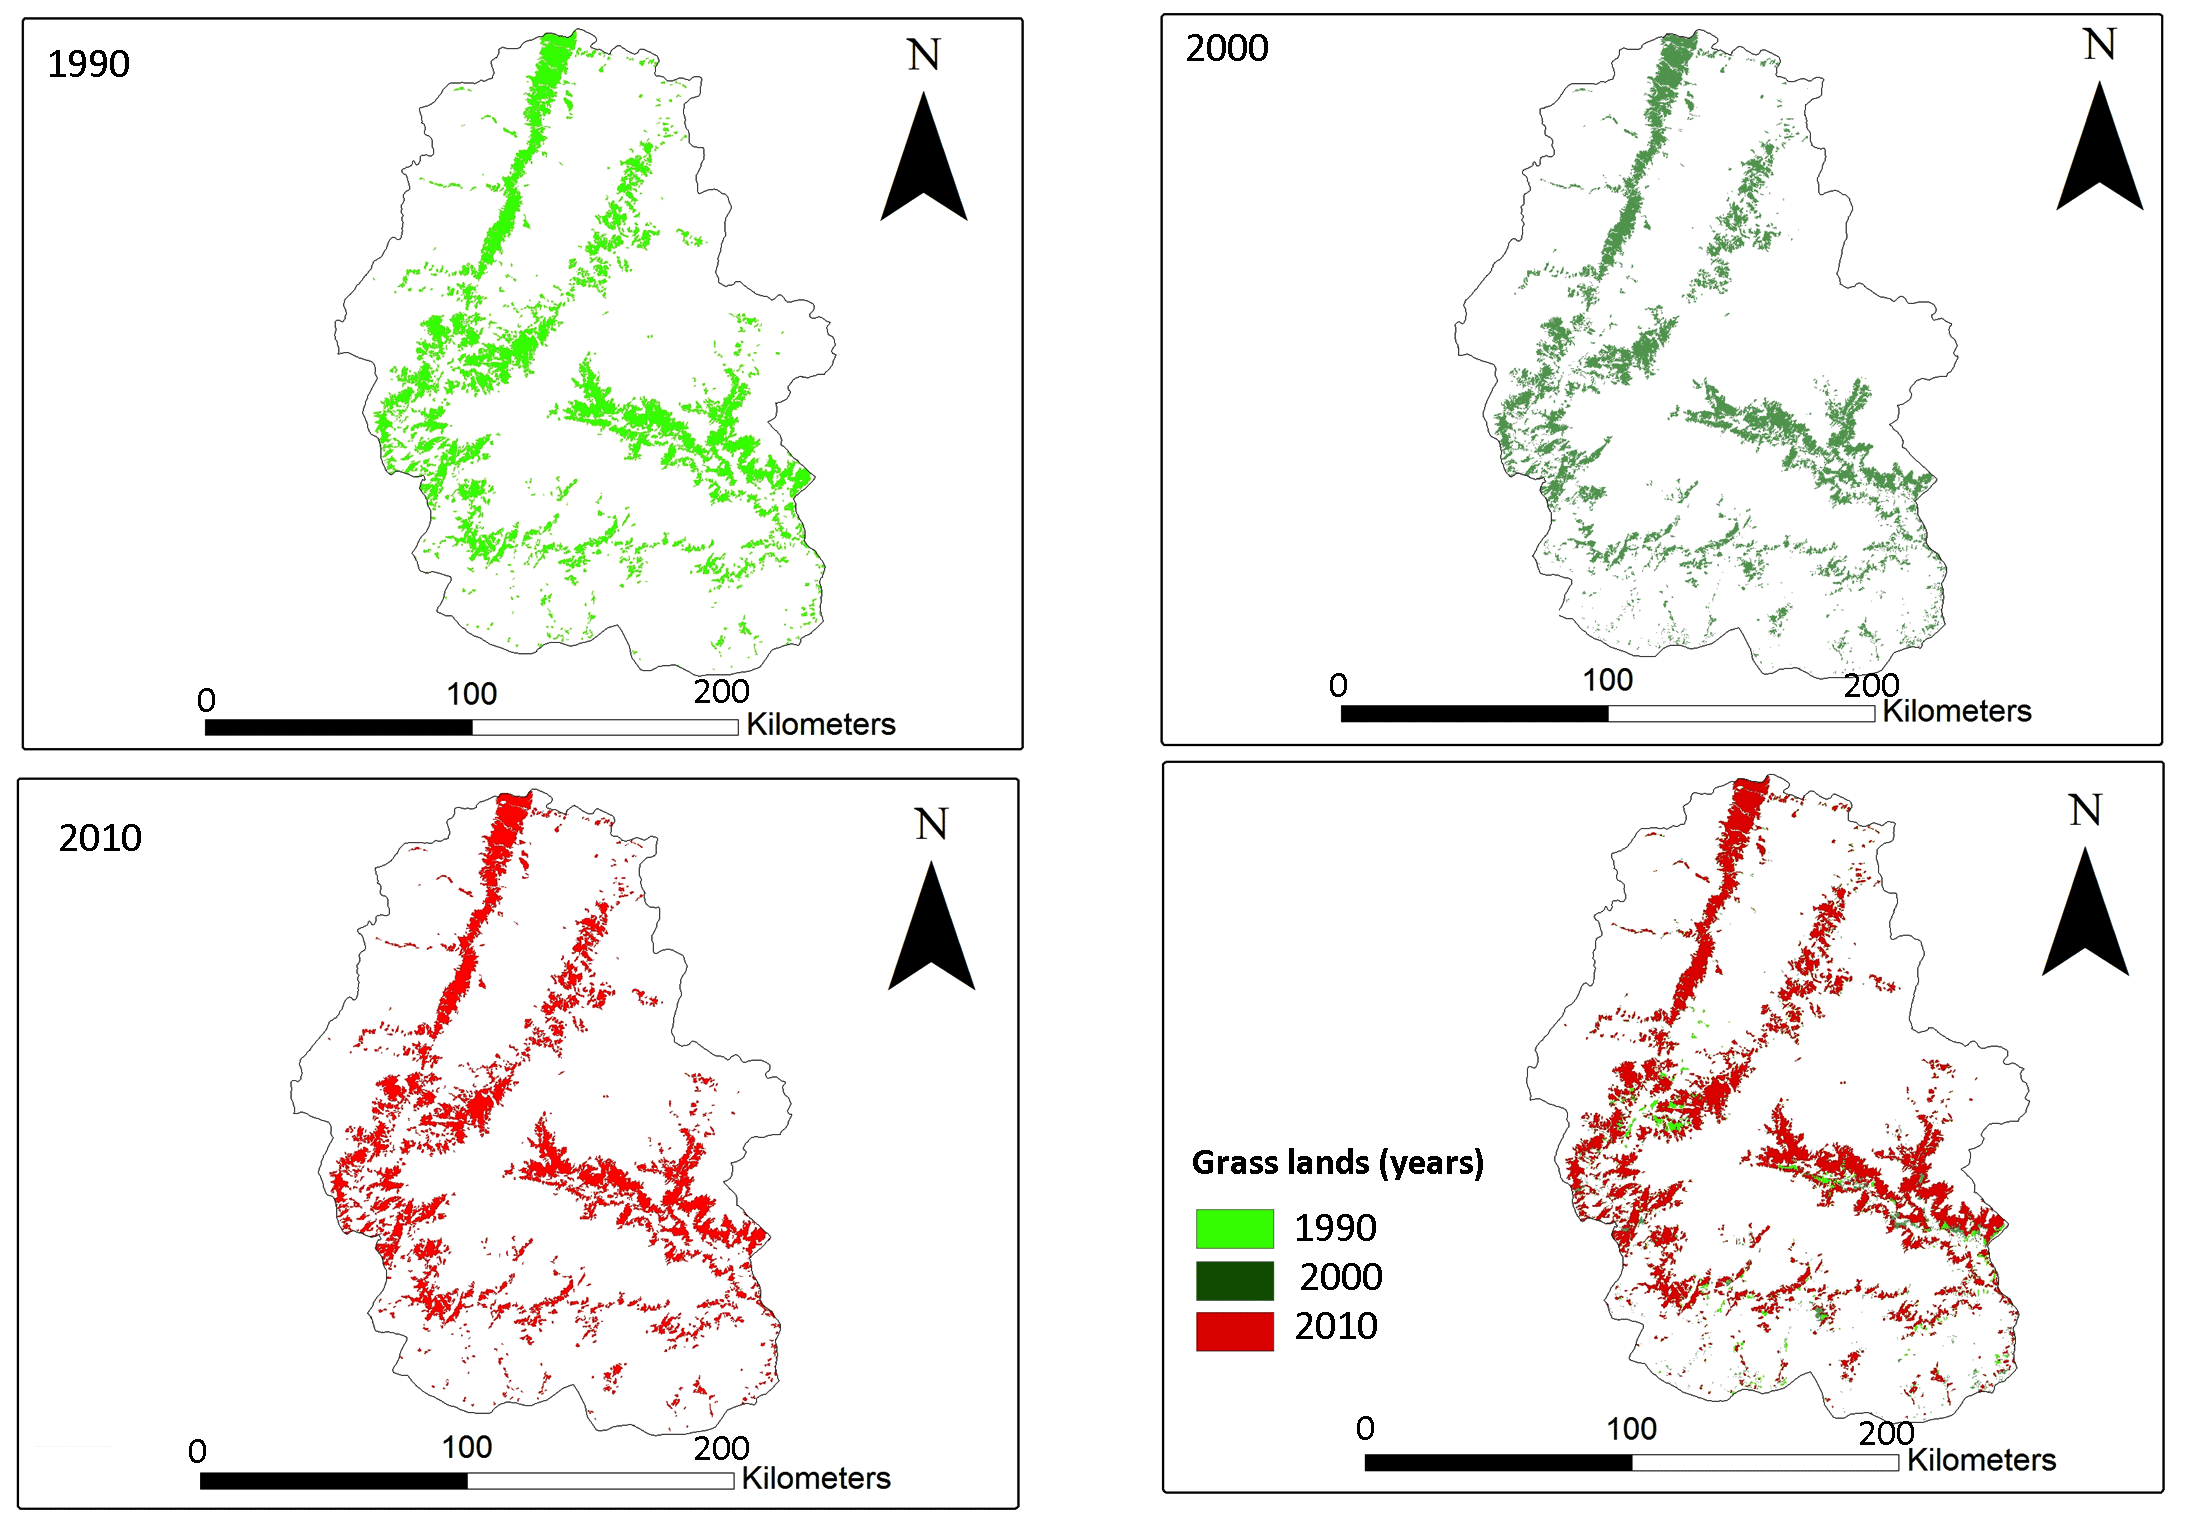
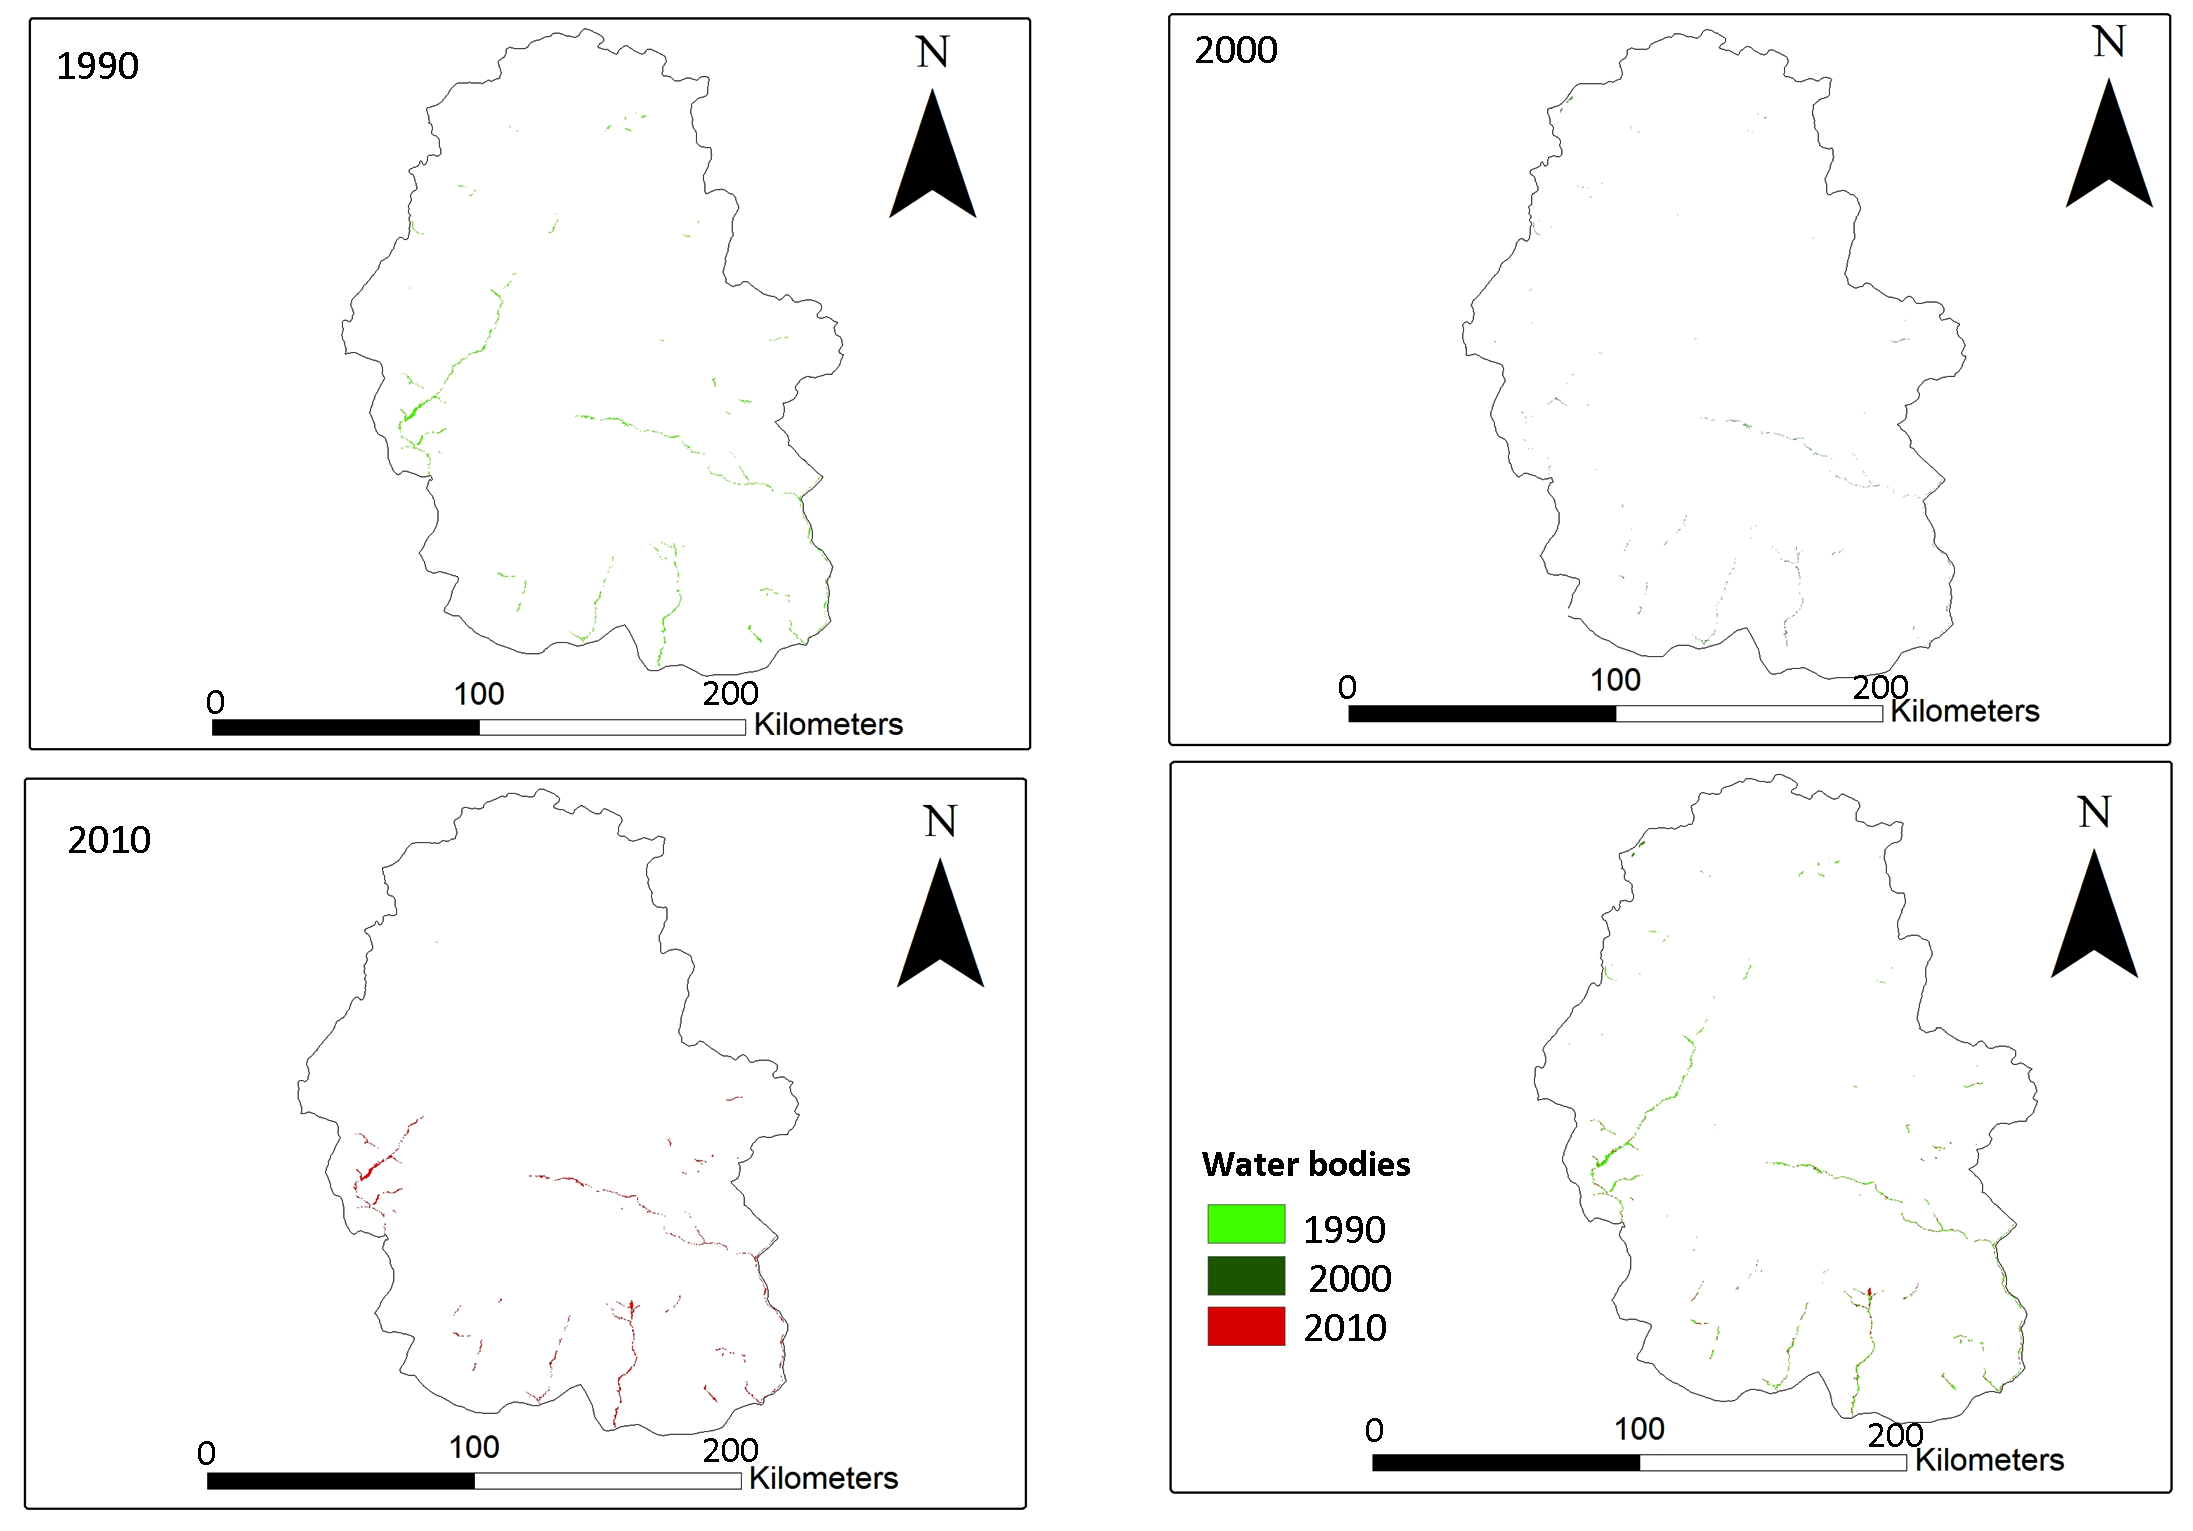
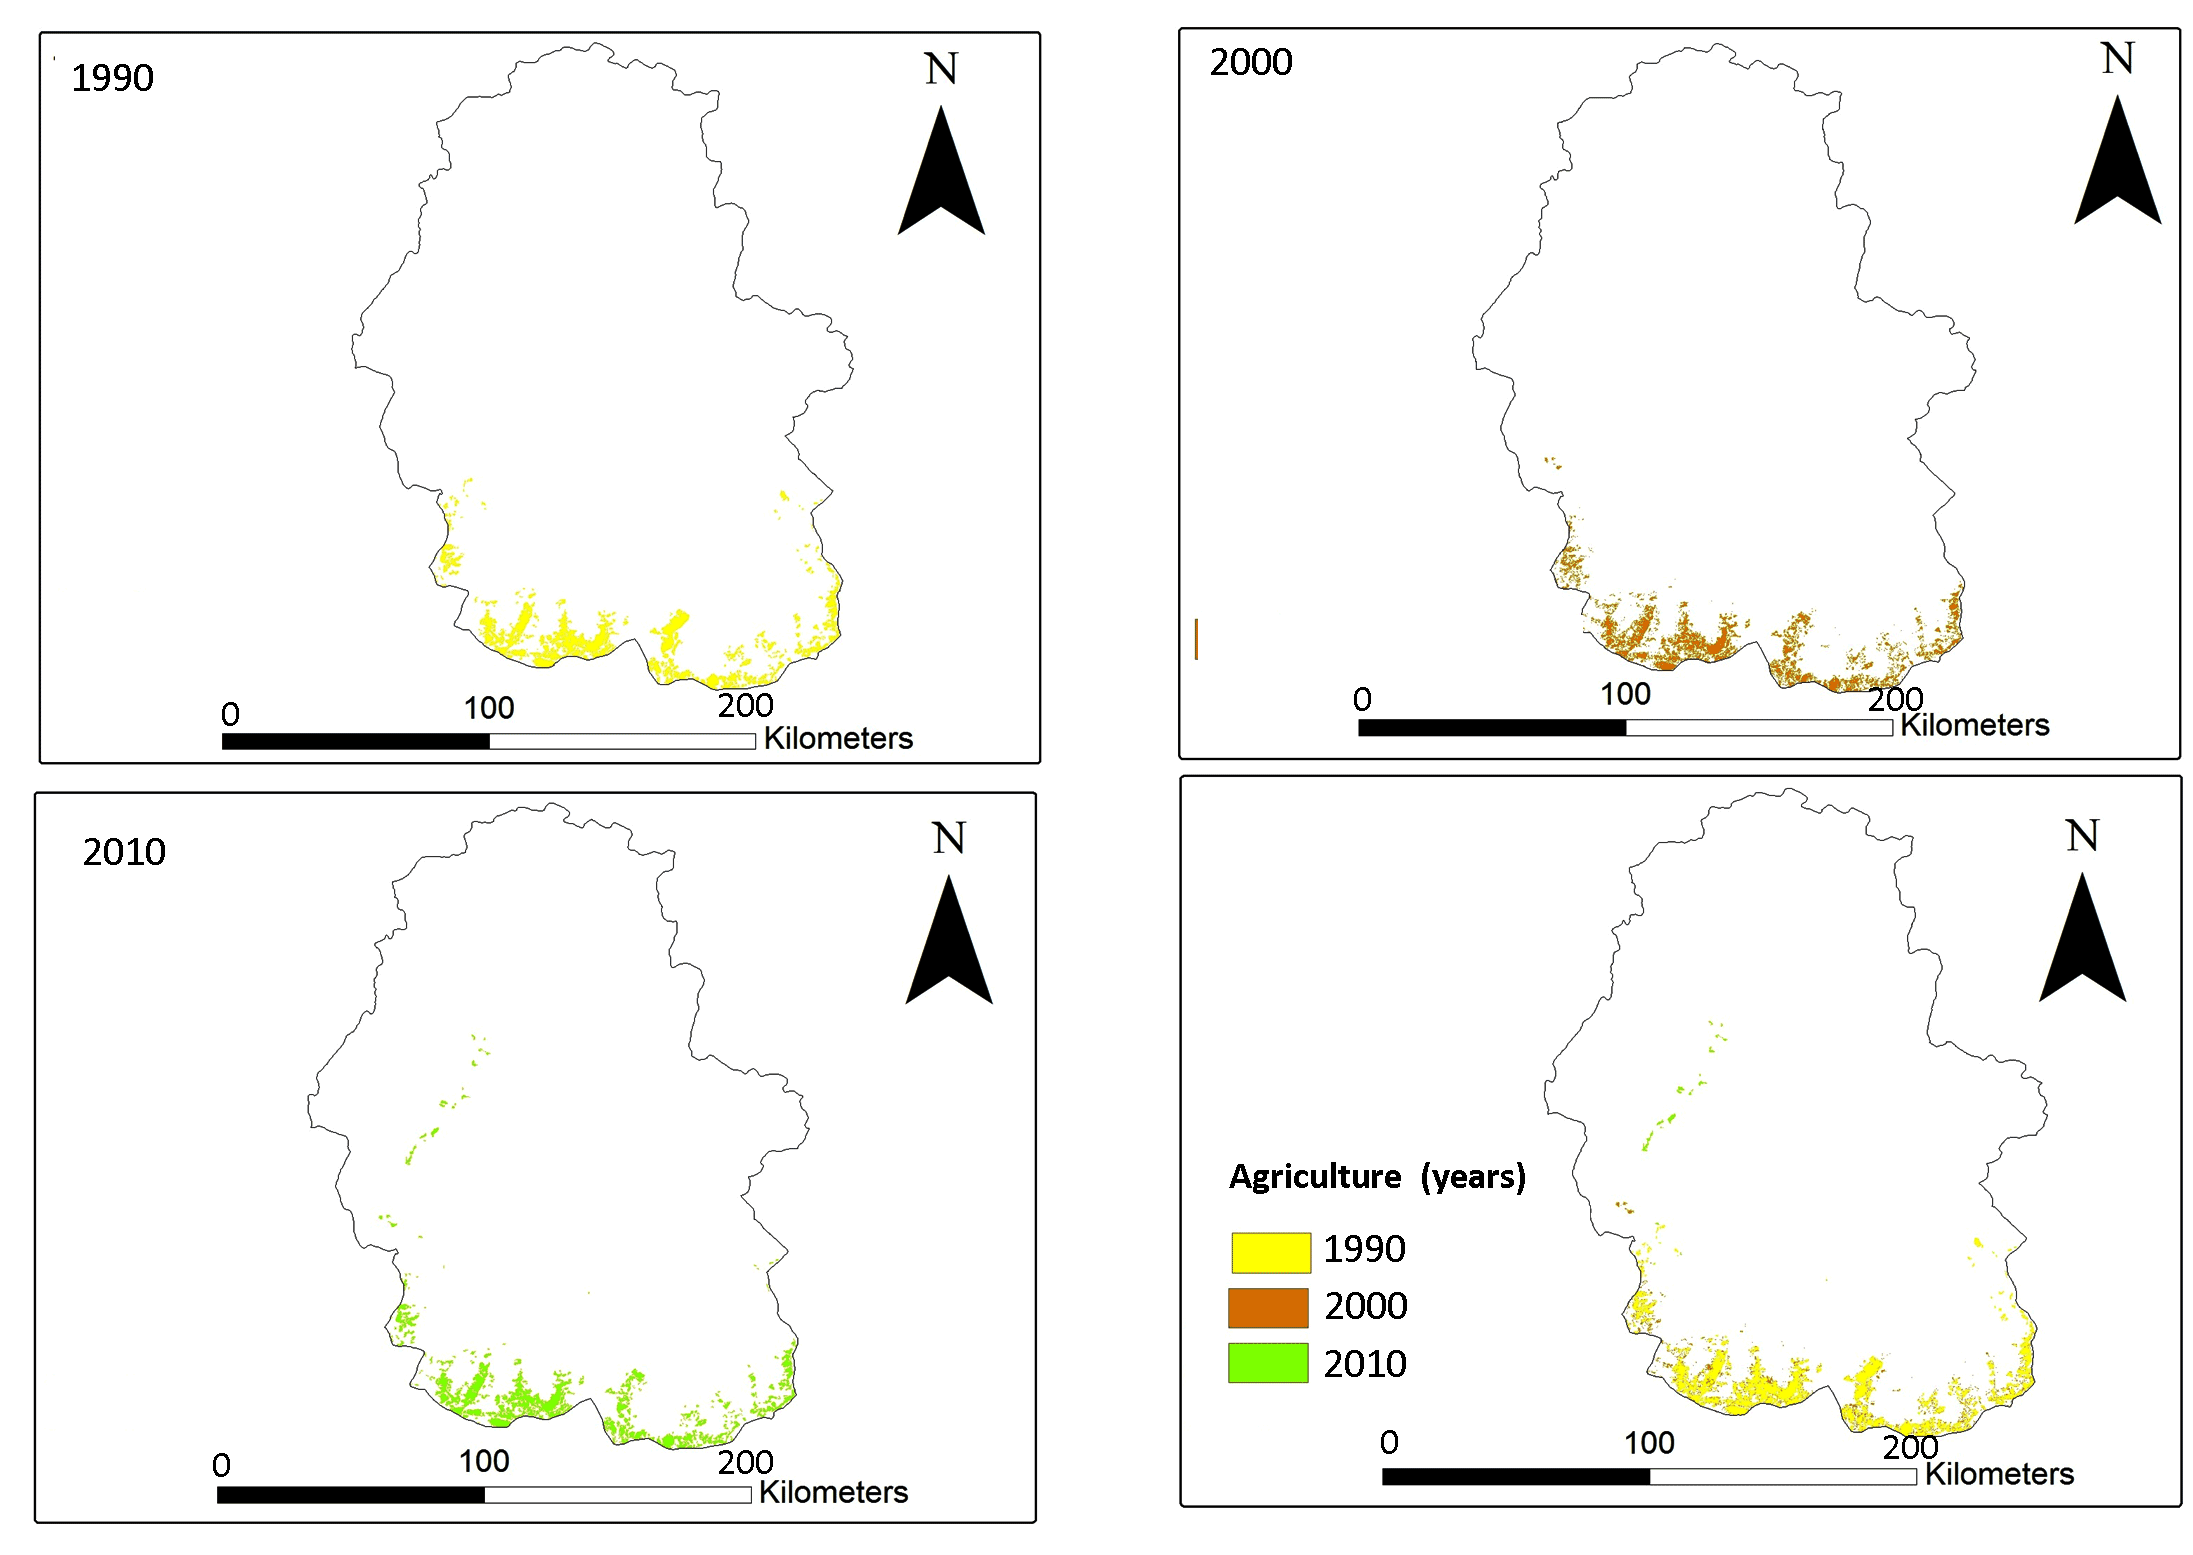
The area of each LULC category for each study year is shown in table 2. The bare area in 1990, 2000 and 2010 shows (46.48%, 33.96%, and 42.95%) 3549.25, 2592, and 3227.41sq.km, respectively. The bare area decrease from 1990 to 2000 steadily and again slightly increases in 2010 compared to 2000. Similarly snow cover area also varies significantly in 1990, total snow cover was (19.92%, 32.97%, and 25.30%) 1519.45sq.km while increasing to 2457.38sq.km in 2000 and slightly decreasing to 1930.43sq.km in 2010. A similar pattern was observed in shrub land too (2.3%, 3.7%, and 2.6%). In 1990 total cover area were 175.89sq.km, 285.64 in 2000 and slightly decreasing with 202.78sq.km in 2010. Forest cover was 1029.76, 991.980, and 1114.42sq.km, in 1990, 2000 and 2010, respectively which indicate decreasing in 2000 compared to in 1990 and again increasing in 2010. At the meantime agriculture area especially in the Southern part of the conservation area shows to some extent decreasing trend (2.53%, 2.51% and, 2.35%) with 193.35, 199.07 and 179.33sq.km, while grassland was (14.80%, 14.32%, and 12.42%) with 1029.758, 862.9182, and 936.0486sq.km correspondingly in different time series as shown in figure 3 and values are listed in table 2. Figure 3, 4, 5, 6, 7, 8, and 9 show resultant maps prepared from changes in LULC from 1990 to 2010.
Table 2. Land Use Land Cover
|
Years
|
Water body
|
Snow cover
|
Shrub cover
|
Grassland
|
Forests
|
Bare area
|
Agriculture
|
|
1990
|
30.185
|
1519.45
|
175.82
|
1130.76
|
1029.76
|
3549.24
|
193.35
|
|
2000
|
11.005
|
2457.38
|
285.64
|
1092.12
|
991.01
|
2592.31
|
199.07
|
|
2010
|
26.466
|
1930.43
|
202.76
|
948.049
|
1114.42
|
3227.41
|
179.33
|
3.2 Normalized Difference Vegetation Index (NDVI)
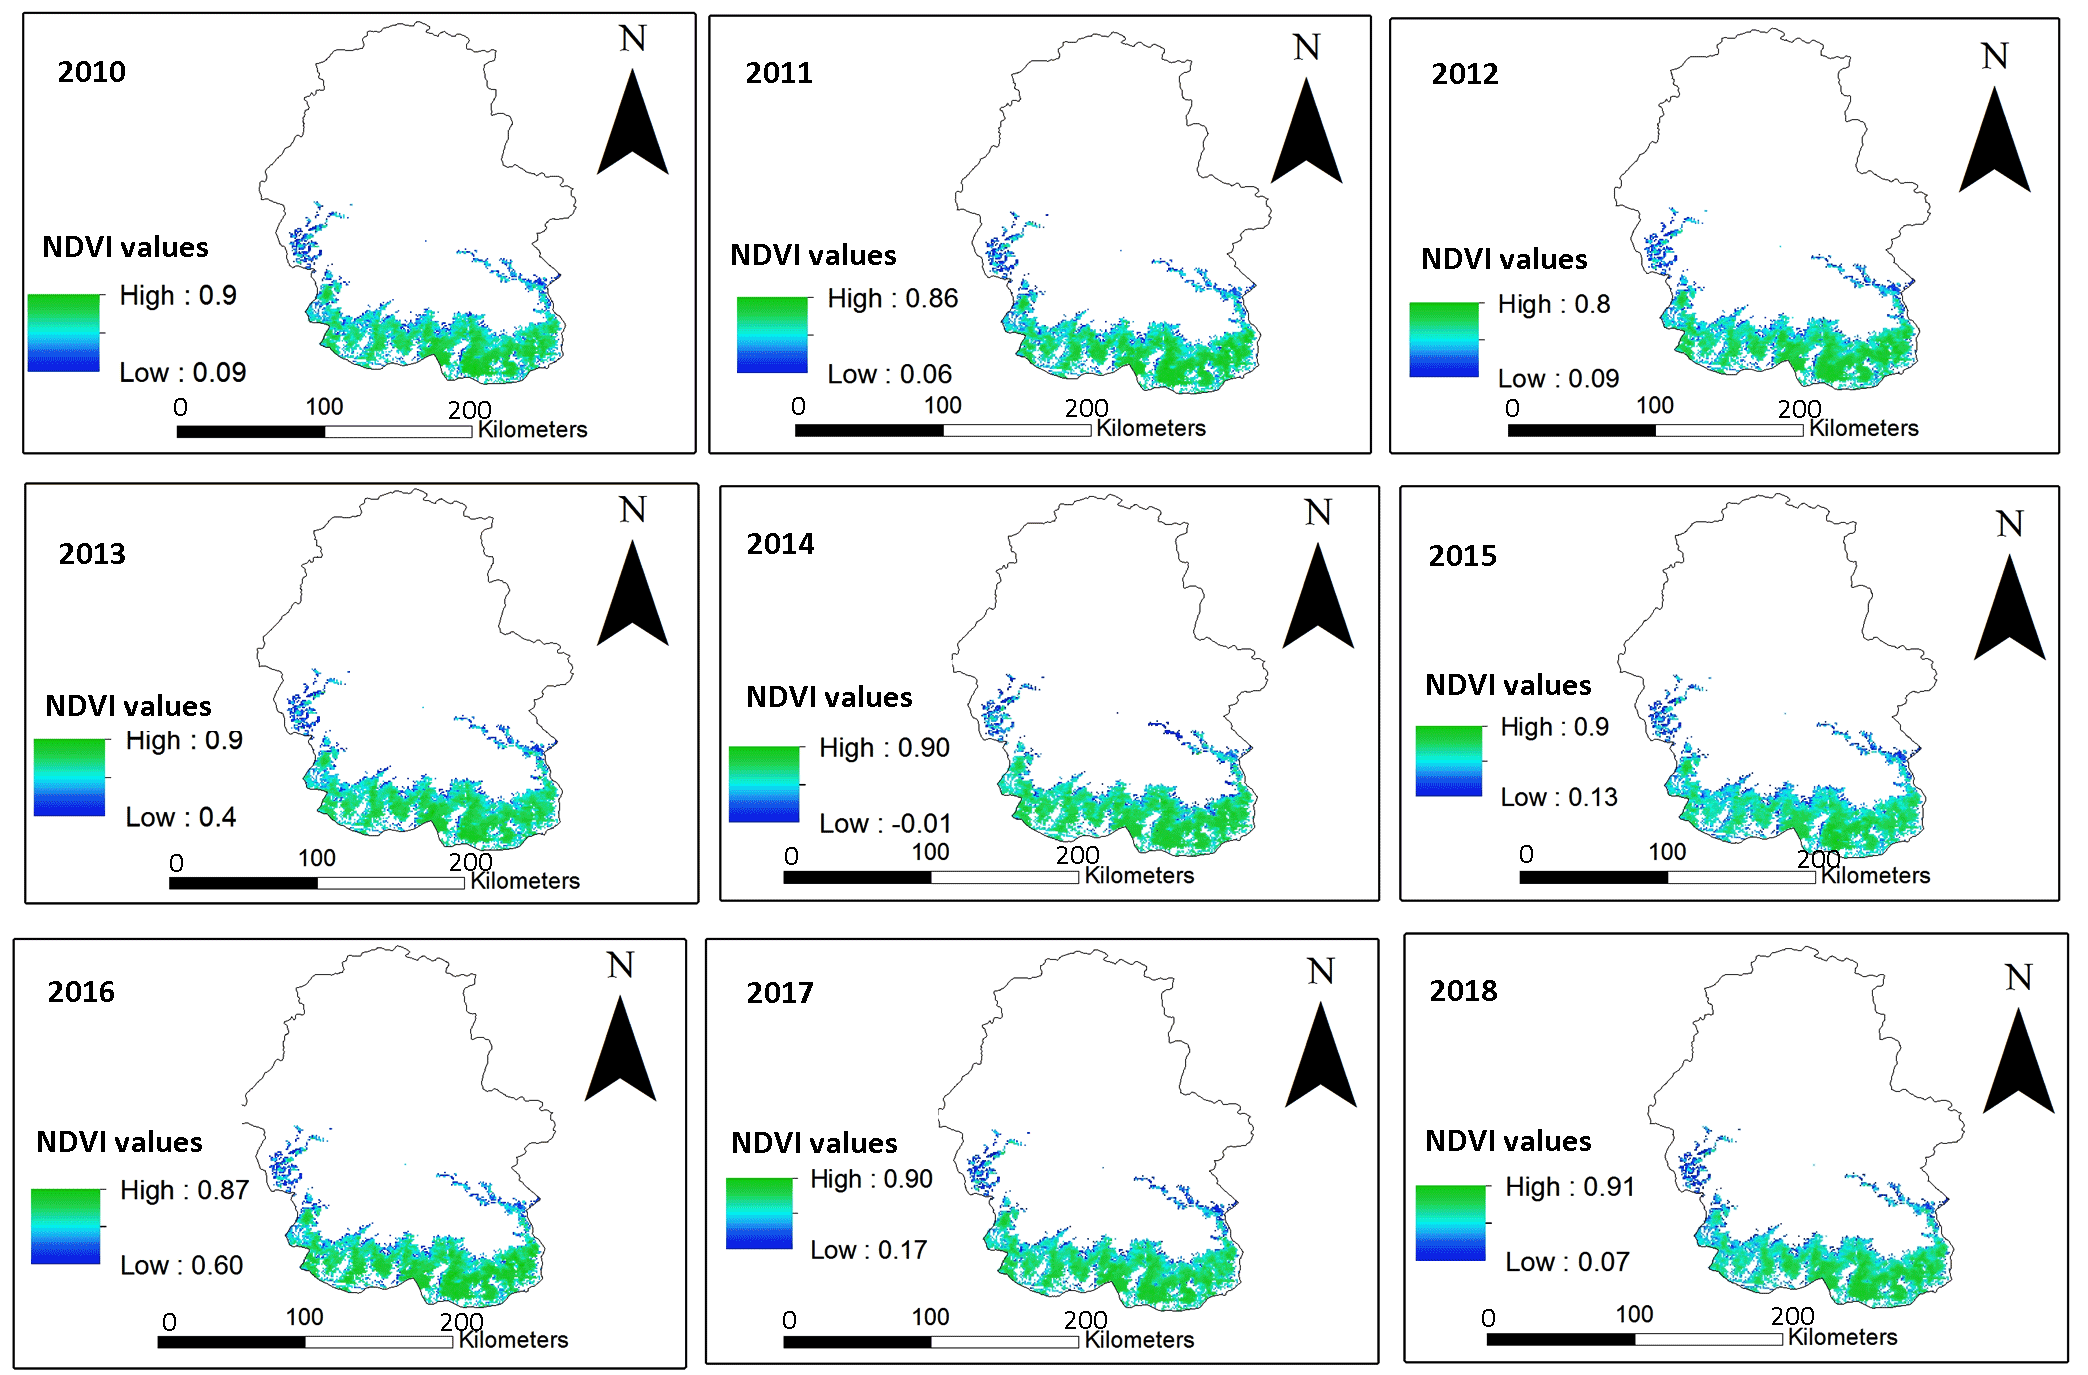
The values were categorized into discrete classes by slicing range of NDVI values into four different ranges by fixing the thresholds with following natural break method. A similar analogous step was followed for all different time series year image as vegetative and forest area only classified with different ranges values. A quick examination of pseudocolor images of NDVI and classified output of NDVI images divulge that along with the water bodies, snow and built-up, barren land yield towards negative values. Similarly, the vegetative areas to forest area yield towards the positive values. This method is applied for the comparison of land and vegetation cover change from multiple dates vegetation index (NDVI). NDVI values indicate the status of vegetation in the study area and were classified into: no vegetation, less vegetation, moderate vegetation, and dense vegetation. NDVI changes in vegetative area indicate the status of grassland, forest land and agriculture in different time periods. The annual NDVI values ranging from 0.9 to 0.5 and 0.8 to 0.4 (Table 3) in the different year show the Southeastern and Southwestern parts of the ACA have high dense vegetation than other parts of the region (Figure 10).
Table 3. NDVI values
|
Years
|
Values
|
Study area
|
Vegetative area
|
Forests
|
|
2010
|
High
|
0.9
|
0.90
|
0.90
|
|
Low
|
-1
|
-0.03
|
0.09
|
|
2011
|
High
|
0.8
|
0.88
|
0.86
|
|
Low
|
-1
|
-0.7
|
0.06
|
|
2012
|
High
|
0.8
|
0.88
|
0.80
|
|
Low
|
-1
|
-0.05
|
0.09
|
|
2013
|
High
|
0.8
|
0.90
|
0.90
|
|
Low
|
-1
|
-0.06
|
0.40
|
|
2014
|
High
|
0.9
|
0.90
|
0.90
|
|
Low
|
-1
|
-0.01
|
-0.01
|
|
2015
|
High
|
0.9
|
0.90
|
0.90
|
|
Low
|
-1
|
0.01
|
0.13
|
|
2016
|
High
|
0.8
|
0.90
|
0.87
|
|
Low
|
-1
|
-0.01
|
0.60
|
|
2017
|
High
|
0.8
|
0.90
|
0.90
|
|
Low
|
-1
|
-0.03
|
0.17
|
|
2018
|
High
|
0.9
|
0.91
|
0.91
|
|
Low
|
-1
|
-0.02
|
0.07
|
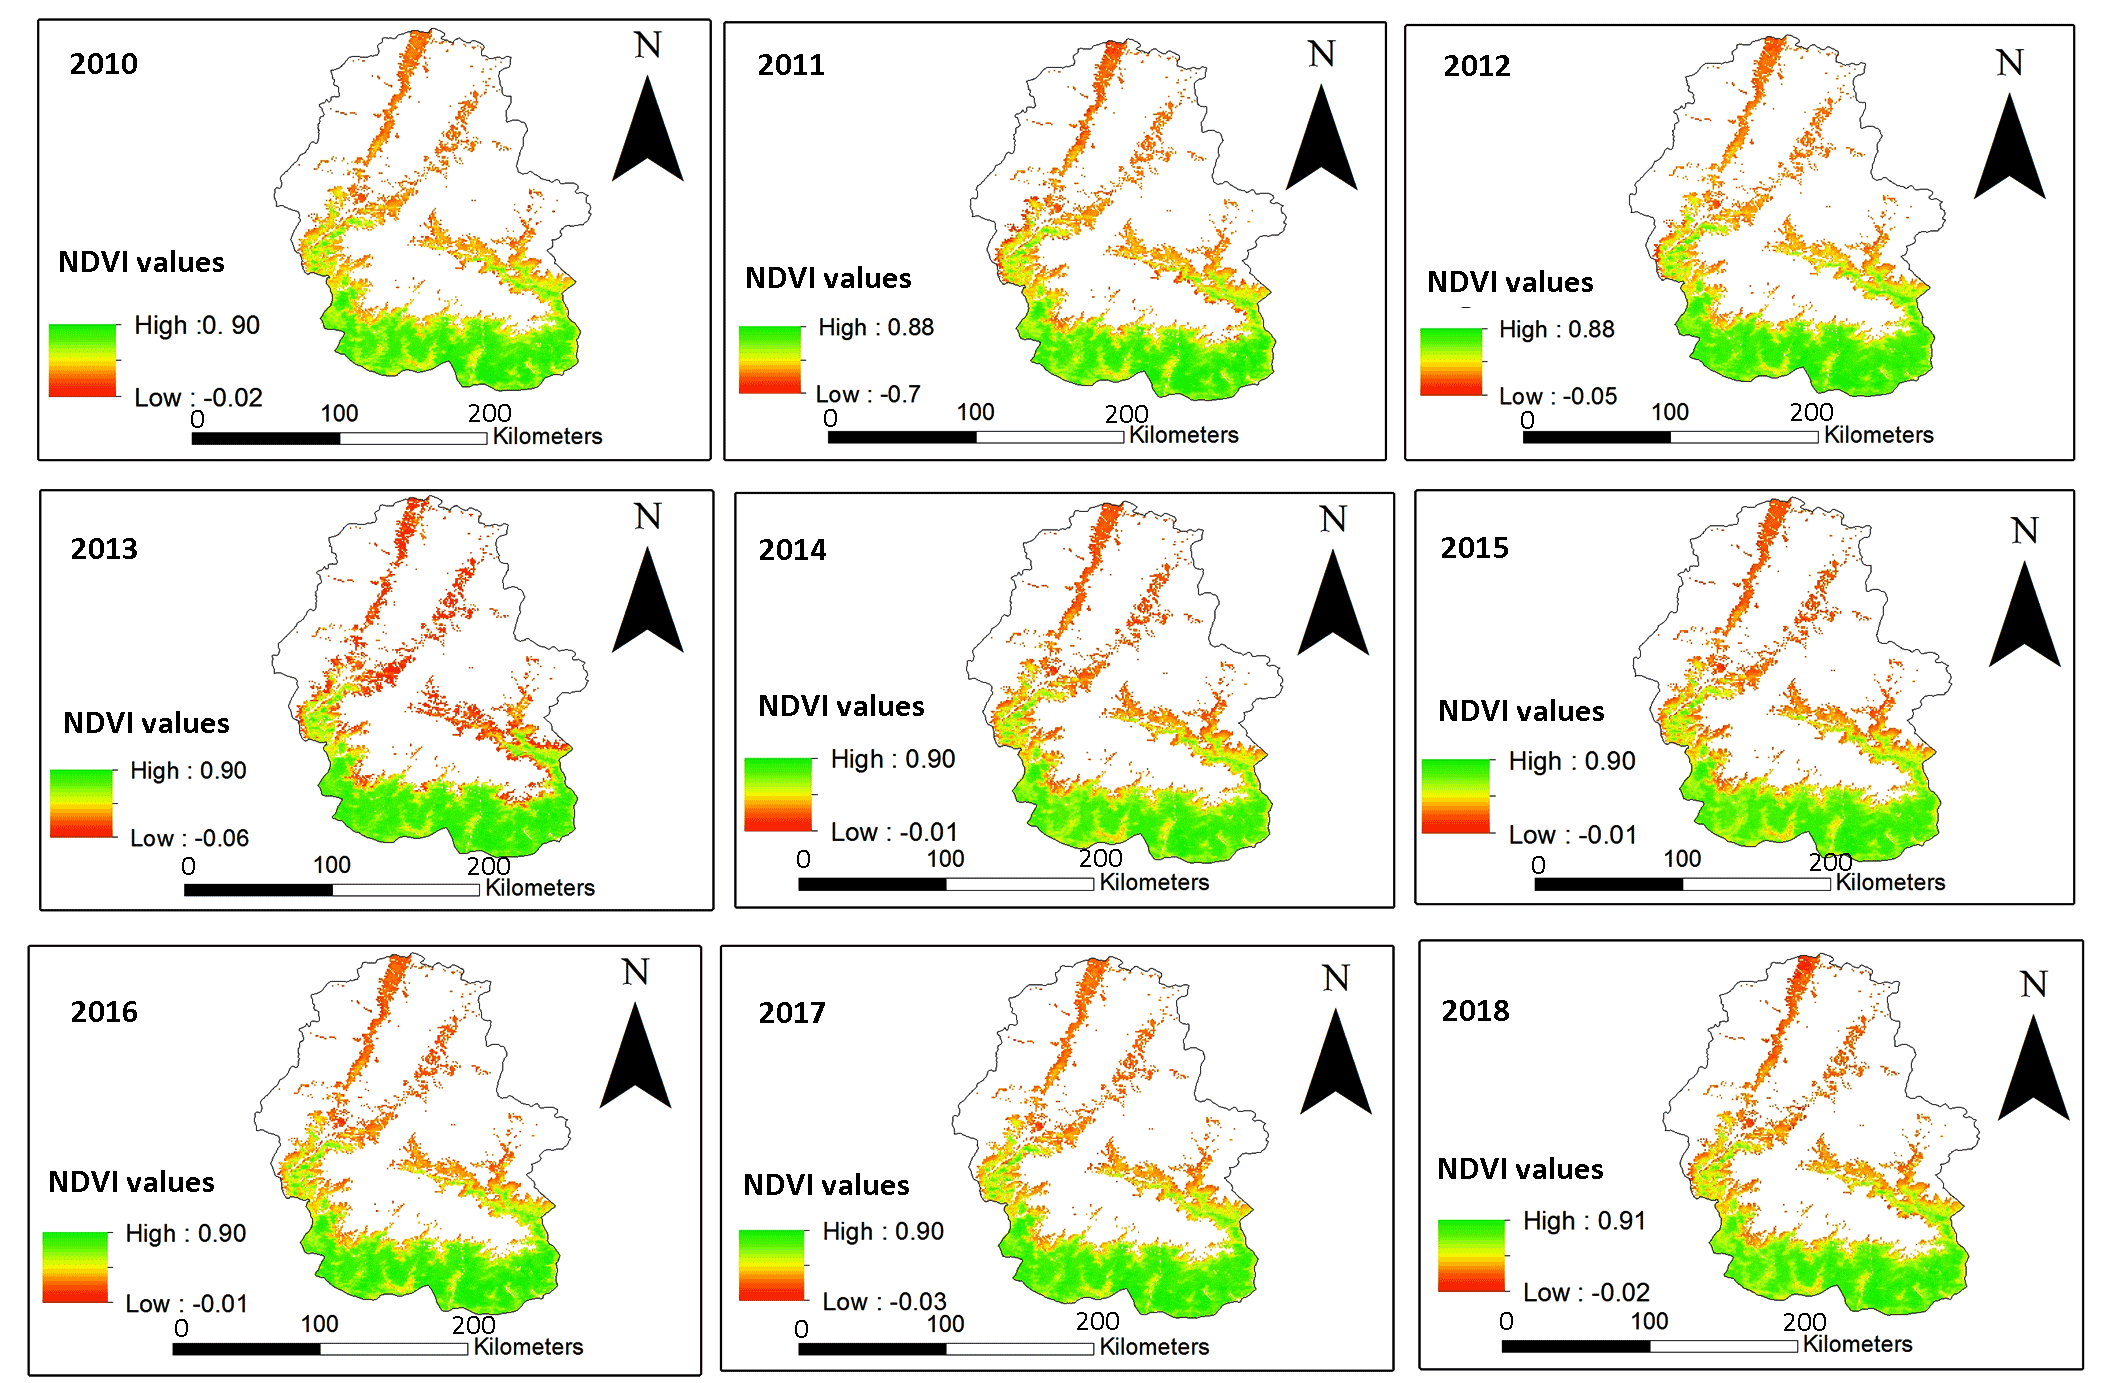
Similarly in the upper Northern part of the region have very low and negative NDVI values (0.1 to 0.5 indicate the moderate types of vegetation while less than 0.1 to -1 which indicate the region have grassland with predominated by barren land and snow cover, figure 10 illustrate variation of annual NDVI in different time period in vegetative area. Annual NDVI values in the vegetative area vary in different time periods. In the case of forest area, NDVI value (0.9 to 0.09) was observed in 2010 indicating the dense forests in the middle Southwestern part and less dense forest in the upper Southern part. A similar pattern was observed with low NDVI values decreasing to 0.06 in 2011. Values between 0.8 and 0.09 were observed in 2012. In 2013, the higher values were constant with increasing the lower values of NDVI compare to earlier year with 0.4. In 2014, the lower NDVI values sharply reduce to -0.01 indicating the stress status on some forest area within the study area. In the years 2016, 2017 and 2018, the highest and lowest NDVI values were 0.87 to 0.60, 0.90 to 0.17, and 0.91 to 0.07, respectively indicative of slight fluctuations on forest status.
Variation of different land cover types in different time series with similar fluctuations was observed in NDVI too (Figure 11).


 ,
Chungla Sherpa 2
,
Chungla Sherpa 2