1.Department of Geomatics Engineering, School of Civil Engineering and Architecture, Adama Science and Technology University, Oromia, Adama, Ethiopia,1888.
Topographic Position Index (TPI) algorithm is useful for automated landform classification, measurement of the topographic slope positions and studying the several characteristics of elevation values.
Topographic slope positions and landform classifications can be automated and measured by employing the Jenness algorithm based on the Set of Rules in the TPI.
SRTM DEM and Landsat 8 OLI datasets were used for analysis of landforms and LULC.
The built-up area and agriculture are covering most of the landform classes.
Cross section and longitudinal profiles on different elevation intersection give realistic understanding of the terrain.
TPI algorithm is useful for monitoring of floods, agricultural activities and urban development.
Abstract
Topographic Position Index (TPI) algorithm is useful for landform classification using Digital Elevation Model (DEM) to identify upper, middle and lower parts of the landscape. Topographic slope positions and landform classifications can be automated and measured by employing the Jenness algorithm based on the Set of Rules in the TPI. Adama Wereda in Ethiopia has been selected to study the different landforms classified using DEM (30m resolution) and Landsat 8 OLI data. Spatial statistics and GIS applications were also used to distinguish the geomorphologic properties of DEM. Adama Wereda encompasses 2.15% of the valley, 33.79% of flat lands, 15.85 % of lower slope, 33.07% of average slope, 12.85% of upper slope and 2.24% of ridges. Nine land use and land cover (LULC) classes, specifically rocky terrain, built up area, forests, water bodies, roads, agriculture, barren land, hill/mountain and fallow land have been analyzed. Landforms of Adama Wereda are ranging from large-scale features such as plains and mountain ranges to minor features such as hills and valleys. The built-up area and agriculture are covering most of the landform classes. U shaped valley was observed in water bodies. The various classifications of TPI and landform can be used in precision agriculture, land-use alteration studies, etc.
Keywords
Digital Elevation Model , Topographic Position Index , LULC , Landforms , Remote Sensing , Landsat , SRTM
1 . INTRODUCTION
Topographic Position Index (TPI) algorithm is useful for automated landform classification, measurement of the topographic slope positions and studying the several characteristics of elevation values within the study area. According to Amatulli et al. (2018) TPI is defined as the variation between elevation of a central cell and its eight neighboring cells mean. Features like ridges, valleys and flat areas represent as the range between positive, negative and zero cell values, respectively. TPI is useful for timely and speedy analysis of landforms. Nevertheless, the results become widely significant on inclusion of geological parameters into the data. Furthermore, quantifying and grouping of geological parameters and age of formation might lead to confusing results. These weaknesses can be eliminated by employing the quantitative methods of geological information and automated landform analysis. Therefore, cross section and longitudinal profiles of Adama Wereda were carried out with incorporating DEM and Land use land cover (LULC) classes.
Landforms are distinct geomorphic surface features vary from large-scale to individual minor features such as plains, mountain ranges and hills, valleys (Jacek, 1997). Human intervention makes notable impressions on landforms through activities like depleting lakes, swamp areas, flooding lowlands, massive grading operations and diverting rivers (Anderson, 2018). Researchers in China (Tang et al., 2014) have been analyzed landforms using elevation ranges as: plain area (<500m), hills (500 to 1000m) and mountains (>1000m) whereas in United Kingdom and USA, elevation >300m is categorized as mountains and on the other hand in continental Europe, an elevation closer to 900m defined as peak (The Gale Group, 2002). Furthermore, comparative relief method was used in continental regions of Europe was analyzed landforms as low plain, high plain, hill plain, hill, low mountain, or high mountain for elevation ranges of 30m, 75m, 300m, and 600m, respectively (Kramm, 2017; Cai, 1986). However, this method still has some drawbacks when used for decision making, and it hardly portrays the morphologic characteristics of landforms (Zhao and Deng, 2015). In the last decade, large numbers of alternative and modified classification methods were used. Brabyn (1996) has modified the classification system and in spite of various landforms grading systems with “crisp, unambiguous boundaries”, fuzzy classification methods introduced by Schmidt and Hewitt (2004). Different landform types mostly differ firmly in their sizes. Guisan et al. (1999) have developed the Topographic Position Index (TPI). Landform classifications establish the spatial pattern of various factors linked with agronomy and water quality, including soil water distribution (Hawley et al., 1983), surface runoff generation (Needleman et al., 2004). Soil nutrients typically amended through fertilization, and crop yields (Evans et al., 2016). The objective of the research is landform classification by TPI method as well as evaluation of the method with ground truth data in Adama Wereda. Landforms are required to architects because they frequently fix estimable problems on the location, intensity, and nature of urban development. For instance, in some places, it is challenging or costly to build due to steep slopes, mounting rock, or the proximity of water bodies. In some other regions, it is significant to construct due to the existence of natural hazards such as flood, landslide, earthquake or erosion (Anderson, 2018). On the other hand, landforms frequently distinguish possibilities because they may show the most suitable locations for urban expansion, expanses ideal for the exploitation of natural resources (through agriculture, quarrying and arboriculture), or areas where the physical features are of ecological interest or cultural value that they should be preserved (Anderson, 2018). Flood in the study area is the potential risk for agriculture and city administration in last few decades, and flood protection structures had been done however that was not enough to control flooding. Based on the observation and interview of the concerned sectors, still, the city administration office and Adama Wereda Agriculture and Natural Resource Office have the problem of well-organized landform classification map of the study area. Moreover, as per the review of literature conducted for in and around Adama Wereda, there is no landforms classification map of the study area. Therefore, implantation of landform classification maps during flood control, agricultural activities and urban development faced a gap due to lack of landform classification map of the study area.
2 . STUDY AREA
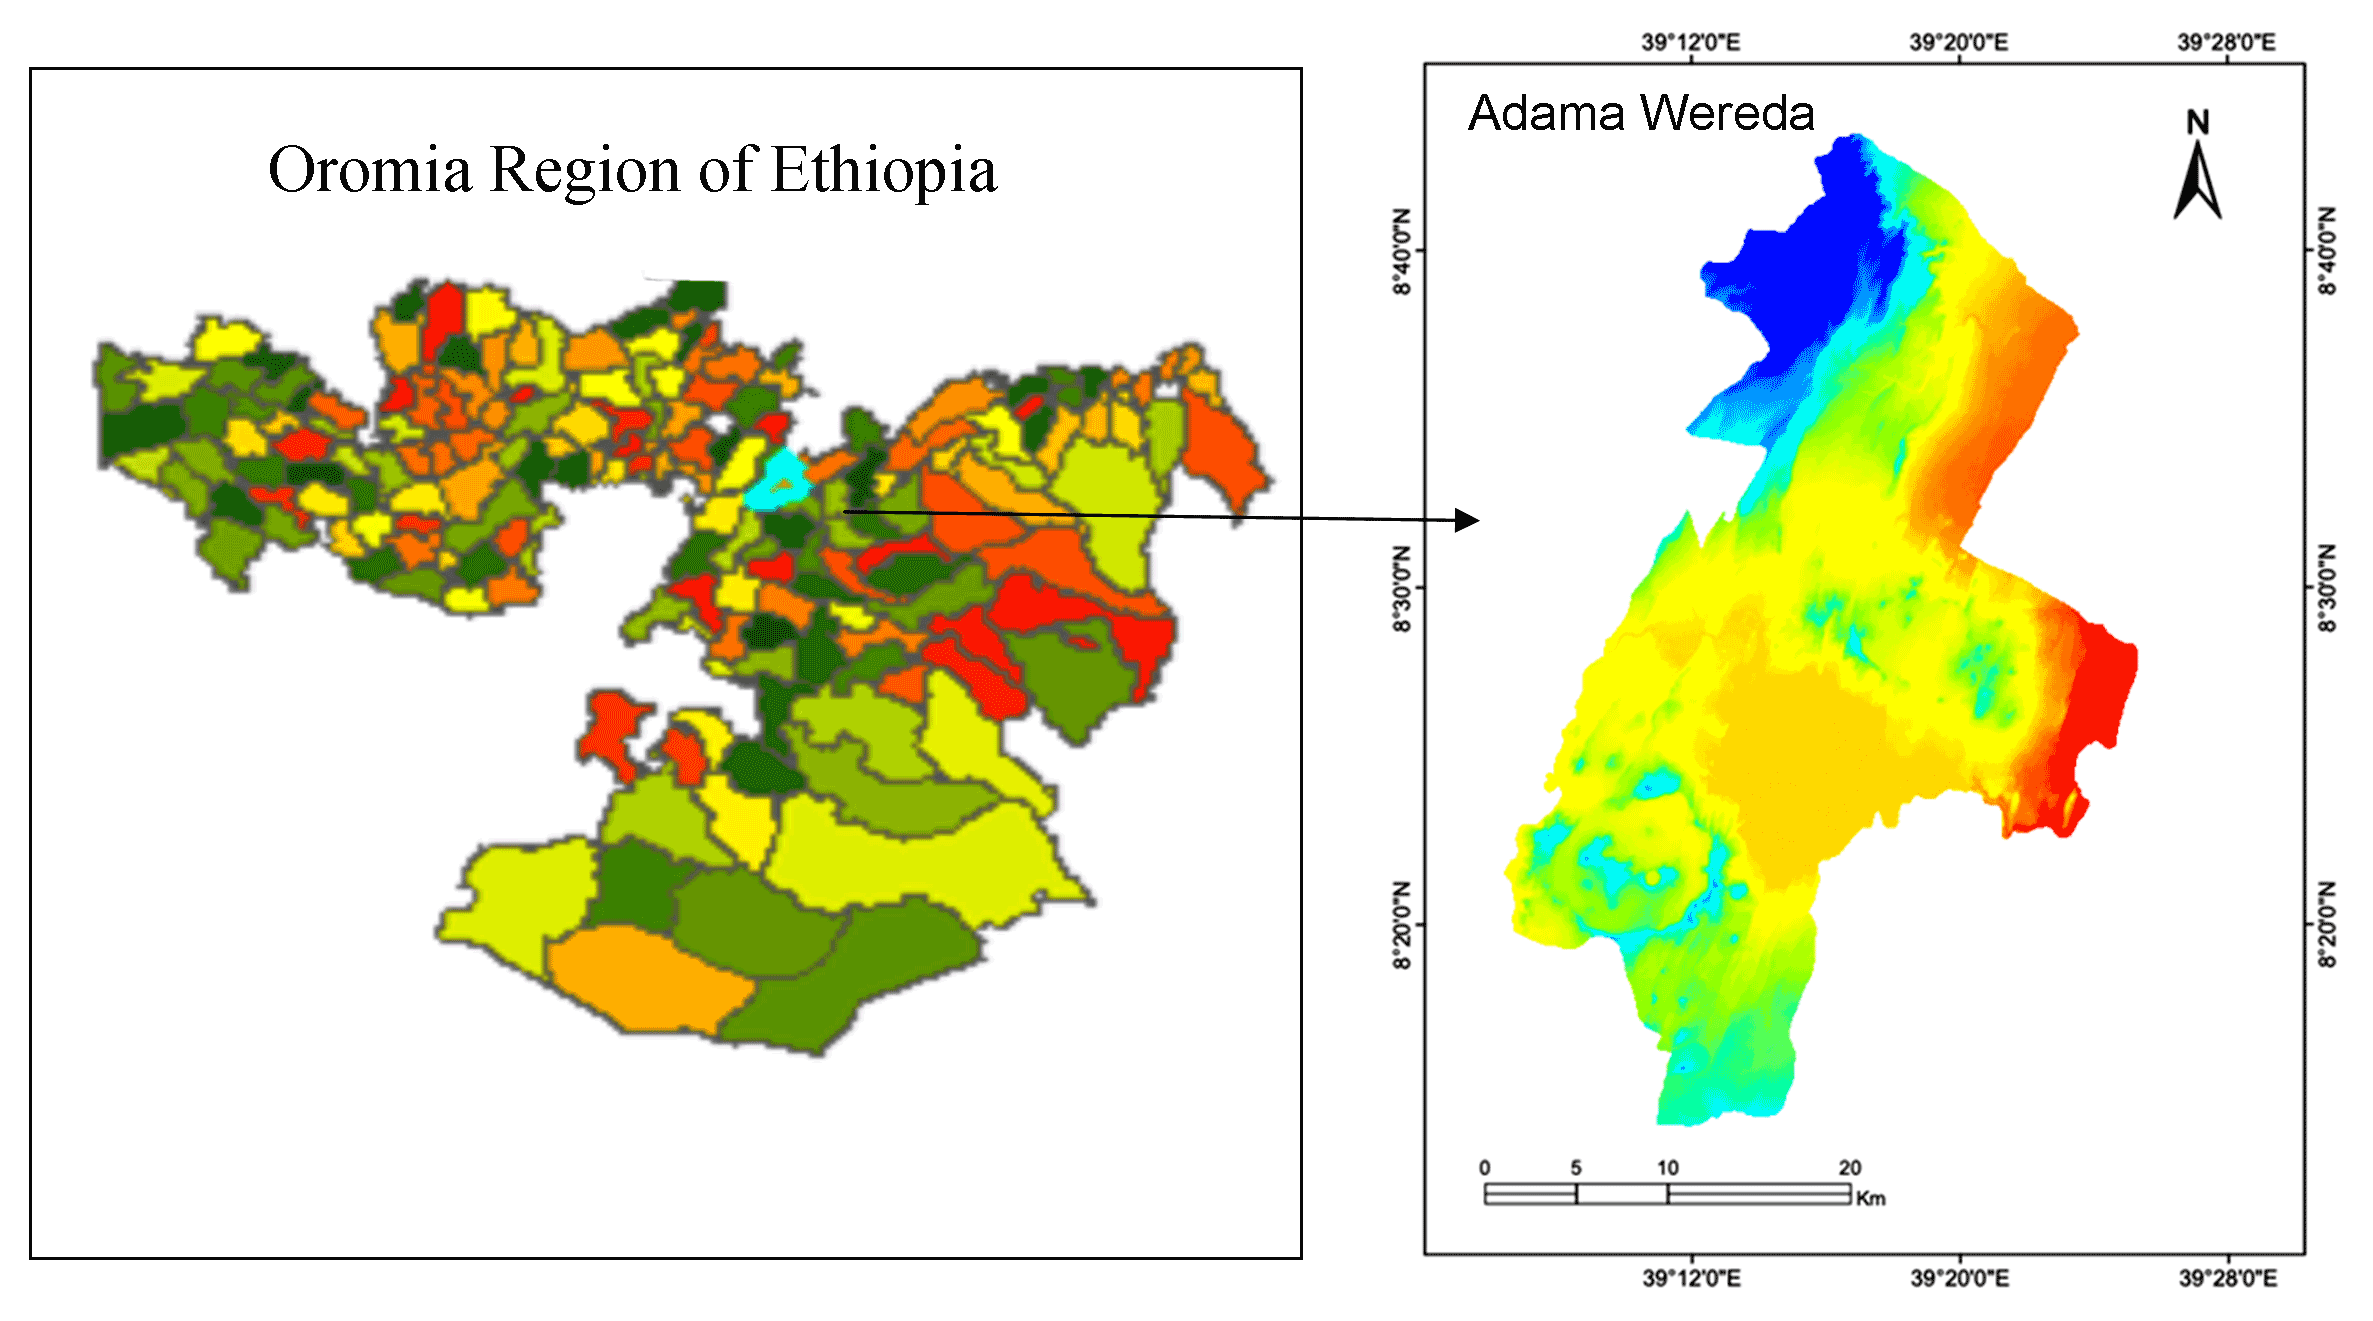
Adama is in the Oromia Region of Ethiopia. The land use practice in the watershed is characterized as agriculture, built-up area, and water bodies. The elevation ranges from 1341 to 2442m from Mean Sea Level (MSL) which has provided habitat of sub-tropical species of vegetation. The area has rich biodiversity. Part of the East Shewa Zone located in the Great Rift Valley. Adama Wereda (Figure 1) is bordered on the South by the Arsi Zone, on the Southwest by Koka Reservoir. It is separated by Dugda Bora, on the West by Lome, Amhara Region on the North, and East by Boset; the Awash River, the only famous river in this Wereda, defines the Wereda boundaries on the East and South. Mermersa and Galdia Watersheds are located between 8º 28ʹ3.77"N to 8º 44ʹ 33.39"N and 39º14ʹ 36.87"E to 39º 27ʹ 43.87"E.
Figure 1. Study area: Adama Wereda in Ethiopia
Adama is a rapidly growing town. The town has population of 220,212 , an increase of 72.25% over the people recorded in the 1994 census, with a total area of 29.86sq km. It has population density of 7,374.82; all are urban inhabitants. It has been subdivided into 14 urban Kebele (least administrative structure) administrations. The total area of Adama is 200km2 and has an oval shape. The altitude of the city land is 2600-3230 meter above sea level. The climate of Adama is generally characterized as tropical with its temperature intensified by the topography of the Rift Valley. The months with the highest mean rainfall are July, August and part of September locally identified as the wet season. The mean average rainfall of the city is 900-1300mm. The monthly mean maximum temperature occurs in April and May; the minimum is in November and December. It receives the mean average annual temperature of 15-25 ºC. The prevailing wind direction is from Northeast to Southwest, and primary constraints for the physical expansion of the city are the existence of steep slope in the West, Northwest, North and South peripheries. Clay soil is the major soil type in the area. The significant constraints for the physical expansion of the city are flooding (natural) and illegal settlement (humanmade). The soil type is also important factor that decides the degree of erodiblity. In the study area Vitric camisoles, Orthic luvisols, Orthic luvisols, haptic aerosols, etc. are classified under the less eroded soil. Eutheric Nithosols, Aerisols, Leptisols, Haptic aerosols soils are found to be more eroded.
3 . MATERIAL AND METHODS
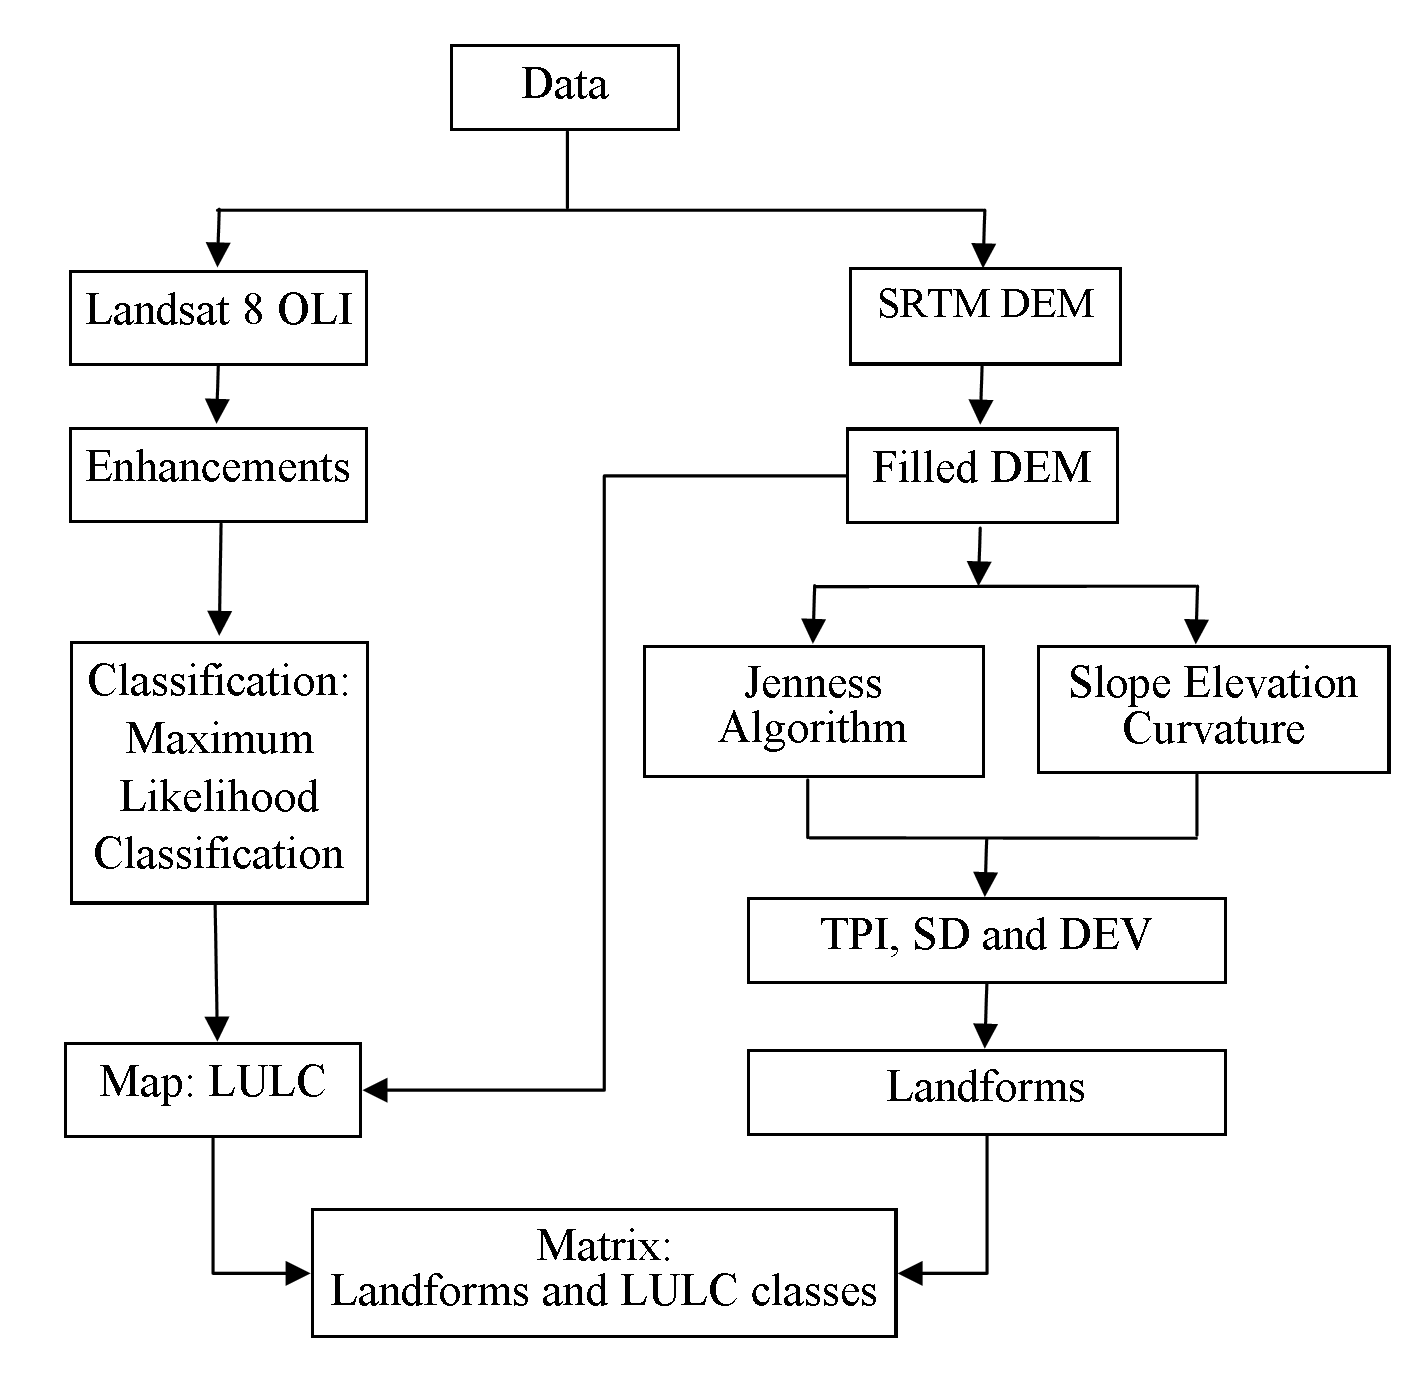
The objective of the study is to prepare a landform map based on Topographic Position Index (TPI) in Adama Wereda based on 1) landform classification and 2) cross-tabulated landform and LULC classes (Figure 2).
Figure 2. Methodology
3.1 Elevation Data
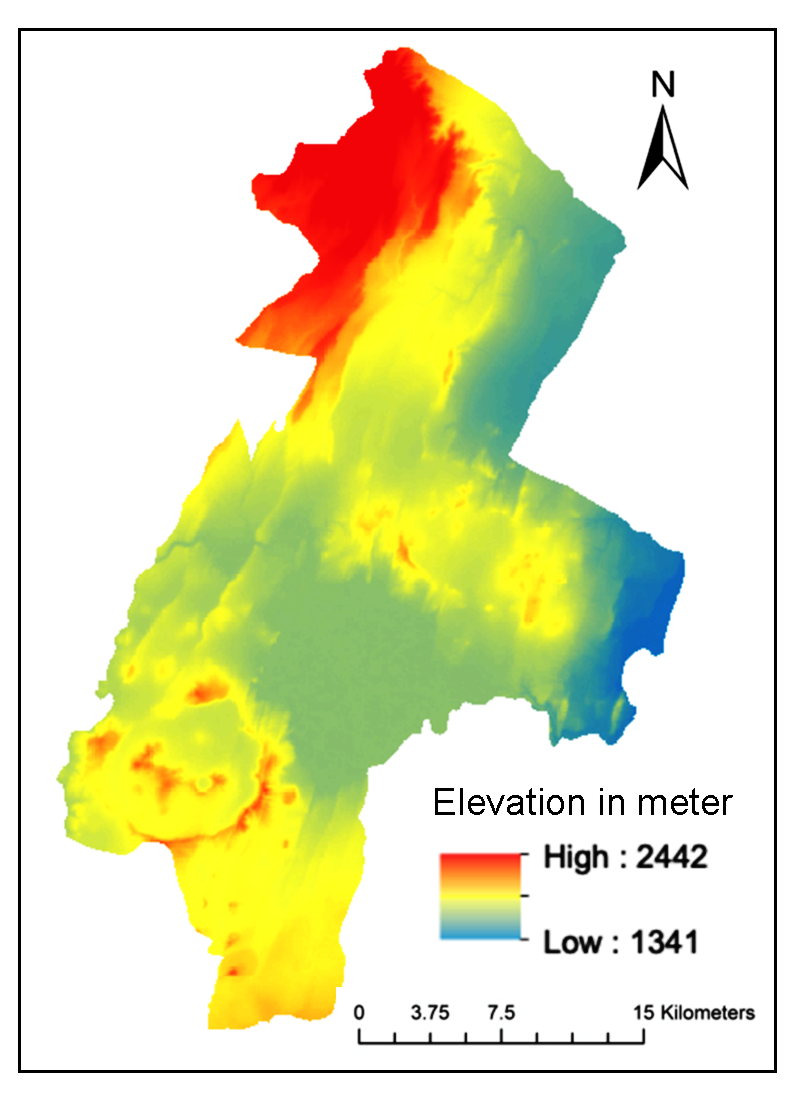
A high-resolution SRTM DEM (30m) data Figure 3 was used for the study (Werbrouck et al., 2011). The primary task was to analyze the terrain information that gives the continuous point information of altitude position. Therefore, the different zones have been categorized to figure out the landforms in diverse topographic nature of Adama Wereda. Moreover, the same raster elevation data were used for the calculation of other terrain parameters for the analysis. A Fill Sink map was also created; the Fill Sink process eliminates local depressions from DEM by substituting certain depressions by flat areas in the output.
Figure 3. Digital Elevation Model
3.2 Slope Analysis
The filled DEM was used to generate a slope map using spatial analysis tool. The slope has found 0 to 37- degree values in the study area which further classified into three classes: flat (0-5), gentle slope (5-10), steep slope (>10).
About 74% of the study area (Table 1) is flat, 45.6% is gentle slopped (156 km2) and 9.75% (97.45 km2) is steep slopped. The steep slopes are seen very close to the stream as depicted in Figure 7.
Table 1. Slopes
Slopes (º)
Area
Km2
%
Flat (0º to 5º)
745.71
74.62
Gentle (5º to 10º)
156.13
15.62
Steep (>10º)
97.45
9.75
3.3 TPI
TPI is the variation of elevation between the central point (Zo) and the mean elevation (Z) around it (equation (1)) within a predefined radius (R)
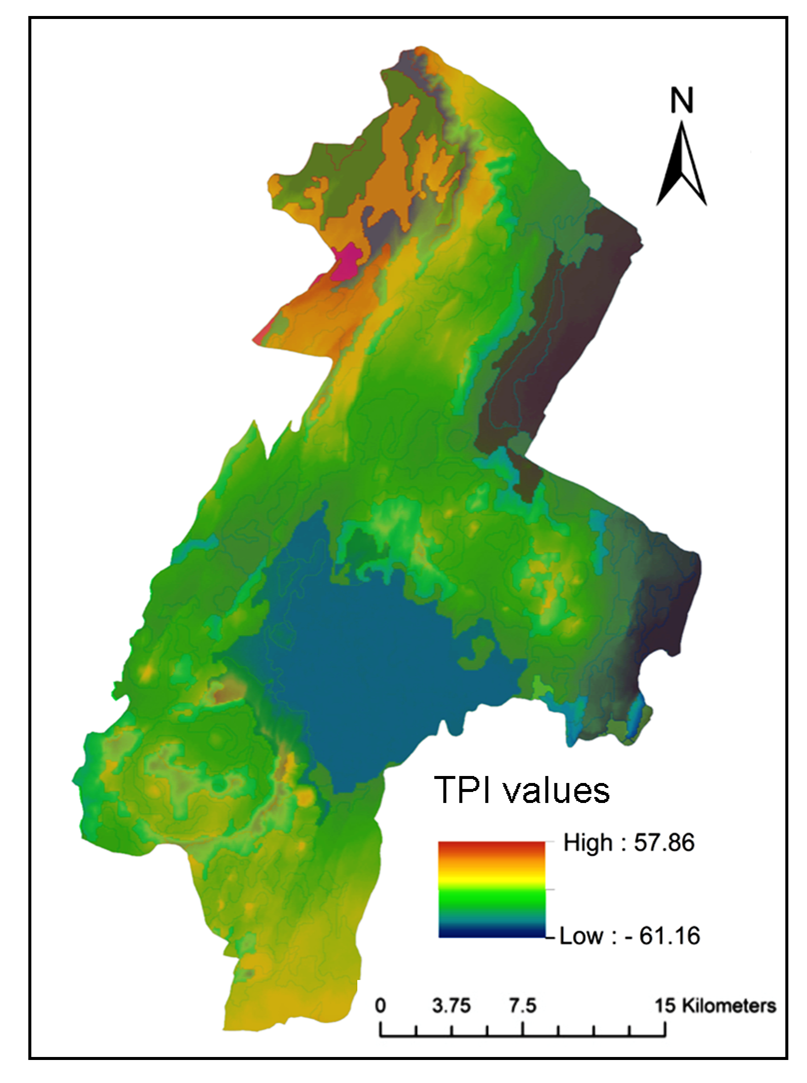
(Guisan et al., 1999; Wilson and Gallant, 2000). Positive and negative values of TPI designate that the midpoint is positioned higher than its average surroundings and the midpoint is inferior to the average, respectively. The values of TPI (Figure 4) depend on both elevation and R (Grohmann, 2017). Dominant landscape feature has higher R values than the minor landscape units such as valley and ridges.
TPI values were also used to analyze the landscape into slope position groups. This organization is managed by how high the TPI values are and by the slope at a specific point. High TPI values are seen at the hill peaks, while low TPI values in valley beds. TPI values near to zero on either at the ground or somewhere mid slope (Skentos, 2018).
Figure 4. TPI values
Figure 5. Standardized Elevation TPI
3.4 Classification
Topographic Position Index (TPI) (Guisan et al., 1999) was used in the Adama Wereda and further improved as stated by Guisan et al., (1999) and Jenness (2004). TPI measures the elevation of each cell (equation (2)) in a DEM by measuring the mean height of a specified neighborhood target cell. Then, the mean elevation is subtracted from the elevation at the center. Landform classification was based on TPI as.
\(M_0\) = elevation of the model point under evaluation,
\(M_n\) = elevation of the grid,
\(n\) = the total number of surrounding points employed in the evaluation.
3.5 DEV
DEV (equation (3)) is used to measure topographic position from the central cell (Zo) using TPI and the standard deviation of the elevation (SD) (equation (4)) (Wilson, 2012). DEV determines the topographic position as a division of normalized relief to bounded surface roughness. The values DEV ranges between +1 and -1 and costs outside this limit may be designated an error within the DEM. The positive and negative values of DEV indicate that the central point is higher or lower than the adjacent cells, respectively.
TPI and DEV were measured using the statistical focal neighborhood operators from 20 sample cells of radii up to 2500m with a 100m interval in ArcGIS 10.5 and by using Jenness ArcGIS extension written in the Avenue programming language.
3.6 Land Use and Land Cover
A cloud free (Athick and Hassan, 2016) Landsat 8 OLI (2019) satellite image captured at 30m resolution was used to identify land use land cover of the area. The radiometric correction was done to remove noise and distortions. The electromagnetic energy reaching to the sensor does not coincide with the emitted or reflected energy from the same feature due to the sun’s azimuth, elevation and atmosphere. Therefore, to obtain the real irradiance of reflectance from the digital number, radiometric distortions must be corrected (equation (5)).
\(\rho \lambda\) = TOA planetary Spectral Reflectance, without correction
\(A\rho\) = Reflectance additive scaling factor for the band
\( Qcal\)= \(L_1\) pixel value in DN
\(M\rho\) = Reflectance multiplicative scaling factor for the band
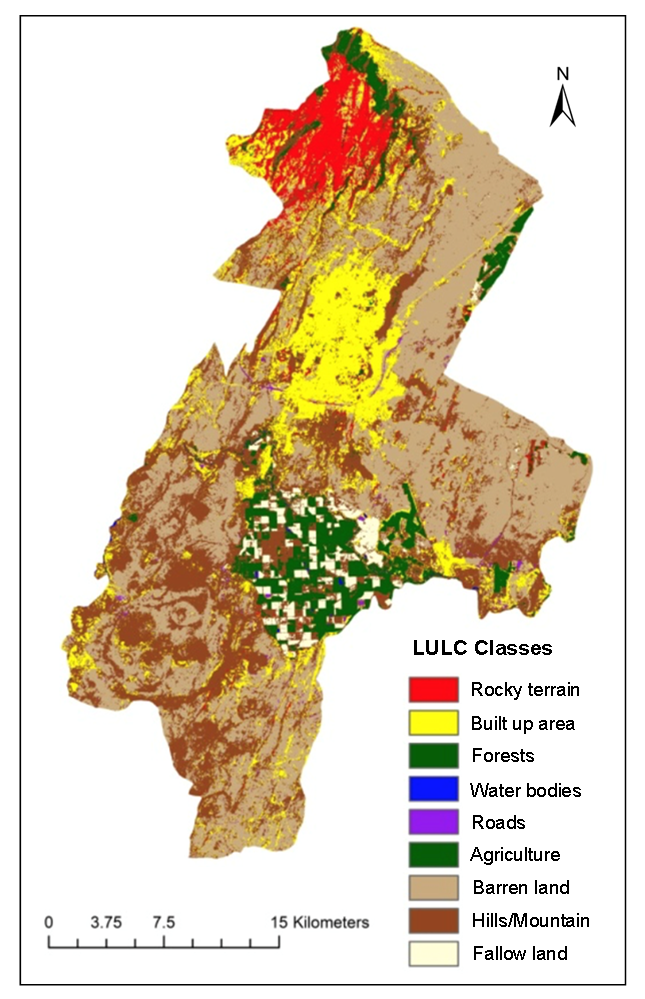
Convolution filter (\(3 \times 3\)) was performed for multi-spectral image to obtain complementary information about spatial enhancement. The individual bands were combined into one image by layer stacking. Landsat 8 OLI multi-spectral image (30m) was fused with a higher resolution panchromatic (pan) image (15m) to create the high-resolution multi-spectral (MS) image of 15m. The technique of fusing MS image with pan one is most popular and widely used to increase the resolution. Three bands namely green, red and near-infrared were used for further analysis using band combination of 5, 4 and 3. Supervised image technique along with pixel, knowledge based and mathematical indices were used for LULC categorization. The grouping of pixels is assigning class values using computer algorithm viz. Maximum Likelihood Classifier. Numerical descriptors of the several land cover types have similar reflectance patterns (Athick and Shankar, 2019). Land use classes are: 1) built up area includes all residential, commercial, and industrial development; 2) water bodies include any significant accumulation of water refers to oceans, rivers, streams, canals, seas and lakes; 3) bare land is exposed soil; 4) dense vegetation is dominant plantation; and 5) sparse vegetation is shrubs (Figure 6). Composite image of bands: 5, 4 and 3 shows LULC classes as built-up area, water bodies, bare land, dense vegetation, sparse vegetation which appear in purple, blue, tan, red and pink colures, respectively.
Figure 6. Land use land cover
3.7 Cross-Section and Longitudinal Profile
Cross-section refers as the terrain profile at specific points. DEM and land use land cover maps were used to create terrain profiles. The elevation surface values were extracted from DEM and proffered to LULC using 3D analyst tool. The map depicts rocky terrain, forests, roads, barren land, fallow land, built-up area, water bodies, agricultural land and hill/mountain. The profile tools in 3D analyst were used to select the profiles for ridges, valley, flats, water bodies, rivers and with peculiar characteristics like ‘U’ shaped terrain (Figure 7).
Figure 7. Cross section and Longitudinal profiles
4 . RESULTS AND DISCUSSIONS
Adama Wereda is located in Eastern Part of Ethiopia with a diverse landform pattern on basaltic terrain. This diversity has not been modeled so far in a more organized and scientific manner. Landform modeling requires precise topographic data to model the variation of terrain elevation. TPI was calculated using a digital elevation model to classify the landscape based on morphological characteristics (Mokarram et al., 2015).
The modeling technique for landform classification is conducted by Topographic Position Index (TPI) to generate different landform classes like depression, lower slope, even surface, average slope, higher slope, and ridge. TPI is one of the recently developed landform classification algorithms that can compute classified landform layers in GIS environment. The simplification of the Landscape Position Index is described by TPI as stated by Maxwell and Strager (2013) and was further refined by Weiss (2001). TPI assessments provide a reliable and robust means to examine the landscape into morphological classes (Jenness, 2004). The outputs of modeling landform using TPI analysis techniques are standardized elevation topographic index position index values that represent the landform classes of Adama Wereda.
DEM and derived investigators have exploited various data sets such as slope, aspect, surface area, hydrographical pattern and shaded relief derived from DEM were used for geomorphologic and geomorphometric analysis (Franklin, 1987; Skidmore, 1989; Ventura and Irvin, 2000). Terrain investigation is one of the more compelling and appealing types of geographic analysis to characterize the topographic position (McDonald et al., 1998). Terrain data, along with multi-spectral imagery provides rapid and useful information on landscape geology, lithology, soils, land use and land cover, lineaments and so on.
The topographic elevation has a decreasing trend towards the North-Western and Eastern part of Adama Wereda. However, in general, there is an increasing trend of elevation from the North to the South as one goes through the central parts of the Wereda (Figure 3).
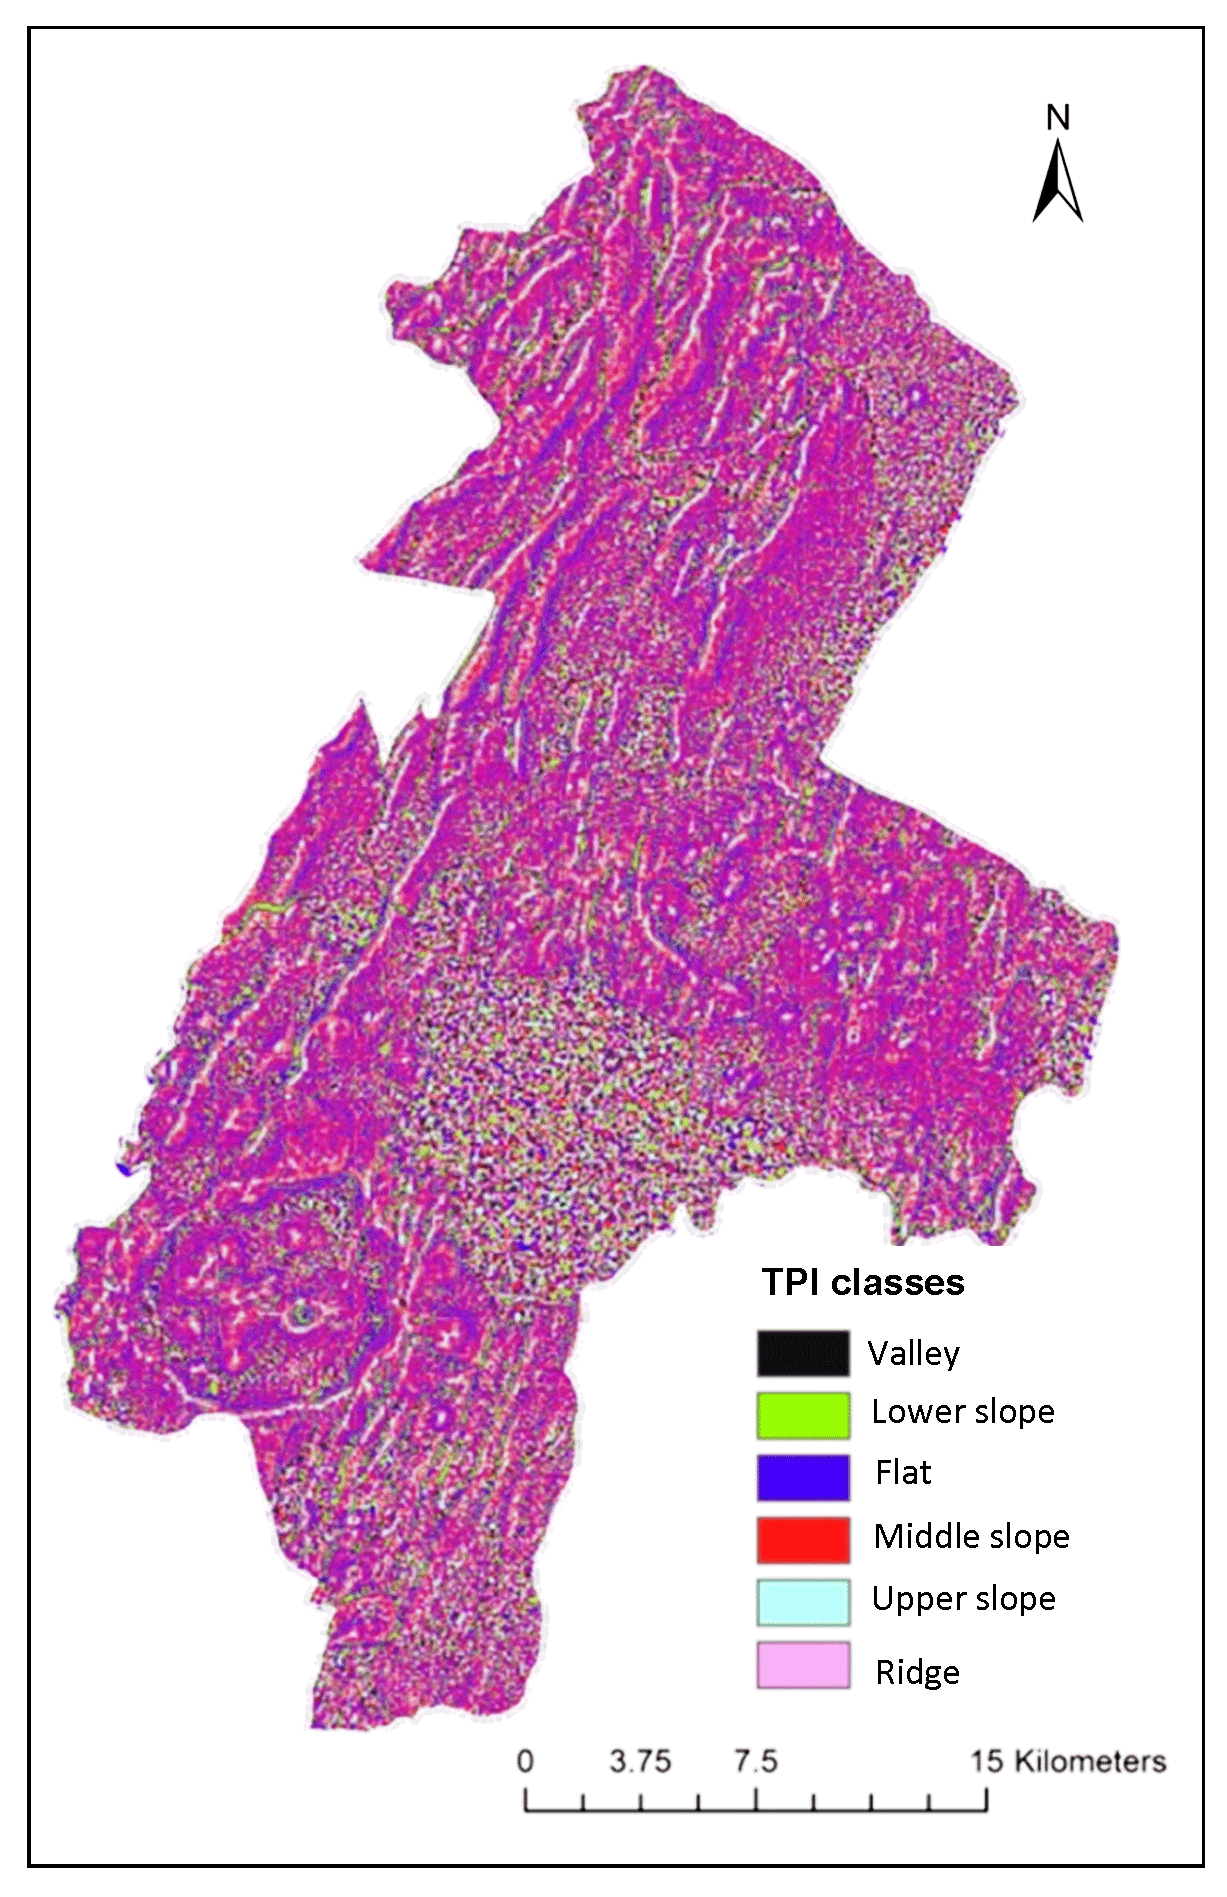
TPI map shows the higher influence of elevation on landform classification. Values are ranging from -61.16 to 57.86 (Figure 4). TPI values less and near to zero (close of -61.16) show a valley, lower slopes. TPI near to zero and greater than zero indicate terrain with flat and uniform slope, respectively. Positive values (close of 57.86) relate to the middle slope, upper slope and ridges.
Input terrain parameters viz. slope, curvature and elevation derived from DEM were used for preparing landform classification. For landform classification using Jennes algorithm needed TPI map for Adama Wereda (Figure 5). Accordingly, six landforms consist of the valley, lower slope, flat surface, middle slope, upper slope, and ridge with estimated area as 1942.2, 14334.9, 30549.54, 29905.35, 11621.04 and 2066.04 ha, respectively.
Athick and Shankar (2019) stated that LULC implies the usage of land for certain specific purposes. Nowadays, LULC dynamics are changing at very faster rate than before. These transitions have a significant influence on environmental and landscape attributes in Adama Wereda (Emiru et al., 2018). As a result by employing three techniques such as pixel, knowledge and indices based maximum likelihood classification for various LULC features were identified. Indigenous LULC namely water bodies and vegetation were derived using normalized mathematical water and vegetation indices, knowledge-based classification was also used to identify features in mixed pixel, and various human-made features like transportation network, towns, industries, utilities were grouped under the category of built up were isolated by pixel-based classification. The accuracy of classified images was evaluated through a confusion matrix. If the accuracy of the classified image reported less than 80%, then the images were reclassified (Mohan et al., 2011). Subsequently, only the images with correctness higher than 80% were used to prepare LULC map. There are nine identified LULC classes in Adama Wereda. Three dominant classes are barren land, hill/mountain and built-up in decreasing order, respectively. The spatial distributions of rocky terrain, built-up area, agricultural land, forest land, hill/mountain and barren land observed in North-Western, Central, South-Eastern, North-Eastern and dominantly stretching from Southern to the Northern parts of the Wereda, respectively (Figure 6). Bare land covers the maximum lands and settlement occupies the less (Table 2). Adama is in highlands, the nature of vegetation cover on the ground has a significant influence on triggering or preventing natural hazards. If there are hedges or tree species can prevent and stabilize the highlands (Athick et al., 2015).
Table 2. Land Use Land Cover
Classes
Area
Ha.
%
Rocky terrain
4767.3
5.3
Built up area
14551.1
16.3
Forest
1189.0
1.3
Water bodies
82.5
0.1
Road
621.4
0.7
Agriculture
4786.2
5.4
Barren land
34372.0
38.4
Hill / mountain
26632.1
29.8
Fallow lands
2459.3
2.7
Total
89460.9
100
Area computed using attributes of LULC with SD TPI using spatial statistics tools reveals the spatial relationship between LULC and standardized elevation TPI based landform classes in Adama Wereda. Accordingly, there are two types of relationship indicated from the area tabulation analysis. At first, rocky terrain, forest, road, barren land and fallow land are observed to be distributed on the flat slope and middle slope. Built-up, water bodies, agricultural land and hill/mountain classes are distributed from lower slope to upper slope landform classes. The expansions of built-up area and agriculture are covering most of the landform classes due to the ever increasing of population in the Wereda. The development of transportation-related infrastructure is dominant in the flat surface and middle slope. It indicates that there is a gap in the coverage to satisfy the requirements for the ever growing and expansion of built-up areas in Wereda (Table 3).
Table 3. Area matrix: Landforms and LULC classes
Classes
Valley
Lower slope
Flat surface
Middle slope
Upper slope
Ridge
Total
Rocky terrain
113.3
705.1
1569.1
1605.1
692.7
82.0
4767.3
Built up area
362.1
2208.1
4923.8
4603.5
2039.6
413.9
14551.1
Forest
16.8
144.5
367.6
420.9
214.6
24.8
1189.0
Water bodies
5.4
17.5
21.8
16.7
11.8
9.4
82.5
Road
20.1
97.5
208.9
199.3
80.4
15.2
621.4
Agriculture
413.3
905.4
1165.8
1033.6
737.1
530.9
4786.1
Barren land
767.1
5153.3
12155.6
11077.6
4346.8
871.4
34372.0
Hill/Mountain
816.6
4188.3
8813.8
7932.8
3836.5
1044.0
26632.1
Fallow land
222.1
476.5
591.6
544.1
347.2
277.8
2459.3
Total
2736.9
13896.0
29818.0
27433.8
12306.7
3269.4
89460.9
The cross-section profile of terrain, rivers/streams form LULC map with the surface elevation from DEM (Figure 7) at different location shows that in the upper region, there is a broad U shaped valley and due to dissected ranges and as it moves further to the valley, it becomes V-shaped narrow. The U and V-shaped landforms have been found in the higher and moderate stretches of the Northern part of Adama Wereda. The elevations, at which contours change the valley from U to V shape were observed, determined and designated. The cross-section profile in the canyon and lake area was found even that shows its nature about the flow of the river. Rivers are straight features which show an inclination of character along their length. Ideally, the longitudinal characterization from top to the end of Adama Wereda has been analyzed and mapped (Figure 7).
5 . CONCLUSION
Landforms are mostly natural characteristic of the Earth’s surface. Landforms collectively represent terrain and their patterns of LULC gave deep insight about the topography of Adama Wereda. Landforms were studied only on DEM and its derived parameters like slope and elevation along with LULC classes. Results revealed that application of Jennes is one of the most assuring algorithm for analysis of landforms. The results are helpful to determine ridge tops and high hills. The digital elevation model and Landsat 8 OLI were used. TPI values are from -61.16 to 57.86. The Adama Wereda was classified into landform groups by using TPI. The result shows that six landforms including depression, lower slope, even slope, intermediate slope, higher slope, and ridge. TPI and landform classification Guisan et al., (1999) can be used for categorization of the different area. Road development in Adama Wereda has a significant gap to satisfy the requirements for the ever growing and expansion of built-up areas in the Wereda. TPI is one of the useful Geo-processing tools concerning landform classification and interpretation as stated in literature. Analysis in Adama Wereda shows that landform interpretation is more logical and realistic associated to the landform and local LULC classes. Cross section and longitudinal profile on different elevation intersection gave realistic understanding of the terrain.
Tables
Figures
Conflict of Interest
The authors confirm no conflicts of interest.
Acknowledgements
Authors are thankful to the Adama Science and Technology University, Adama, Ethiopia and United States Geological Survey (USGS) for Landsat images.
Abbreviations
DEM: Digital Elevation Model; LULC: Land Use Land Cover; MS: Multi-Spectral; TPI: Topographic Position Index; SD:Standard Deviation; SRTM: Shuttle Radar Topography Mission.
Brabyn, L., 1996. Landscape classification using GIS and national digital databases. Landscape Research, 21(3), 277-300.
6.
Cai, Z., 1986. The suggestion of basic geomorphological types according to relative height. IGCAS [Institute of Geographic, Chinese Academy of Sciences], editor. Geomorphological Mapping Research. Surveying and Mapping Press, Beijing, China, 90-97.
McDonald, R. C., Isbell, R. F., Speight, J. G., Walker, J. and Hopkins, M. S., 1998. Australian soil and land survey: field handbook (Ed. 2). CSIRO publishing.
Mokarram, M., Seif, A. and Sathyamoorthy, D., 2015. Landform classification of zagros mountains using multiscale analysis of digital elevation models. Creating: A Vibrant Space Industry for Malaysia. The Need for A Space Act, 30.
Ventura, S. J. and Irvin, B. J., 2000. Automated landform classification methods for soil-landscape studies. Terrain analysis:principles and applications, 267-294.


 ,
Meseret Tadesse 1
,
Meseret Tadesse 1