1 . INTRODUCTION
About two-third of the world’s population is supported by groundwater (Li et al., 2018; Adimalla et al., 2018) especially, in a largely populated country like India, it is observed that about one billion people are solely dependent on groundwater for fresh drinking water and all other household as well as agricultural purposes (Kadam et al., 2019). In India, the dependency on groundwater is increasing tremendously because of the quality deterioration and insufficient availability of surface water (Gaikwad et al., 2019, Wagh et al., 2019). In order to fulfill the basic needs of the population of any country it is extremely important to have a good understanding about the quality and geochemical characteristics of groundwater (Adimalla et al., 2018).
World Health Organization (WHO) has proposed desirable and permissible limits for concentration of various chemical parameters in groundwater (WHO, 1993). It has been observed that the analysis of groundwater qualities have not been given major importance as compared to that of quantity, especially in developing and under developed countries mostly due to lack of scientific knowledge and adequate funds (Mukate et al., 2019). The occurrence, storage and movement of groundwater are determined by several factors such as climate, drainage network, geology, geomorphology, hydrogeology and mainly anthropogenic activities (Sabale and Thorat, 1991; Deshmukh, 2011; Kalpana and Elango, 2013). The geochemical composition of groundwater is mainly influenced by natural factors including the deposition of atmospheric salts in wet and dry conditions, precipitation, evapotranspiration, soil matrix, rock-water interaction, residence time and anthropogenic activities including disposal of industrial and domestic wastes, recharge from agriculture, etc. (Todd, 2006; Tóth, 1999; Sefie et al., 2018; Karroum et al., 2017; Devic et al., 2014; Barbieri et al., 2014; Mukate et al., 2019).
With extremely high amount of fluoride, nitrate and arsenic in groundwater has led to large health complications for millions of people all over the world. Thus, the protection and maintenance of groundwater resources by continuous monitoring become important to solve the future health risks.
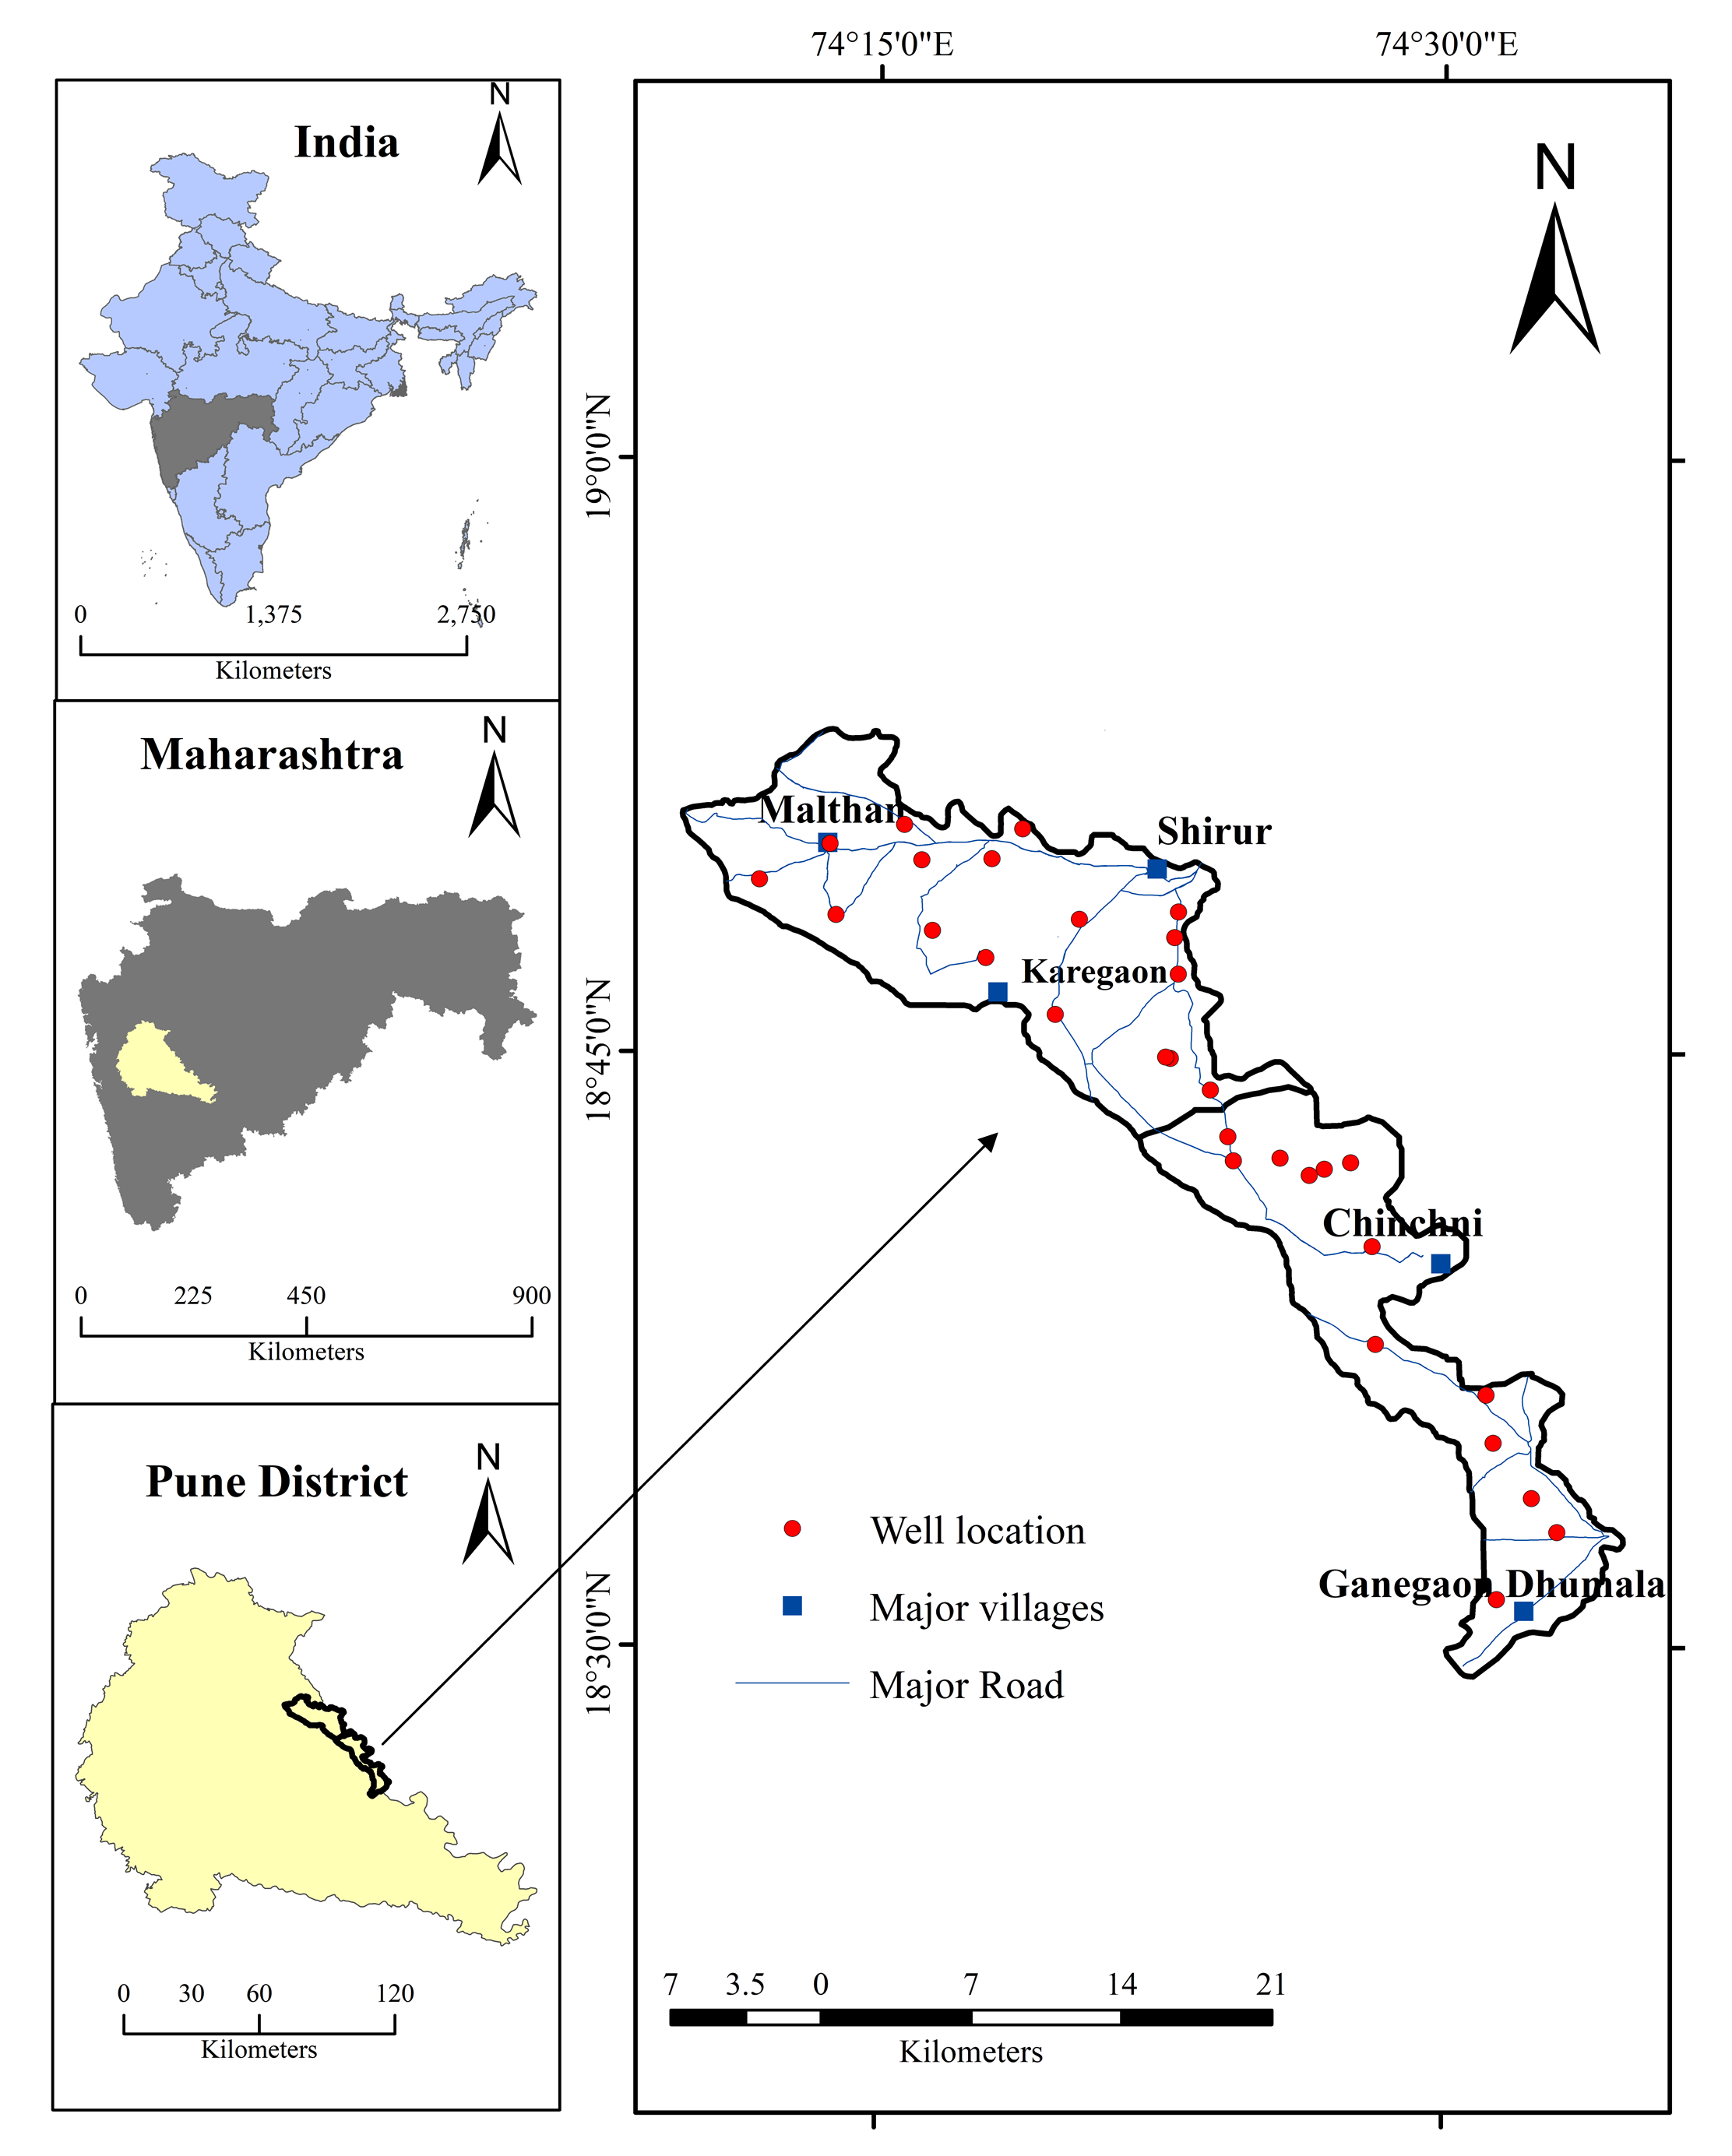
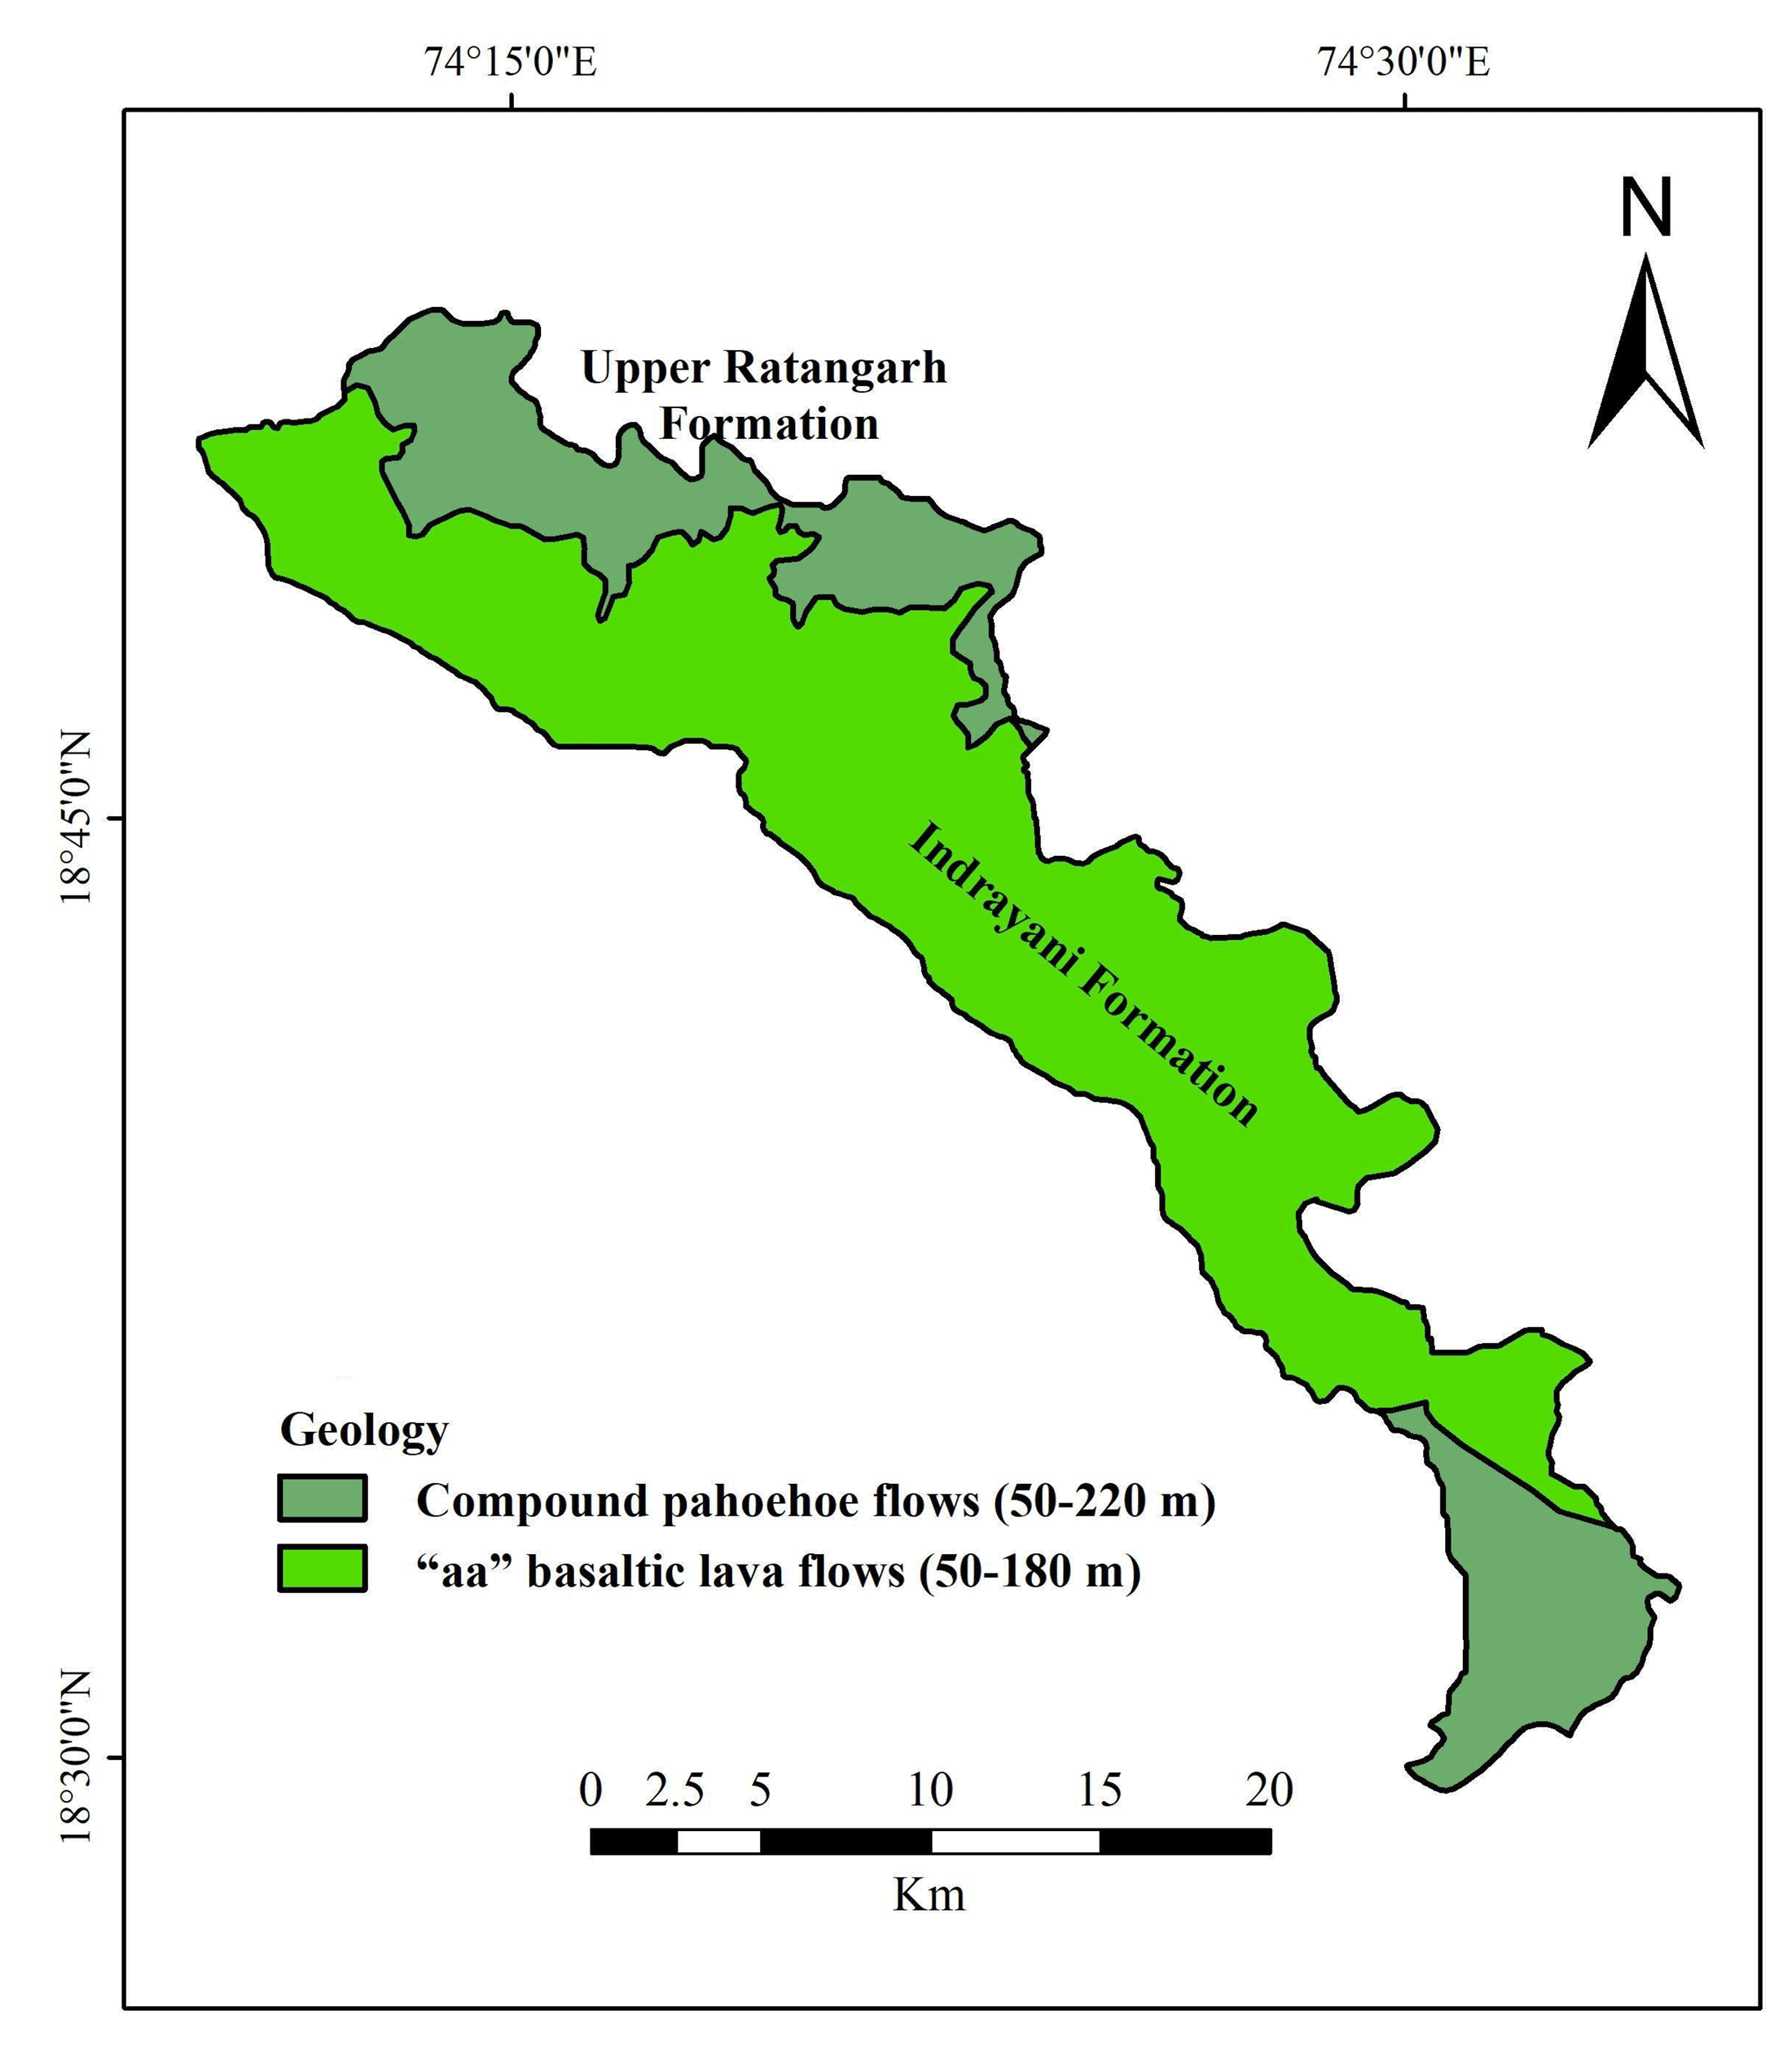
Deccan Volcanic Province (DVP) of peninsular India is the most extensive geological formation having well-documented chemo stratigraphic classification (Krishnan, 1982; Beane et al., 1986). In general, groundwater movement from the recharge area to the discharge area in the DVP modifies ionic composition by hydro-geochemical processes and the probable changes in the hydro-geochemistry are mainly due to the hydrogeology, hydro-geomorphologic, and anthropogenic activities (Pawar and Nikumbh, 1999). In the Upper Bhima basin, agriculture is dominant occupation and majority of the people living in small farm houses. Dug wells and deeper bore wells are the major source of water that are commonly used for drinking and irrigation purposes with the principal crops grown including sugarcane, onions and variety of vegetables. In order to enhance the crop yield, most common practices such as addition of high amount of chemical fertilizers and pesticides are common, which in turns leaches downward and results in the contamination of subsurface water. As this degraded water is consumed by the population of that region and thus poses various health related issues.
GIS is one of the most important tools for evaluating the hydrogeochemical characteristics and determining the quality of groundwater, which has been conducted by many scholars (Rajashekar et al., 2019; Vishwakarma, 2014; Roy and Indranil, 2009) Groundwater quality map is helpful for determining the contamination of groundwater and for indicating the potential hazardous zones, which can thus assist various officials working in that region. GIS is emerged as a dominant tool for acquiring, analyzing, and interpreting the spatial information for decision making in several geo-environmental fields (Deepesh et al., 2011).
The present study has been carried out to evaluate the groundwater quality in the basaltic rocks of the upper Bhima basin, Maharashtra. The main objective of this study is to assess groundwater for drinking and irrigation purposes. The study can be helpful to monitor different problems associated with the contamination of groundwater.
5 . RESULTS AND DISCUSSIONS
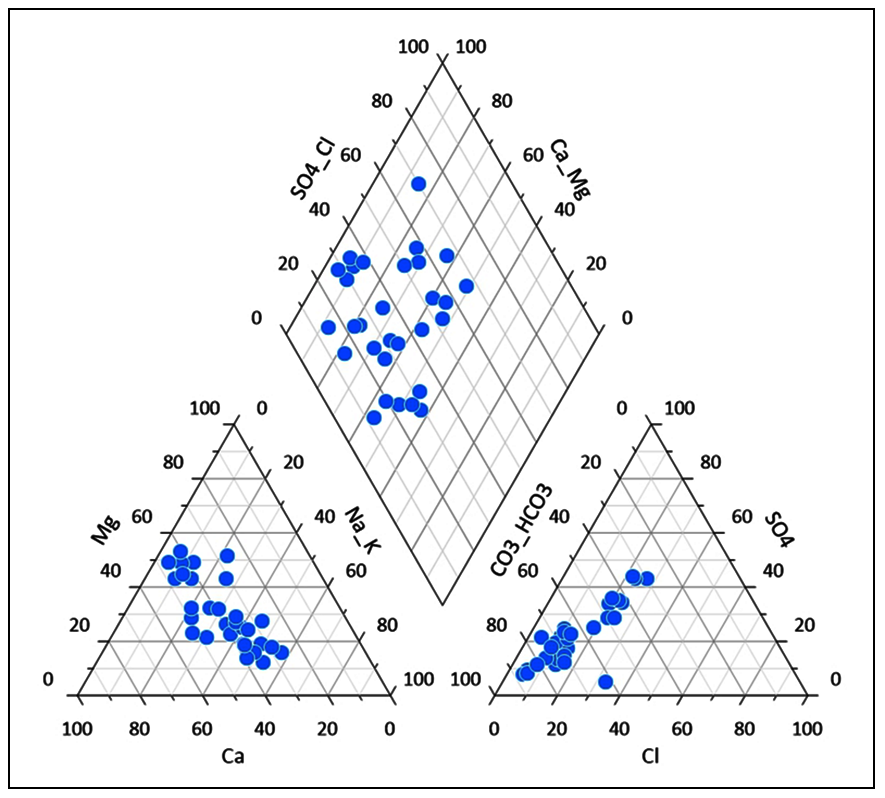
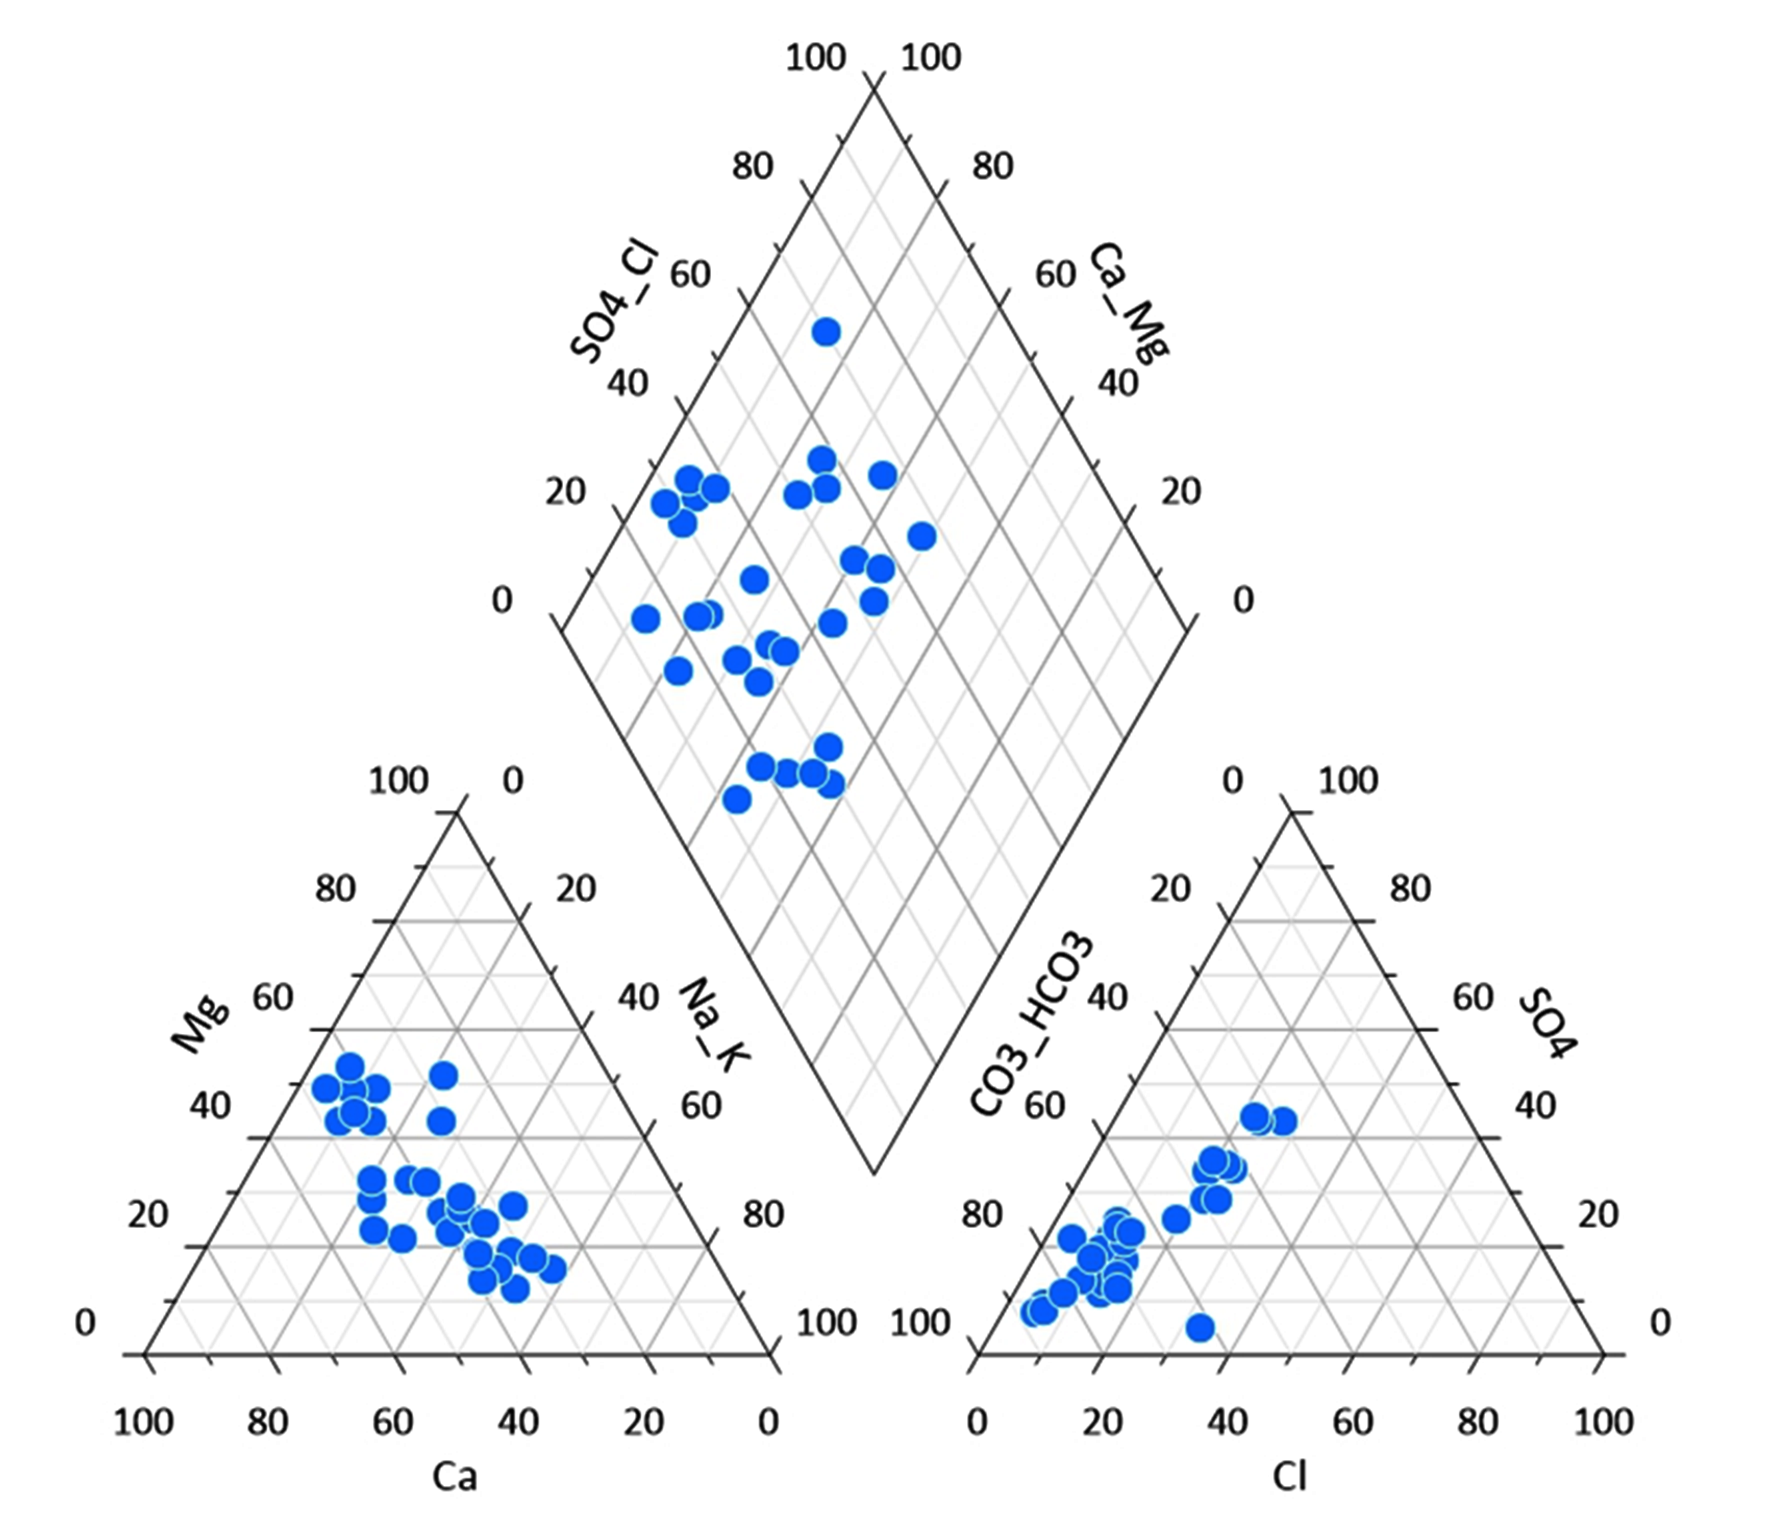
5.1 Piper’s Trilinear Diagram
Piper’s trilinear diagram (Piper, 1953) is useful to classify the groundwater based on basic geochemical characters of the constituent ionic concentrations. Moreover, it is incredibly useful to determine the chemical relationships and geochemical characters in groundwater in more explicit terms (Piper, 1953). Groundwater in the study area is classified as: (I) Ca2+-HCO3−, (II) Mixed Ca2+-Na+-HCO3− and (Ⅲ) mixed Ca2+- Mg2+-Cl−, (IV) Ca2+-Cl− (Figure 3). The present investigations show that the groundwater consist mainly calcium-magnesium-bicarbonate type. Calcium and magnesium dominance are mainly due to weathering and mineral dissolution of basalts. Bicarbonate majorly dominates the ionic concentrations in the groundwater, due to weathering of carbonates and dissolution of silicate minerals.
5.2 Groundwater Chemistry Evolution Mechanisms
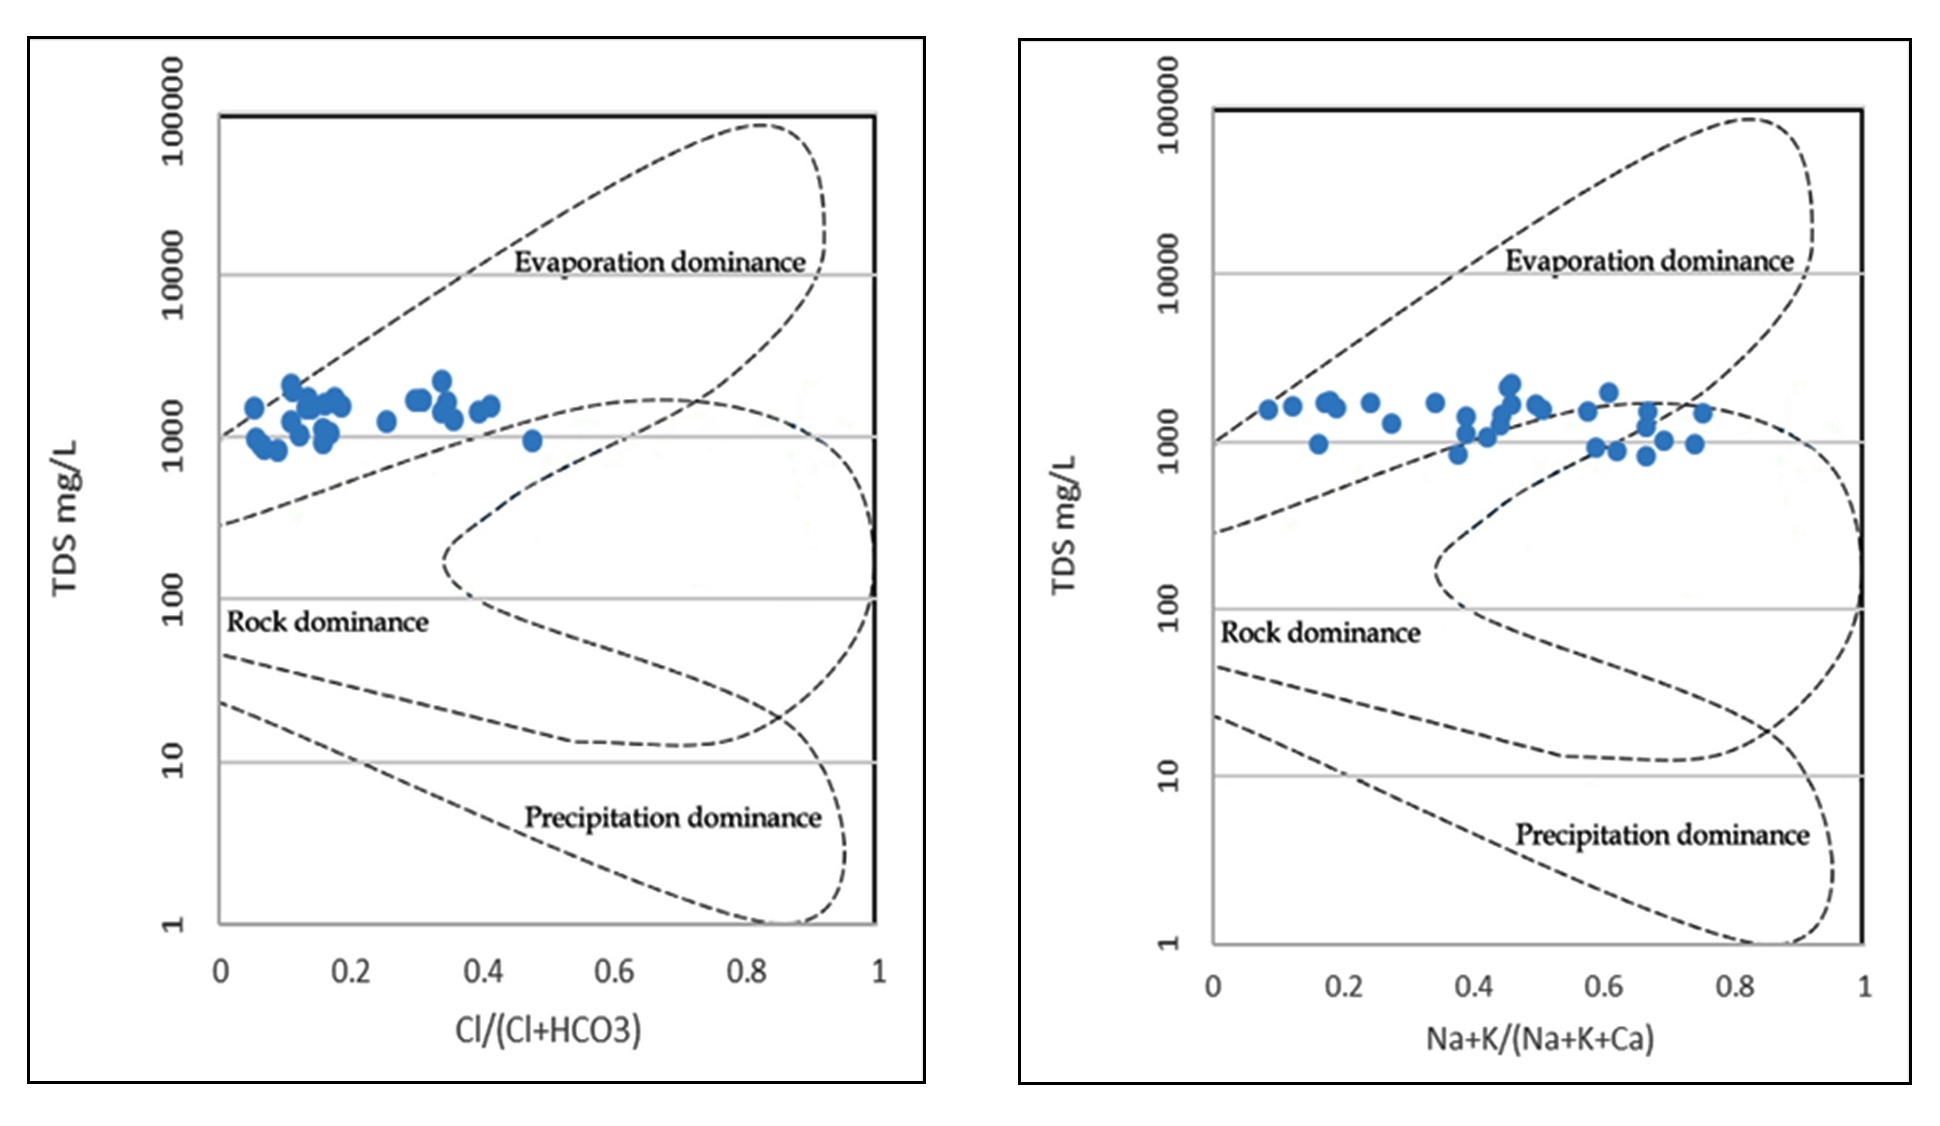
Groundwater chemistry evolution mechanism is analyzed using Gibbs (1970) diagrams. The mechanism of affinities of the chemical concentration appears in the groundwater resources have been well delineated using this technique. The graphs were plotted for anions and cations as TDS versus Cl−/ (Cl− + HCO3−) and TDS versus (Na+ + K+) / (Na+ + K+ + Ca2+), respectively.
Gibbs diagram consists of three dominant zones, which includes the rock dominance zones, the evaporation dominance zones and the precipitation dominance zones. Majority of samples in the region classified into the rock dominance and evaporation dominance zones (Figure 4). Chemical weathering leads to the mineral dissolution and hence enriches the concentration of salts in groundwater. As the study area is the part of semi-arid region, evaporation is extremely high.
5.3 Suitability of Groundwater for Drinking Purposes
Human health related issues are directly related to the quality parameters of drinking water and attracted a great deal of interest. The significance of groundwater in any area should not be neglected as the most reliable sources of fresh water for domestic usages. Access to good quality water is becoming challenging day by day. The groundwater samples from study are were assessed using most desirable limit as well as maximum permissible limit proposed by WHO (1993) for drinking purpose along with ill effects on health and the data has been incorporated in Table 1. From the results, it is clearly observed that the concentration of nitrate in water is beyond the maximum permissible limits (MPL) of WHO standards for drinking purpose.
Table 1. Groundwater analysis and human health
|
Parameters mg/L
(except pH)
|
Most desirable limit (MDL)
|
Max. permissible limit (MPL)
|
Pre-monsoon
min.-max.
|
Impacts on health
|
|
pH
|
7-8.5
|
9.2
|
6.9-7.9
|
Change in taste
|
|
TDS
|
500
|
1500
|
527-1414
|
Gastro-intestinal irritation
|
|
TH
|
100
|
500
|
250 -1910
|
|
|
Na
|
-
|
200
|
10 -178
|
|
|
K
|
-
|
30
|
0.02 -15.26
|
Depression, muscle weakness, heart rhythm, disorder and confusion
|
|
Ca
|
75
|
200
|
31-156
|
Scale formation
|
|
Mg
|
50
|
150
|
24-129
|
|
Cl
|
200
|
600
|
22 -213
|
Salty taste
|
|
HCO3
|
300
|
-
|
125-675
|
Corrosion of pipes
|
|
SO4
|
200
|
400
|
32-277
|
Laxative effect
|
|
NO3
|
45
|
-
|
8-194
|
Blue Baby
|
|
F
|
1
|
1.5
|
0.016-0.834
|
Fluorosis
|
5.4 Water Quality Index
Water Quality Index (WQI) quantifies influences of different water quality parameters using rating system. Evaluation of the groundwater quality in the region was carried out in a scientific manner with the help of an integrated WQI for various parameters. It is easy and systematic tool useful for classification of all water quality parameters in a single unit. WQI has been suggested to derive numerical expressions of water qualities (Prasanth, 2012; Deshmukh, 2011; Adimalla, 2018; Kadam, 2019; Lad, 2019). Parameters such as pH, EC, TDS, hardness, major cations and anions are considered for WQI calculation.
Relative importance was considered for selection of parameters to define water quality for drinking and irrigation purposes. WHO standards were considered for comparison required in this study (WHO, 1993). WQI was computed using the method by Yidana and Yidana, 2010. Weights (W) were assigned to the variables, TDS, pH, Hardness, major cations, anions for assessing the water quality based on their importance for water quality. Secondly, the relative weights ( \(W_r\) ) were calculated from the following equation (equation (1)):
\(W_r=w_1 \sum_i^nw_i\) (1)
where, \(W_r\) is the relative weight, \(w_i\) is the weight of each parameter (WHO) and \(n\) is the number of parameters. Thirdly, a quality rating scales ( \(q_i\) ) for each parameter were assigned by dividing its concentration in each water sample by its relative standard according to WHO guidelines and multiplying by 100 (equation (2)).
\(q_i = (C_i/S_i) \times 100\) (2)
where, \(q_i\) is the quality rating, \(C_i\) is the concentration of each selected parameter from water sample in mg/L, and \(S_i\) is the WHO standards of drinking water for each selected parameter in mg/L, according to the guidelines of WHO for computing the WQI. Then \(SI_i\) is first determined for each chemical parameter, which is then used to determine the WQI as per the following (equation (3)).
\(SI_i=W_i \times q_i\) and \(WQI= \sum SI_i\) (3)
\(SI_i\) is the sub index of ith parameter; \(q_i\) is the rating based on concentration of ith parameter.
The WQI computed is classified as excellent (≤50), good (50-100), poor (100-200), very poor (200-300) and (≥300) unsuitable for drinking purposes. It is observed from WQI that 66% samples are not fit for drinking purposes and only 34% samples are suitable. The high nitrate contamination due to anthropogenic activities is the major cause of groundwater being unfit for drinking purposes.
5.5 Suitability of Groundwater for Irrigation
There is an increasing need to periodically check the quality of water used for irrigation purposes. Without irrigation the farming becomes limited, agriculture will almost become impossible. It increases the crop yield and helps in cultivation of superior crops, which require high amount of water. With the changing environment, depending on rainwater for agriculture is risky. Hence the quality of water for irrigation purposes is focused in this study. Important irrigation water quality parameters include several specific properties of water relevant in relation to the yield and quality of crops, maintenance of soil productivity and protection of the environment. Sodium Adsorption Ratio (SAR), Permeability Index (PI), Kellys Ratio (KR), Sodium Percentage, Residual Sodium Carbonate (RSC), Magnesium Hazard (MH) are the parameters used to determine the suitability of groundwater for irrigation.
5.5.1 Sodium Adsorption Ratio (SAR)
In groundwater, sodium hazard is determined by the absolute and relative concentration of cations and is termed as Sodium Adsorption Ratio (SAR) (equation (4)).
\(SAR = {Na \over (Ca+Mg\div2)}\) (4)
SAR values play an important role in irrigation purposes due to the amount of sodium content that is present in soil after absorption. High sodium concentration has a tendency of decreasing the soil permeability and the structure of the soil. Hence, SAR measures the amount of sodium hazard which is in association with the concentration of calcium and magnesium present. SAR value is used to calculate the degree to which irrigation water tends to enter cation exchange section in the soil. Groundwater samples consisting of high Na+ content and relatively low Ca2+ content often results in the ion exchange of Na+ with Ca2+ and Mg2+. Thus, the ion exchange leads to the destruction of soil due to clay particles dispersion. Na+ amount in water leads to salinization and degradation of crops. From the values observed that a further provision can be made to avoid future destruction of soil content which will lead to good crop production.
The calculated SAR values are ranging from 1.036 to 17.8, where average value observed are 8.5. These values for most of the samples are classified as excellent. About 56% samples were found to be excellent, 44% samples were good according to sodium hazard. Accordingly, it is inferred that the samples have no salinity issue and it can be used for agricultural purposes.
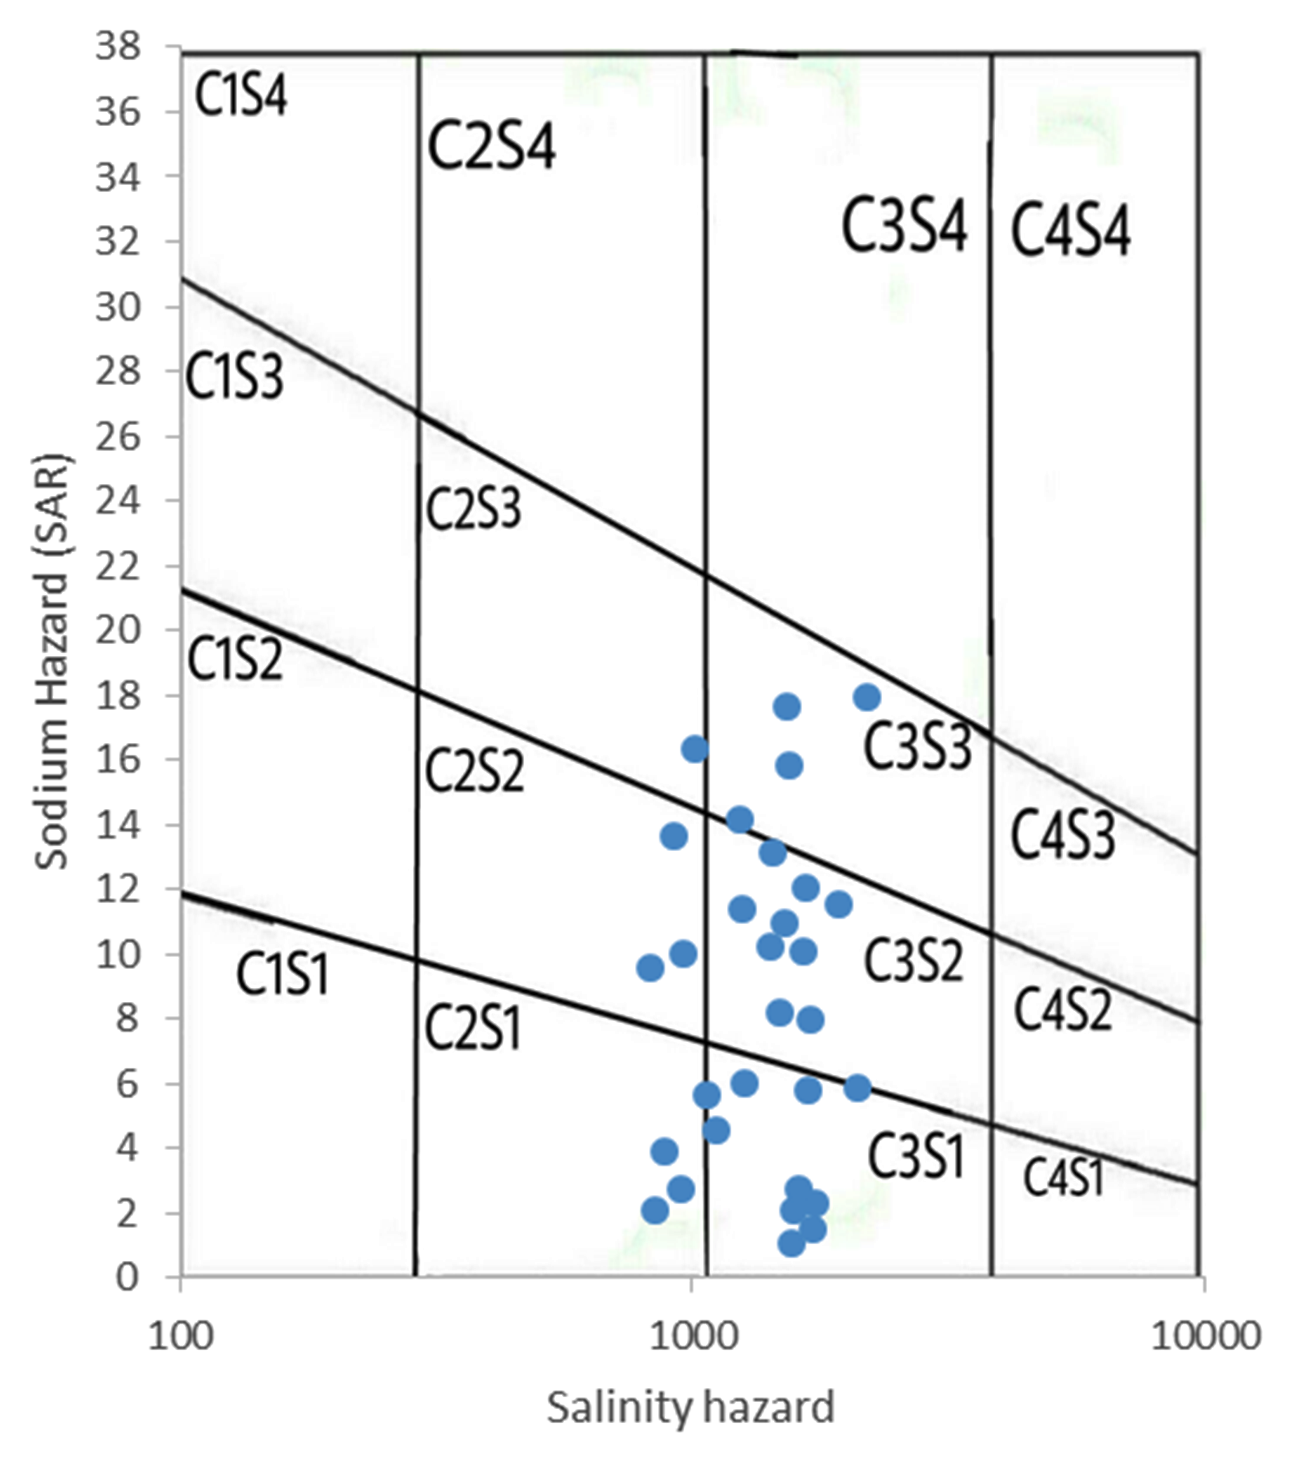
SAR (sodium hazard) is plotted against EC (salinity) according salinity diagram by US laboratory (1954) and used for the assessment of irrigation water quality. Groundwater with EC values may be acceptable for irrigation at low salinity (C1) and medium salinity (C2) with SAR values as low sodium hazard (S1), and medium sodium hazard (S2). Further, water requires extensive treatment for irrigation purposes at the high salinity (C3), very high salinity (C4) with high sodium hazard (S3) and very high sodium hazard (S4) concentrations (Todd, 1980; USSL, 1954). The diagram indicates that about 16% samples fall in C2S3 and C3S3 indicating that medium to high salinity and high sodium hazard. About 40% in C2S2 and C3S2 types indicating medium to high salinity and medium sodium hazards. Similarly, 44% samples are in C2S1 and C3SI types indicating medium to high salinity and low sodium hazard type of water, respectively (Figure 5). The groundwater in the region area is found to be suitable for irrigation purposes.
5.5.2 Permeability index (PI)
The suitability of groundwater for purpose of irrigation can also be determined by considering the permeability index parameter. The soil permeability is an important factor as it allows the infiltration of groundwater. PI values (equation (5)) are greatly shaped by the concentration of Na+, Ca2+, Mg2+, and HCO3- parameters.
\(PI = {Na+ \sqrt {HCO3} \over Ca+Mg+Na} \times 100\) (5)
The PI values are categorized as excellent, good and unsuitable indicating the quality of groundwater that used for the agricultural purposes. Doneen (1964) and Ragunath (1987) have proposed a classification scheme of groundwater for irrigation purposes using PI into three classes namely class 1, class 2 and class 3. WHO (1993) evaluates the quality of groundwater considering the PI as: Class I and II of groundwater are categorized as good for irrigation with 75% or more of maximum permeability and Class III of groundwater is unsuitable with 25% of maximum permeability. PI ranges from 14 to 67 with average values being 40 in the study area. About 80% of calculated PI values for all the groundwater samples were categorized in the class 2 and 20% fall under class 3.
5.5.3 Kelly’s Ratio (KR)
KR is another important parameter that is practiced in order to avail details about the quality of groundwater, by considering sodium concentration. However, SAR is a more advanced method for the detection of sodium content. A Kelly index is used to derive the samples as suitable or unsuitable. A Kelly index with values exceeding 1 are termed as unsuitable, while those of less than 1 are considered as suitable for irrigation purposes. Higher values indicate high concentration of sodium present. Kelly ratio is calculated by equation (equation (6)):
KR=Na+/Ca2+ +Mg2+ (6)
Kelly index for the analyzed samples are ranging from 0.04 to 1.3 (Table 2) and out of the 30 samples collected about 27 were calculated as suitable and 3 samples were unsuitable for irrigation.
Table 2. Groundwater suitability for agriculture
|
Parameter
|
Range
|
Water type/classification
|
Sample
|
|
No.
|
%
|
|
SAR (Richards , 1954)
|
<10
|
Excellent
|
17
|
56.67
|
|
10-18
|
Good
|
13
|
43.33
|
|
18-26
|
Doubtful
|
0
|
0
|
|
26<
|
Unsuitable
|
0
|
0
|
|
PI (Doneen , 1964)
|
>75
|
Excellent
|
0
|
0
|
|
75-25
|
Good
|
24
|
80
|
|
25>
|
Unsuitable
|
6
|
20
|
|
KR (Kelley, 1946)
|
<1
|
suitable
|
27
|
90
|
|
>1
|
unsuitable
|
3
|
10
|
|
MHR (Raghunath , 1987)
|
<50
|
Suitable
|
22
|
73.33
|
|
>50
|
unsuitable
|
8
|
26.67
|
|
Na (%) (Wilcox, 1955)
|
<20
|
Excellent
|
7
|
23.33
|
|
20-40
|
Good
|
13
|
43.33
|
|
40-60
|
Permissible
|
10
|
33.33
|
|
60-80
|
Doubtful
|
0
|
0
|
|
80<
|
Unsuitable
|
0
|
0
|
|
Na (%) (Eaton , 1950)
|
<60
|
Safe
|
30
|
100
|
|
>60
|
Unsafe
|
0
|
0
|
|
RSC (Eaton , 1950)
|
<1.25
|
Good
|
1
|
3.33
|
|
1.25-2.5
|
Doubtful
|
0
|
0
|
|
>2.5
|
Unsuitable
|
29
|
96.67
|
5.5.4 Magnesium Hazard (MH)
Magnesium and calcium concentration in groundwater also play vital roles in determining the quality of groundwater. Magnesium concentration has more adverse effects on groundwater as compared to calcium. Hence it is extremely important to detect the amount of magnesium which is done with the help of magnesium hazard (MH). MH calculates magnesium with respect to calcium concentration. MH is calculated by the following equation (equation (7)):
MH= {Mg2+ /(Ca2+ + Mg2+)}×100 (7)
Raghunath (1987) has developed a ratio, namely Magnesium Hazard Ratio. Based on this, the values obtained by calculation were termed into two classes, suitable and unsuitable. Values less than 50 were considered to suitable and values exceeding 50 were considered as unsuitable for irrigation purposes. Calculated MH values are ranging from 25 to 66 (Table 2). In which about 22 samples were suitable, and 8 samples were unsuitable for irrigation purposes.
5.5.5 Sodium (Na %)
Sodium hazard in irrigation is calculated with the help of sodium percentage, thus being a very useful parameter. Sodium content has extremely adverse effects on soil. Percentage of sodium is calculated using the formula (equation (8)):
Na (%) = {Na+/(Ca2++Mg2++Na++K+)}×100 (8)
where, cations are measured in milli equivalents per liter or equivalent per million.
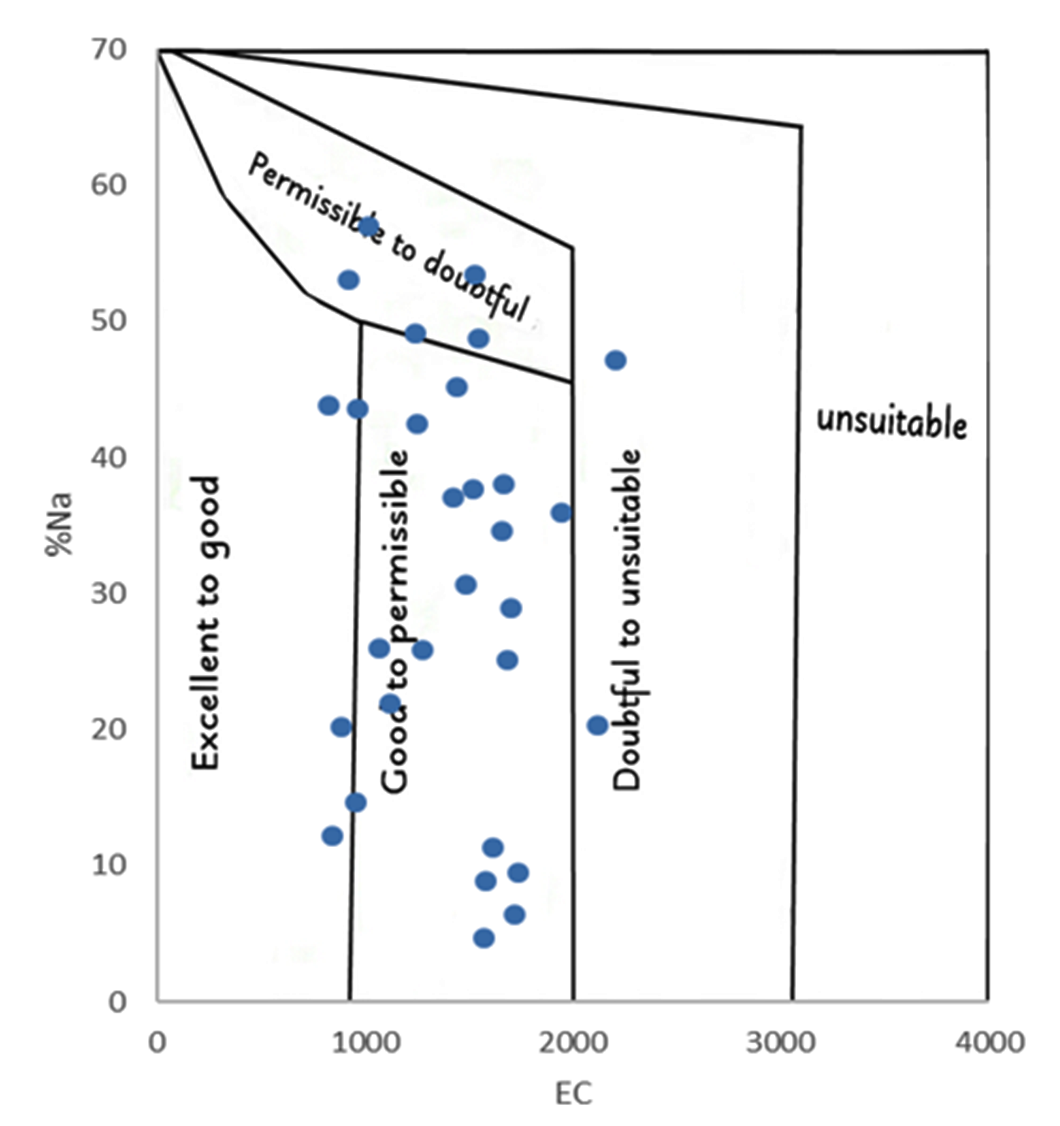
Wilcox’s (1955) method is used to understand the Na% where it is observed that values ranging from 4 to 56 are obtained. From the values calculated about 7 samples were considered as excellent, 13 as good, 10 in permissible limits and none of the samples were classified as doubtful (Figure 6).
Wilcox’s (1955) diagram shows plot of EC values against Na%. According to the diagram few samples fall in excellent class, while most of the samples fall in good-permissible class. There were a few samples which were doubtful and needs some treatment before using for irrigation purposes.
5.5.6 Residual Sodium Carbonate (RSC)
Residual Sodium Carbonate RSC is one of the most important and widely used method in order to calculate the suitability of groundwater for irrigation purposes. The hazardous effect of carbonates and bicarbonates were calculated with the help of RSC, detecting the attributes of groundwater for irrigation purposes.
Particularly, the high amount of feeble acids such as the total concentration of the carbonates and bicarbonates in groundwater over the alkaline earths such as the total of calcium and magnesium alter the suitability of groundwater for irrigation. This is calculated using the equation 9 (equation (9)) (Eaton, 1950; Raghunath, 1987).
RSC = (HCO3- + CO3-2) – (Ca2+ +Mg2+) (9)
Higher concentration of cations such as calcium and magnesium in the groundwater generally show negative values of RSC. Hence, the concentration of calcium and magnesium play a vital role in determining the quality of groundwater. Eaton (1950) has concluded that increasing amount of RSC values in groundwater leads to increase in the SAR values, thus resulting in the soil becoming infertile due to such increasing concentration levels. The RSC values calculated, only 1sample indicated high concentrations of calcium and magnesium in the groundwater. 29 samples are unsuitable as per RSC calculation.


 ,
HUZEFA SHAIKH 1
,
HUZEFA SHAIKH 1