1 . INTRODUCTION
Water is the most existing resource on the Earth essential for life. Groundwater is the ‘god gift’ natural source for living things for their life survival. Groundwater is a precious and the most widely distributed resource of the Earth and unlike any other mineral resource, it gets annual replenishment from the meteoric precipitation. Groundwater resources are important natural resource for domestic, agricultural, and industrial purposes (Kadam et al., 2019). There has been a tremendous increase in the demand for groundwater due to increase in population, advanced irrigation practices and industrial usages. Groundwater is a significant natural resource in present day, but frequent failures in monsoon, undependable surface water, and rapid urbanization and industrialization have been created a major risk to this valuable resource (Ramamoorthy and Rammohan, 2015). In Maharashtra, some areas over-exploitation has been caused declining groundwater levels and has consequently limited groundwater flow to deeper fractured zones (Kumar e. al., 2011; Maiti et al., 2012). Further, in recent years, population explosion, growing industry and advances in science and technology are resulted into the need of analyses of groundwater.
The remote sensing and geographical information system is a component of geospatial techniques. It is a very powerful tool for processing, analyzing and integrating spatial data sets. The integration of Remote Sensing (RS) and Geographic Information System (GIS) has been proven to be efficient, rapid and cost effective technique producing valuable data on geology, geomorphology, lineaments and slope as well as a systematic integration of these data for exploration and delineation of groundwater potentials zones (GWPZ) (Fashae et al., 2014; Shailaja et al., 2019). With the advent of remote sensing and geographic information system (GIS) technologies, the mappings of GWPZ within each geological unit have become an effortless procedure (Naveenkumar et al., 2015; Kadam et al., 2017; Singhai et al., 2019). They are used to identify the geology, geomorphology, soil, lineament density, drainage density, rainfall and land use for maps that indicate the occurrence of groundwater (Shailaja et al., 2019). Rao et al. (2004) have studied the integration of groundwater resources evaluation using the remote sensing techniques. Each of this has been considered and with the use of geospatial data as a reference to compute these layers. The geospatial approach is widely used for the development and management of various natural resources (Kadam et al., 2012; Gashaw et al., 2017).
The analytical hierarchical process (AHP) in overlay analysis based on GIS technique was used to delineate the GWPZ by Nag (1998), Sikdar et al. (2004), Prasad et al. (2008), Teixeira et al., (2008), Kumar et al. (2008), Nagarajan and Singh (2009), Sukumar and Sankar (2010) and Shailaja et al. (2019). AHP is a multi-criteria decision making process of measurement over and done with pair wise comparisons and depends on the knowledge of the experts to build priority index. AHP method is used to develop the weights associated with attribute map layers (Patil and Panhalkar, 2019; Shailaja, et al., 2019).
The occurrence of groundwater at any place on the earth is not a matter of chance but a consequence of the interaction of the climatic, geological, hydrological, physiographical and ecological factors. Groundwater exploration operation is essentially a hydro-geological and geophysical inference operation and depends on the correct interpretation of the hydrological indicators and evidences (Arkoprovo et al., 2012).
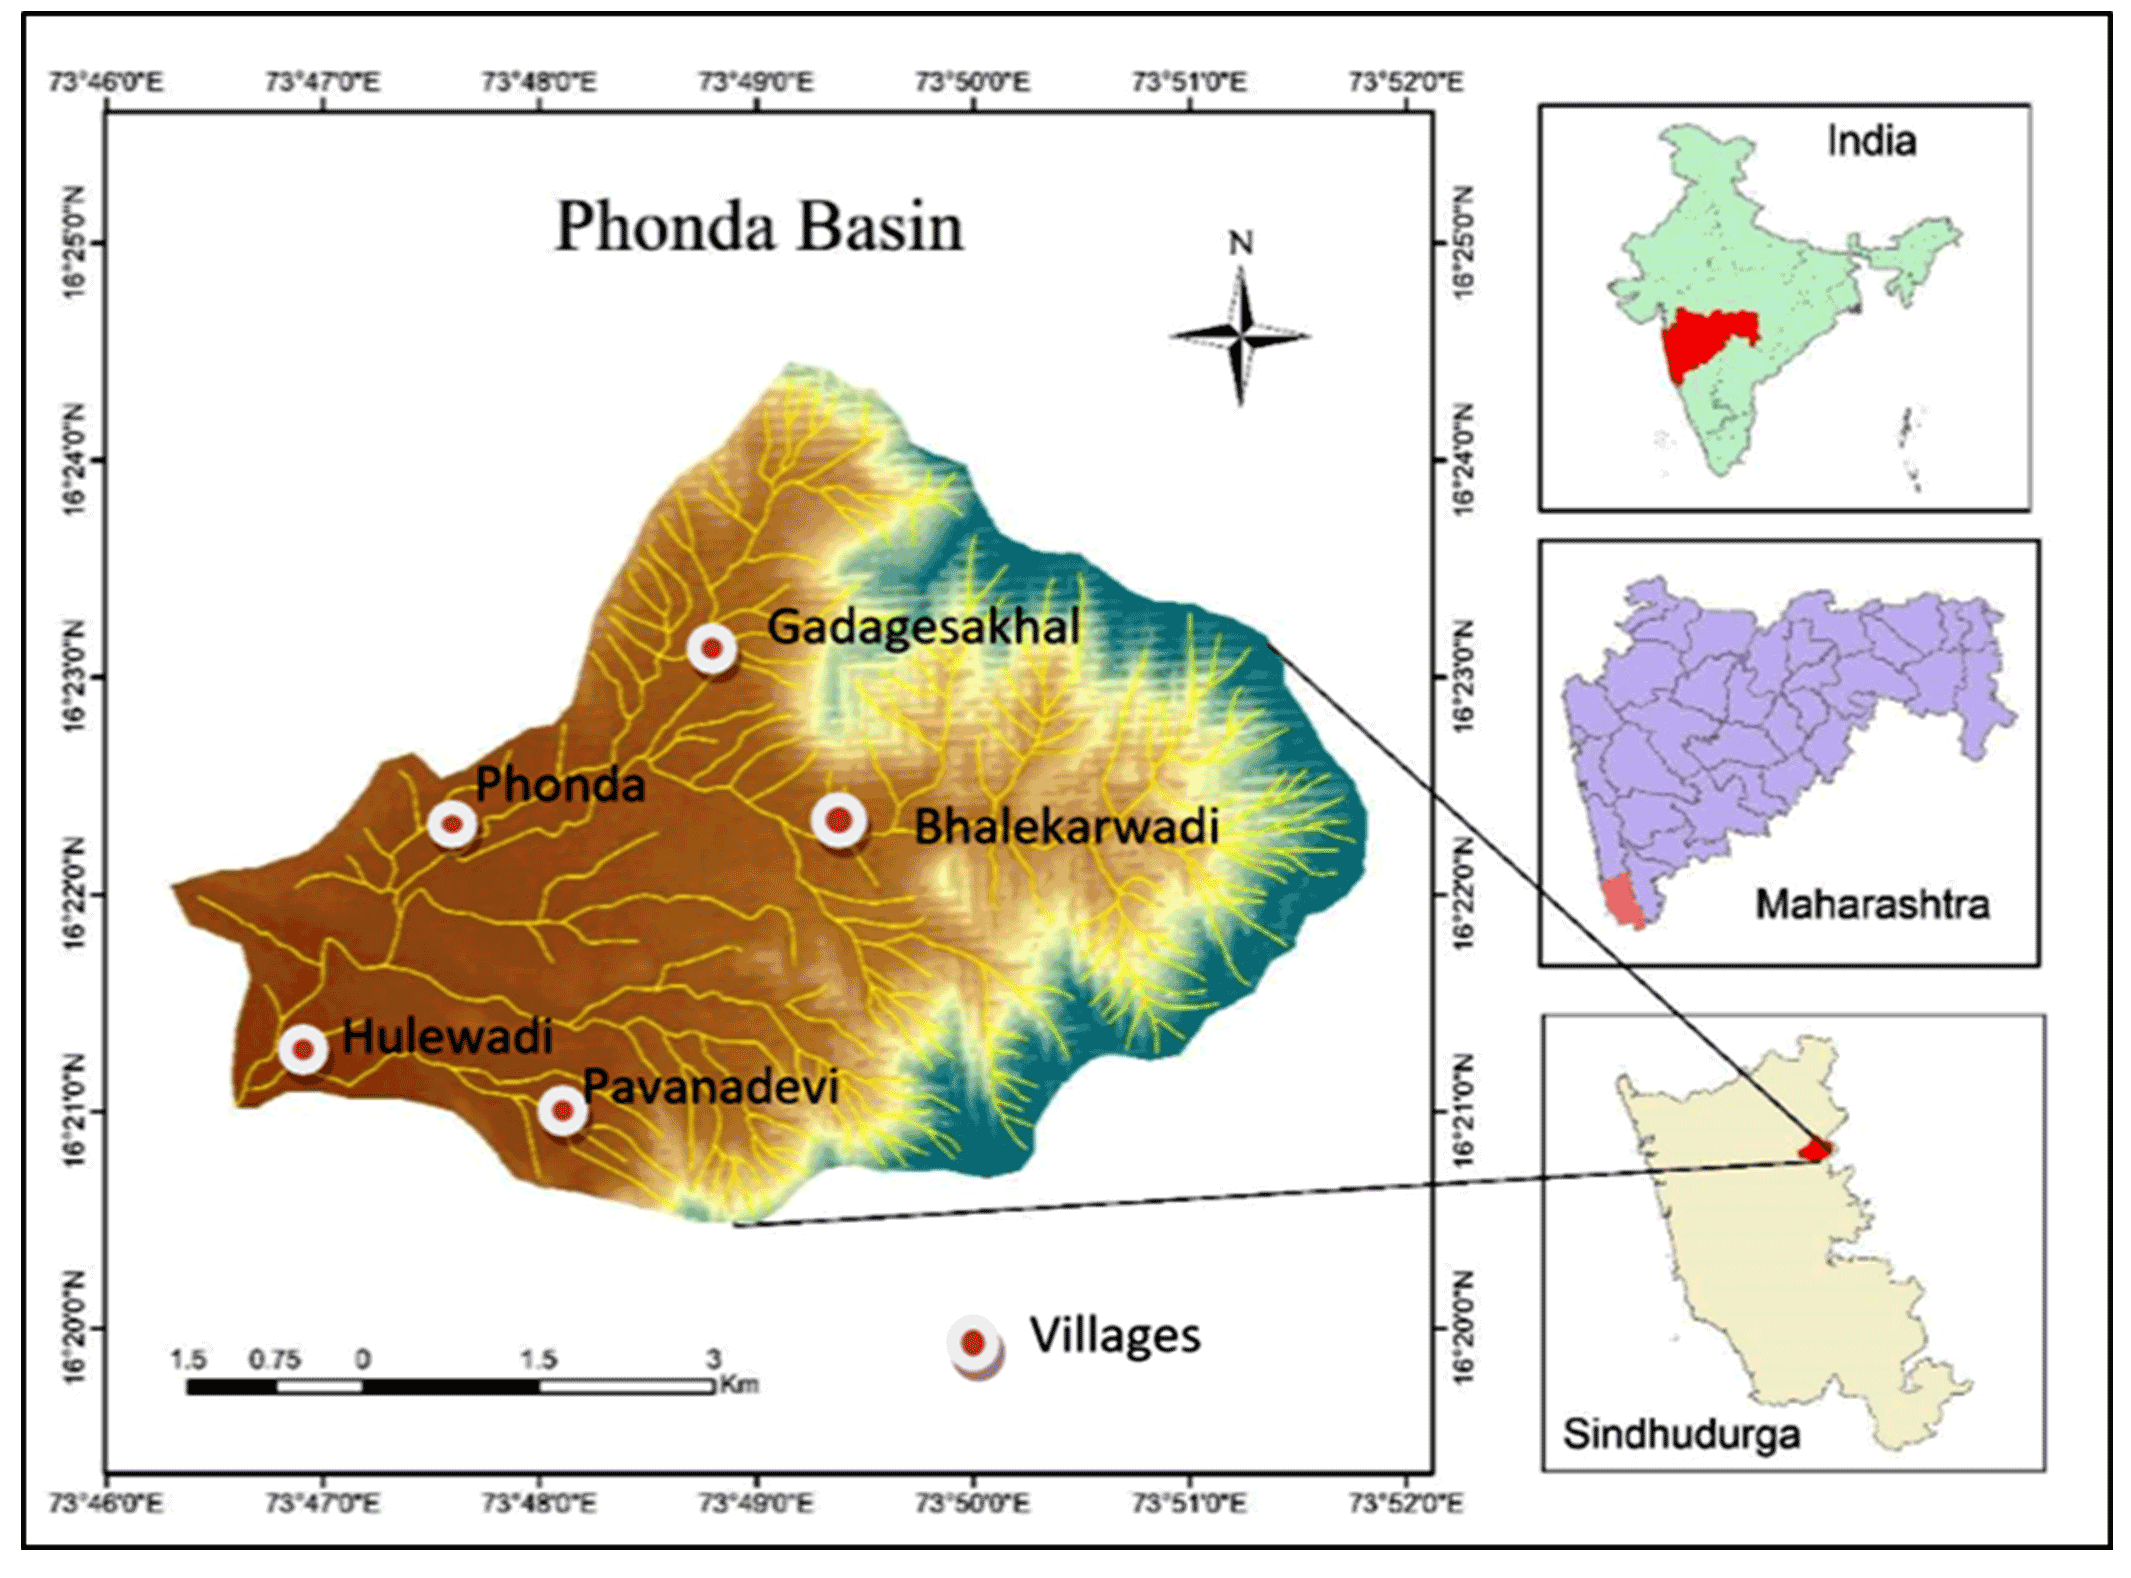
In study area covered by varied geological formations in Deccan trap, Kaladgies and some Precambrian metamorphic rocks. The occurrence of groundwater is varied as per lithology; in the case of study area occurrence of groundwater is different for different places. Sub-horizontally disposed Precambrian un-Metamorphosed sedimentary strata exposed widely in scattered outcrops in a part of Phonda region and surrounding area. These rocks are primarily a sandstone-shale gradation and intercalation sequence with some carbonaceous shale (black shale) intercalation (Kshirsagar and Jadhav, 2000). Therefore, the remote sensing and scientific data generation related to identification of GWPZ were considered essential. It is expected that the results of the study entitled by the lithological characteristic is affected by hydrological condition and the research is followed by an analysis of geological factors influencing groundwater potential zones (GWPZ) by using geospatial techniques in Phonda and surrounding area of Sindhudurg district, Maharashtra. Can be of immense validated for the realization of programs related to watershed development and management.
3 . MATERIAL AND METHODS
Identification and delineation of GWPZ in study area was performed using remote sensing data procured from various organizations. The data is downloaded from open and non-open sources and processed in GIS software.
ALOS PULSAR satellite imagery (February, 2010) was used to prepare the land use land cover map. The geological map was prepared using district resource map from Geological Survey of India (GSI, 2001, 2005). The drainage density and lineament density were prepared using the density analysis tool in ARC GIS 10.3. The rainfall distribution map was prepared using data recorded at different raingauge stations and available at www.weather.tamu.in. The integration method of AHP was adopted to combine all thematic layers by assigning rank and weightage for each thematic layer. This is a simple method to analyze multiclass maps based on the relative importance of each thematic layer and to each sub-categories. Several studies have reported the relative importance of various thematic layers that control the groundwater potentials. The weights for selected thematic layers were assigned based on Saaty’s (1980) scale. Suja Rose and Krishnan (2009), Nag and Ghosh (2012) and Agarwal et al. (2013) have suggested the weightages based on Saaty’s (1980) scale for different thematic maps and these thematic maps are intersect in each other and then these classified into classes: low, moderate, high and very high to delineate GWPZ. The individual layers and classes are assigned weightage and ranks: 0.6-0.9 (low), 0.09- 0.12 (moderate), 0.12-0.19 (high) and 0.19-0.28 (very high). Higher weightage and ranks are given to the sites that are expected to have high groundwater potential (Table 1).
Table 1. Weightages and ranking of criterion based on AHP
|
Thematic layer
|
Weights
|
Criterion
|
Ranks
|
AHP
|
|
Drainage density
|
9
|
0.0-1.0
|
6
|
\(C_r\) =
0.060891059
\(C_i\) =
0.075504913
|
|
|
|
1.1-2.0
|
5
|
|
|
|
2.1-3.0
|
4
|
|
|
|
3.1-4.0
|
3
|
|
|
|
4.1-5.0
|
2
|
|
|
|
5.1-6.0
|
1
|
|
Geology
|
8
|
Metamorphic
|
1
|
|
|
|
Shale
|
2
|
|
|
|
Basalt
|
3
|
|
|
|
Sandstone
|
4
|
|
Rainfall
|
7
|
3670 - 3720
|
1
|
|
|
|
3720 - 3770
|
2
|
|
|
|
3770 - 3810
|
3
|
|
|
|
3810 - 3870
|
4
|
|
|
|
3870 - 3910
|
5
|
|
|
|
3910 - 3960
|
6
|
|
|
|
3960 - 4010
|
7
|
|
|
|
4010 - 4060
|
8
|
|
Lineament
|
4
|
000 - 0.54
|
1
|
|
|
|
0.54 -1.1
|
2
|
|
|
|
1.2 - 1.6
|
3
|
|
|
|
1.7 - 2.2
|
4
|
|
|
|
2.3 - 2.7
|
5
|
|
|
|
2.8 - 3.2
|
6
|
|
Geomorphology
|
5
|
Hills
|
1
|
|
|
|
Denudational
|
2
|
|
|
|
Structural
|
4
|
|
|
|
Water body
|
6
|
|
Soil
|
4
|
Moderately drained loam
|
1
|
|
|
|
Excessively drained
|
3
|
|
|
|
Well and excessively drained
|
5
|
|
|
|
Well drained
|
6
|
|
Slope
|
3
|
0-7.1º
|
5
|
|
|
|
7.1-15º
|
4
|
|
|
|
15-23º
|
3
|
|
|
|
23-33º
|
2
|
|
|
|
33-63º
|
1
|
|
Elevation
|
2
|
13-112
|
5
|
|
|
|
112-216
|
4
|
|
|
|
216-333
|
3
|
|
|
|
333-468
|
2
|
|
|
|
468-659
|
1
|
|
LULC
|
1
|
Settlement
|
1
|
|
|
|
Barren rocky land
|
2
|
|
|
|
Fallow land
|
4
|
|
|
|
Vegetation
|
5
|
|
|
|
Water body
|
6
|
In order to assess groundwater potential in the study area, nine thematic maps viz., geomorphology, lithology, elevation, slope, lineament density, drainage density, soil, rainfall and land use land cover were prepared using remote sensing and conventional data with the help of ARC GIS environment.
AHP analyzes different datasets into a pairwise matrix to calculate geometric mean and normalized weight of parameters (Chowdhury et al., 2009). Assignment of weights and normalization the weights were decided based on field experience and expert opinions. Thus, the weights assigned to different thematic maps and their individual features were normalized by using Saaty’s AHP method. The normalization process reduces the subjectivity associated with the assigned weights of the thematic maps and their features. The normalized weights of the thematic layers and those of their features were examined for consistency as recommended by Saaty (1980). Saaty (1980) suggested computing consistency ratio (CR) for this purpose. The following steps were followed to compute CR for each theme and feature:
Step 1: Principal eigenvalue ( \(\lambda\) ) was computed by eigenvector technique.
Step 2: Consistency index ( \(C_i \) ) was calculated from the equation (equation (1)) (Saaty, 1980) -
\(C_i = {\lambda \ max-1 \over n-1}\) (1)
where,
\(\lambda \ max\) is sum of normalization average and \(n\) is the number of criteria or factors.
Step 3: Finally, \(CR\) was calculated as (Saaty 1980) -
\(CR=C_i/RC_i \) (2)
where, \(CR_i\) is random consistency index. The value of \(CR_i\) was obtained from the saaty’s 1-9 scale. The value of \(CR\) should be less than 10% (Saaty, 1980) for consistent weights; otherwise the corresponding weights should be re-evaluated to avoid inconsistency.
The thematic layers: geology, geomorphology, slope, land use and land cover, soil, elevation, drainage, lineament and rainfall were analyzed by AHP approach including geometric mean and normalized weight calculation to explore the potential zone for groundwater recharge.
4 . RESULTS AND DISCUSSIONS
Groundwater availability mainly depends on geology, geomorphology, soil, lineament density, drainage density, rainfall and land use. Hence, all the thematic maps pertaining to the study area were prepared.
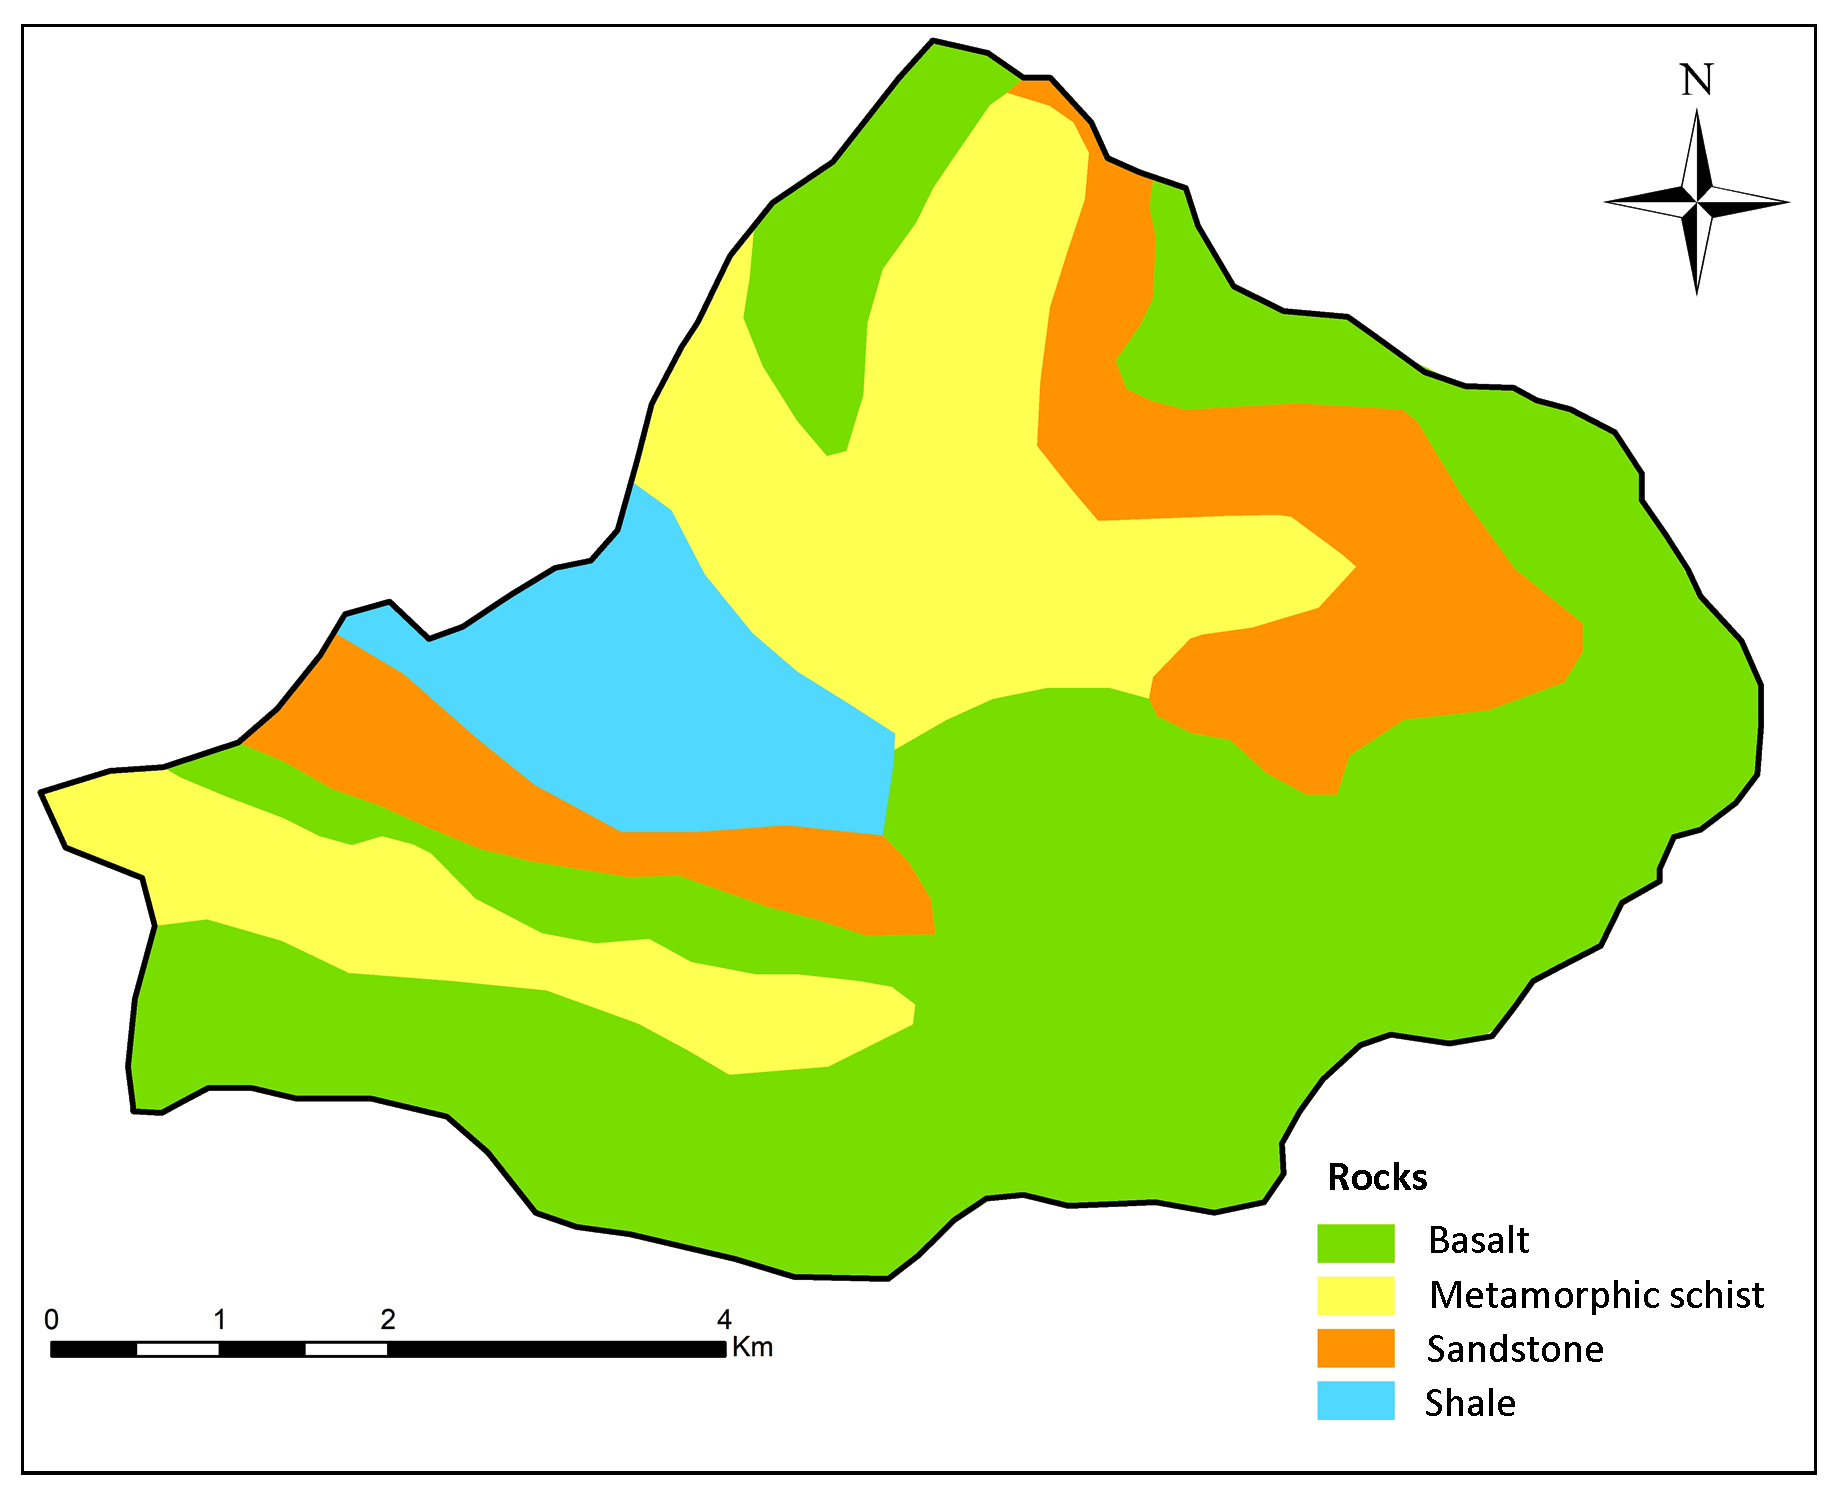
4.1 Geology
The geological map (Figure 2) is prepared from district resource map of Sindhudurg from Geological Survey of India in Arc map 10.3 software. Geologically, the study area vary in different lithology such as igneous mostly Deccan trap basalt, ‘aa’ type, sedimentary like sandstone, sedimentary quartzite, and sandstone with intercalation shale, these sedimentary rocks belong to Kaladgi super group named as ‘Kokankaladgi’. Some metamorphic lithology such as schist and gneisses, and it belongs to Dharwarian rocks. In igneous rock like basalt, water storage and transmitting capacity depends on its vascularity and jointing pattern. The basalt of study area is mostly ‘aa’ type of lava formation and consists of vesicular and spaced jointed show better groundwater potentiality.
The sandstone consists of coarse sand particles results of greater intergranular spaces and this intergranular spaces are very good aquifer to store and transfer the groundwater. The sandstone is slightly in sand (70%) and clay (30%) composition. The sedimentary shale is a type of aquiclude (maximum store the water and minimum or not transmit the groundwater), the shale consist of clay minerals.
In metamorphic rocks, it belongs to Dharwarian super group of Precambrian era, these rocks consist of Schistosity and Gneissosity. Schistosity is mineral arranged in parallel manner, and Gneissosity is alternate bands of schistose and granulose (quartz). Planes in these rocks are weak and this planes are useful to flow the groundwater but consequently, very poor in characters.
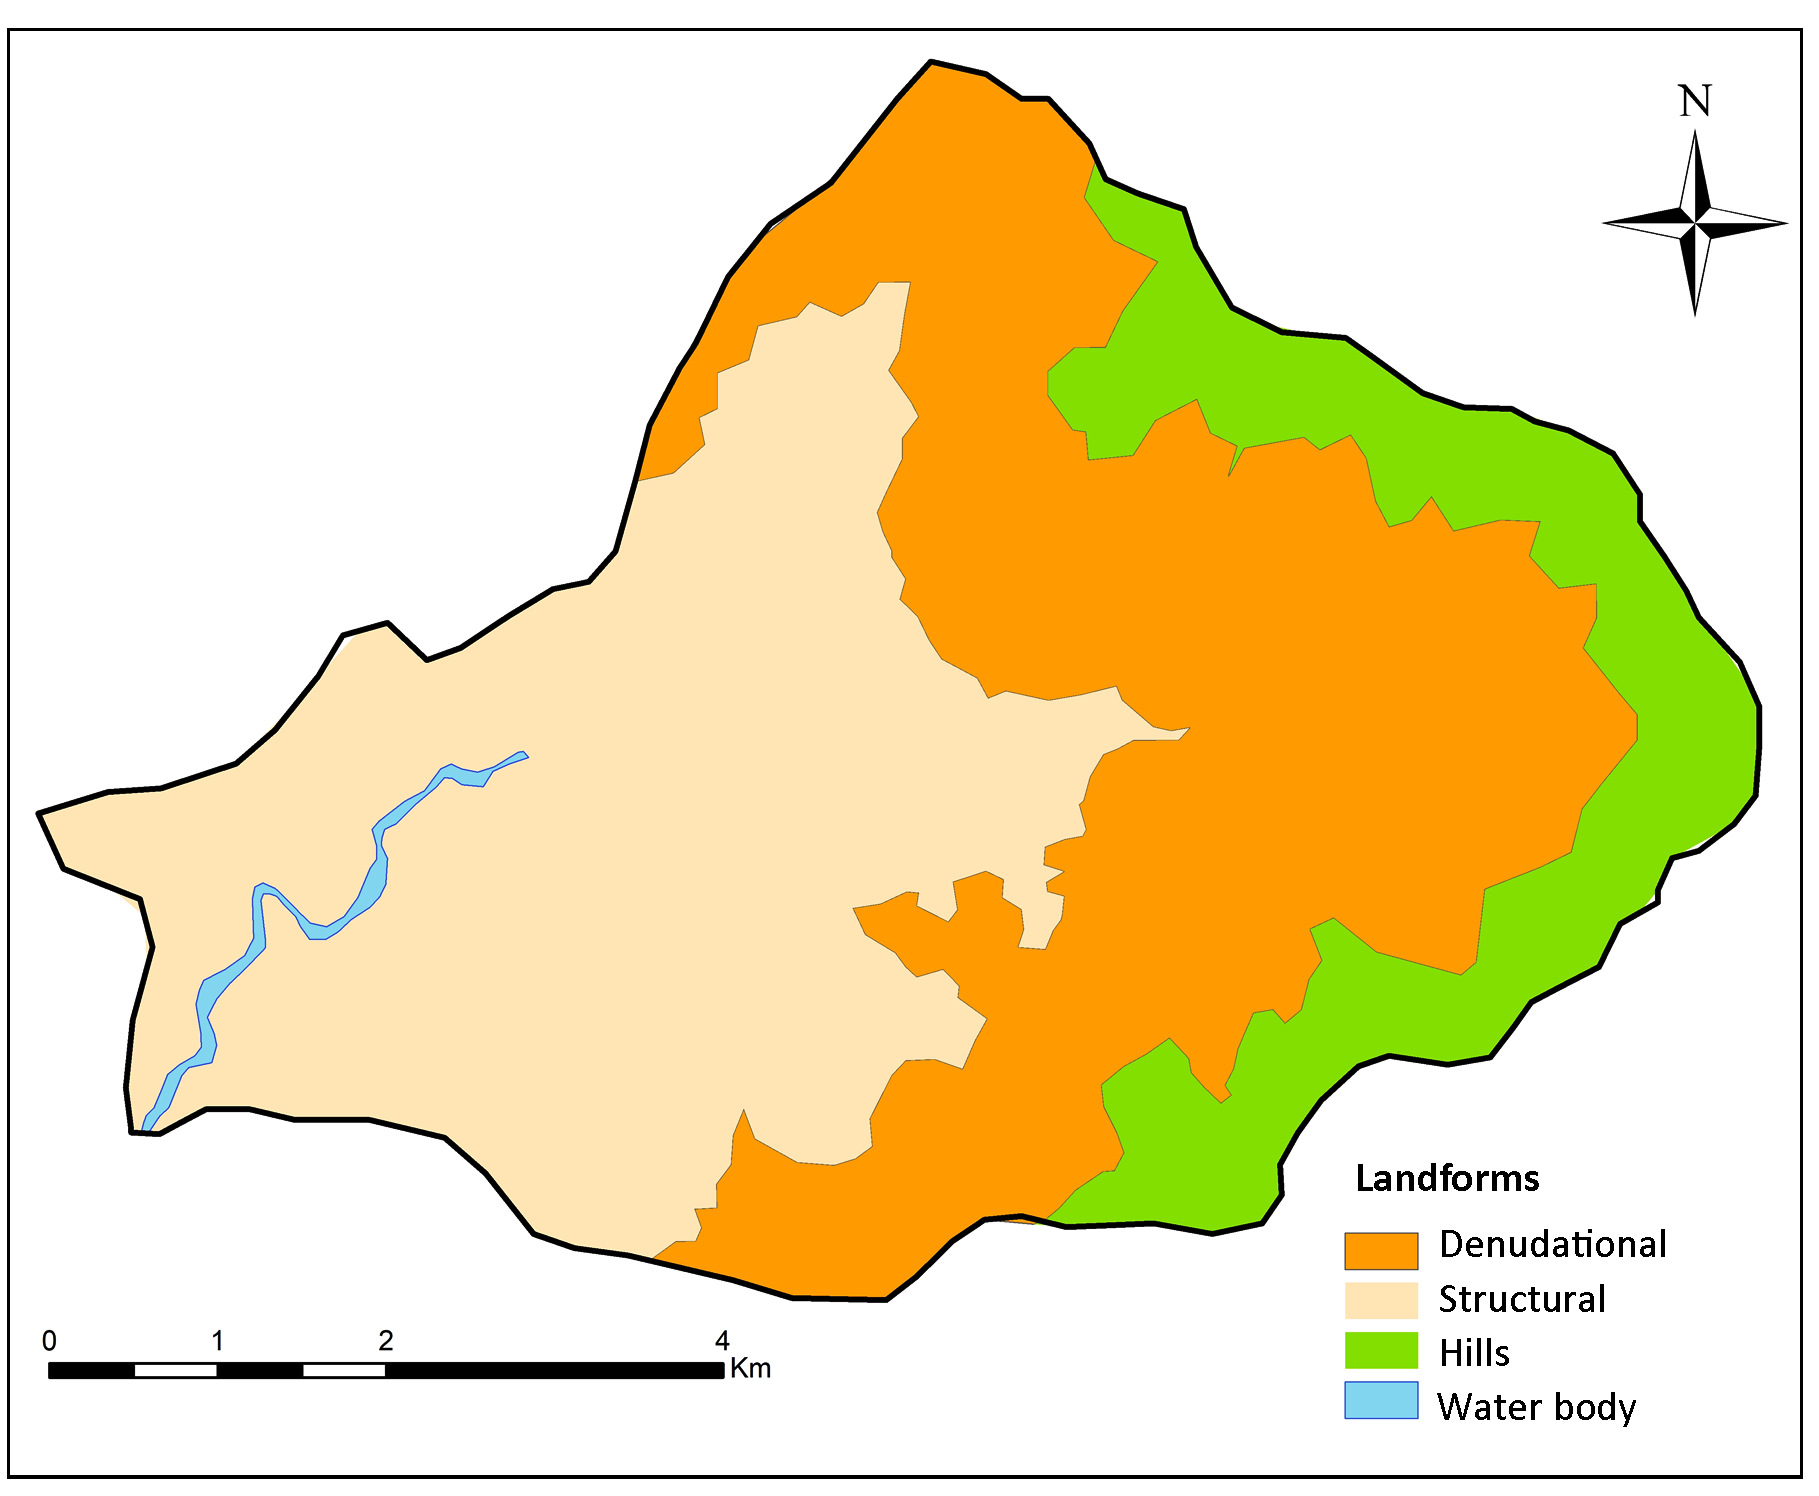
4.2 Geomorphology
The identification of geomorphologic features is very important for demarcating groundwater potential. The major geomorphologic features are hills, denudational, structural and water body (Figure 3). Hills and valleys of Phondaghat section at above 250m from MSL, the ranks are assigned to low because of more runoff and less infiltration rate. The denudational landforms are those formed by combined effect of weathering and erosion of upper basaltic hills and they have deposited foot of hills show more infiltration rate than the hilly region, so ranked higher. The structural geomorphology shows various tectonic structures like folds, faults or lineaments and formed in tectonic process from Kaladgi and Bhima basin and Dharwar craton. The store and transfer capacity of groundwater is more in these structural features than the denudation. They are observed in the form of Janavali River flows through Southwest part of study area. The water storage capacity of the rock is very strong and all streams are recharging them therefore, the ranks assigned higher.
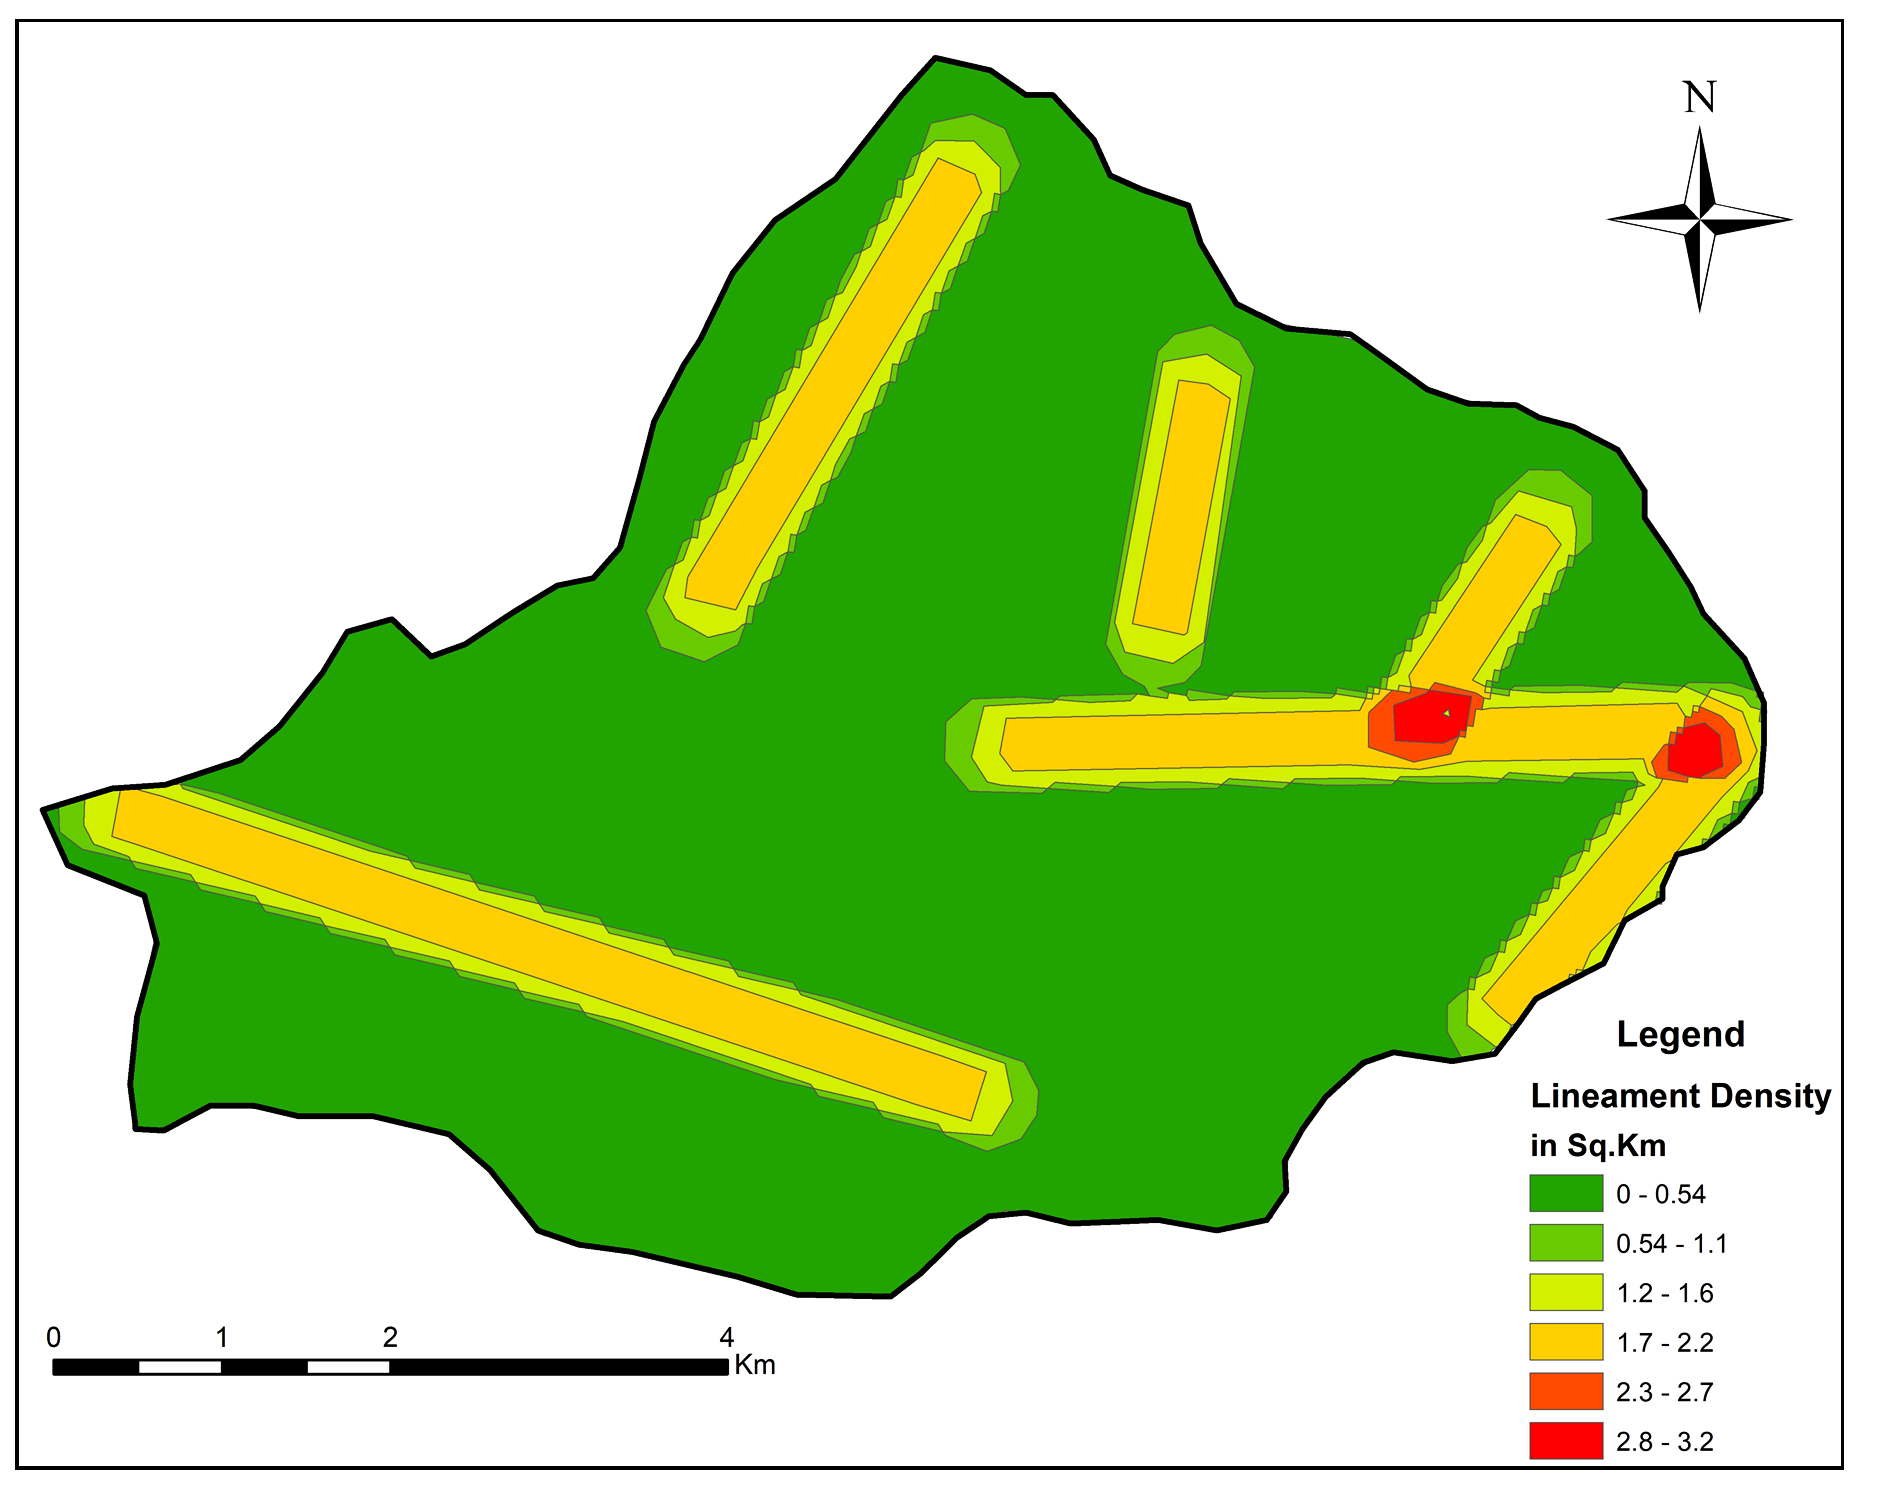
4.3 Lineaments
Lineaments are linear features useful to delineate ground water potential zones. Surface lineament map was prepared using the data downloaded from Bhuvan NRSC (2011). Lineaments are the sharp linear features indicated by six tones color (Figure 4). The study area shows six lineaments. Lineaments were mainly found along the Northwest-Southeast and Northeast-Southwest directions, and a very few are along the East-West and North-South directions (Figure 4). Lineaments play a very important role in recharging groundwater in the hard terrains rock (Koch et al., 1997). Groundwater potential is more near to lineament zones.
The lineament density was estimated using the line density tool in Arc map 10.3 software. Polygons with higher values of lineament density will achieve greater recharge and hence a better prospects for groundwater. Lineament density was classified into: 0-0.5423, 0.5423-1.0840, 1.0840-1.6270, 2.1694-2.7117 and 2.7117-3.2542.
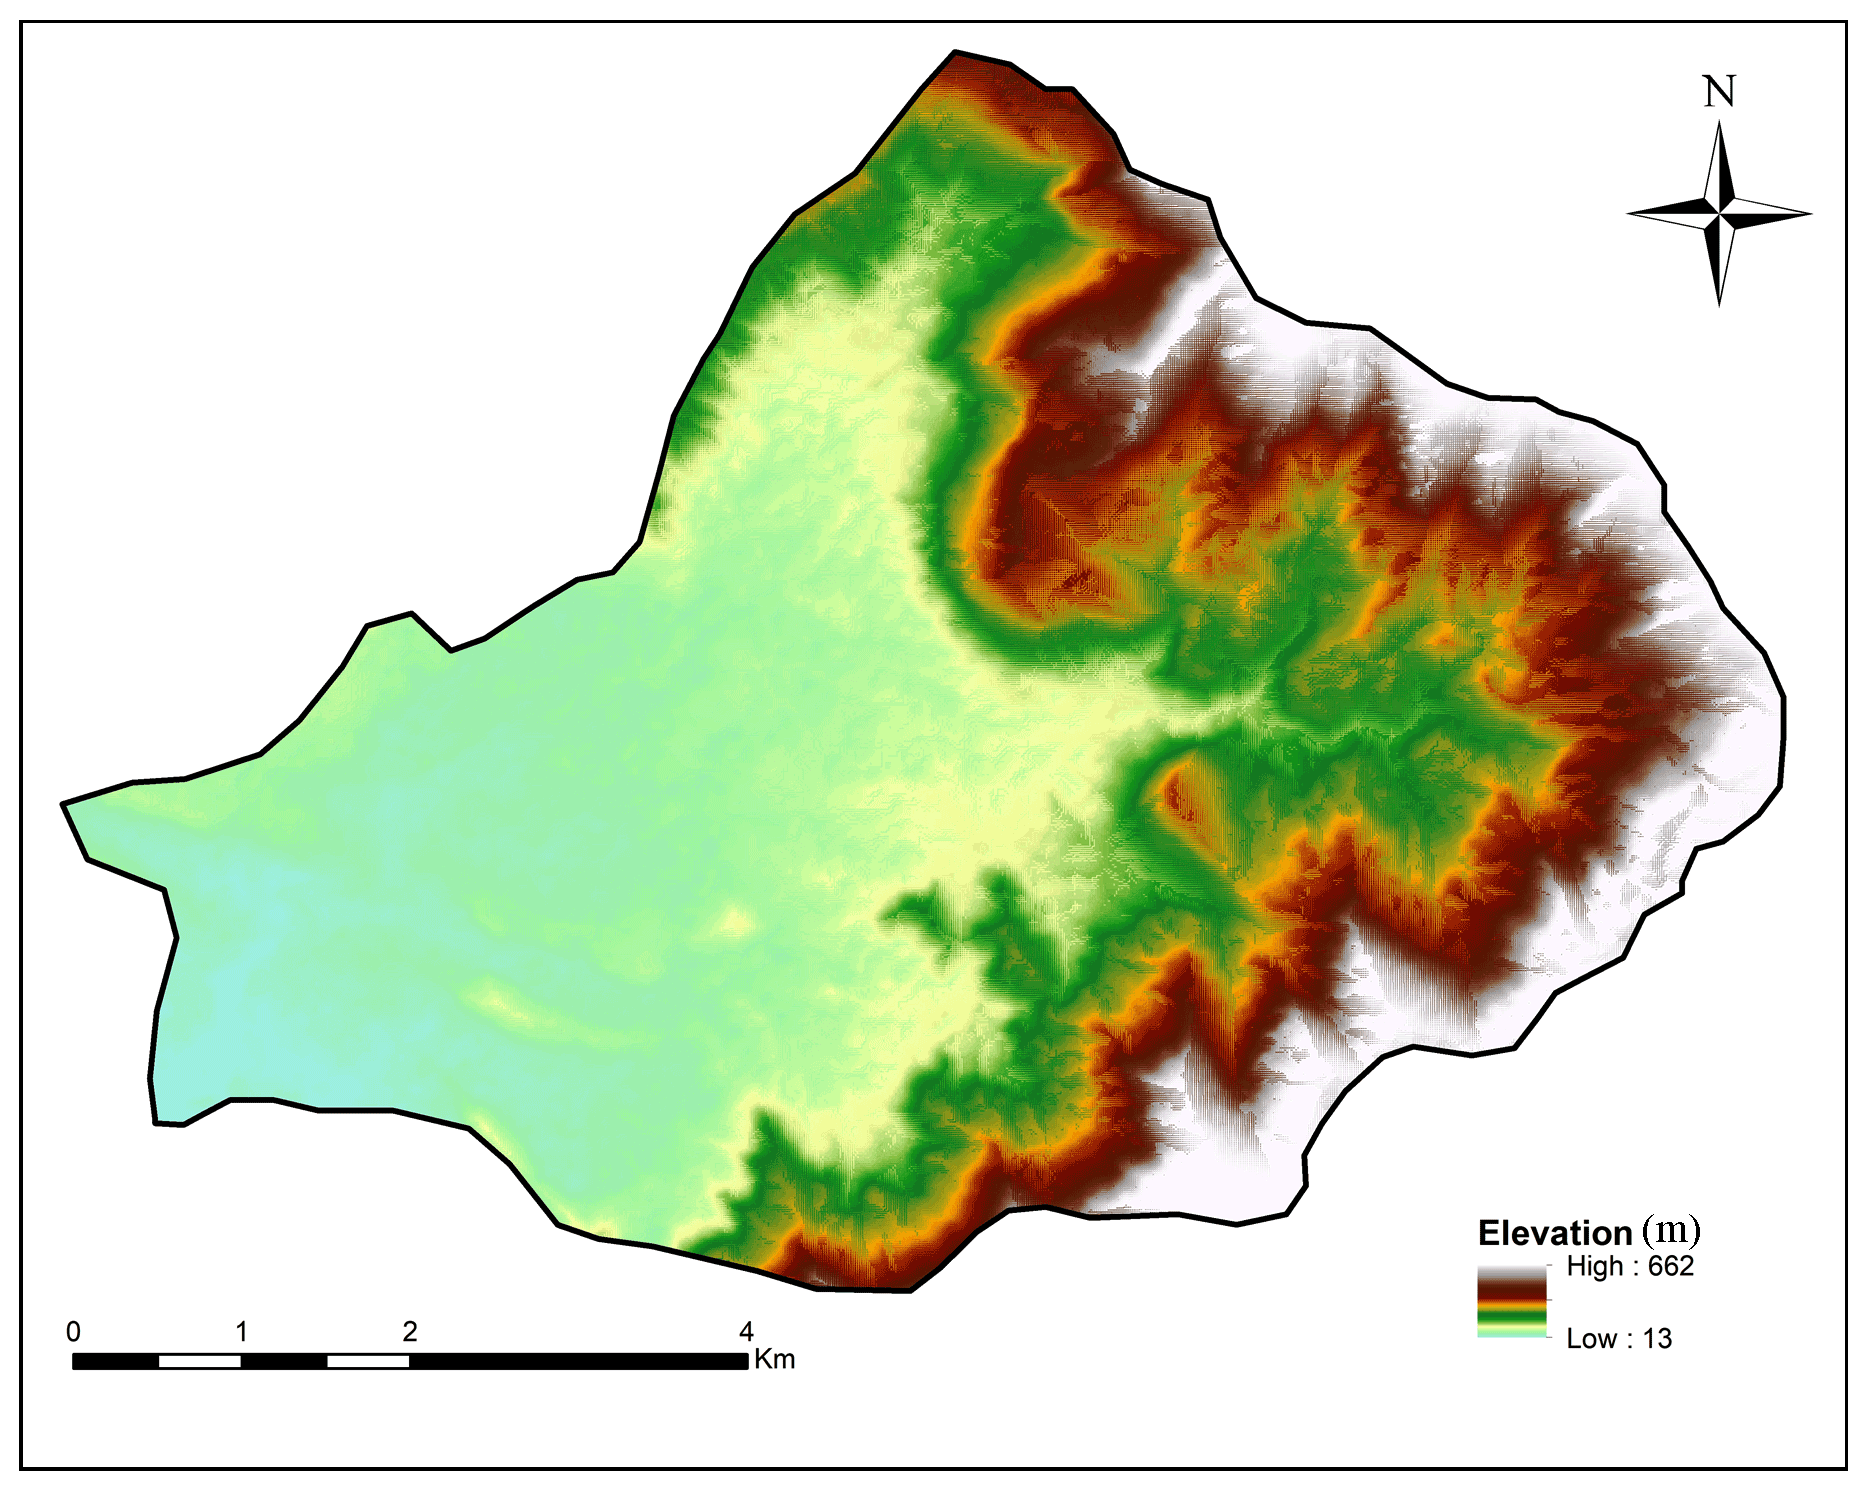
4.4 Elevation
Elevation of the area is an indicator of infiltration rate. The places with higher elevation show less infiltration rate than the foothill zones (Figure 5). Relationship between the elevation and ground water were estimated based on basis two classes prepared using DEM. The lowlands show more groundwater potentials and assigned higher weightages as compared to hilly areas.
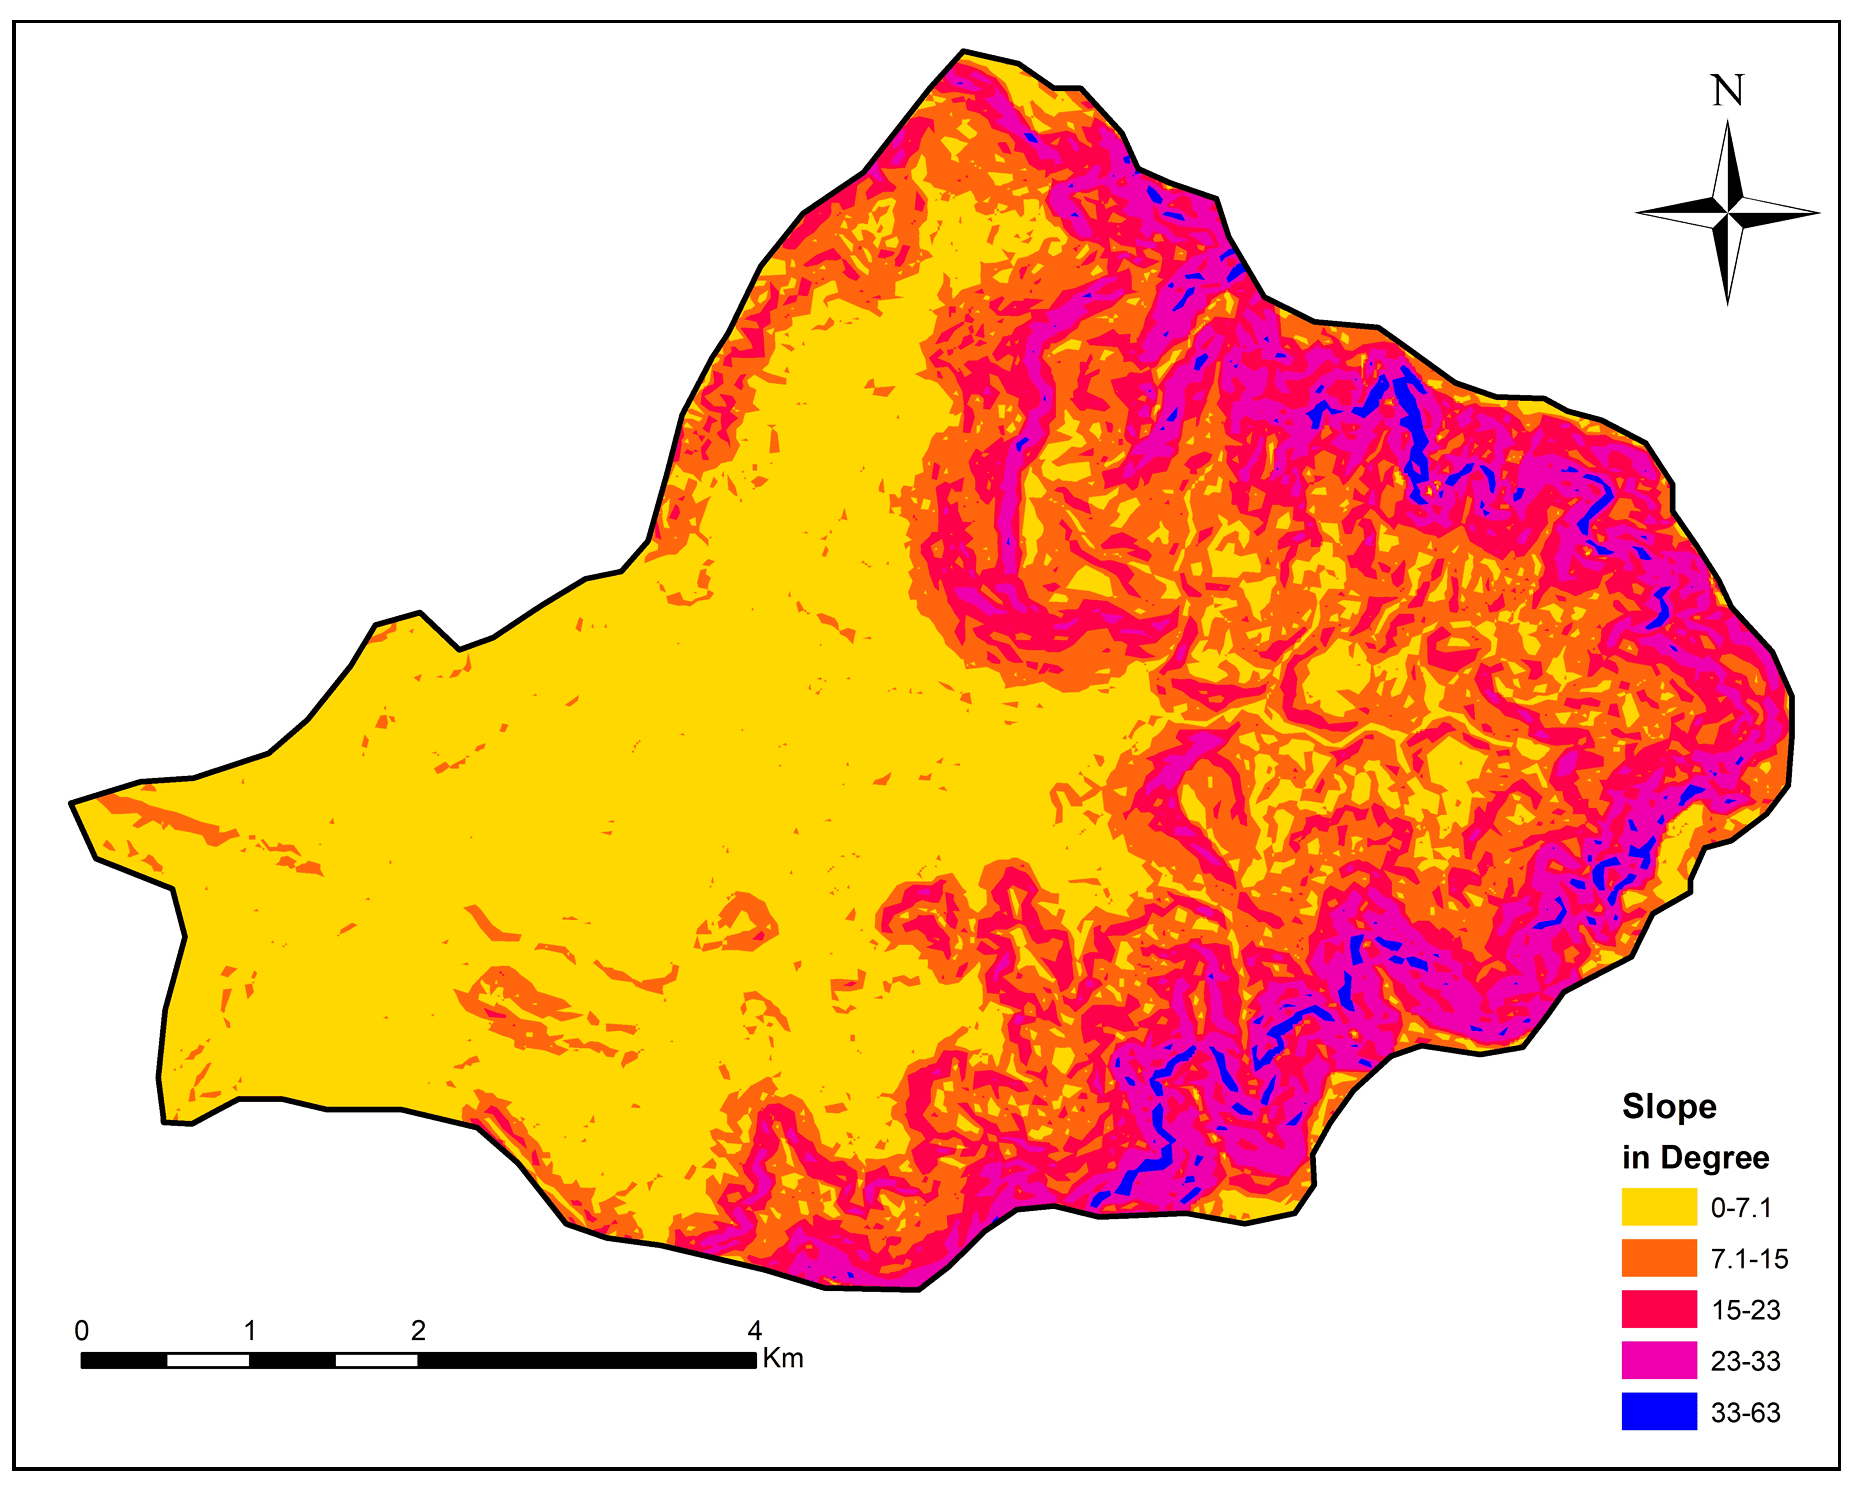
4.5 Slopes
Slope map was prepared from ALOS pulsar DEM (12.5m). Greater portion of the area is rugged hilly terrain except the upper part with steep slopes varies from 33% to 63%. Slope range was classified into five groups: 0-7.10, 7.1-150, 15-230, 23-330 and 33-630 (Figure 6). Higher slopes produce more runoff with lesser infiltration and show poor groundwater prospects where as more groundwater in the areas with lower slopes. Therefore, the higher weights were assigned to gentle slope and lesser to higher slope (Table 1).
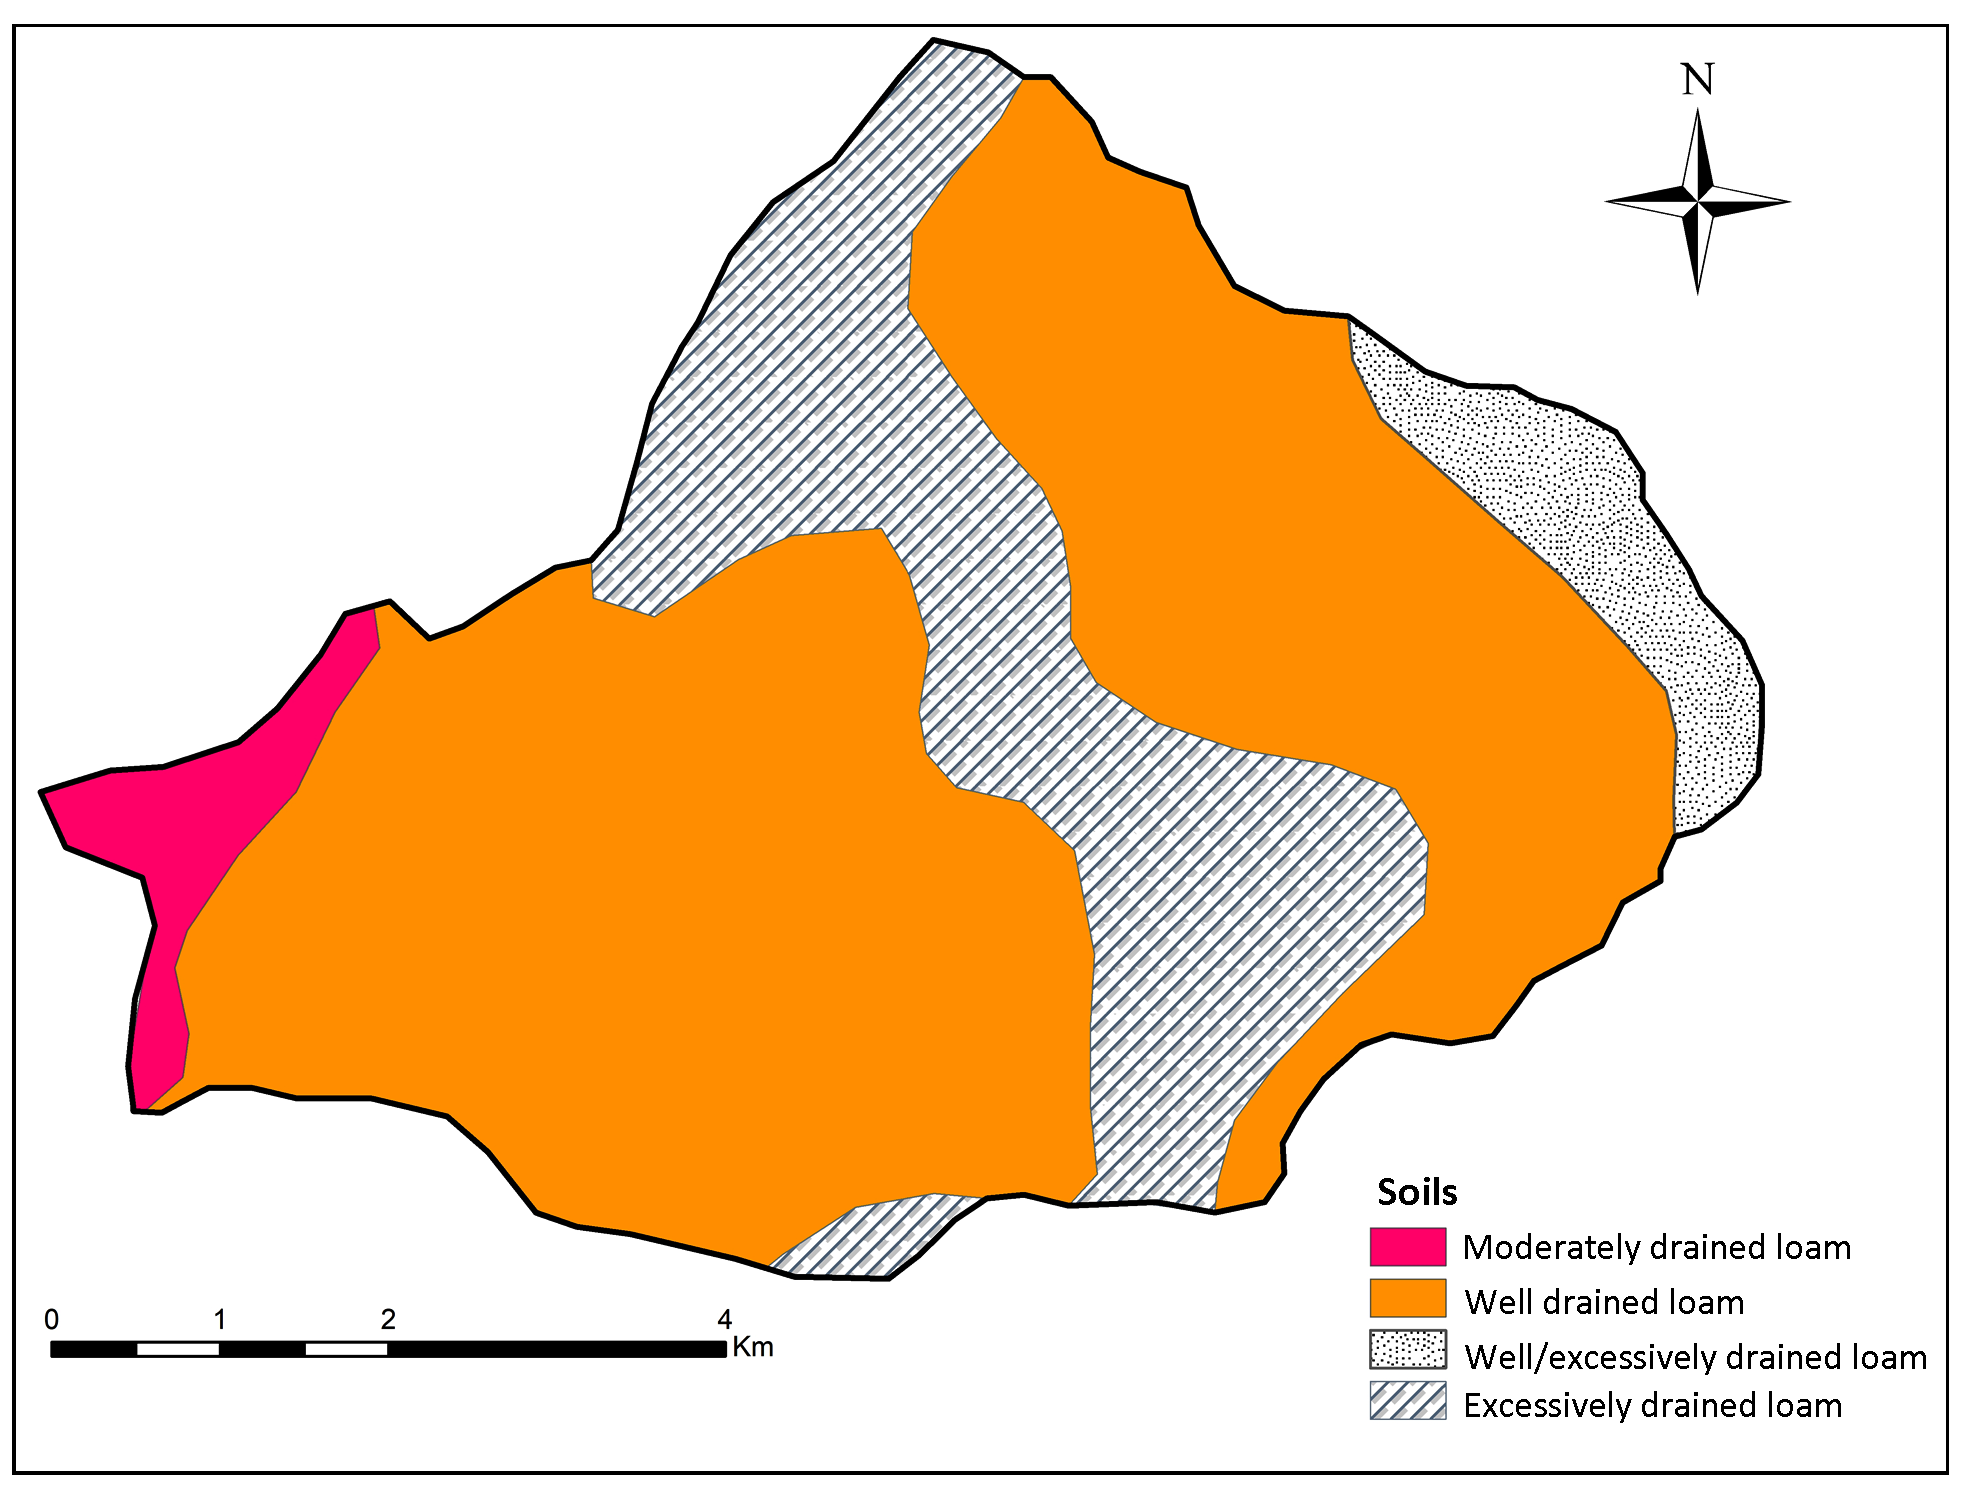
4.6 Soils
Soil map was prepared using the district resource map (GSI) and satellite imageries. Mainly two soil types: red earths and red sandy soils in the region were ranked based on their groundwater expectations. The sandy soils are very highly permeable, light textured and well drained, and rate of infiltration is excellent (Figure 7). Red earth soils are moderately well drained and possess of fine loams. The moisture content of the soil is very nice because of its fine loamy texture. The green forest soil is rich in humus.
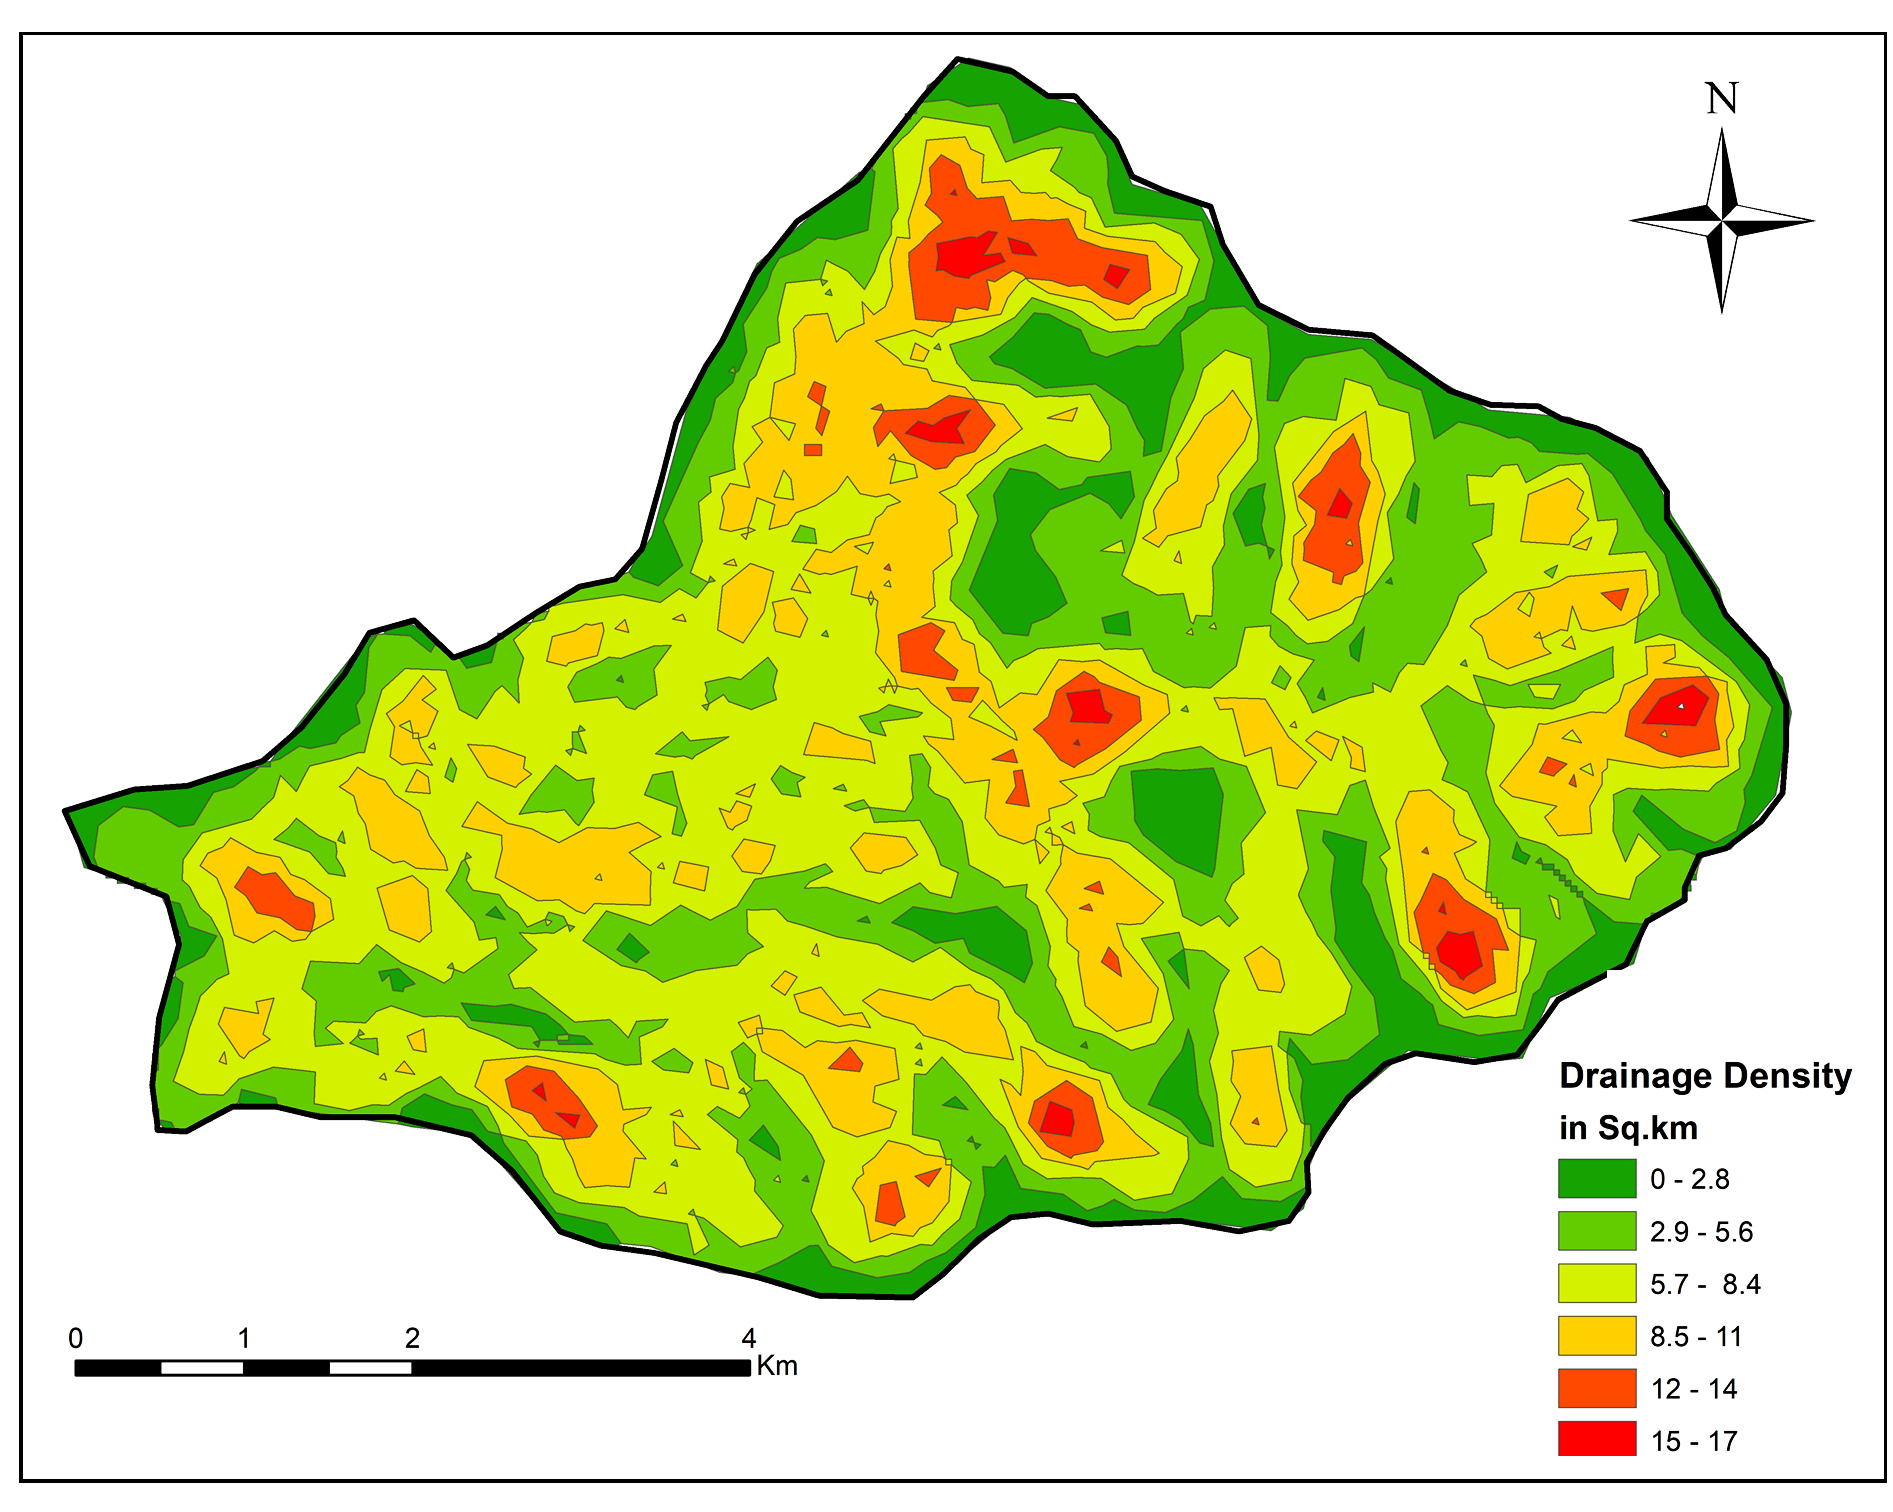
4.7 Drainage density
The drainage network in study area was delineated from SOI toposheet (47 h/15) and digitized in Arc map 10.3 software and categorized into 6 classes. The drainage density (Figure 8) was calculated (Miller, 1953) as ‘total length of streams divided by the sub-basin area (stream length/area)’ and expressed as km/km2. It was estimated about 0.024 m-1 and estimated values were grouped into six classes: 0-2.8, 2.9-5.6, 5.7-8.4, 8.5-11, 12-14, and 15-17. A low drainage density region causes higher infiltration and show better groundwater potential. The higher weight was given to the region with low drainage density and lesser weight to the region of high drainage density.
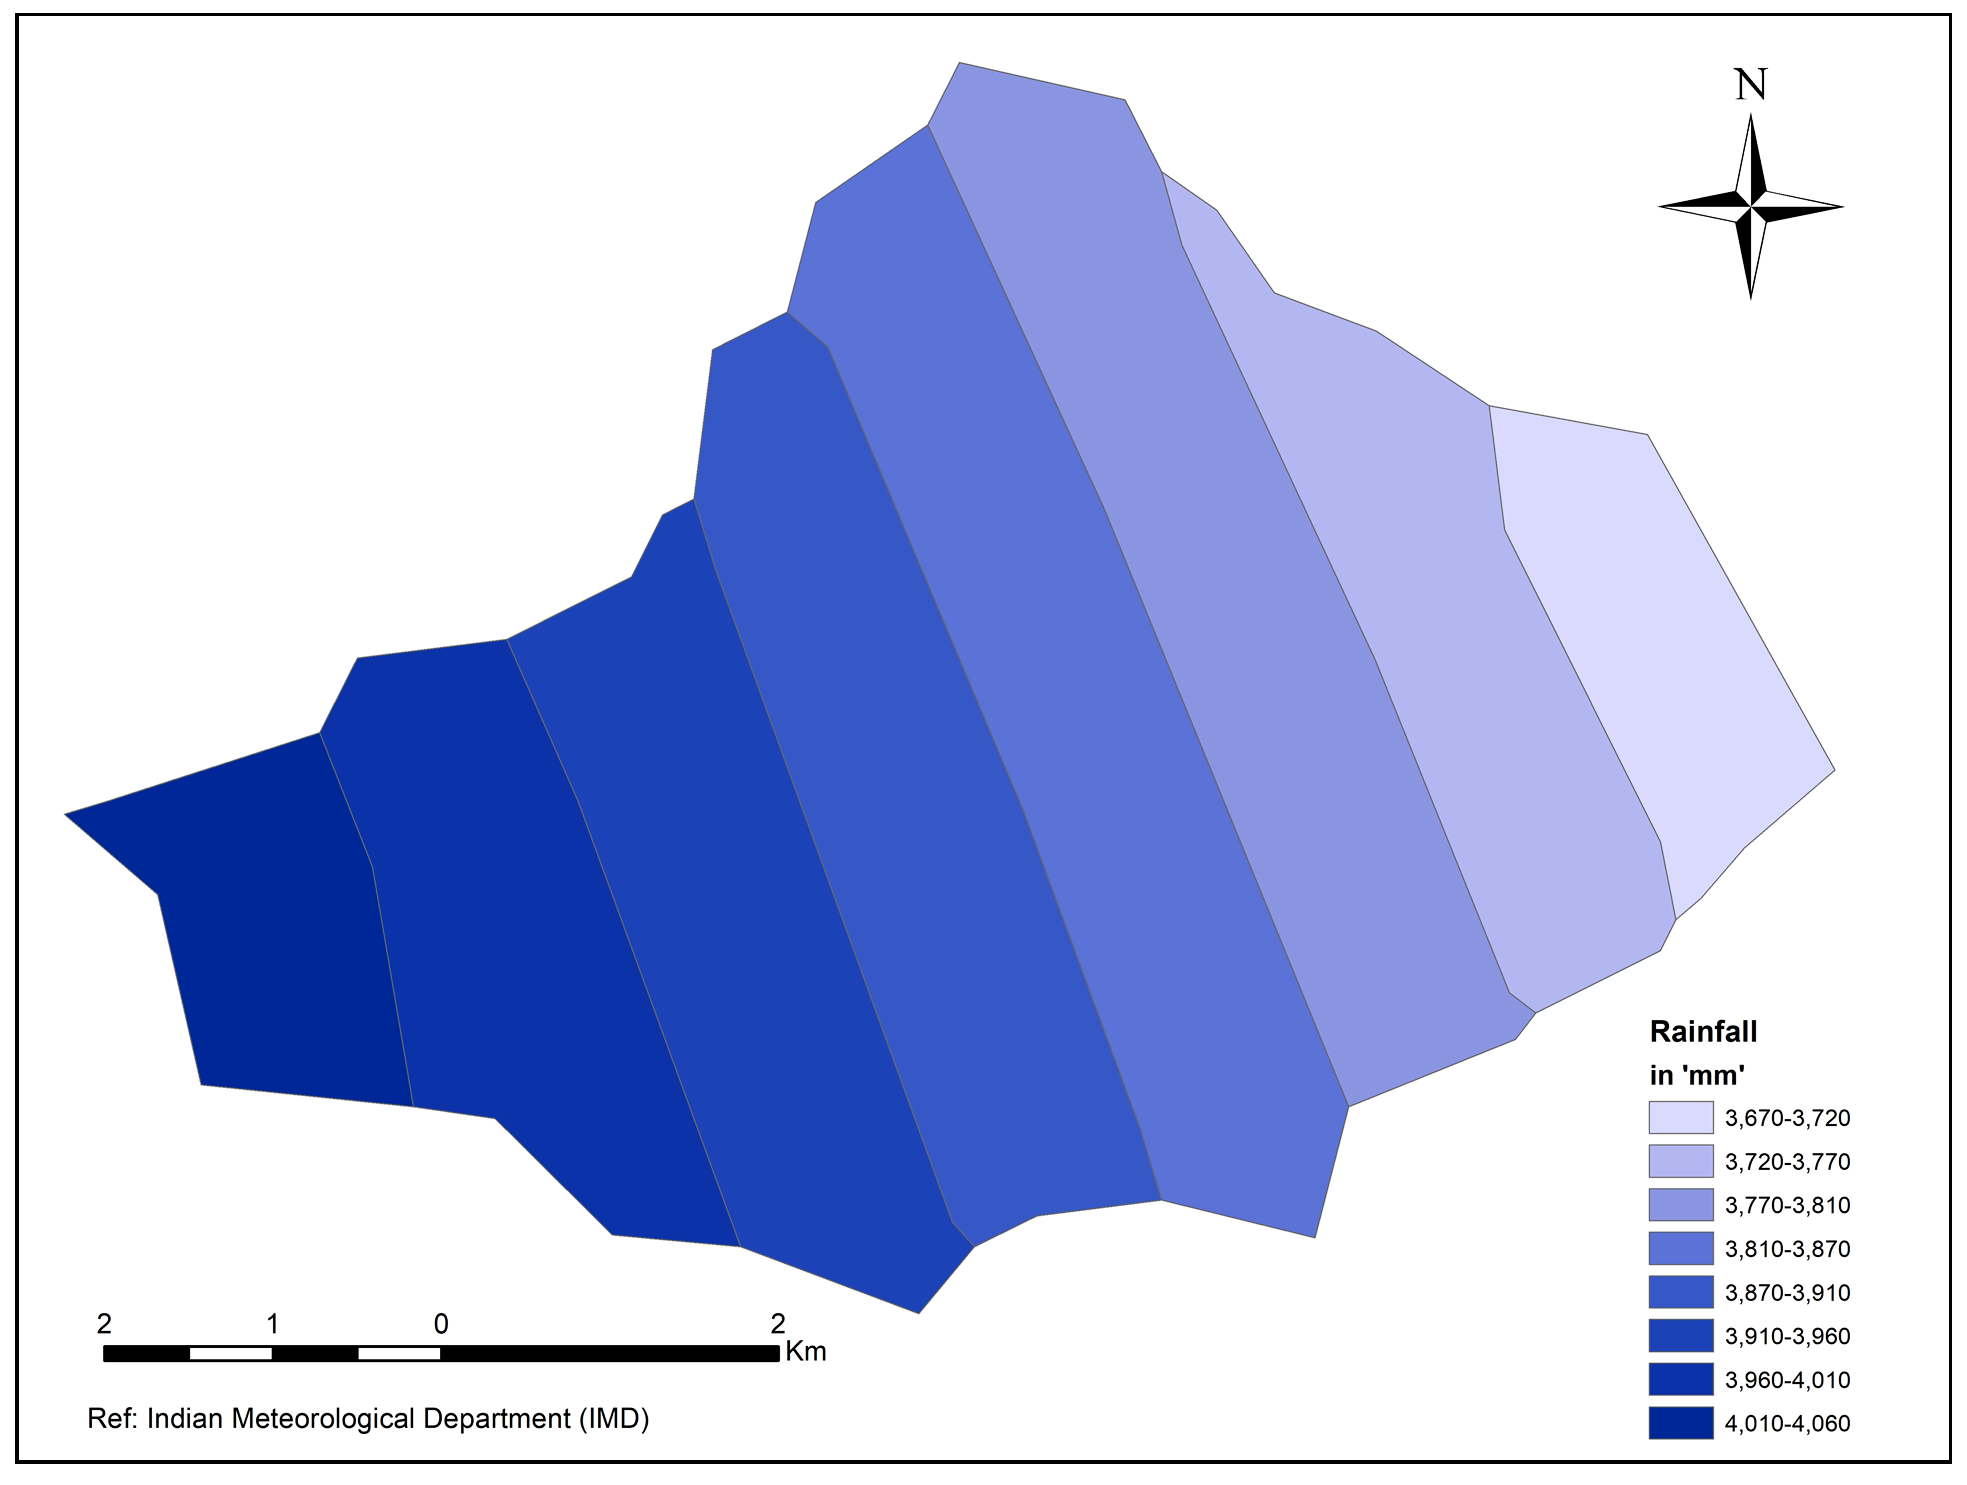
4.8 Rainfall
Rainfall is the source of water to percolate into the rocks and groundwater system. Western part (Figure 9) of the area receives more amount of rainfall while the Southern part receives the lesser amount of rainfall. High rainfall is favorable for high groundwater potential, hence assigned higher weights. Rainfall in the region was categorized into: 3670-3720, 3720-3770, 3770-3810, 3810-3870,3870-3910, 3910-3960, 3960-4010 and 4010-4060mm rainfall classes.
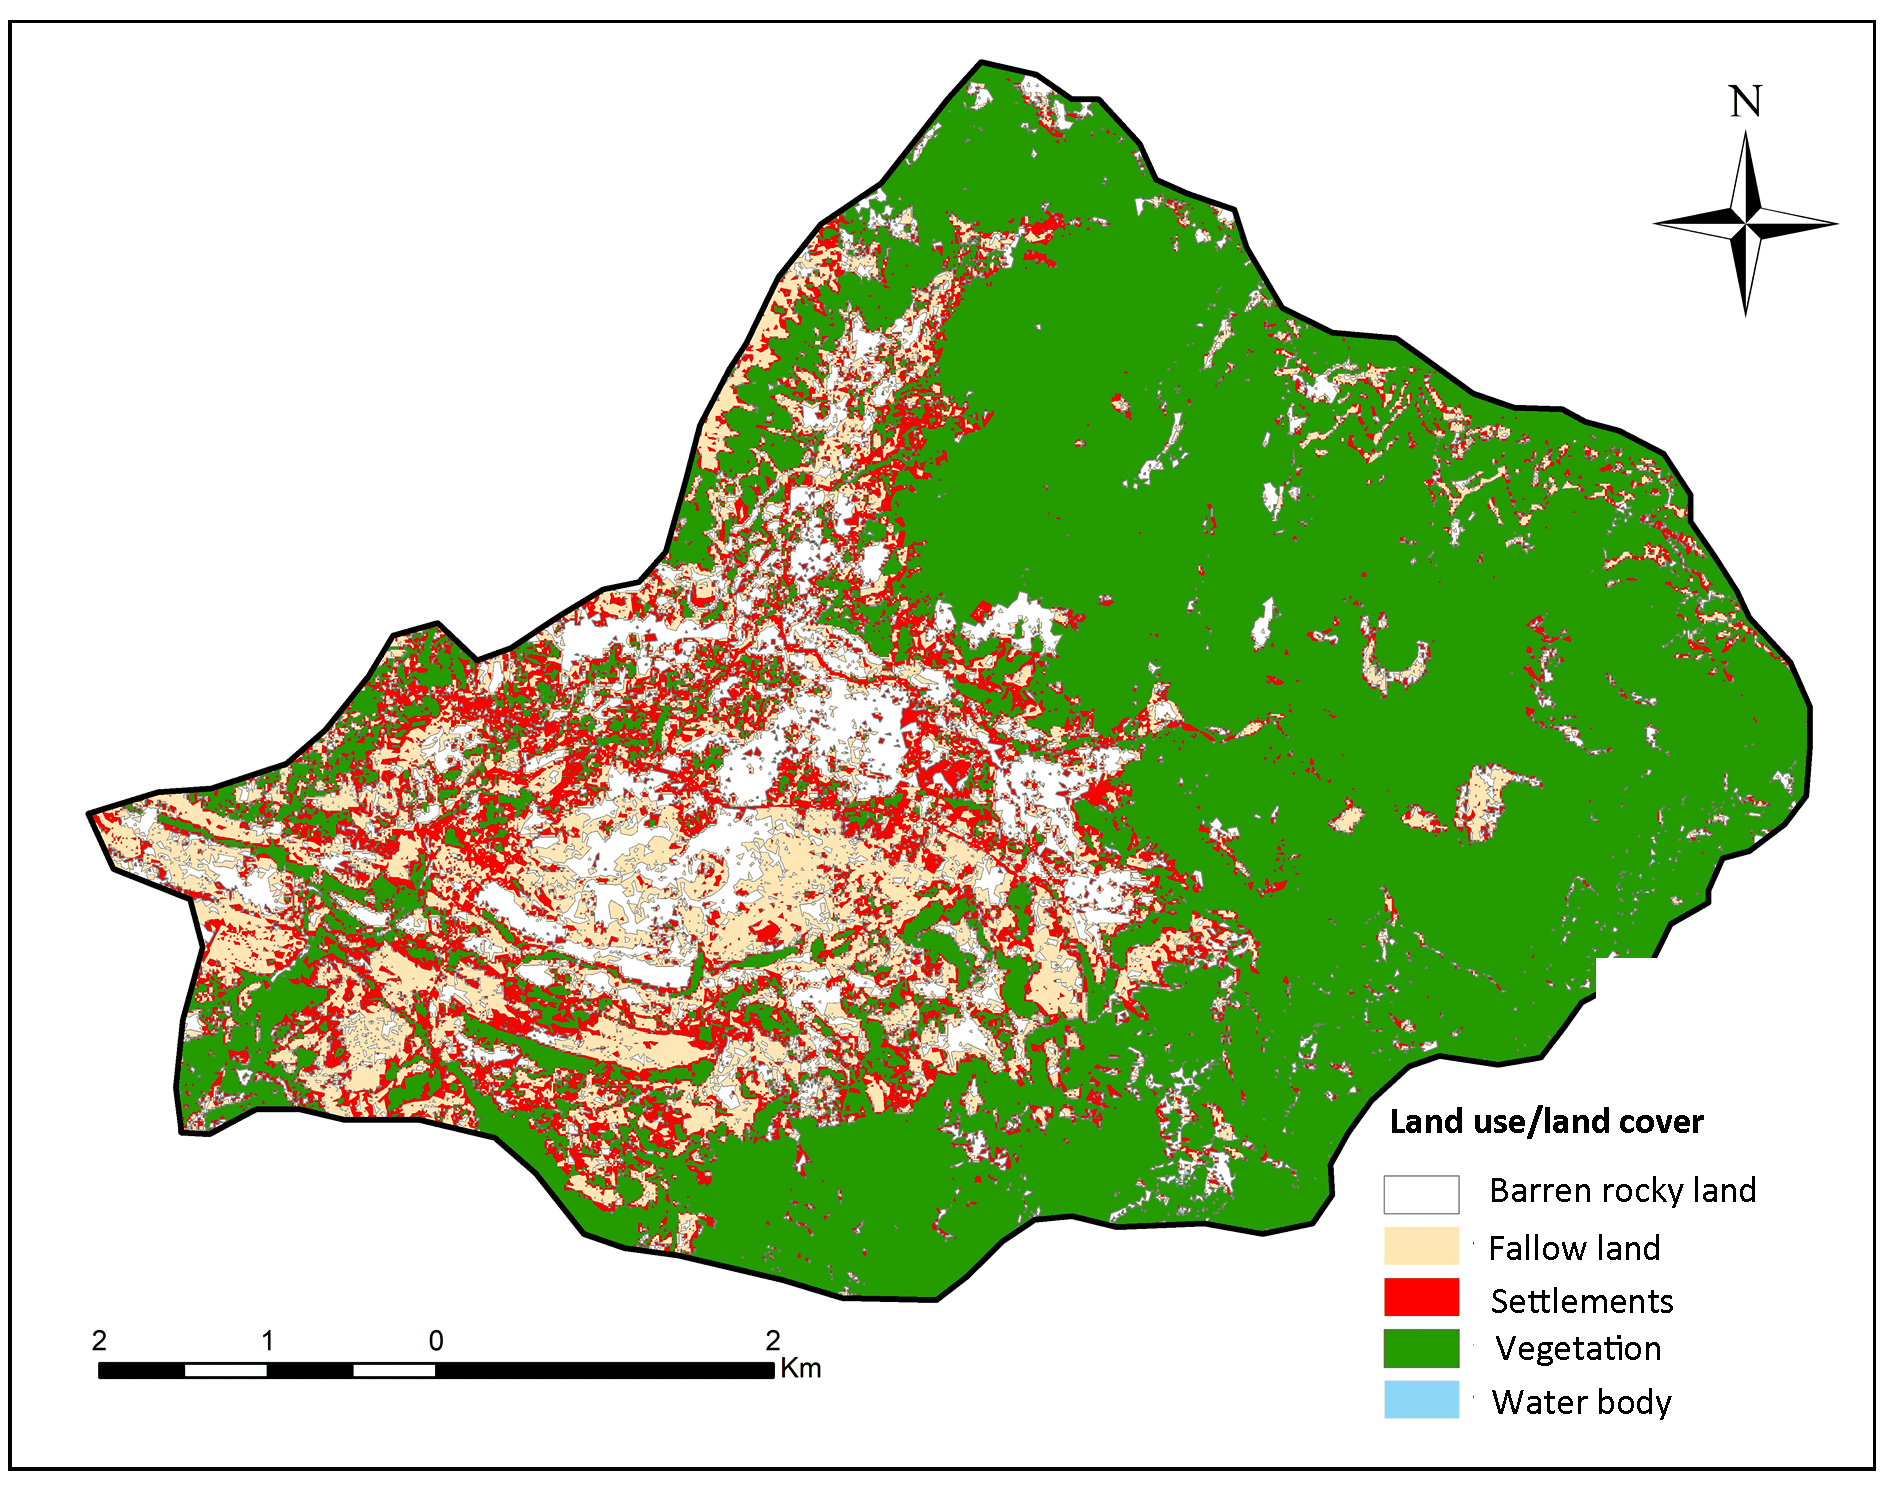
4.9 Land Use Land Cover
Land use/land cover (LULC) map (Figure 10) was prepared from Sentinel pulsar data (2010) using maximum likelihood algorithm technique in supervised classification. Five classes were distinguished: (i) water bodies, (ii) vegetation, (iii) settlement (iv) fallow land, and (v) barren rocky land. These LULC were weighted based on their water requirement. The water bodies were given the highest weight than other land use features since its incessant recharge to ground, ensued by vegetation (forest and agriculture) only, which pull maximum amounts of water from the deep root zone for sustaining, resulting the present of water below the ground surface. Vegetation was weighted higher than dense forest and agriculture was given less weightage after fallow land since crops require huge amount of water and thus it acts as a good groundwater recharge. Barren rocky land is open space without vegetation. The barren rocky land is formed due to mining activity. There are number of mines increase the groundwater storage capacity. The settlement computed the lower weightage because increasing urbanization needs to over exploitation of groundwater and affects the local hydrology.
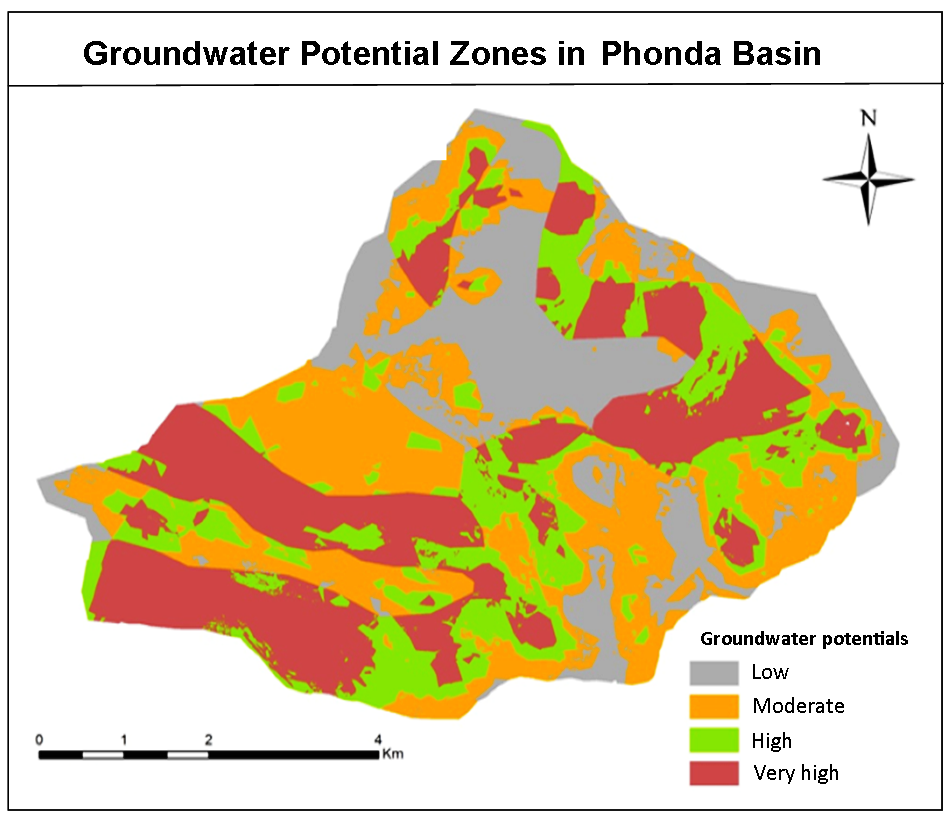
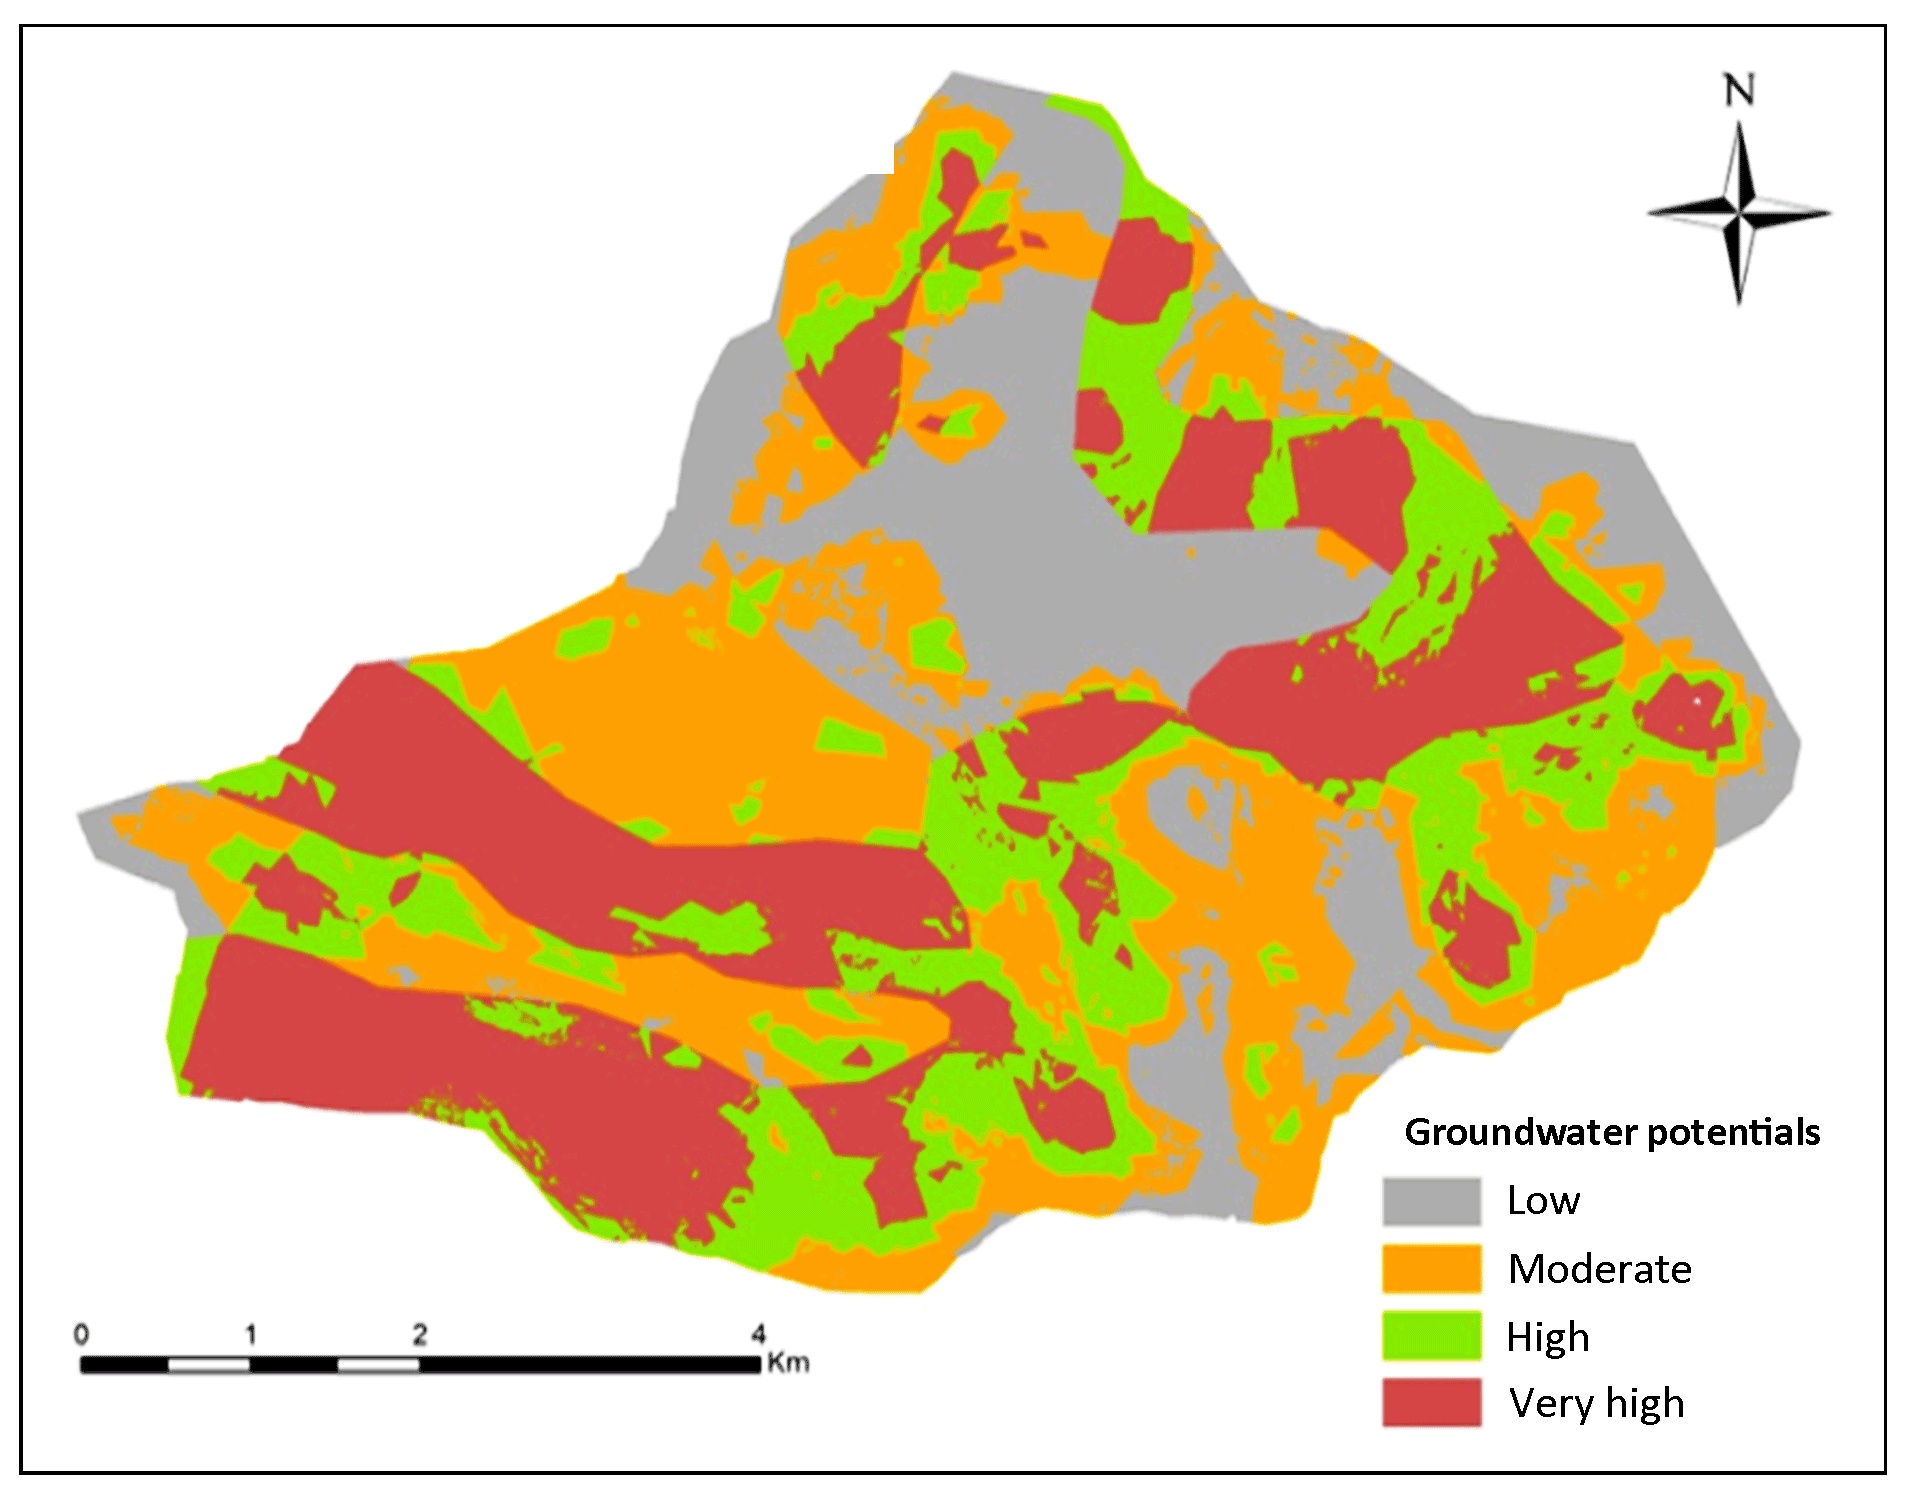
4.10 Groundwater Potential Zones
AHP method was used for delineating the groundwater potential zones (GWPZ) in study area. AHP has been calculated by integrating 9 thematic layers viz. Geology, Geomorphology, Slope, Relief, Rainfall, Lineament density, Drainage density, Elevation and Land use land cover. Pairwise comparison of all thematic layers and its classes (sub-criteria is done for calculation of consistency ratio and priority vectors (Table 1). The sum of these AHP weighted values (priority vector) is found within a range of 0.063 to 0.28. This range is grouped into four categories based on standard deviation classification of groundwater potential area: low 0.063-0.13, moderate 0.13-0.15, high 0.15-0.18 and very high 0.18-0.28 (Figure 11).
GWPZ mapping based on AHP and geospatial techniques reveals very high and high potential zones in Southwest (downstream direction) and Northeast part of study area whereas moderate potential is observed scattered. Low groundwater potential is shown in Northern and some Eastern parts (elevated region). Near about 40% land of the study area classified under moderate and very high GWPZ. Moderate potential zones are dominated by geological unit of sandstone, shale and basalt and geomorphological units are structural, denudational, water body and hilly region with structural features of high lineament density in Northeast part. Low GWPZ depicts the area with metamorphic terrain. The mining activity observed in central part with moderate potential zones. The hydro-geomorphic features in this portion are consist of hilly terrain having large patches of Radhanagari forest at higher levels and cultivated land at lower levels.


 ,
Kunal Bandivdekar 1
,
Kunal Bandivdekar 1