1 . INTRODUCTION
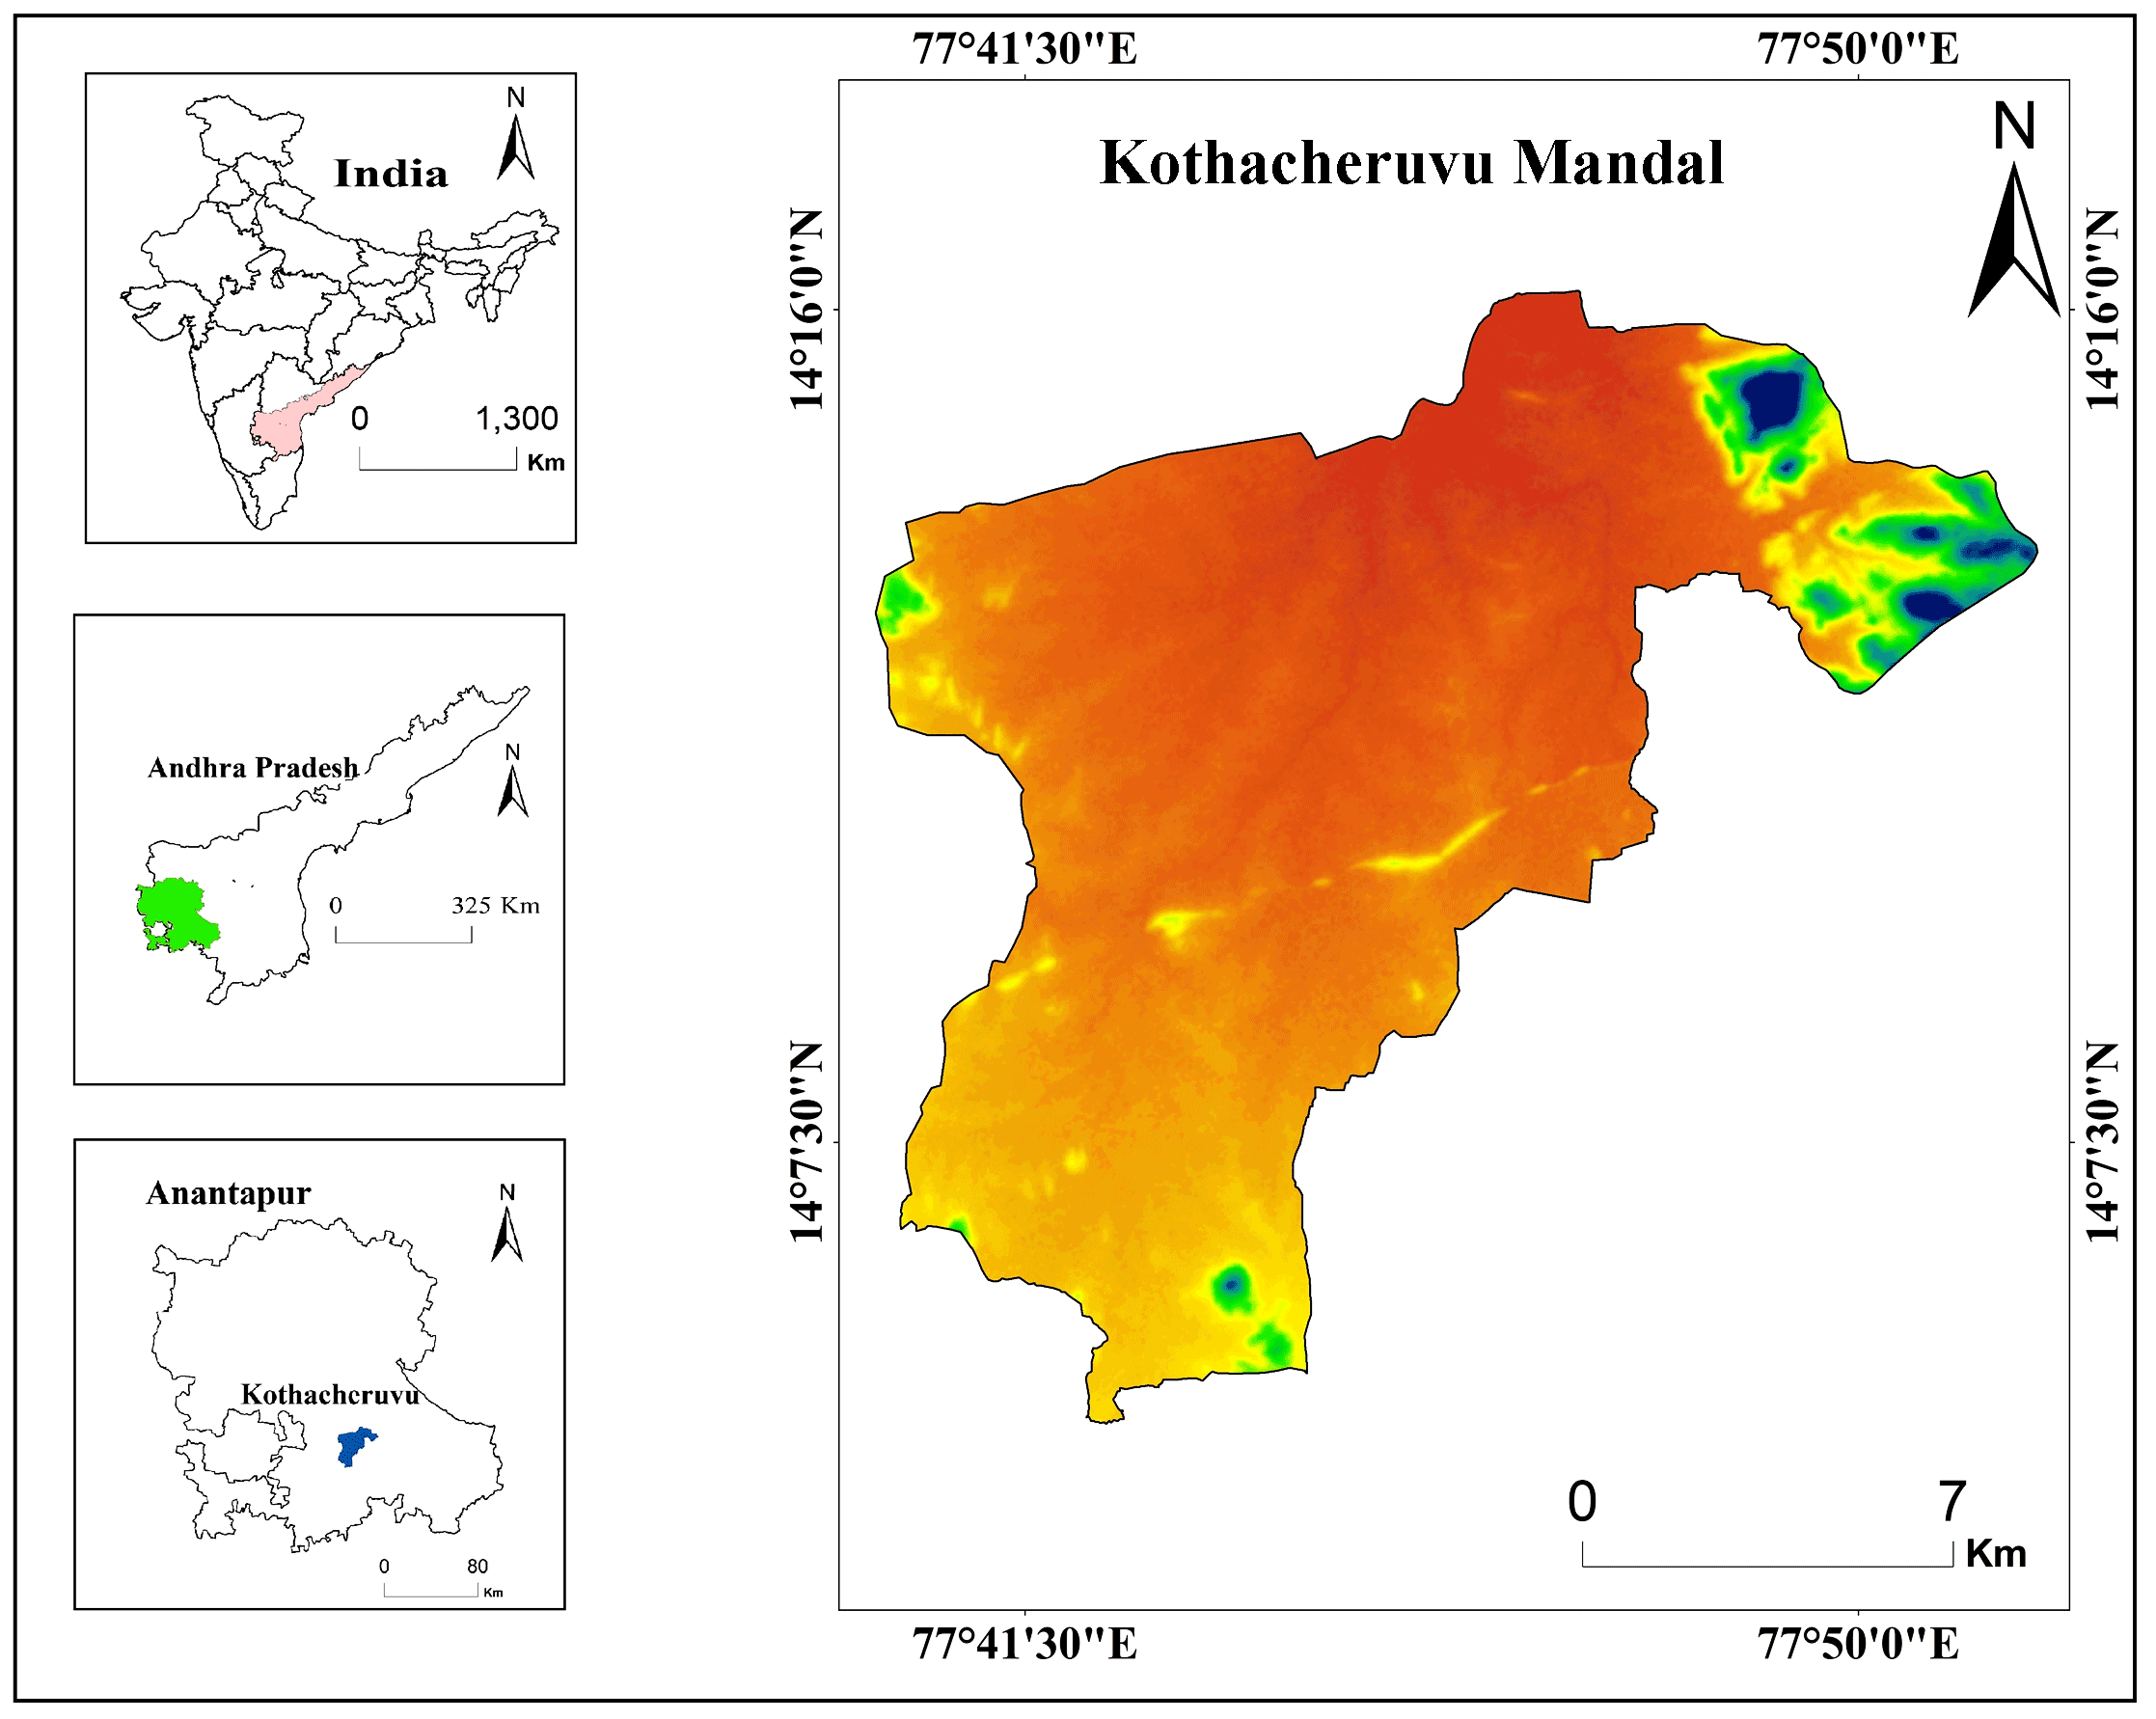
Significant contrasts in the capacity, occurrence and length of precipitation in distinct zones of India make watershed management as the defined need in the nation, which enriches the water supply and pulls back a comparable potential floods, thus gives twofold benefits. The financial improvement and the rural areas (India) is a standout amongst the most basic effects for the advancement of economy (Kumbhar et al., 2013). The water source is a released hydrological unit, from which the run-off, after the precipitation, crosses a single point in an enormous stream, river, lake or pond. Watershed is a multidisciplinary technique for conservation of regular assets (Chowdary et al., 2009). It includes an evaluation of different thematic layers about prospects, problems and the collection of educational activities in combination with financial auditory influences that can be connected to the field without endangering the environment (Kumar et al., 2008; Jahan et al., 2019). Therefore, it basically refers to the management of resources that guarantees the adequate use of land, shelter of the land against erosion, improvement and conservation of soil fertility, protection of water, protection against floods, reduction of sediments and improvement of productivity (Kadam et al., 2012). Several strategies have been used to procure immediate or conventional data on soil-water conservation (SWC) and their possible existence, internally that hydrogeological and geospatial research is used regularly and appears to be common (Nsiah et al., 2008; Kadam et al., 2017). The geo-hydrological studies include some spatial layers of geology, geomorphology, drainage density, rainfall and run-off affecting the structures of the SWC. To investigate the suitability of SWC sites, Kothacheruvu Mandal has been selected as characteristic of semi-arid areas in Southern India with moderate rainfall. Accessible groundwater in the regfion probably misused especially during domestic, irrigation and industrial purposes (Rajasekhar et al., 2018a, 2018b). This allows for the potential degradation of soils in reasonable areas and demanding soil and water conservation. With this expectation, Kothacheruvu mandal is chosen with the objectives to (1) comprehend the groundwater revive capability of a region, (2) distinguish potential SWC sites for water conservation and decrease of soil degradation, and (3) determine AGRZs with accuracy assessments. The methodology outlined and techniques used in the study will be useful for groundwater enrichment in the semi-arid and arid regions in India.
3 . MATERIALS AND METHODS
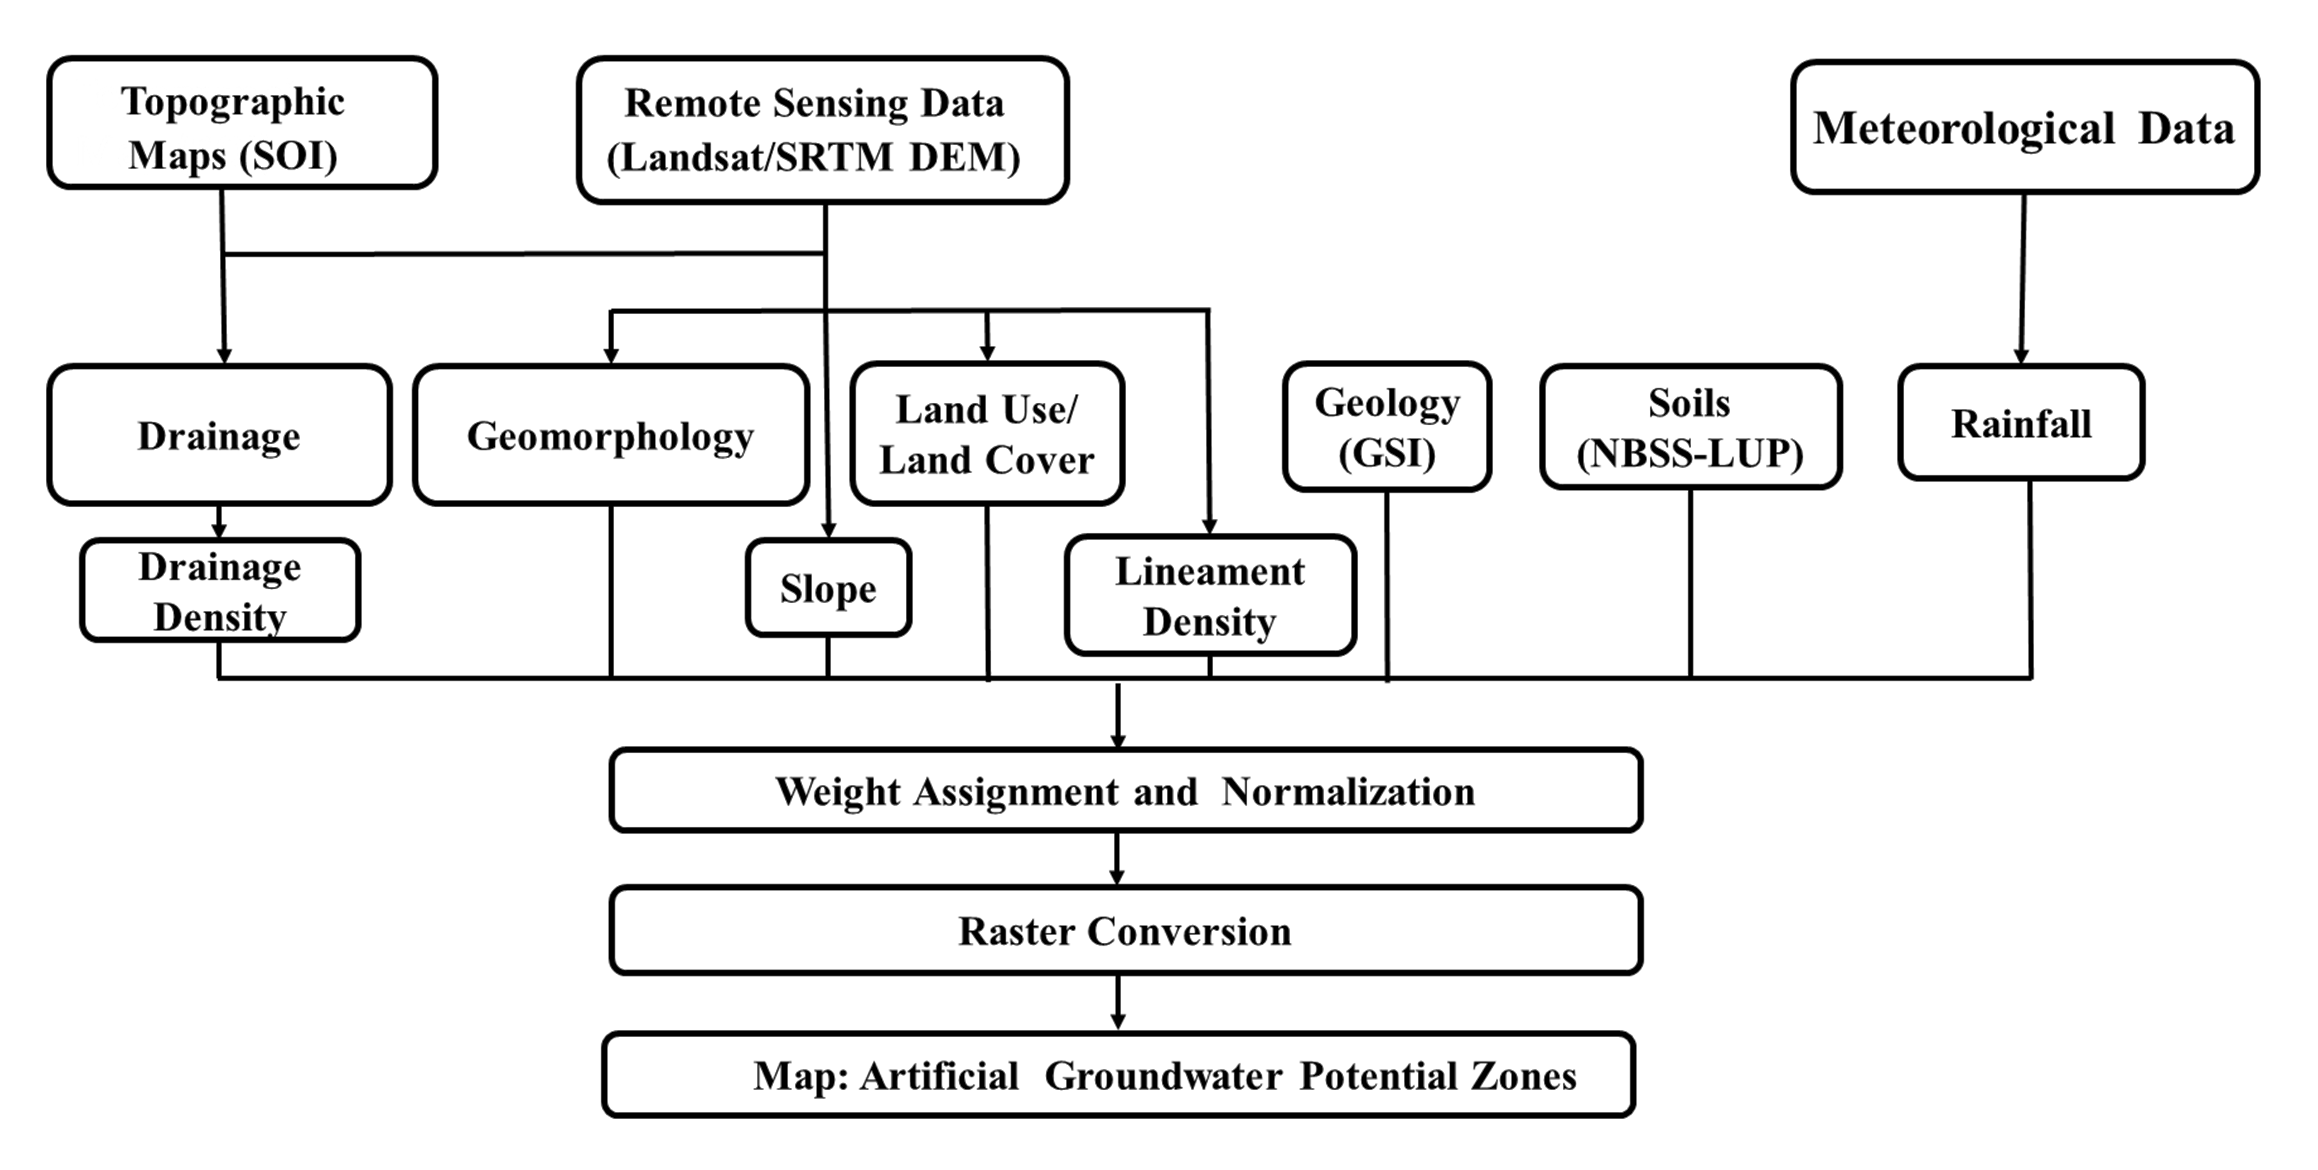
The thematic maps such as geology, geomorphology, drainage density (DD), land use / land cover (LULC), lineament density (LD), slope, soils, and rainfall were prepared using ArcGIS environment. LULC layer was prepared using Landsat-8 satellite dataset using supervised classification in ERDAS Imagine software (Kumar et al., 2014). The drainage map was prepared using topographical maps from Survey of India (SOI) and soil map using district soil resource map by Groundwater Department, Anantapur. The slope map was derived from the CARTOSAT DEM data from NRSC Bhuvan website. The rainfall data obtained from Groundwater Department, Anantapur for the period from 1998 to 2018. The various layers such as geology, geomorphology and lineaments were digitized from satellite imageries in ArcGIS environment (Chowdhury et al., 2010; Ghayoumian et al., 2007). An aggregate of eight thematic layers such as geology, geomorphology, slope, DD, LD, soil, rainfall and LULC with their inter-relationship, which is inferred to incite AGRZ methodology (Figure 2) for Anantapur District.
3.1 Criterion
A detailed procedure for groundwater resource evaluation of particular area needs the exhaustive investigation of various thematic layers like geology, geomorphology, LULC, LD, DD, soils, slope and rainfall so as to identify AGRZs in the present study, typical thematic maps were prepared from RS data, SOI maps and land maps associated to the collateral maps and field outline. The specifics of the thematic layers prepared from RS information and field overview, composed with the groundwater potential outcomes (Mundalik et al., 2018; Rahman et al., 2012; Rahmati et al., 2015). The AHP weights are increased by the percentage of total weight to obtain the final weight. The average weight given to the rainfall varies from 293.89 to 945.29mm for very low to very high potential of recharge, respectively (Table 1) (Kadam et al., 2017).
3.1.1 Geology
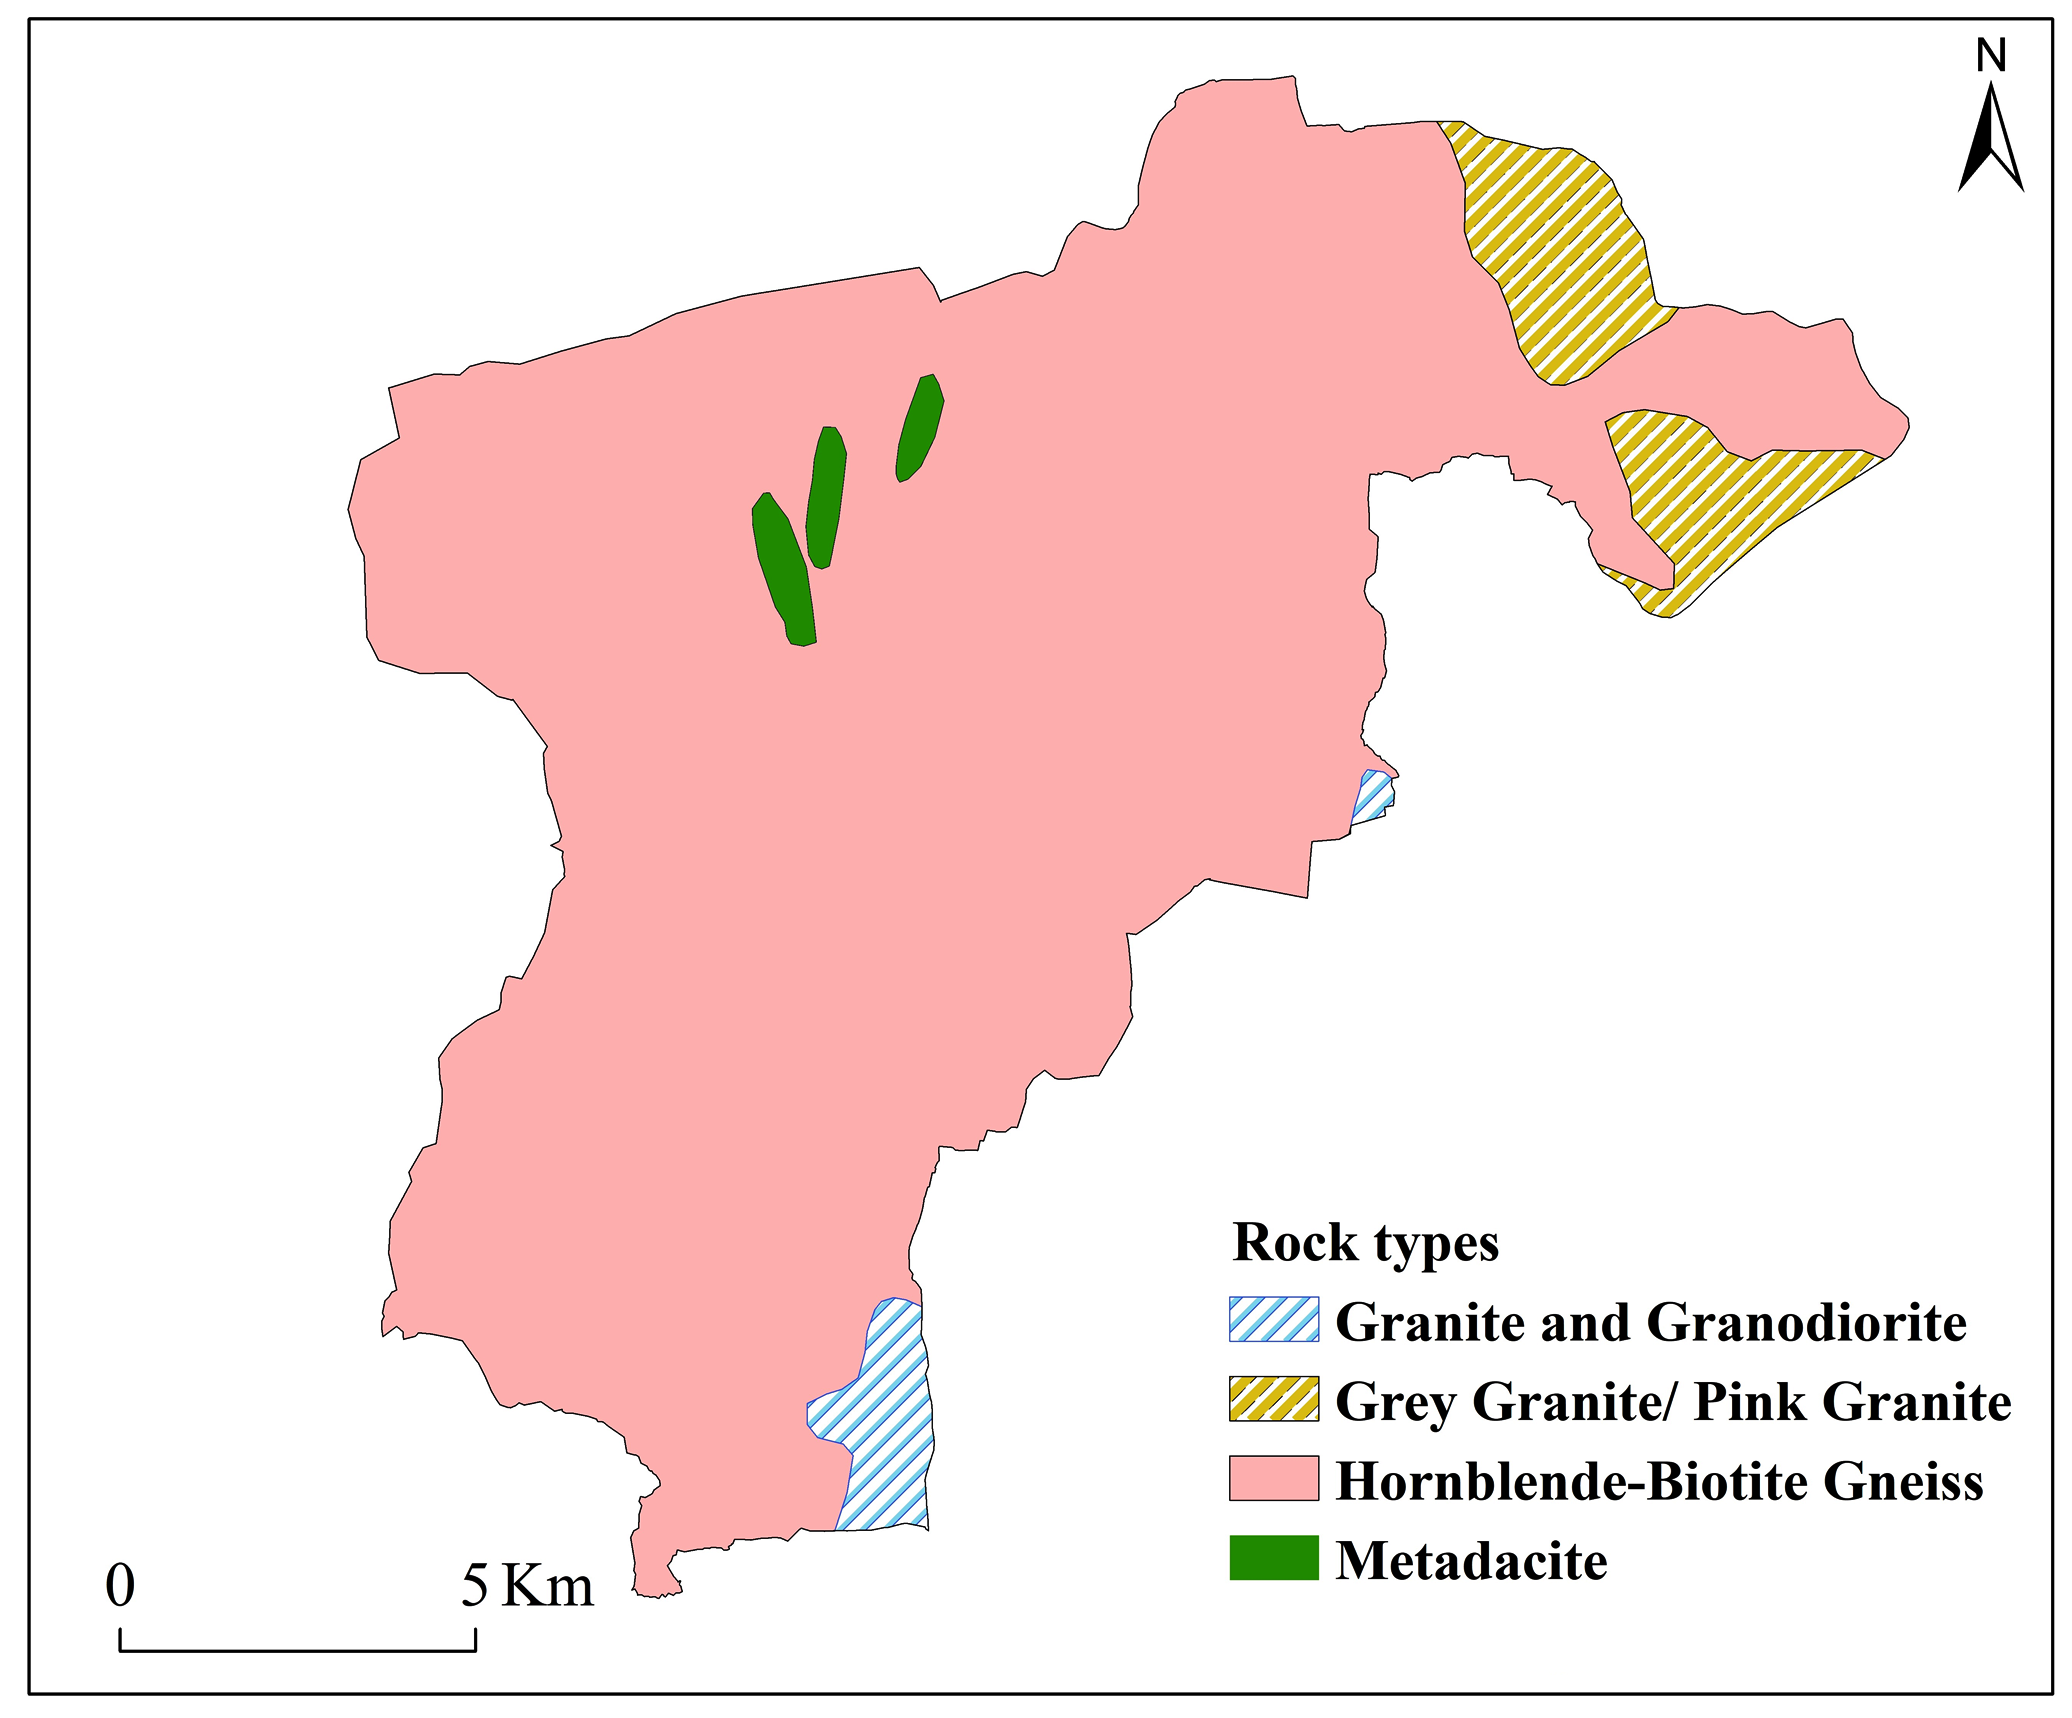
Geological formation of this region incorporates hornblende-biotite-gneiss, granites, and metadacite. The study area is commonly composed by gneiss and weathered crystalline granites in Northern and small patches in Southern part of the region. The metadacite formations show a low degree of infiltration, while the hornblende-biotite-gneiss deposits show a higher degree of infiltration due to their permeable nature (GSI 2002). The gneissic formations show ‘high fractured zones and lineaments’ and good potentials for groundwater recharge (Figure 3).
3.1.2 Geomorphology
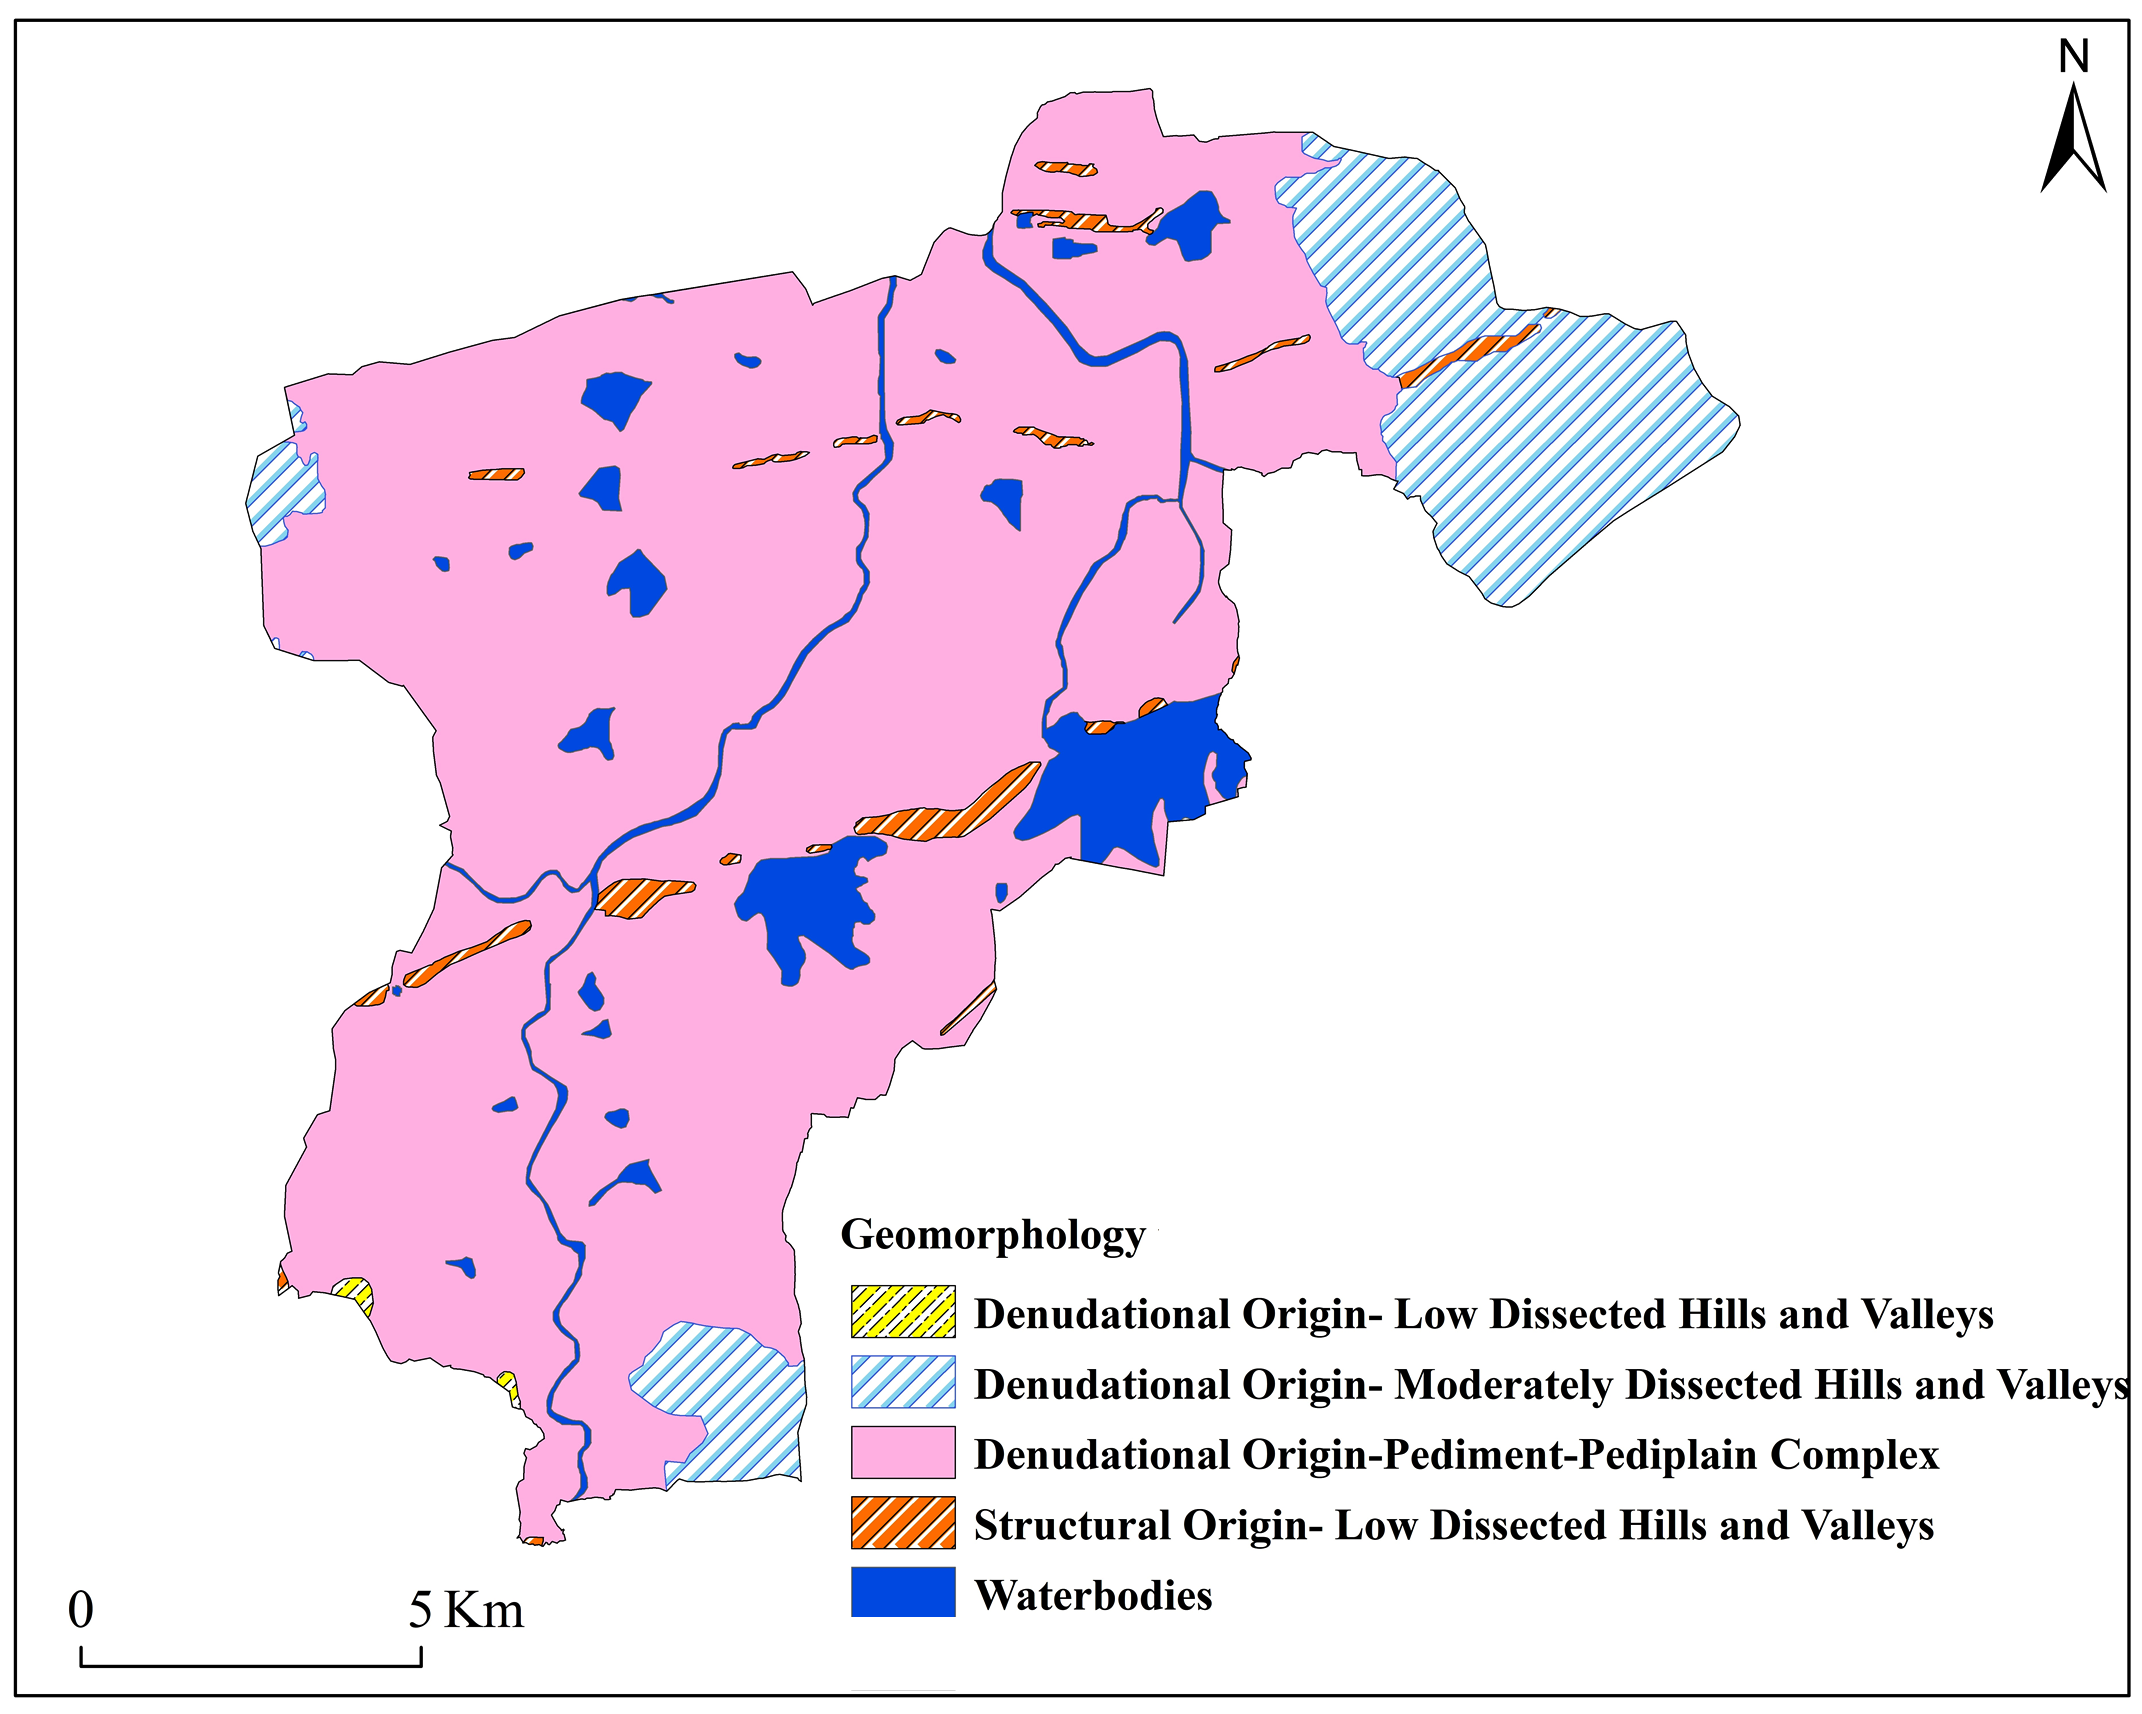
Geomorphology is a study of land forms, which includes its description, types and physical processes that have helpful to assess possible areas of groundwater. The main geomorphological units (Figure 4) are classified into five types: structural low-dissected hills and valleys, denudational origin having low and moderate dissected hills and valleys, pediment pediplain complex and water bodies. Depending on total groundwater level, about 70% of the area has a moderate GWPZ (Rajasekhar et al., 2018c). They are described by very permeable and porous material and have a good GWPZ. The pediplain areas spread a larger part of the present study and the groundwater hold in these areas is exceptionally restricted because of less recharge. The pediment-pediplain complex include the run-off zone and are available in the maximum of the present study and are reasonable for groundwater conservation.
3.1.3 Lineament Density (LD)
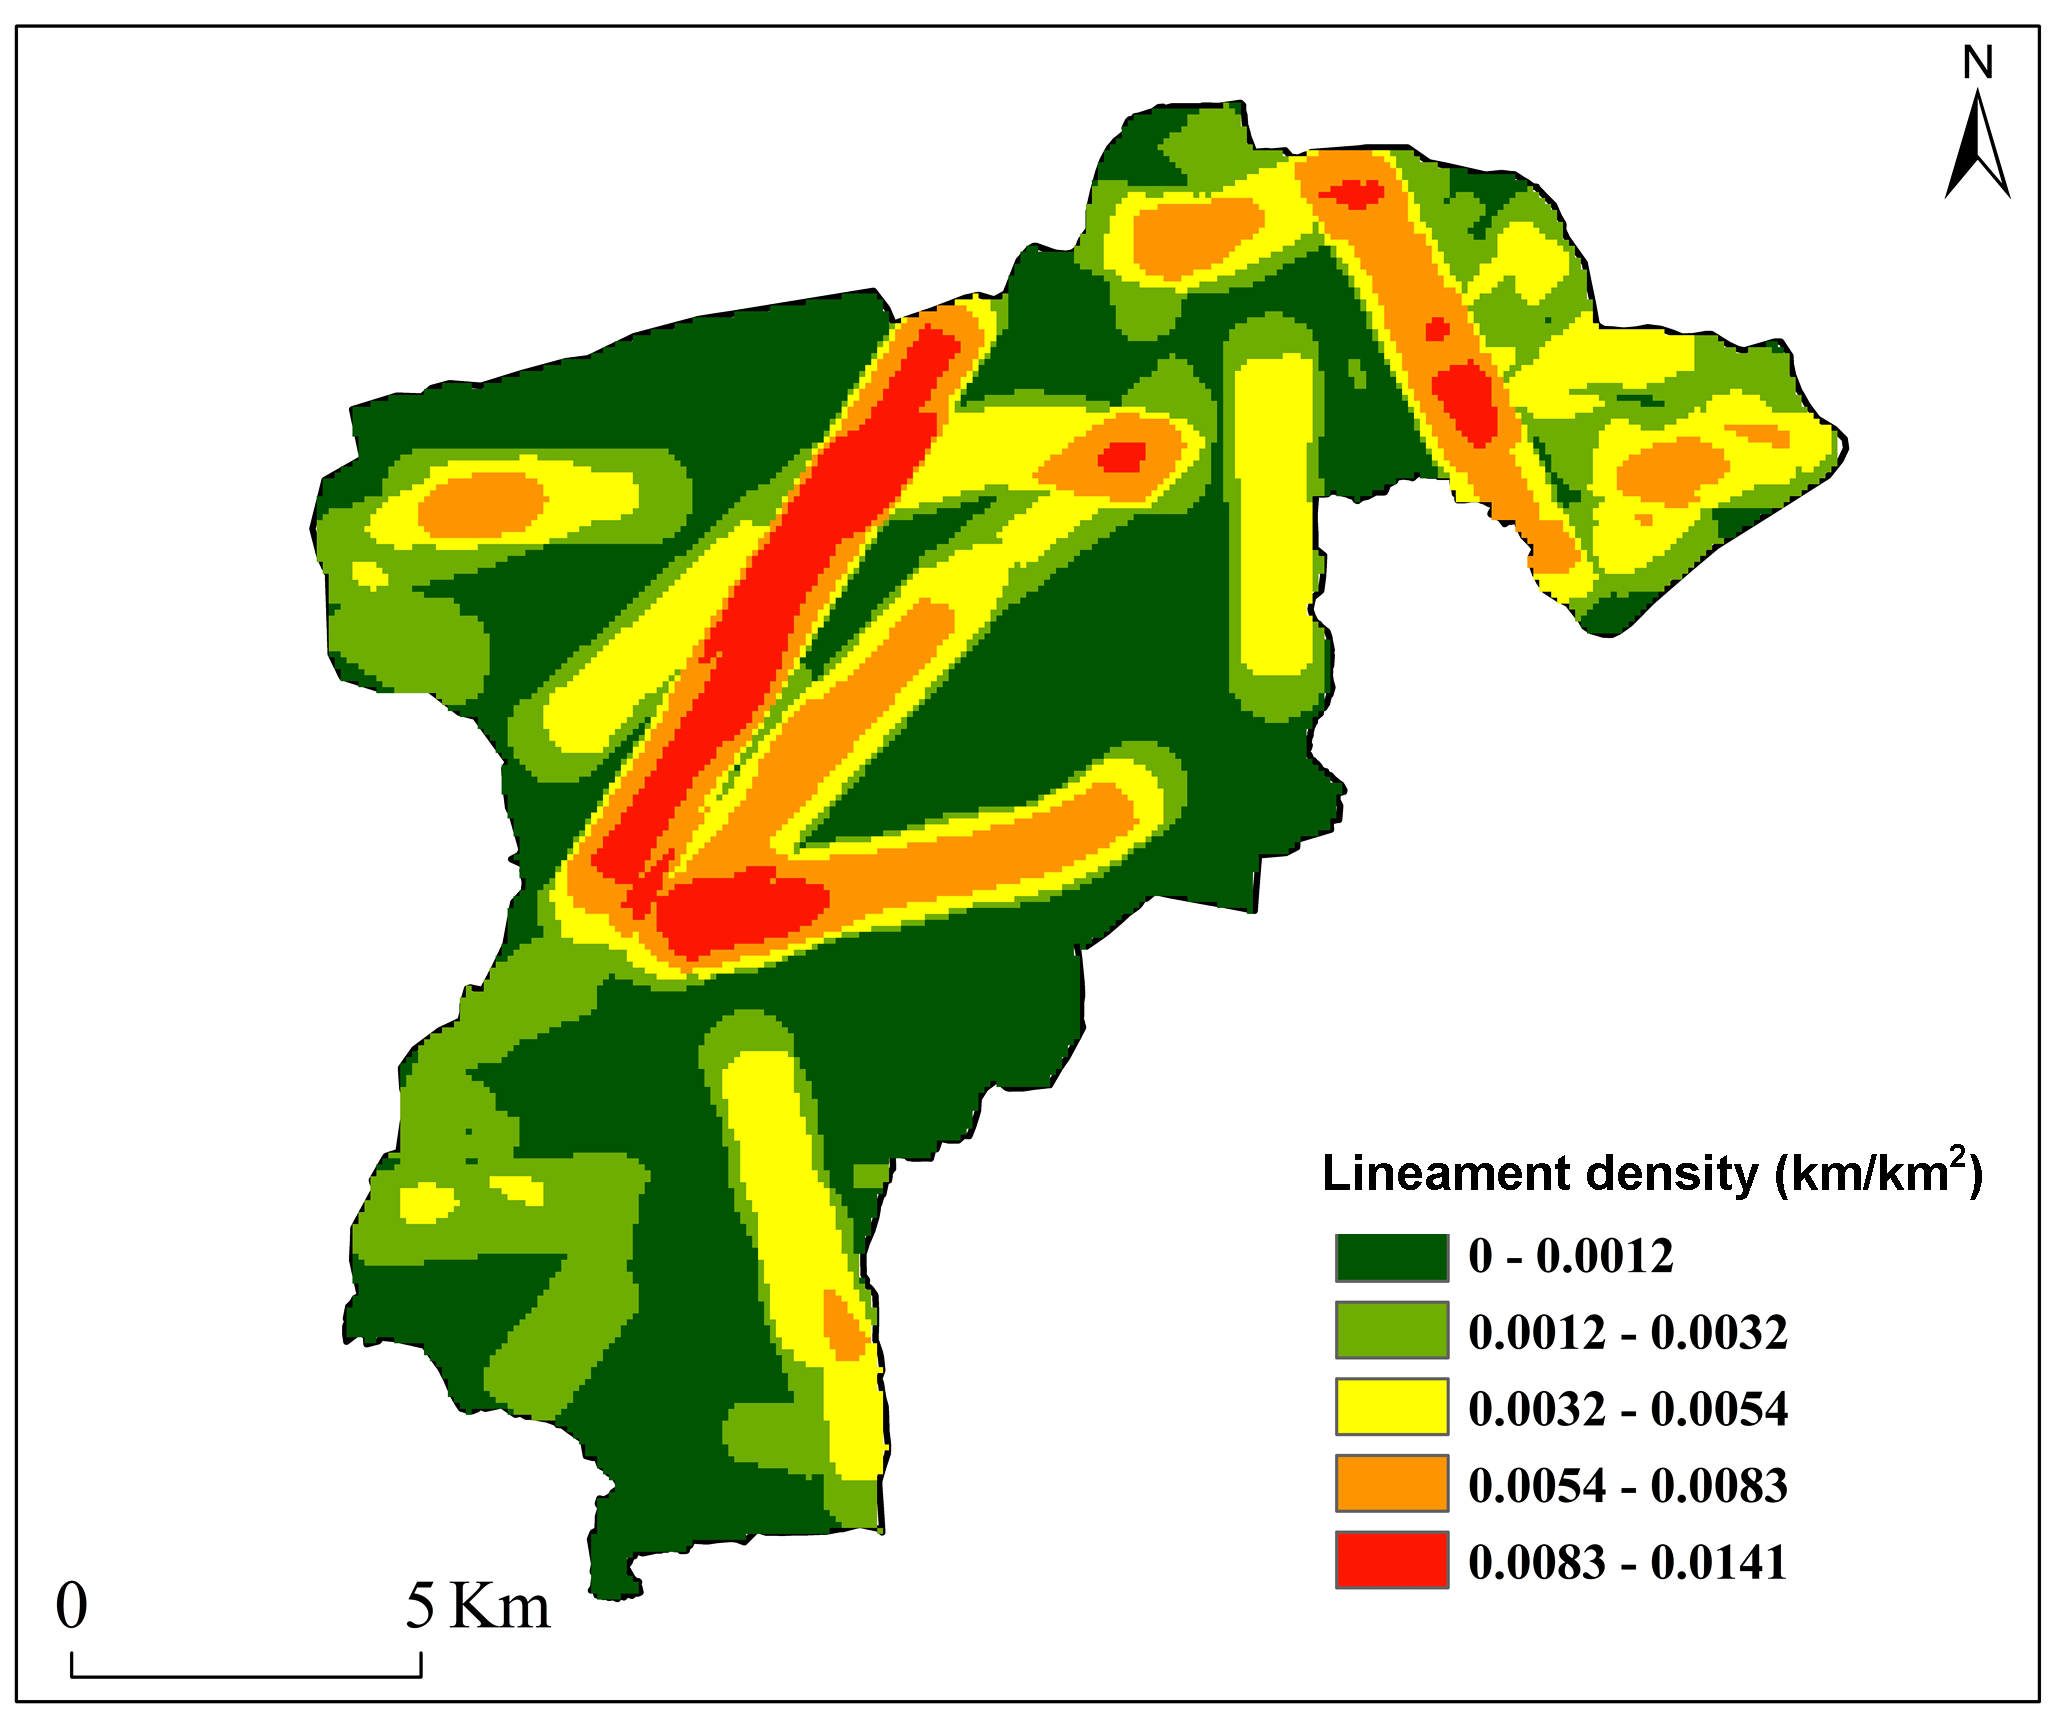
LD can be calculated as the total ‘length of lineaments per unit degree’. It manages many esteemed land actualities about the structural distortion, fracturing, shearing and groundwater conceivable outcomes. The control of LD is a noteworthy and helpful strategy to catch many connected geological aspects and reasonable datasets and cautious perception offer more accuracy if there should be an occurrence of lineament convergence of a zone (Rajasekhar et al., 2018b). LD in the area indirectly finds the groundwater capacity of the region, and then proximity of lineaments generally means a GWPZs. LD in the study area varies from 0 to 0.0141 km/km2 (Figure 5). The higher LD values show good potential of groundwater recharge and effective sites can be selected for construction of groundwater structures from the region.
3.1.4 Drainage Density (DD)
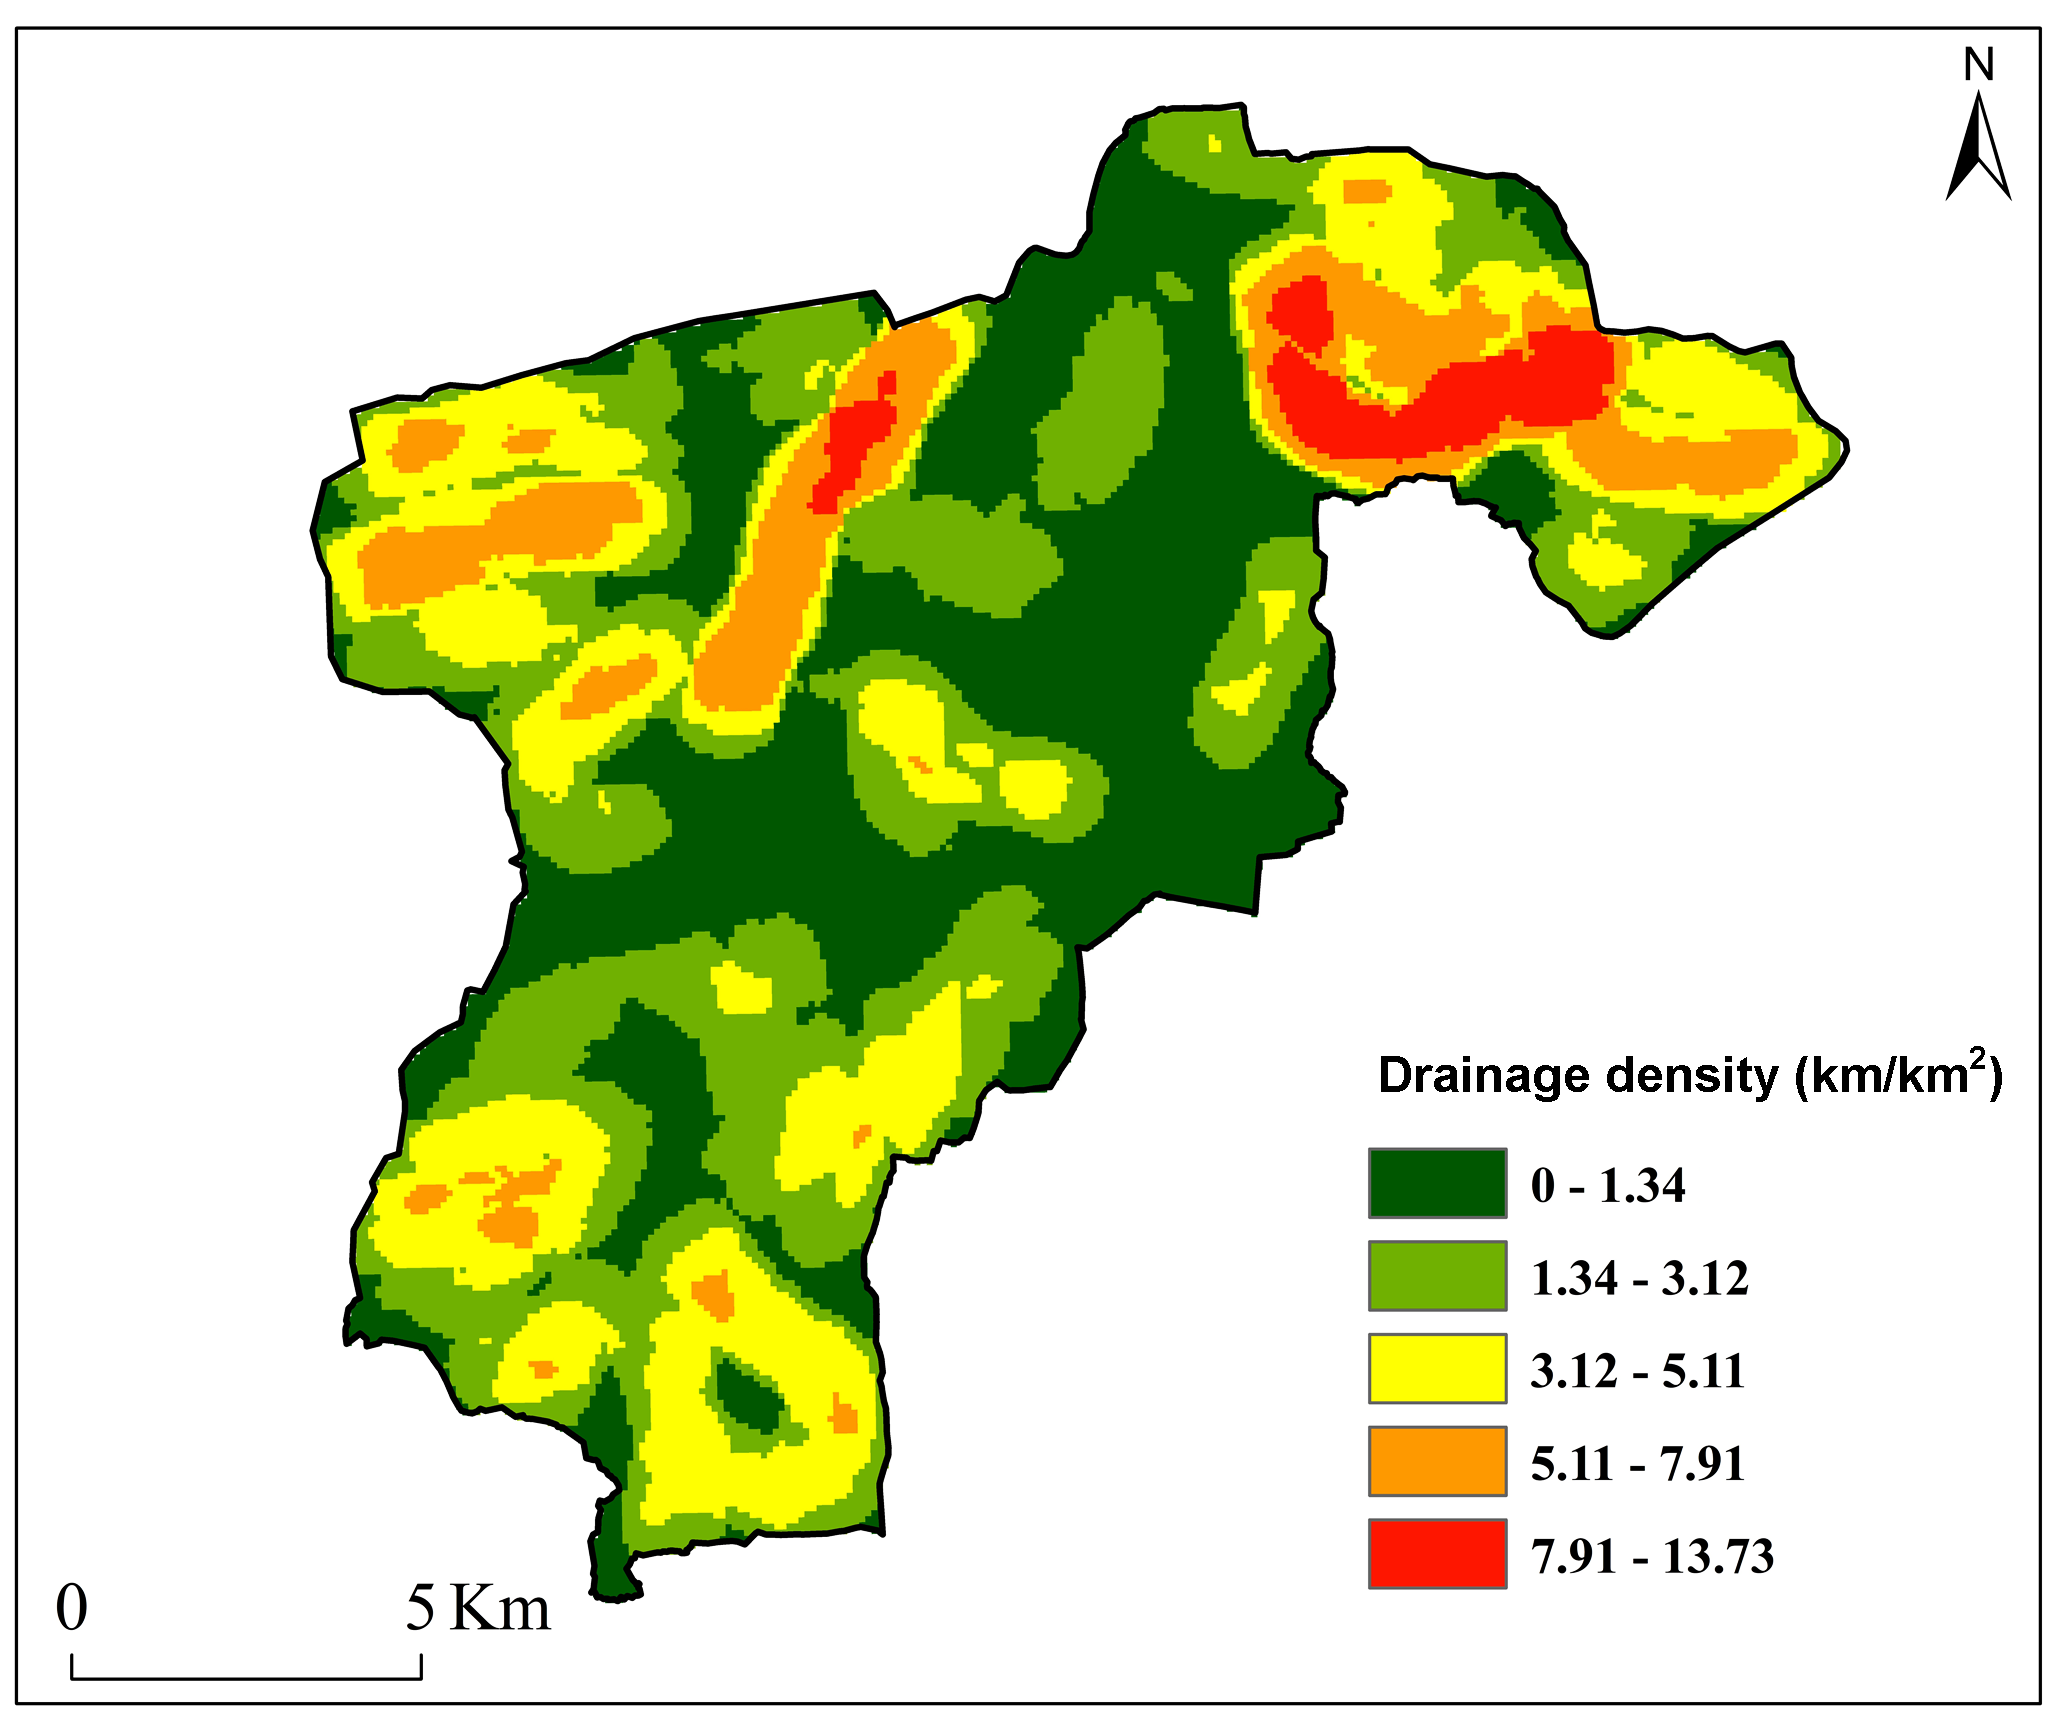
DD is a converse capacity of porousness and thus, it is a significant parameter in assessing the GWPZs. DD is defined as closeness of spacing of stream channels per unit area. The drainage density of the area has a direct relation with topography, geomorphology, subsurface geology and LULC. DD values are classified into five categories (Horton, 1932; 1945) as: low (0-1.34 km/km2), moderate (1.34-3.12km/km2), moderately high (3.12-5.11 km/km2), high (5.11-7.91 km/km2) and very high (7.91-13.73km/km2), respectively (Figure 6). These classes show relationship with surface runoff and rock permeability and helpful for delineation of groundwater potential zones in the region.
3.1.5 Slope
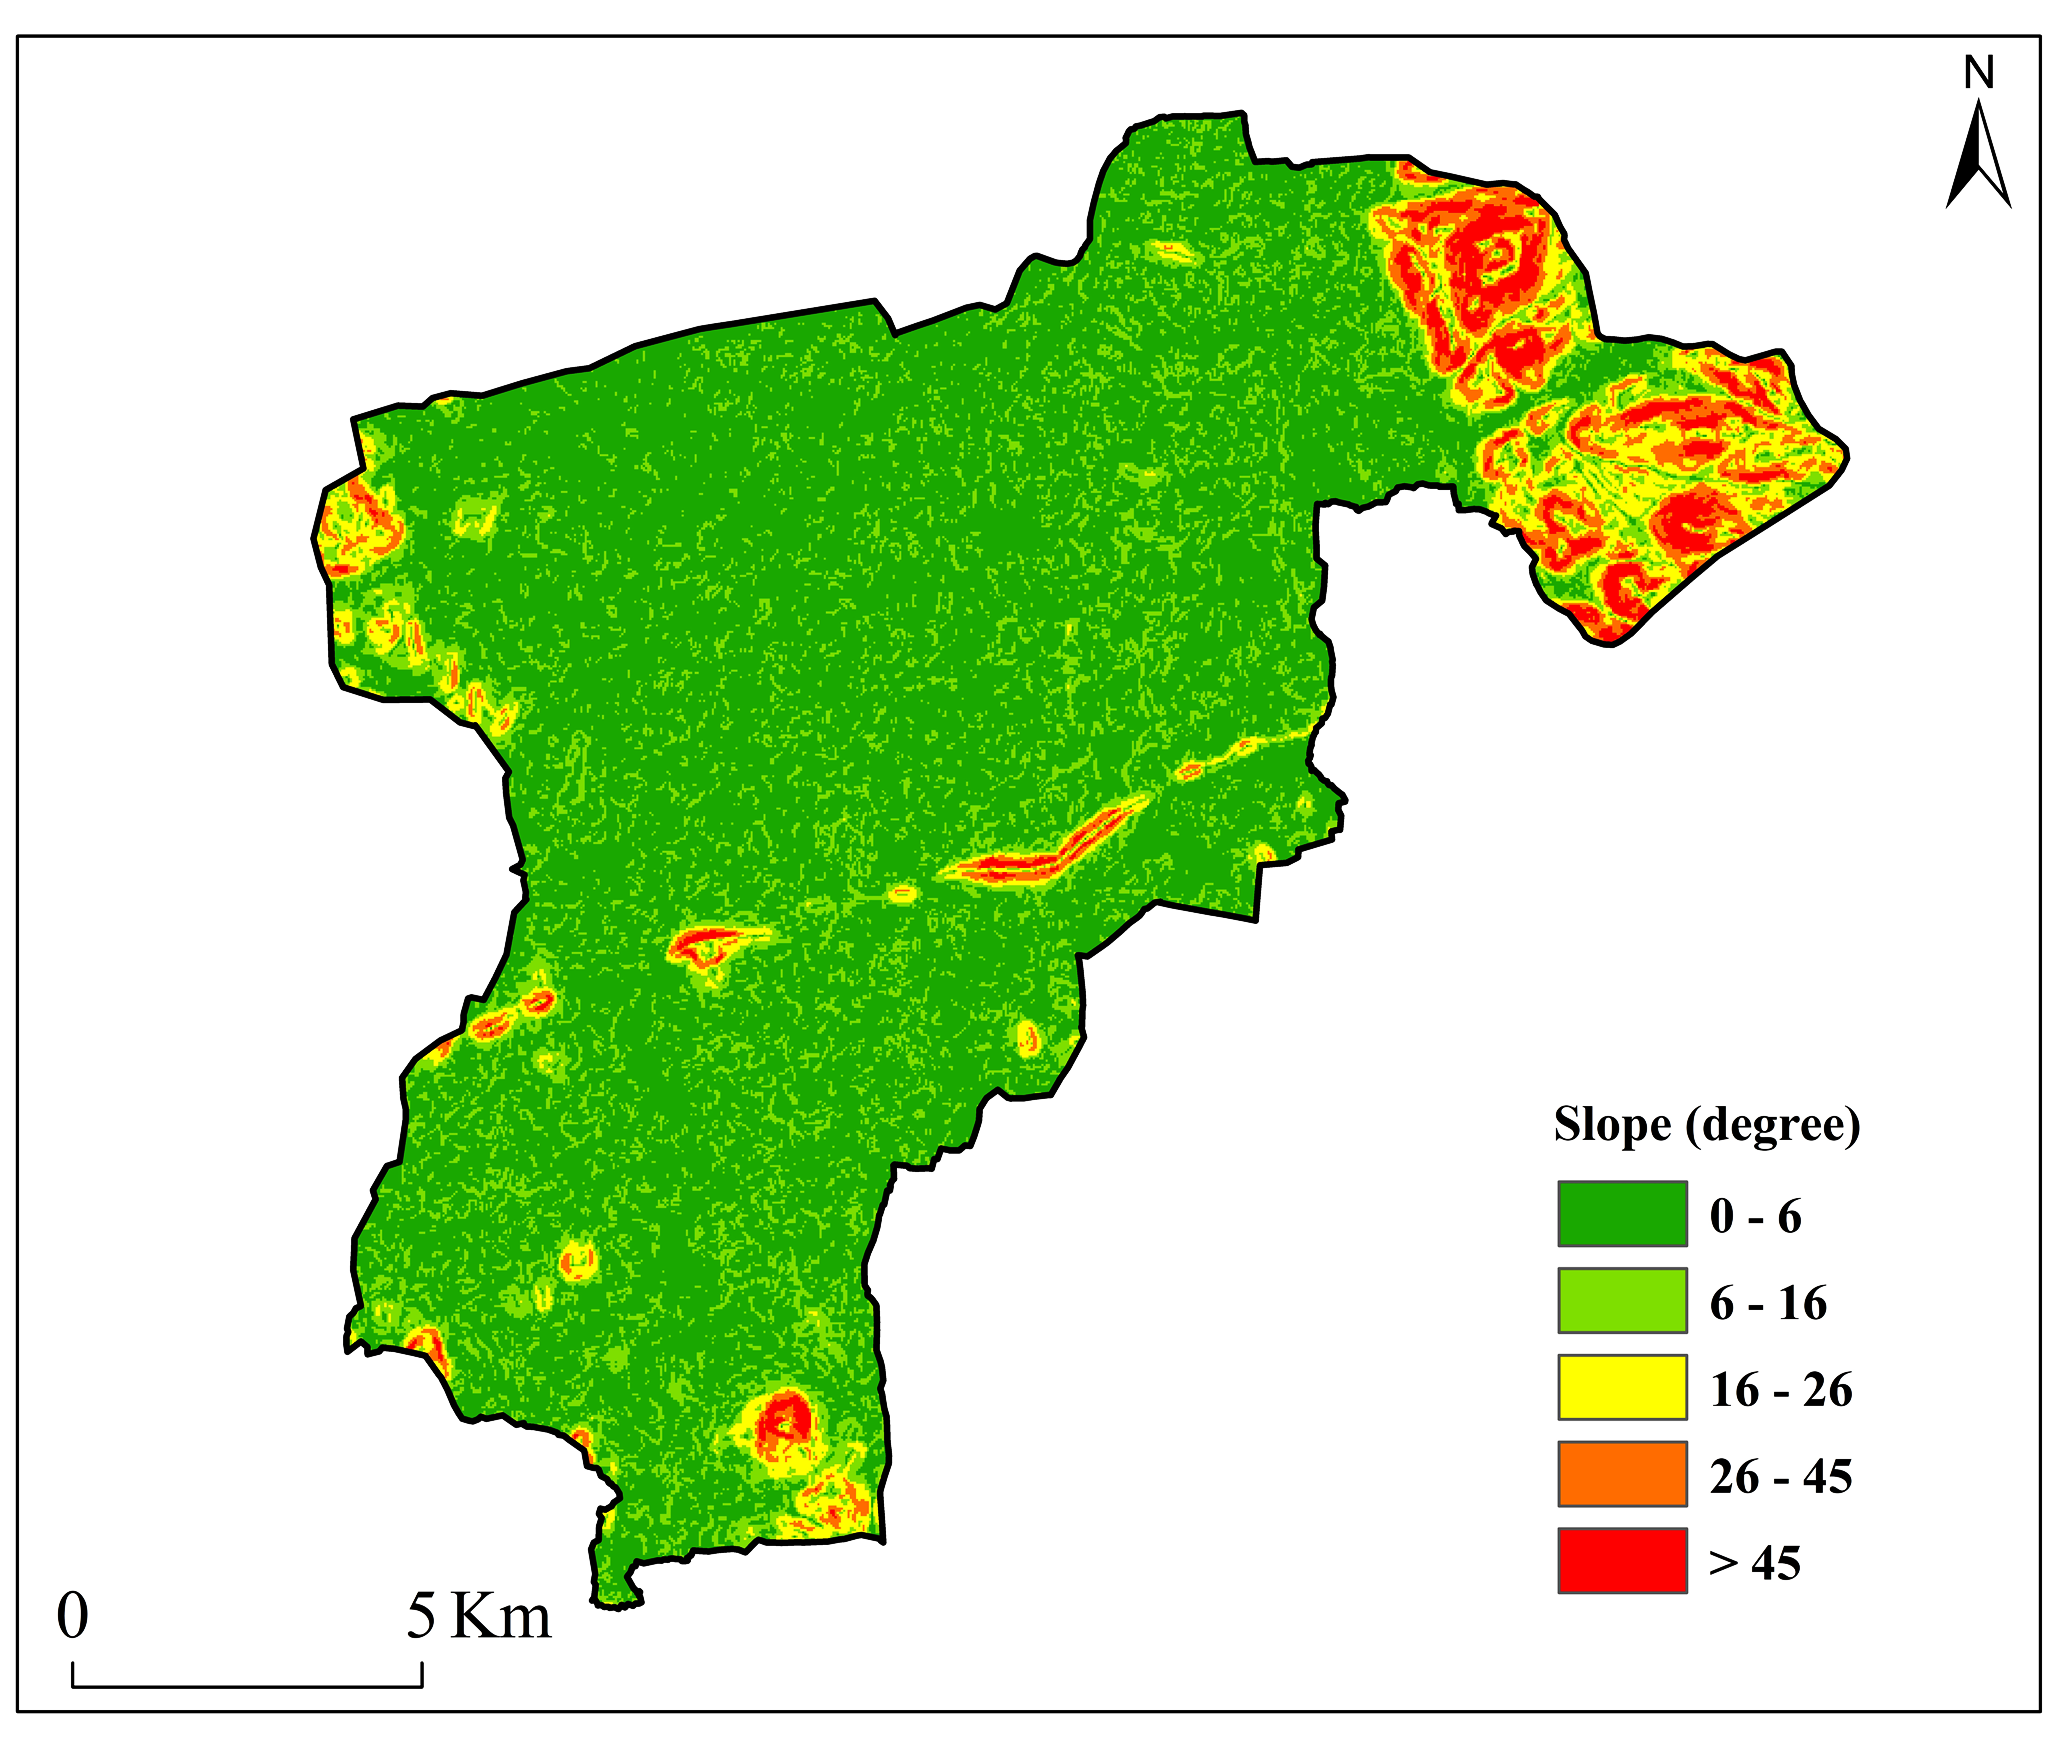
The slope factor implies a significant character in determining the rate of water flow. It controls the infiltration water into subsurface layers. Therefore, slope is an indicator of groundwater reasonableness. The surface run-off is moderate enabling good opportunity for water to infiltrate into subsurface in gentle slopping area while high slopping zone enable high surface run-off permitting less infiltration. Slope map of the region (Figure 7) is extracted from the CARTOSAT DEM image in ArcGIS environment and classified into five categories: 0º-6º, 6º-16º, 16º-26º, 26º-45º and > 45º. The study shows that the region with low to moderate surface run-off and infiltration is suitable for SWC structures (Kadam et al., 2018).
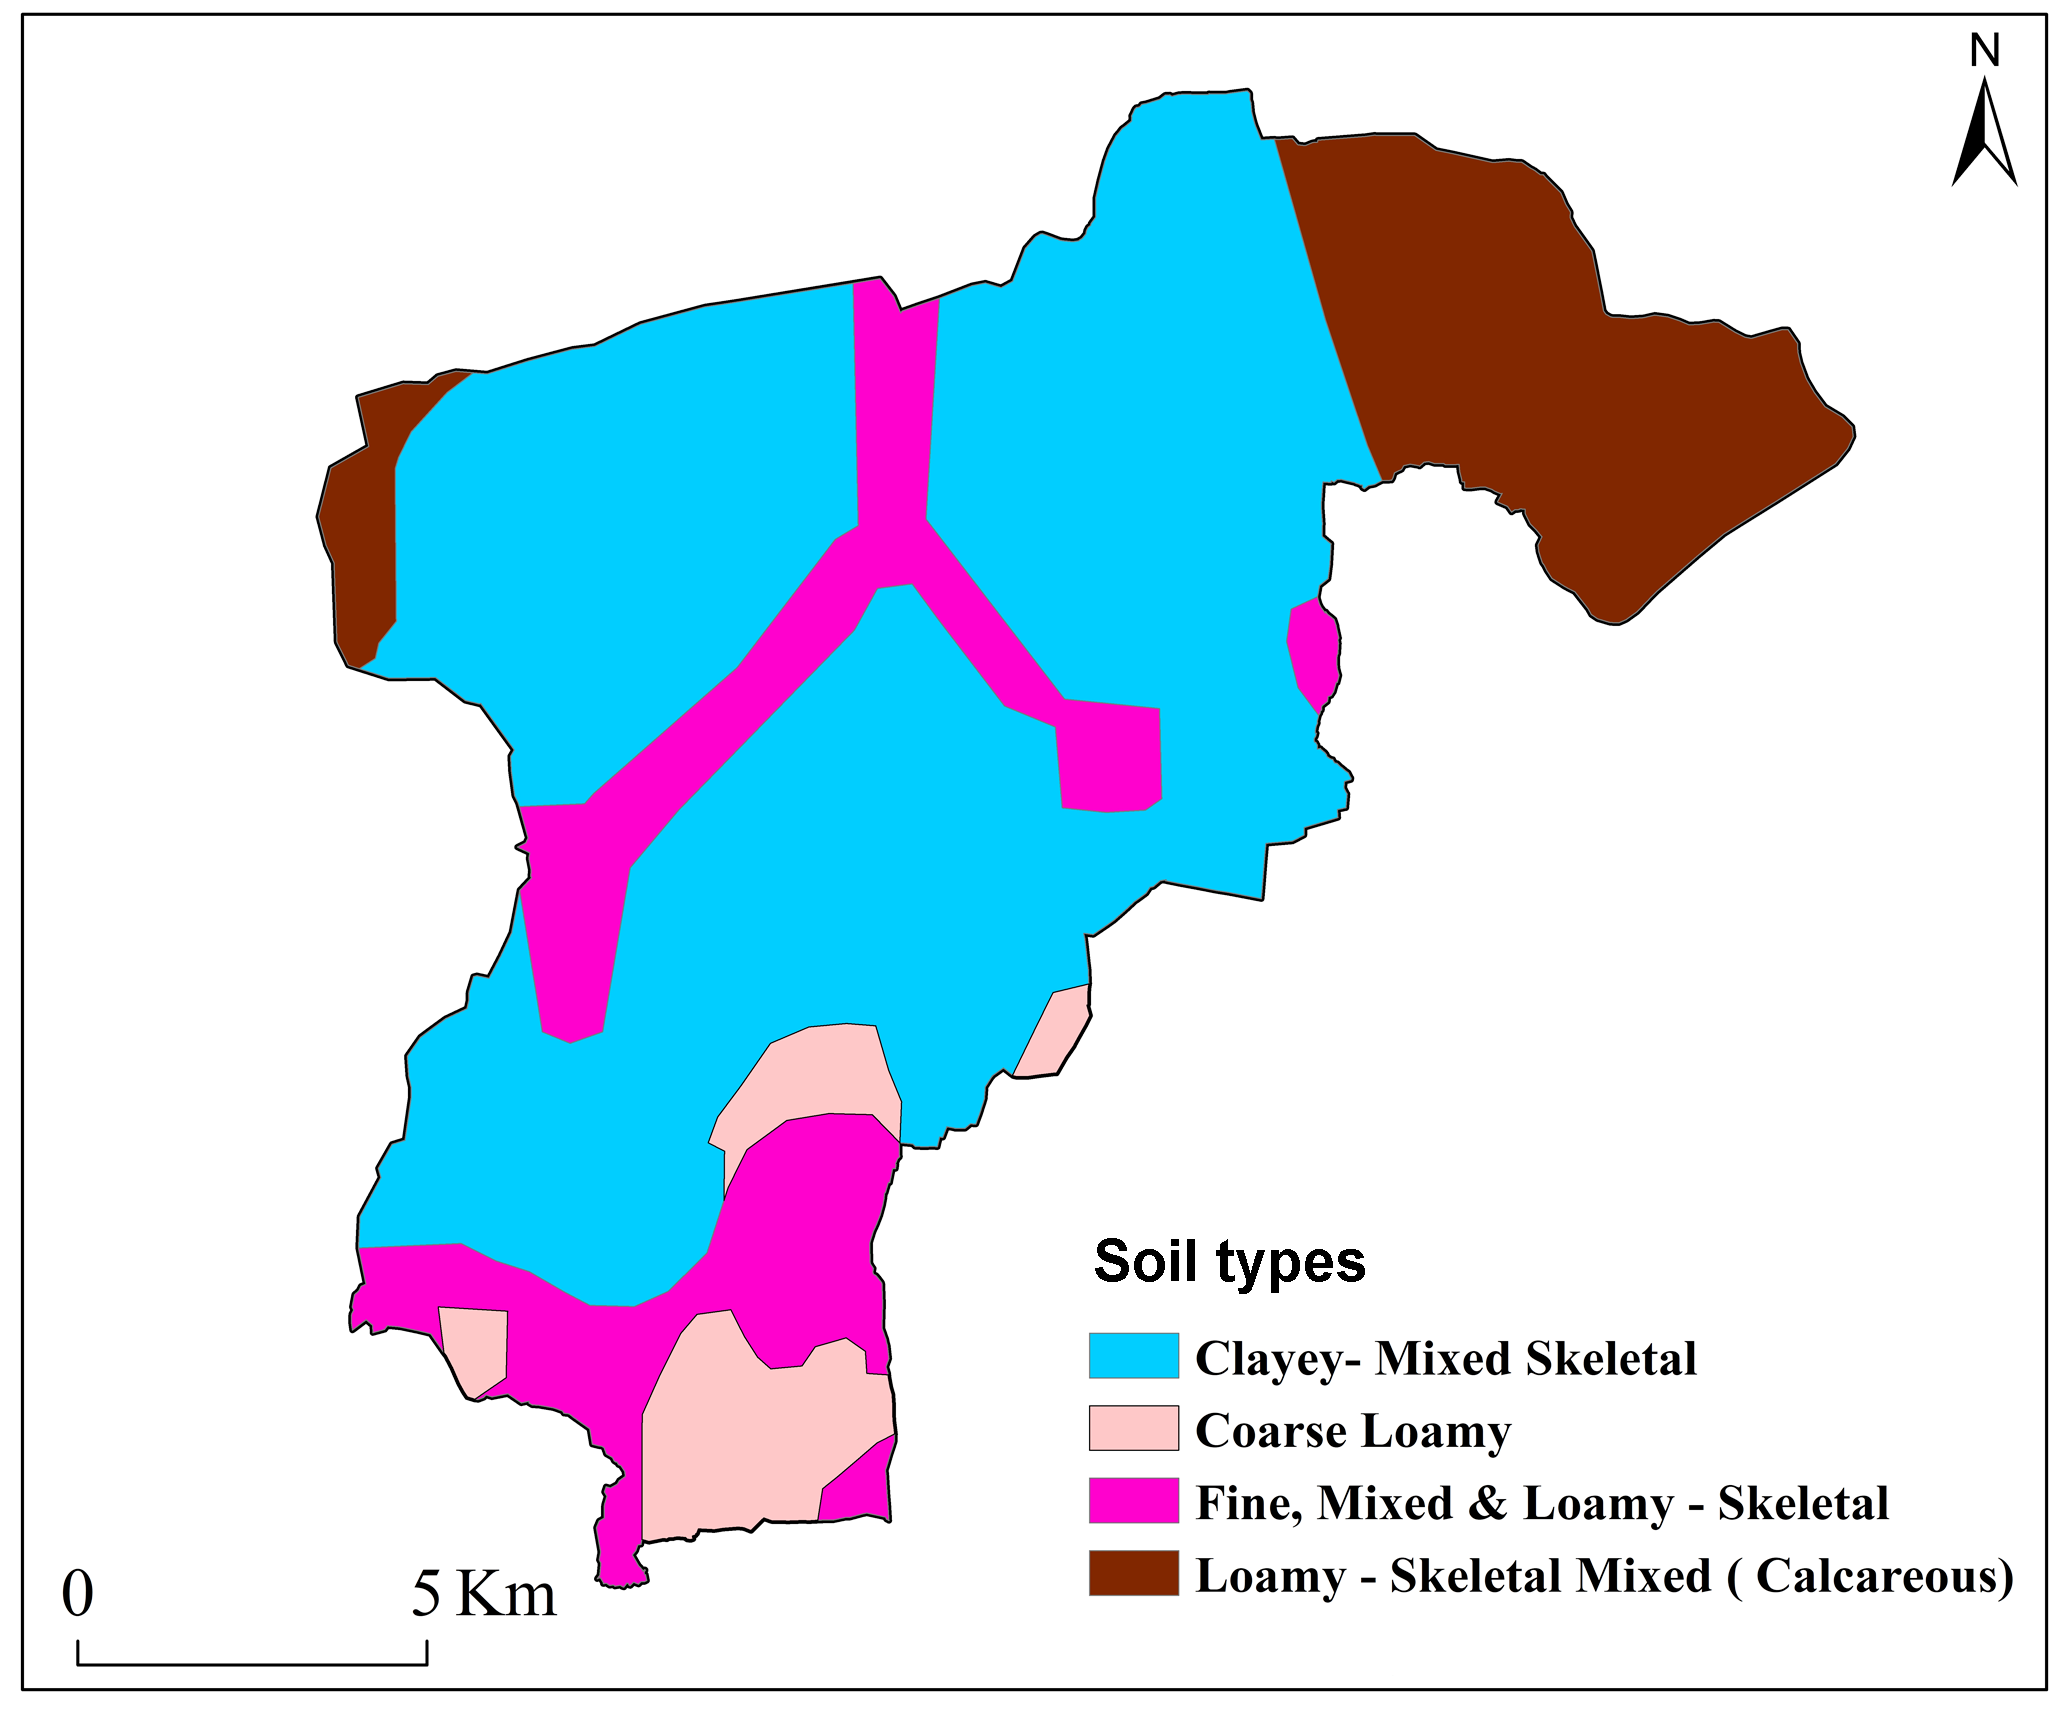
3.1.6 Soils
Soil map was prepared based on information procured from office of Groundwater Department, Anantapur District (Figure 8). The soil in the region includes five principal classes: clay, coarse, fine and mixed loamy calcareous soils. Sandy soil shows higher infiltration rate, thus given higher score in AHP and the clayey soil show least infiltration subsequently allocated lower score.
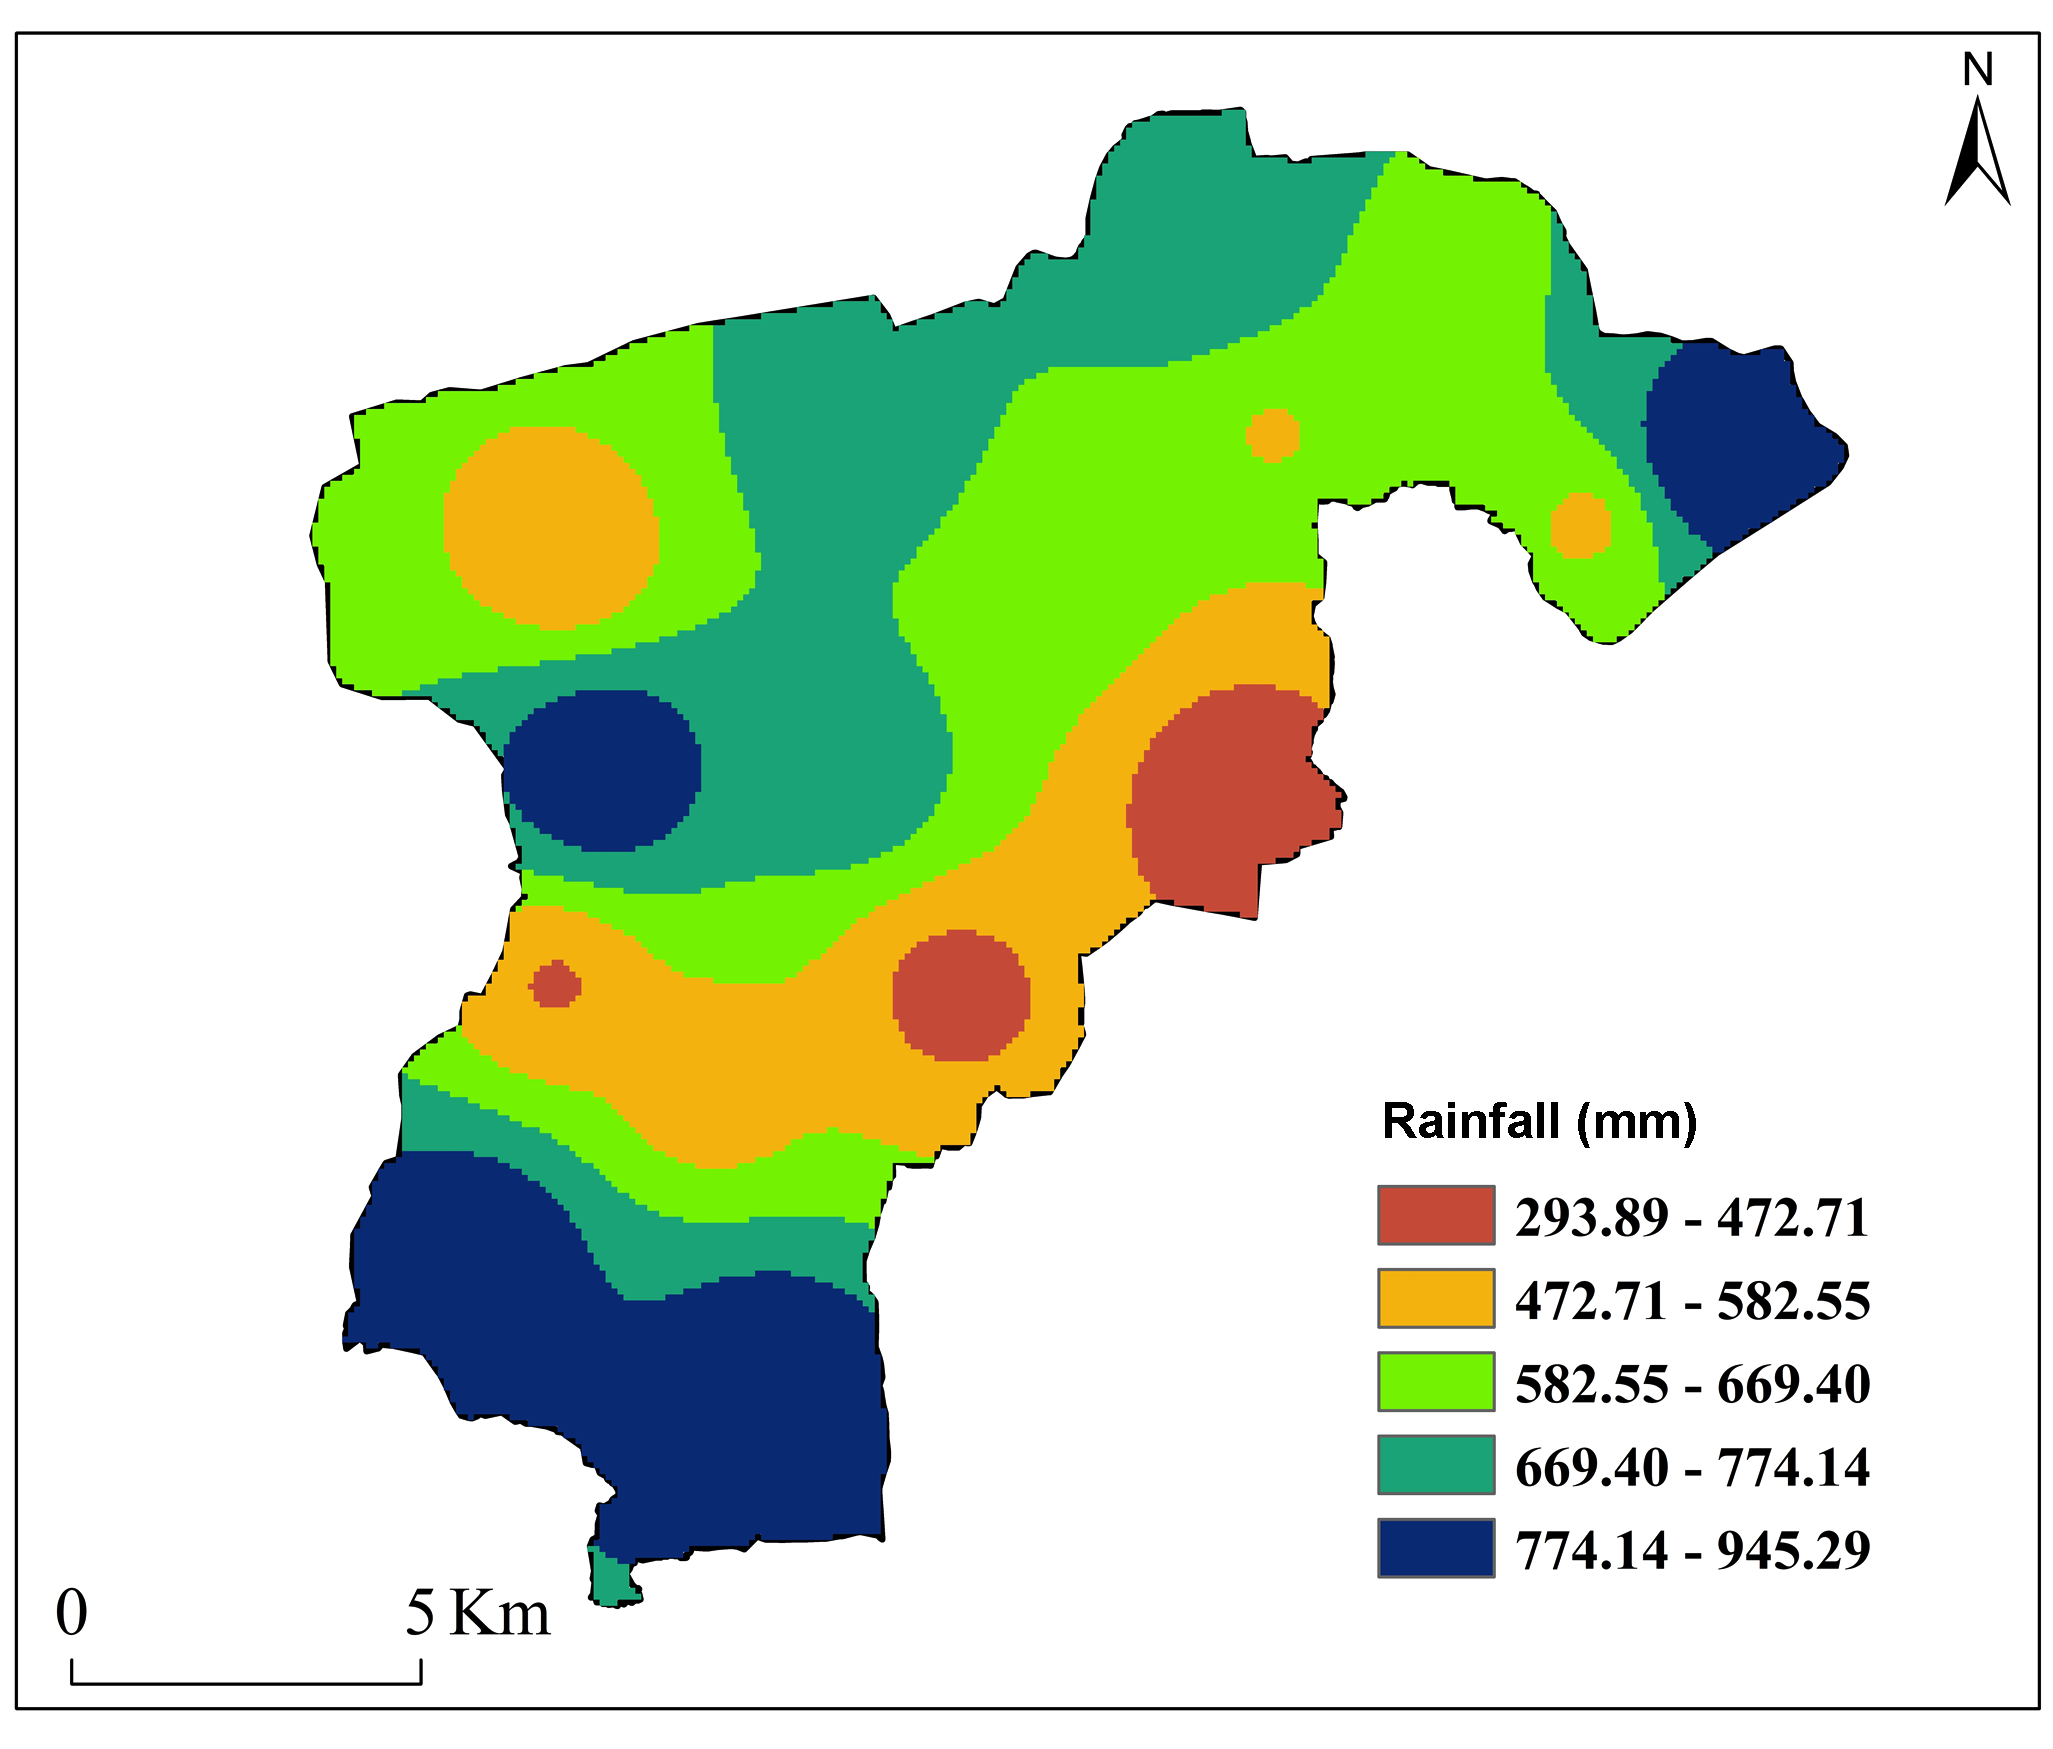
3.1.7 Rainfall
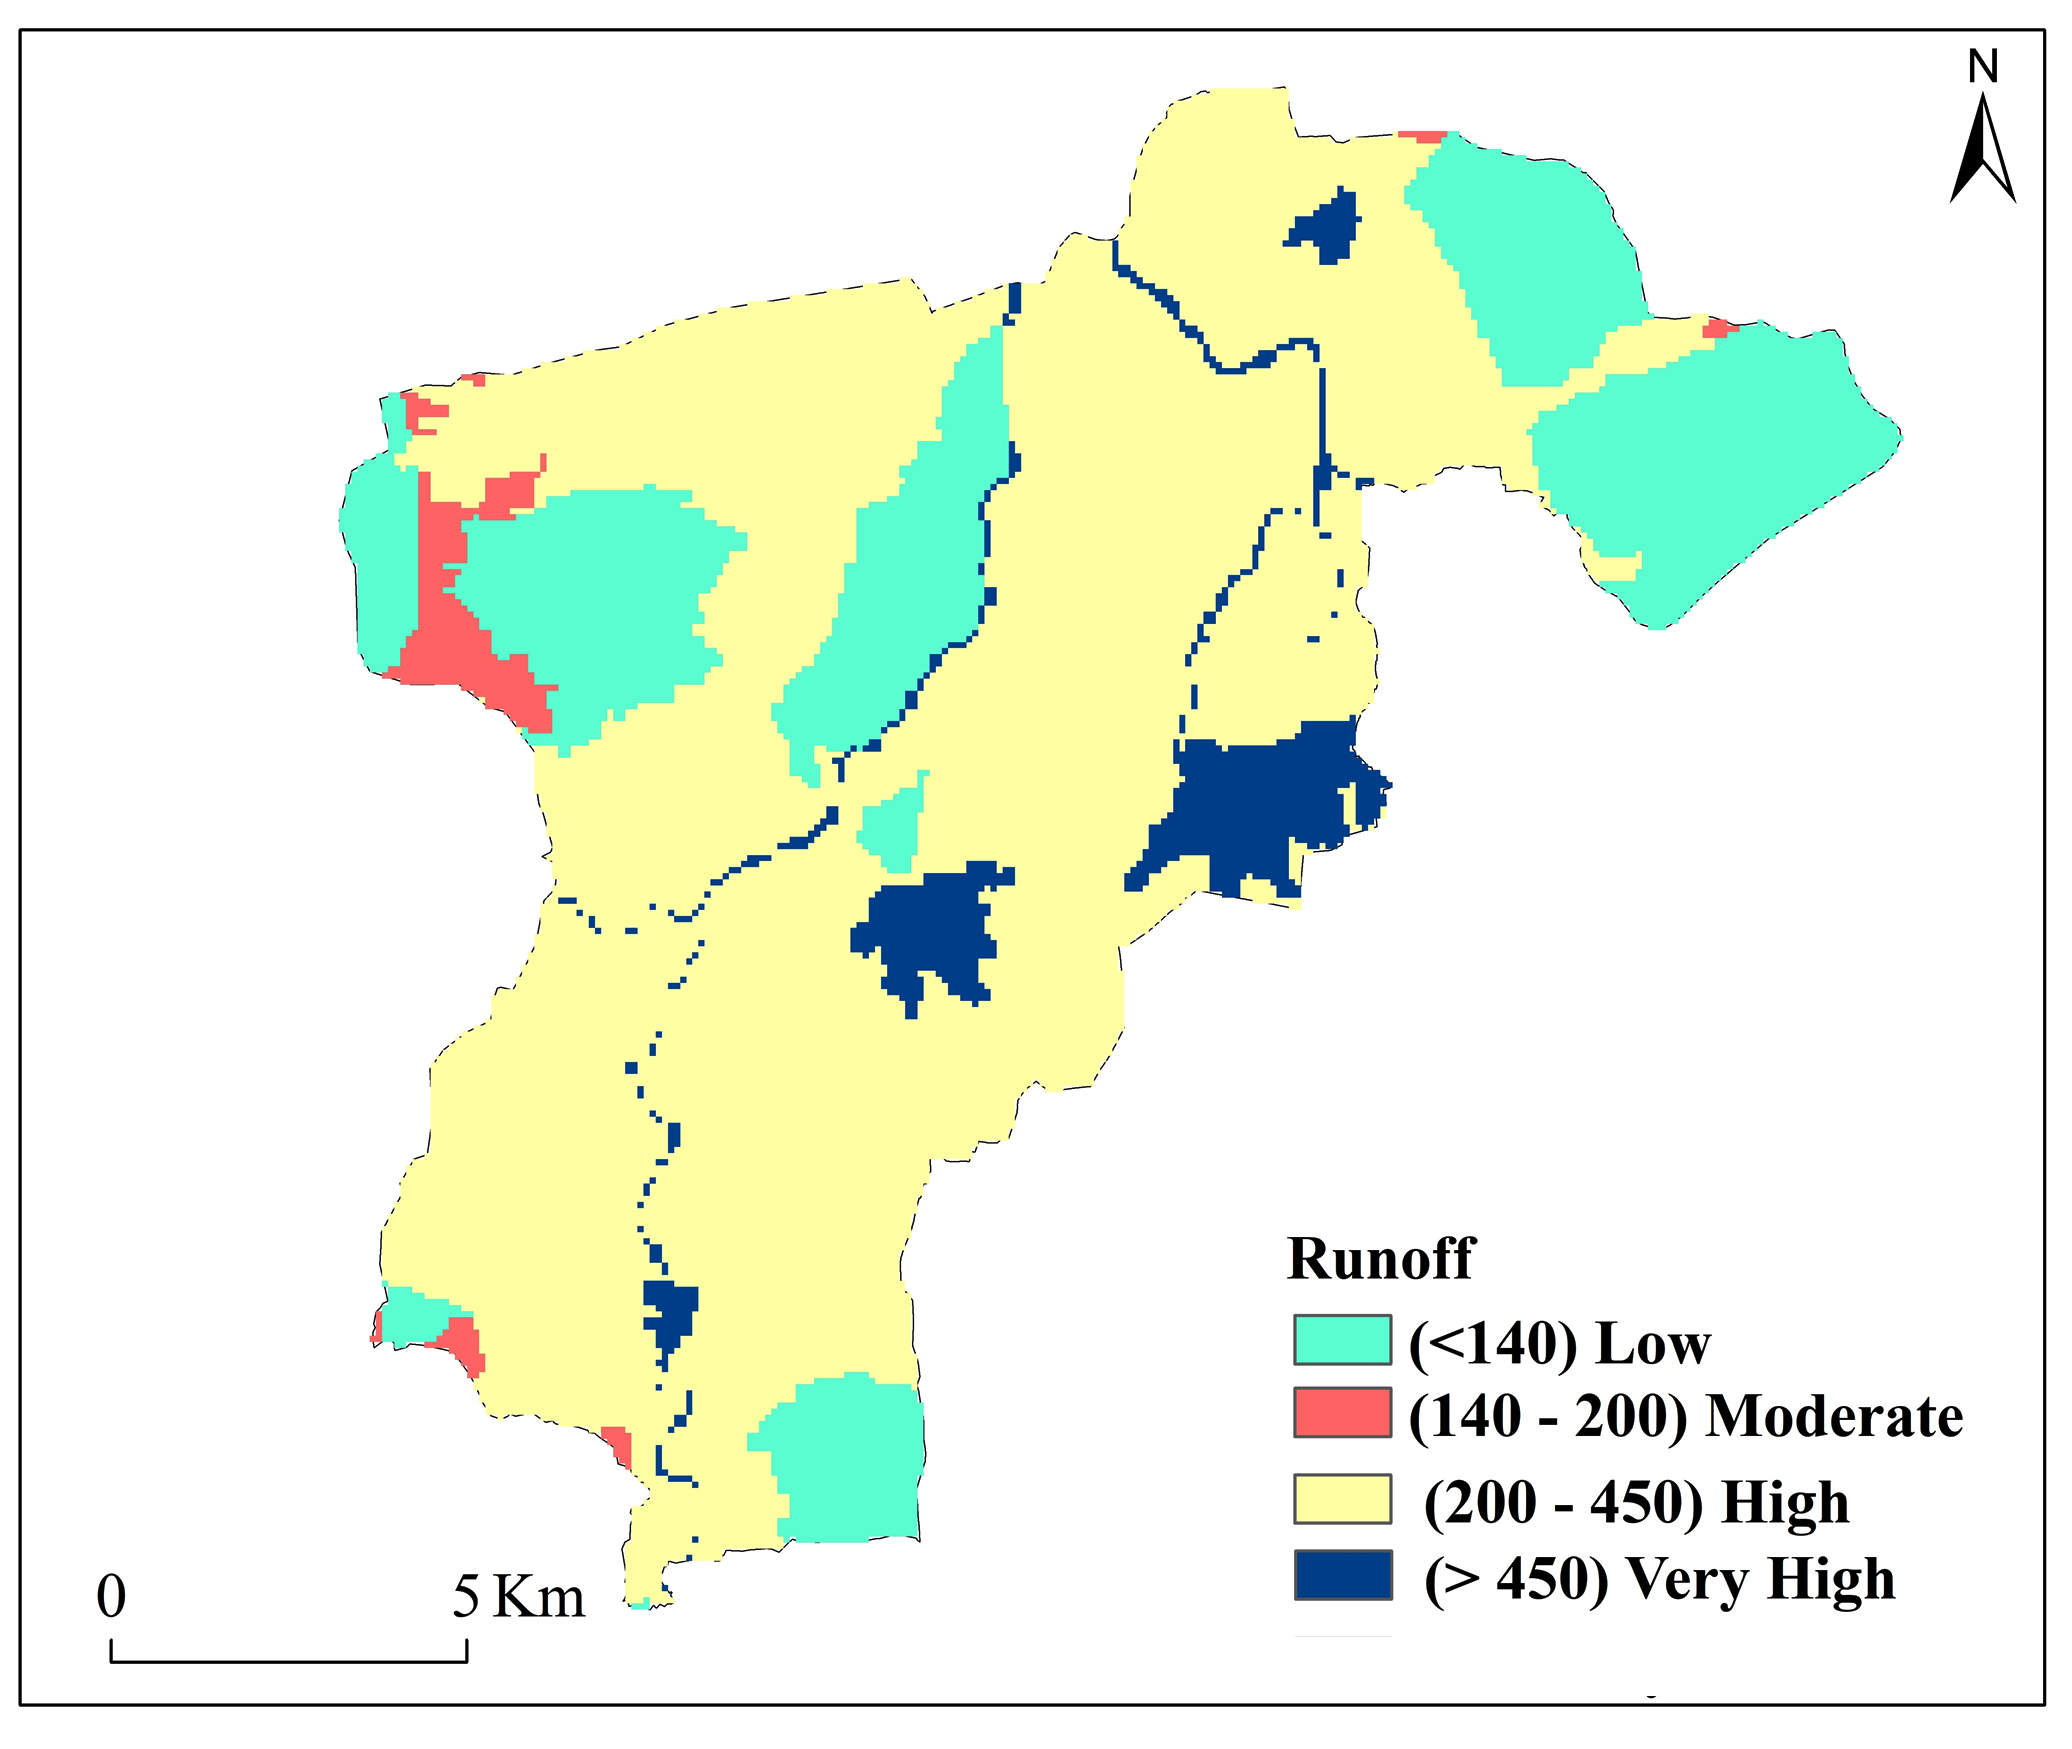
The disparity in rainfall is a main cause of variation in recharge (Musa et al., 2000; Magesh et al., 2012; Shekhar and Pandey, 2014). It significantly affects the groundwater potentials and the proficiency of AHP (Kadam et al., 2017). Monthly information of rainfall regularly collected at meteorological stations for 20 years (i.e., 1998-2018) was obtain from the District Irrigation Administration Office, Anantapur. The rainfall map was reclassified into five categories: 293.89-472.71, 472.71-582.55, 582.55-669.40, 669.40-774.14, and 774.14-945.29mm/year (Figure 9). The normal yearly rainfall in elevated regions is significantly more than the low lands (Siddi Raju et al., 2018). Run-off potential map was prepared using information about LULC, HSGs and rainfall intensity (Figure 11). The formation of surface water is a standout amongst the most critical parameters of RWH. The run-off potential of the present study area is classified into four types: low run-off, moderate run-off, high run-off and very high run-off potentials. Extreme run-off potentials are observed in the Eastern part because of more thickness of water bodies.
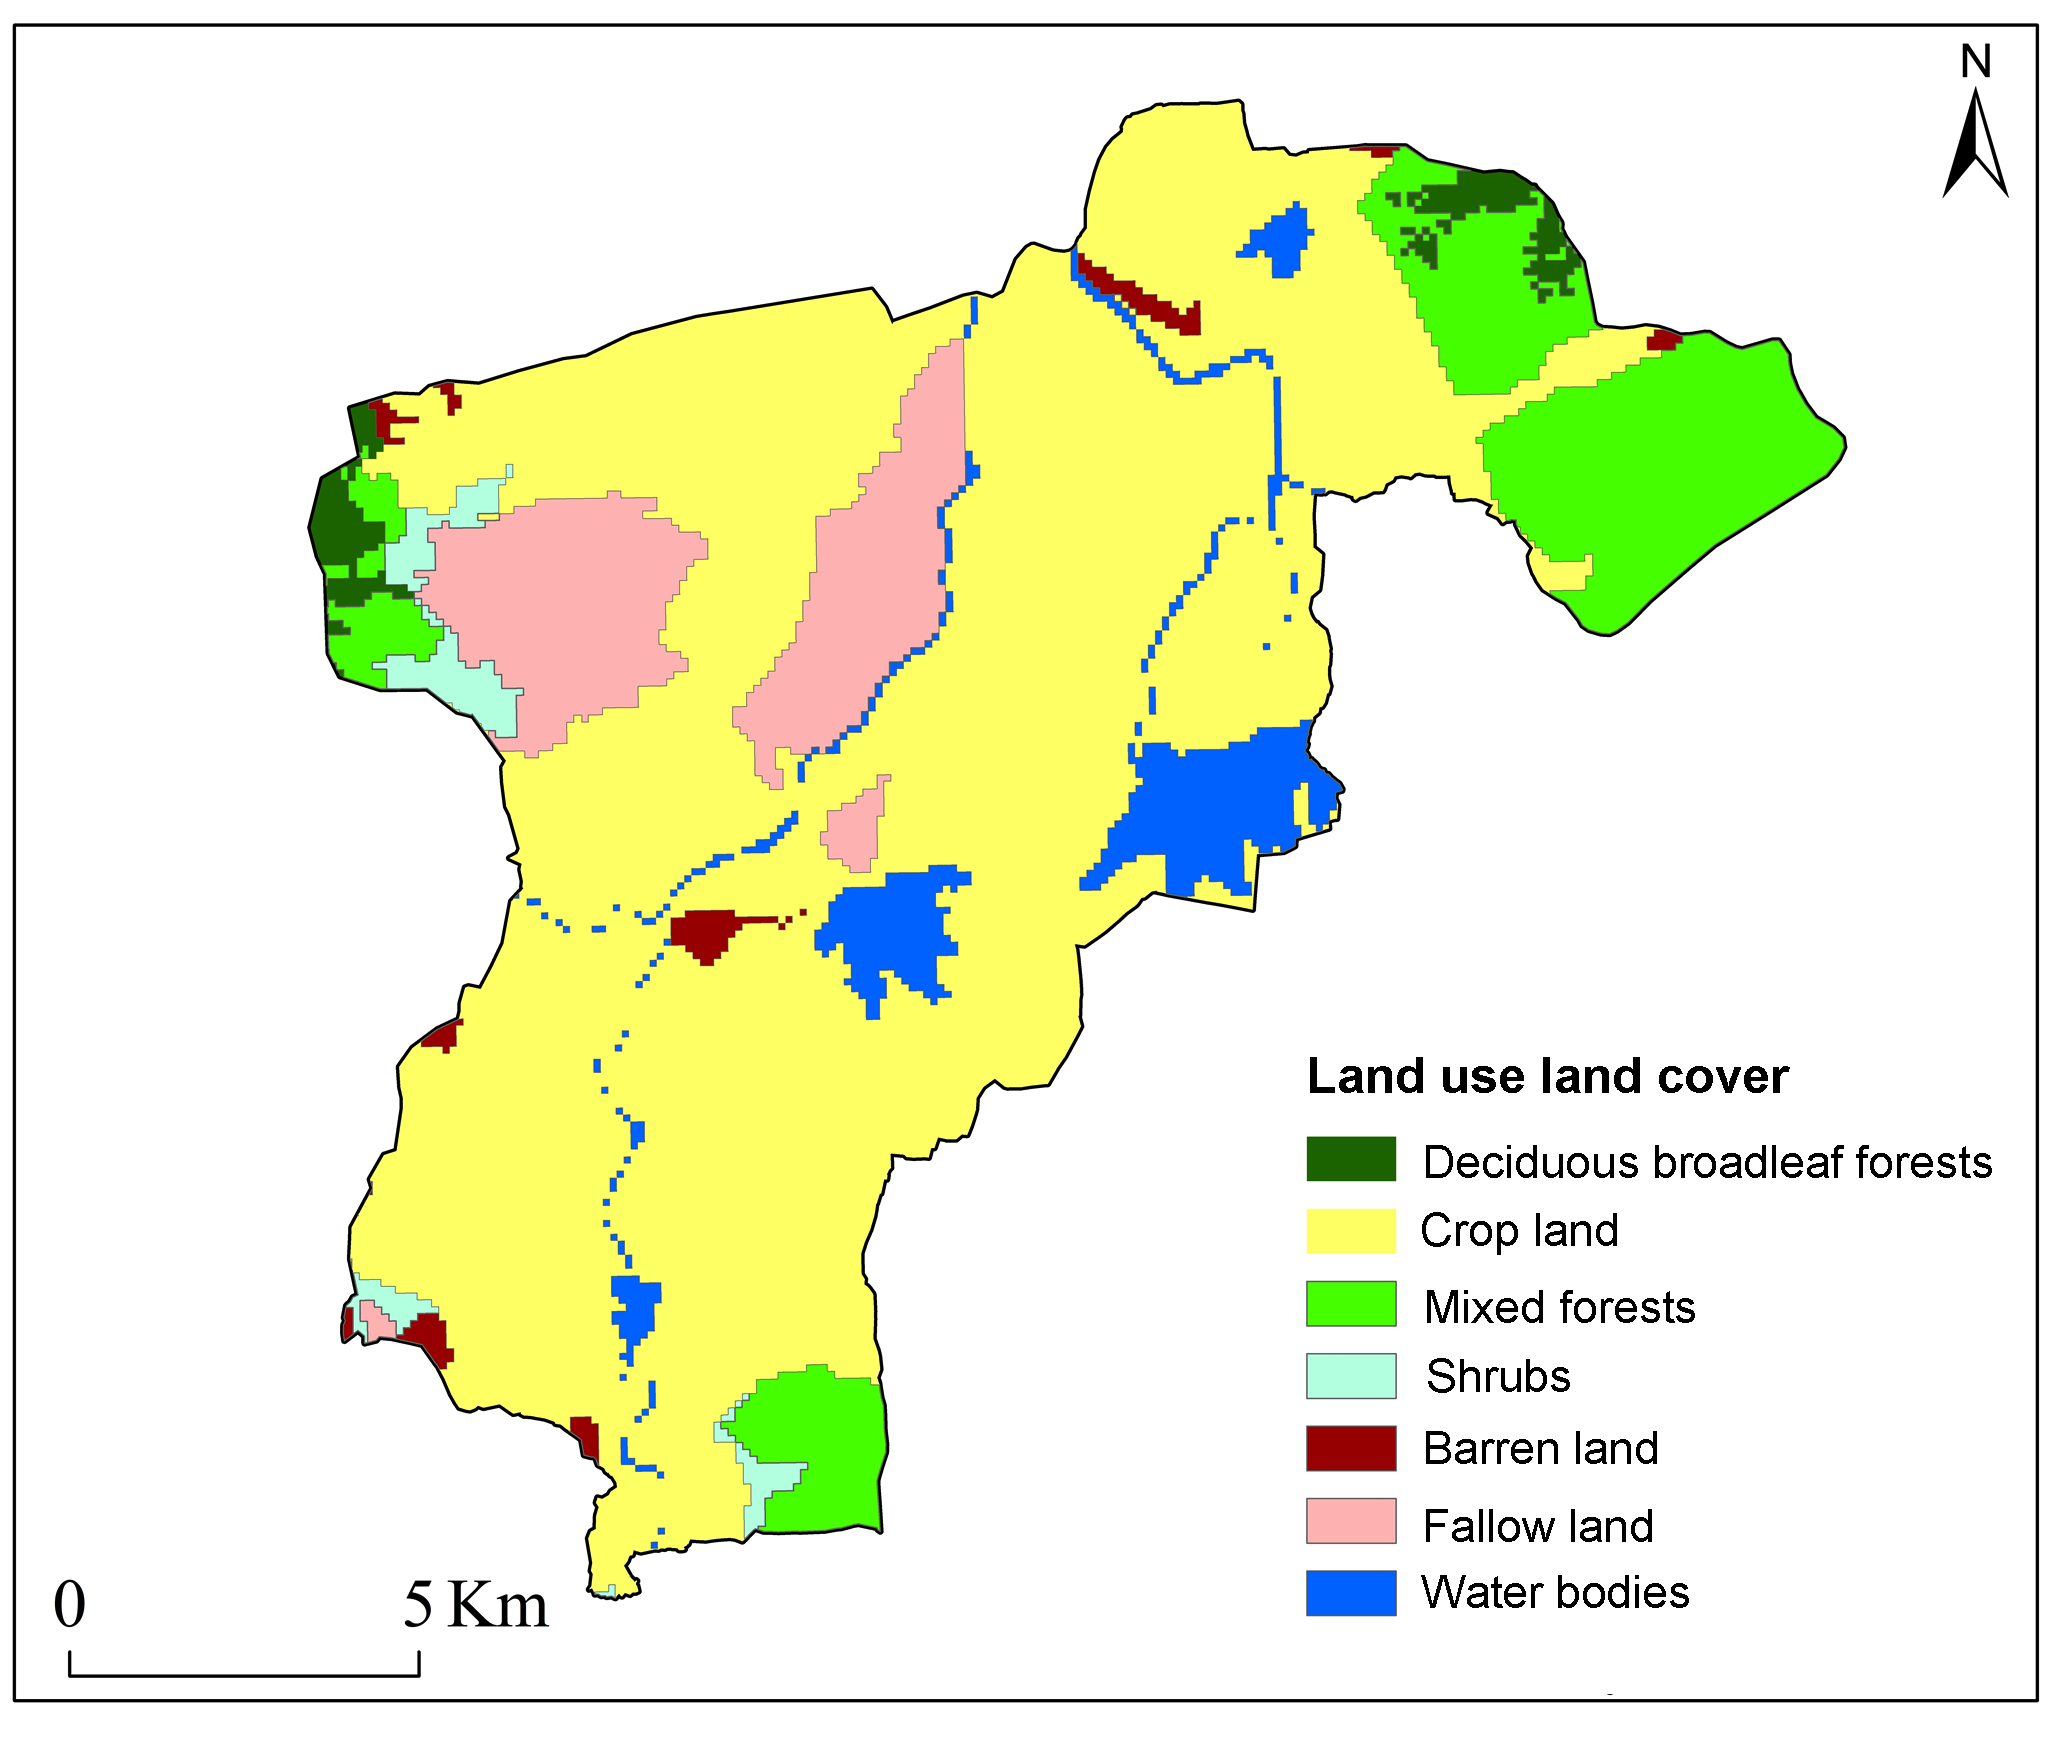
3.1.8 Land use / Land cover (LULC)
Land use depicts how a piece of land is utilized, for example, for irrigation, built up (houses, industries, roads, etc.) identifies with human activities or financial capacities. LULC is interpretable by using satellite imageries (Rajasekhar et al., 2018d). LULC in the region incorporates forest, cropland, fallow land, barren land and water bodies. Cropland and water bodies are very good categories for groundwater recharge and subsequently given maximum score (Figure 10). Sandy regions show good potentials of groundwater recharge while urban areas show poor potentials.
3.2 Analytical Hierarchy Process
AHP is multi-criteria decision making tool which combining various themes, amassing them in a different leveled structure, choices making on the general consequence of sets of segments and mixing the results (Saaty, 1999, 2004). Each thematic layer has been classified into five categories, which shows the connections between the consistent classes. The method for determining the weights to the thematic layer and their comparing features using AHP separately includes the accompanying advances (Saaty, 1980; 2008). A pairwise correlation framework is gathered based on Saaty’s 9 point scale to assess the groundwater potentials in the region (Table 1).
Table 1. Criterions: weights, influences and scores
|
Criterion
|
Weights
|
Influences (%)
|
Sub-criterion
|
Scores
|
|
Geology
|
0.15
|
15
|
Granite and Granodiorite
|
7
|
| |
|
|
Grey Granite/Pink Granite
|
6
|
| |
|
|
Hornblende-Biotite Gneiss
|
8
|
| |
|
|
Metadacite
|
3
|
|
Geomorphology
|
0.11
|
11
|
Water bodies
|
8
|
| |
|
|
Denudational Origin-Low Dissected Hills and Valleys
|
4
|
| |
|
|
Denudational Origin-Pediment-Pediplain Complex
|
7
|
| |
|
|
Denudational Origin-Moderately Dissected Hills and Valleys
|
6
|
| |
|
|
Structural Origin-Low Dissected Hills and Valleys
|
3
|
|
Land use/Land cover
|
0.12
|
12
|
Deciduous Broadleaf Forest
|
4
|
| |
|
|
Crop Land
|
7
|
| |
|
|
Mixed Forest
|
6
|
| |
|
|
Shrub Forest
|
6
|
| |
|
|
Barren Land
|
3
|
| |
|
|
Fallow Land
|
4
|
| |
|
|
Water bodies
|
8
|
|
Drainage Density
|
0.15
|
15
|
0 - 1.34
|
8
|
| |
|
|
1.34 - 3.12
|
6
|
| |
|
|
3.12 - 5.11
|
5
|
| |
|
|
5.11 - 7.91
|
4
|
| |
|
|
7.91 - 13.73
|
3
|
|
Soils
|
0.10
|
10
|
Clayey- Mixed Skeletal
|
3
|
| |
|
|
Coarse Loamy
|
6
|
| |
|
|
Fine, Mixed & Loamy-Skeletal
|
8
|
| |
|
|
Loamy-Skeletal, Mixed (Calcareous)
|
4
|
|
Slope
|
0.12
|
12
|
0 - 6
|
8
|
| |
|
|
6 - 16
|
6
|
| |
|
|
16 - 26
|
5
|
| |
|
|
26 - 45
|
4
|
| |
|
|
> 45
|
3
|
|
Lineament Density
|
0.10
|
10
|
0 - 0012
|
3
|
| |
|
|
0.0012 - 0.0032
|
5
|
| |
|
|
0.0032 - 0.0054
|
6
|
| |
|
|
0.0054 - 0.0083
|
7
|
| |
|
|
0.0083 - 0.0141
|
8
|
|
Rainfall
|
0.15
|
15
|
293.89 - 472.71
|
3
|
| |
|
|
472.71 - 582.55
|
4
|
| |
|
|
582.55 - 669.40
|
5
|
| |
|
|
669.40 - 774.14
|
7
|
|
|
|
|
774.14 - 945.29
|
8
|
Table 2. Pair-wise comparison matrix
|
Criterion
|
Geomorphology
|
Geology
|
LULC
|
DD
|
LD
|
Soil
|
Slope
|
Rainfall
|
Normalized
Weight
|
|
Geomorphology
|
1.000
|
0.500
|
0.333
|
5.000
|
5.000
|
0.500
|
1.000
|
0.143
|
0.11
|
|
Geology
|
2.000
|
1.000
|
0.250
|
4.000
|
1.000
|
0.500
|
0.500
|
3.000
|
0.15
|
|
LULC
|
3.000
|
4.000
|
1.000
|
5.000
|
2.000
|
0.333
|
3.000
|
0.250
|
0.12
|
|
DD
|
0.200
|
0.250
|
0.200
|
1.000
|
0.333
|
0.250
|
0.200
|
0.333
|
0.15
|
|
LD
|
0.200
|
1.000
|
0.500
|
3.000
|
1.000
|
0.333
|
2.000
|
1.000
|
0.10
|
|
Soil
|
2.000
|
0.500
|
3.000
|
4.000
|
3.000
|
1.000
|
3.000
|
2.000
|
0.10
|
|
Slope
|
1.000
|
2.000
|
0.333
|
5.000
|
0.500
|
0.333
|
1.000
|
0.200
|
0.12
|
|
Rainfall
|
7.000
|
0.330
|
4.000
|
3.000
|
1.000
|
0.500
|
5.000
|
1.000
|
0.15
|
4 . RESULTS AND DISCUSSIONS
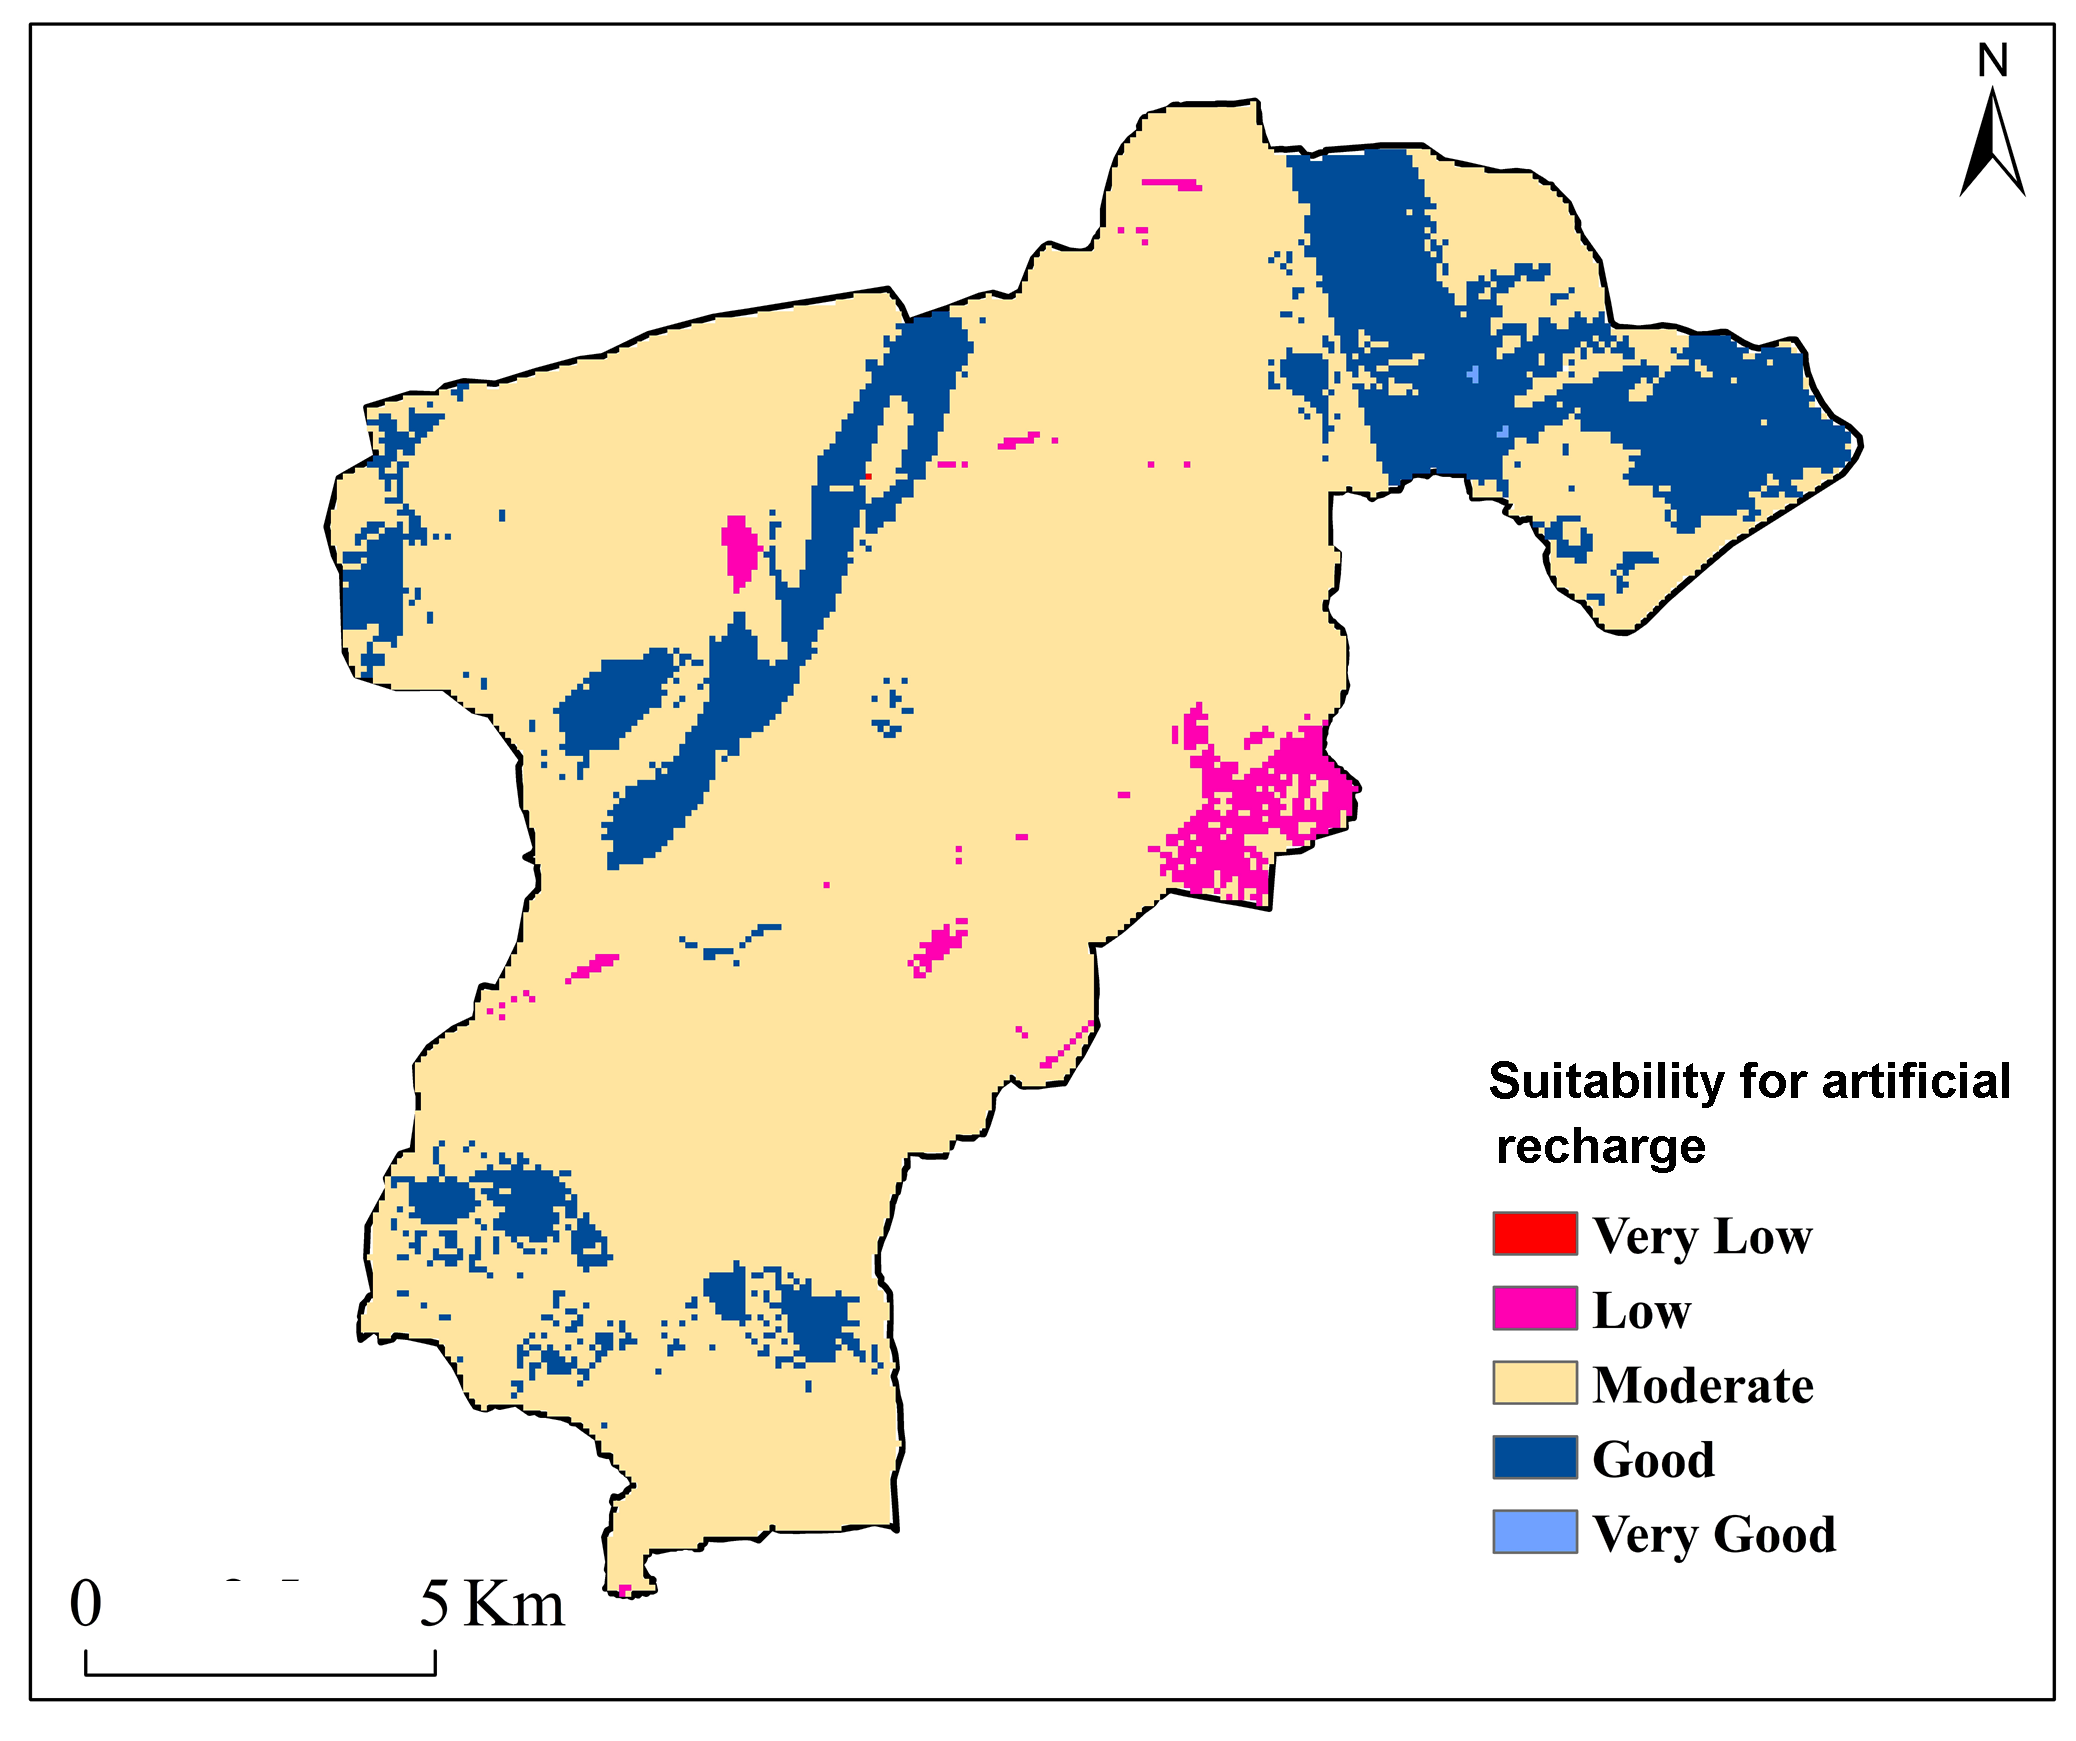
4.1 Artificial Groundwater Recharge Zones (AGRZ)
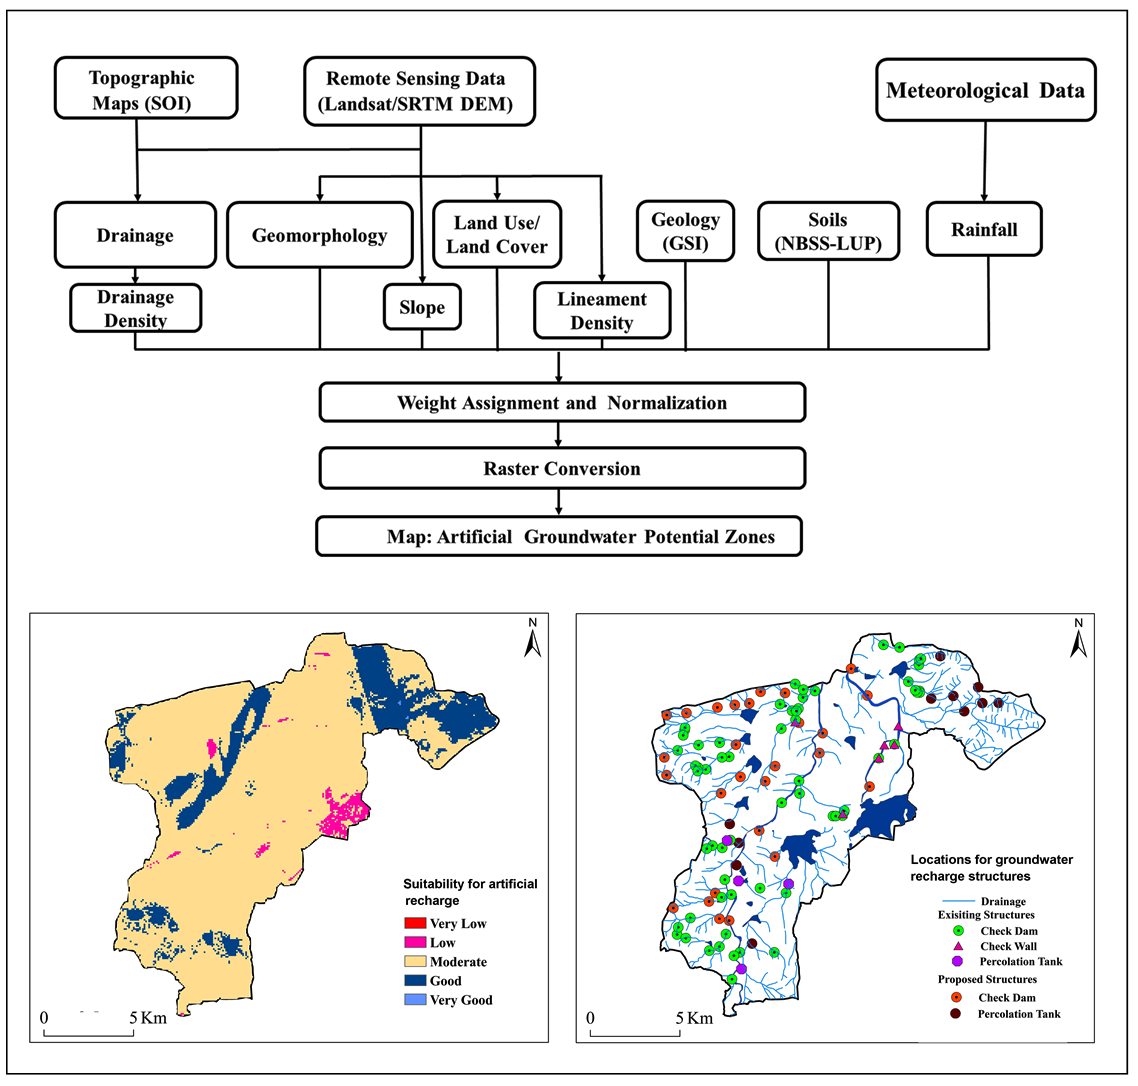
AGRZs of the present study were identified through weighted overlay of thematic maps: geology, geomorphology, LULC, LD, DD, soils, slope and rainfall in ArcGIS software. The weights were assigned for these eight thematic layers (Shailaja et al., 2018; Shankar et al., 2005) (Table 2) and the normalized weights for various features were calculated (Table 2). The AGRZ map was prepared using GIS-based AHP approach (Figure 12). As per the quintile process, the AGRZ values were reclassified into five categories: very low, low, moderate, good, and very good categories (CGWB 2006; 2007; 2013a; 2013b). The outcomes additionally demonstrated that 4.48%, 11.94%, 61.59%, 17.70%, and 4.29% area of the region shows very low, low, moderate, good, and very good potential of groundwater recharge (Table 3). In view of figure 12, the very good GWP are observed at the north-eastern piece of the region. As a result of a high slope, high DD and lithology with low porousness, the Eastern part falls into low AGRZ. It is obvious from the AGRZ map that Northwestern and Southwestern region of the present study is most reasonable for AGRZ (Kumar, et al. 2016; Singh et al., 2017). The accuracy assesment carried out through the existing ARS in the study area and matched with AGRZ map. ARS data according to AGRZs was collected from the field observations. The accuracy of the results is as:
Total number of artificial recharge structures = 78
Number of structures: agreement with AGRZ map = 64
Number of structures: agreement with AGRZ map = 14
Over all accuracy = 82%
The overall accuracy of the prediction shows that the methods and techniques used in the study are significantly reliable and precise.
Table 3. Potentials of artificial groundwater recharge
|
Classes
|
Area
|
|
%
|
km2
|
|
Very Low
|
4.48
|
9.35
|
|
Low
|
11.94
|
24.94
|
|
Moderate
|
61.59
|
128.60
|
|
Good
|
17.70
|
36.95
|
|
Very Good
|
4.29
|
8.96
|
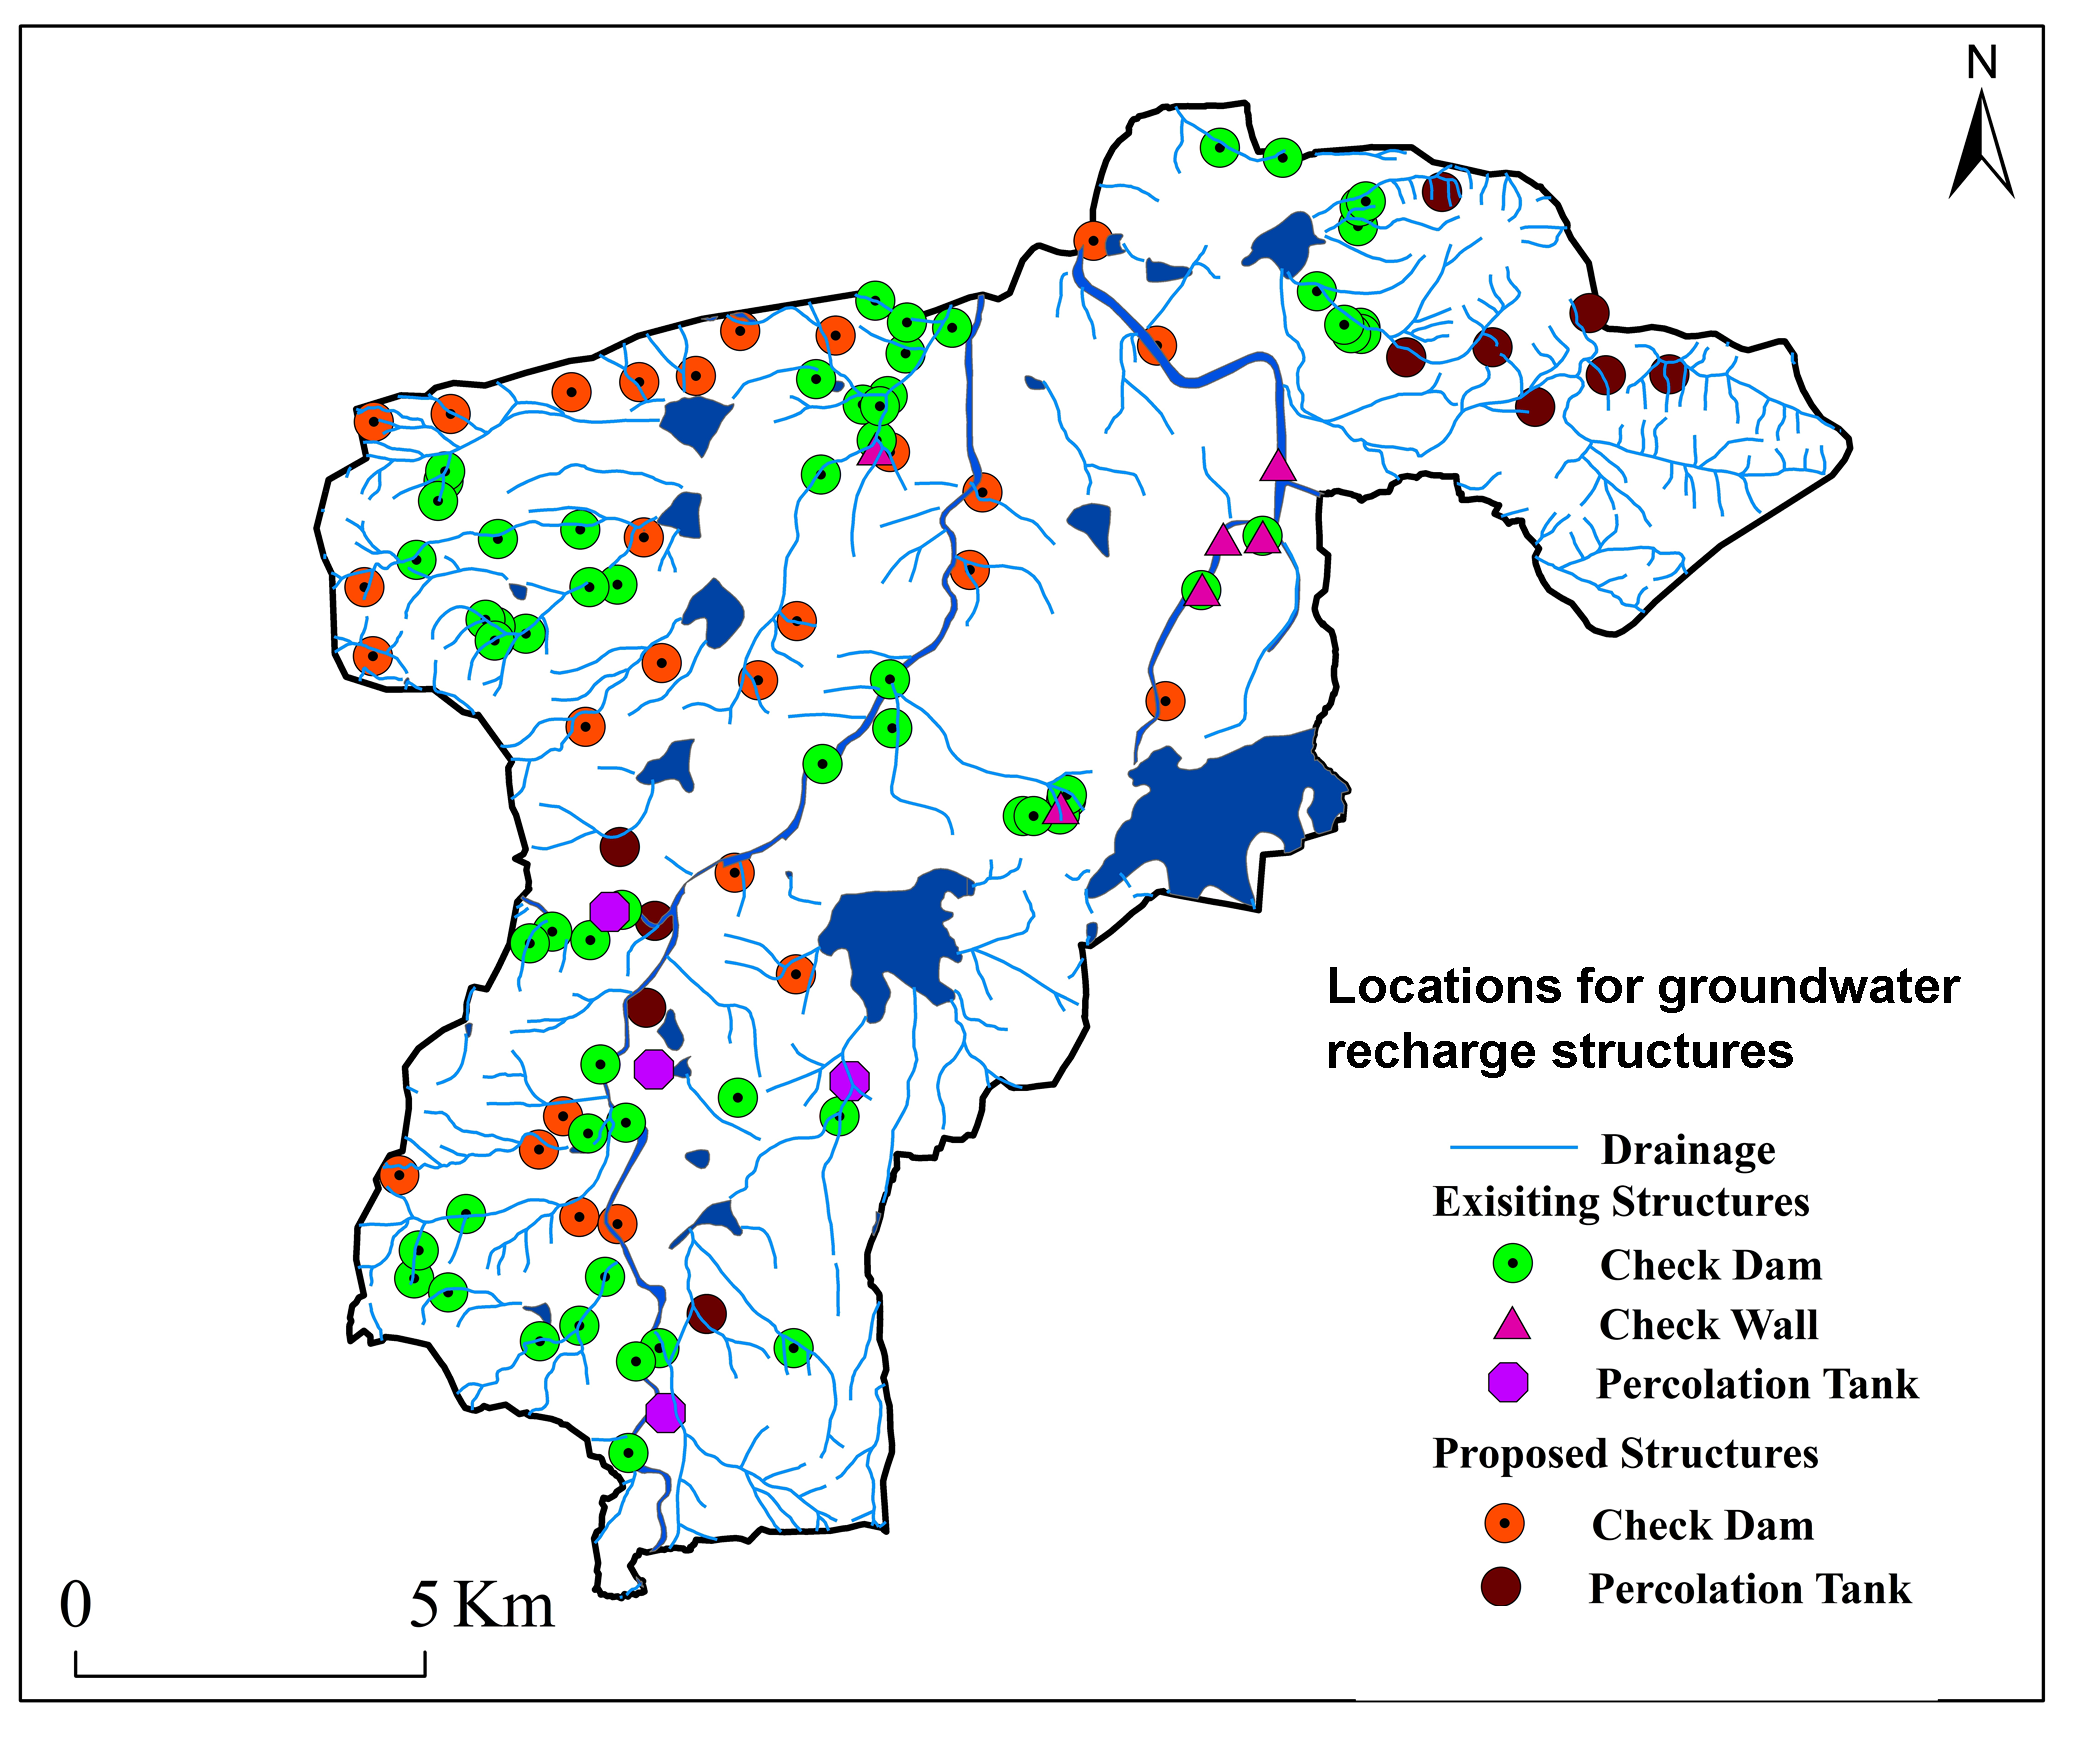
4.2 Types and Feasible Numbers of Recharge Structures
Distinctive SWC sites have recommended in this study by various topographical and hydrogeological constraints and plausibility of structures in the present study AGRZ map prepared using AHP technique was used here to propose different artificial recharge structures (ARS) (Kumar et al., 2016). The proposed and existing ARS in the study region are Check Dam (92), Check Wall (7) and Percolation Tank (19) (Figure 13).


 ,
Sudarsana Raju G 1
,
Sudarsana Raju G 1