1 . INTRODUCTION
Droughts largely influence the ecological, cultural and socio-economic sectors (Dalezios et al., 2014; Skakun et al., 2016; Amalo et al., 2017). Generally, droughts are categorized into meteorological, agricultural and hydrological (Zargar et al., 2011). Prediction of drought is associated with the monsoon conditions which are controlled by distribution of various regional and local factors like El Nino and Southern Oscillation (ENSO) events, atmospheric parameters, etc. (Ropelewski and Halpert, 1986). The impact of drought is prominently visualized on agricultural sector because of the reduction in crop cultivation, stunted growth and productivity (Sruthi and Aslam, 2015).
The share of rainfed crops is very high in semi-arid regions of India. Various indices based on remotely sensed data, statistical methods, GIS techniques and hydrogeological investigations have been introduced for monitoring and predicting drought characteristics such as duration, severity and areal extent (Khalil et al., 2013; Domenikiotis et al., 2004; Thenkabail and Gamage, 2004; Arshad et al., 2007; Murad and Islam, 2011; Wardlow et al., 2012; Melese et al., 2018). These indices are helpful for classification of the area into various drought zones viz. high, moderate, low and no drought (Kogan, 2001). Vegetation Health Index (VHI) is function of Temperature Condition Index (TCI) and Vegetation Condition Index (VCI), which is an indicator of green growth. In this study, the droughts in Bhima catchment area have been evaluated using VHI to understand the intensity.
3 . METHODOLOGY
3.1 Data
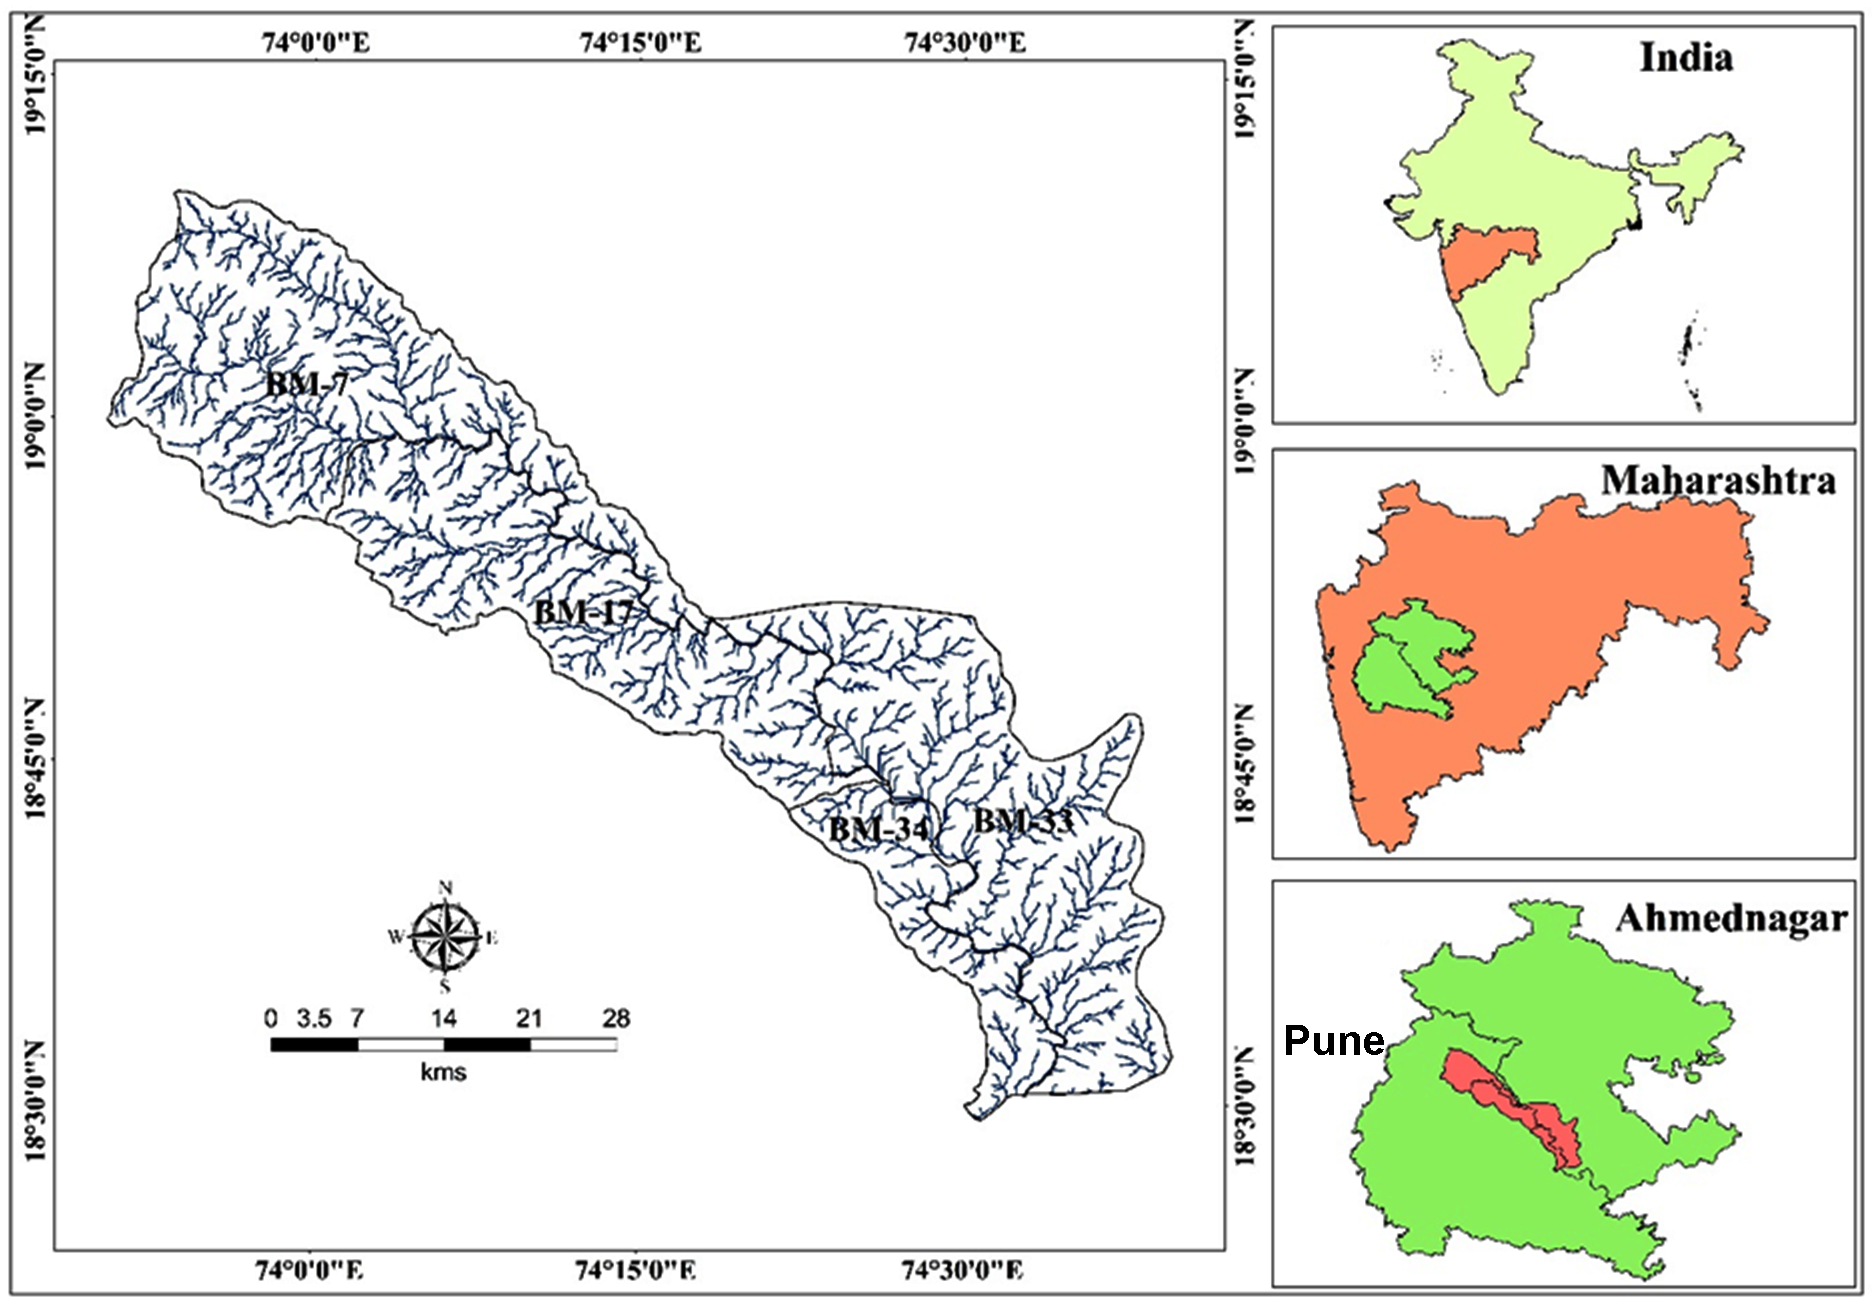
Rainfall data (1981 to 2017) have been procured from IMD to sort out scanty rainfall years. Considering the availability of 250m resolution and relative clarity in MODIS data, it was used in this research to derive Vegetation Health Index (VHI). The details of the satellite data are: MODIS/Terra, (16-day) NDVI product MOD13A2 and MOD11A2, Land Surface Temperature/Emissivity (8-days) LST product. Global MOD13A2 and MOD11A2 data are available for every 16 days and 8 days, respectively, at 1km spatial resolution as a griddedlevel-3 product in Sinusoidal projection. The data of pre-and post-monsoon seasons (April, May and November, December) has been used for the analysis for six low rainfall years (2000, 2002, 2009, 2014, 2015 and 2017).
3.2 Pre-processing of Satellite Data
The MODIS NDVI (16 bit signed integer) and LST (16bit unsigned integer) data are available in Hierarchical Data Format (HDF) with valid range from 2000 to 10,000 (NDVI) and 7500 to 65535 (LST). The data for the study area was covered in two tiles (h24v07 and h25v07) and converted to tiff format. The image mosaic and projection from sinusoidal to UTM (Zone-43N) was performed for the entire dataset. Normalized Difference Vegetation Index (NDVI) values were rescaled between +1 to -1 by multiply 0.0001 and Land Surface Temperature by 0.02 factors.
3.3 Drought Indices
3.3.1 Normalized Difference Vegetation Index (NDVI)
NDVI values were used to identify the area with green cover, health of plants, growth pattern of agriculture, water stressed crops and also the different type of crops as well as vegetation. (Dutta et al., 2015; Tarpley et al., 1984; Tucker et al., 1985). NDVI has been calculated using ‘Raster Calculator’ in GIS software as:
\(NDVI= {NIR-RED \over NIR+RED}\)
where,
\(NIR\) = Reflectance in Near Infrared band.
\(RED\) = Reflectance in Red band.
3.3.2 Vegetation Condition Index (VCI)
Vegetation Condition Index has been introduced by Kogan (1990). The VCI calculations are based on NDVI values with respect to its maximum amplitude. VCI is the function of NDVI values of specific area or pixel and it is the subtraction of NDVI value to the minimum NDVI values of that pixel or area divided by the sum of NDVI maximum value and NDVI minimum value of the entire area into 100. The maximum amplitude shows the highest possible variation from the values (Liu and Kogan, 1996).
VCI (%) is calculated as:
\(VCI_j = {NDVI_j-NDVI_{min} \over NDVI_{max}+NDVI_{min}} \times100\)
Where,
\(VCI_j\) = VCI at the jth period in a specific month.
\(NDVI_j\) = NDVI at the jth period in a specific month.
\(NDVI_{max}\) = Maximum value of the NDVI for that year.
\(NDVI_{min}\) = Minimum value of the NDVI.
VCI (%) value ranges between 50 and 100 are indicating good condition of vegetation, while values less than 35 show severe drought condition. Although there are many other vegetation and derived indices, but VCI and NDVI deviation from historic NDVI are being used on operational basis to assess drought situation (Kogan, 1995). VCI is the average greenness of the same area over given defined time based on pixel values of same location.
3.3.3 Land Surface Temperature (LST)
The MODIS data provides LST as well as the Emissivity (E) values for every pixel based on its radiances. The temperature is also calculated using scale factor from kelvin. The precise DN values were calculated using following equation:
Temperature = ( DN X 0.02 ) - 273.15ºC
3.3.4 Temperature Condition Index (TCI)
Generally, VCI is recommended for drought assessment, however, it has been seen that only VCI is not helpful for precise drought identification. Therefore the atmospheric parameter such as temperature is also used for the assessment of drought in the area. Hence, to improve the drought assessment results, TCI was recommended to capture different responses of vegetation to in-situ temperature that provide additional information. TCI can be obtained by employing thermal channels of MODIS (Kogan, 1995). The TCI was calculated using the following formula:
\(TCI = {LST_{max}-LST_{a} \over LST_{max}+LST_{min}} \times100\)
where,
\(LST_a\) = LST value of current month.
\(LST_{min}\) = Minimum LST value calculated from multiyear time series data.
\(LST_{max}\) = Maximum LST value calculated from multiyear time series data.
3.3.5 Vegetation Health Index (VHI)
Vegetation Health Index was calculated to assess both vegetation and temperature condition that together helpful in understanding the drought intensity. The VHI is expressed as following formula:
\(VHI=((a \times TCI)+(a \times VCI))\)
Where, VHI is related to VCI and TCI by ‘ \(a\) ’ equals to 0.5 (Rojas et al., 2011; Kogan, 2001).
The VHI pixel values were classified into five categories to understand the distribution of drought intensity based on classification scheme given by Kogan (2002) (Table 1).
Table 1. VHI based classification scheme for drought mapping (Kogan, 2002)
|
Classes
|
VHI values
|
|
Extreme drought
|
<10
|
|
Severe drought
|
10-20
|
|
Moderate drought
|
20-30
|
|
Mild drought
|
30-40
|
|
No drought
|
>40
|
4 . RESULTS AND DISCUSSIONS
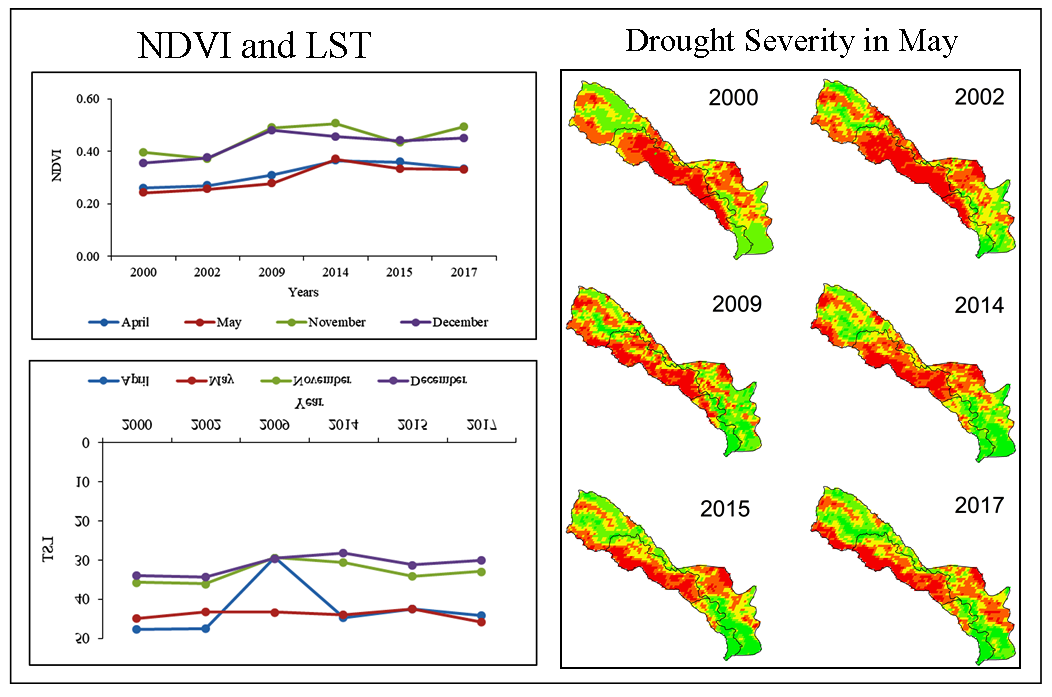
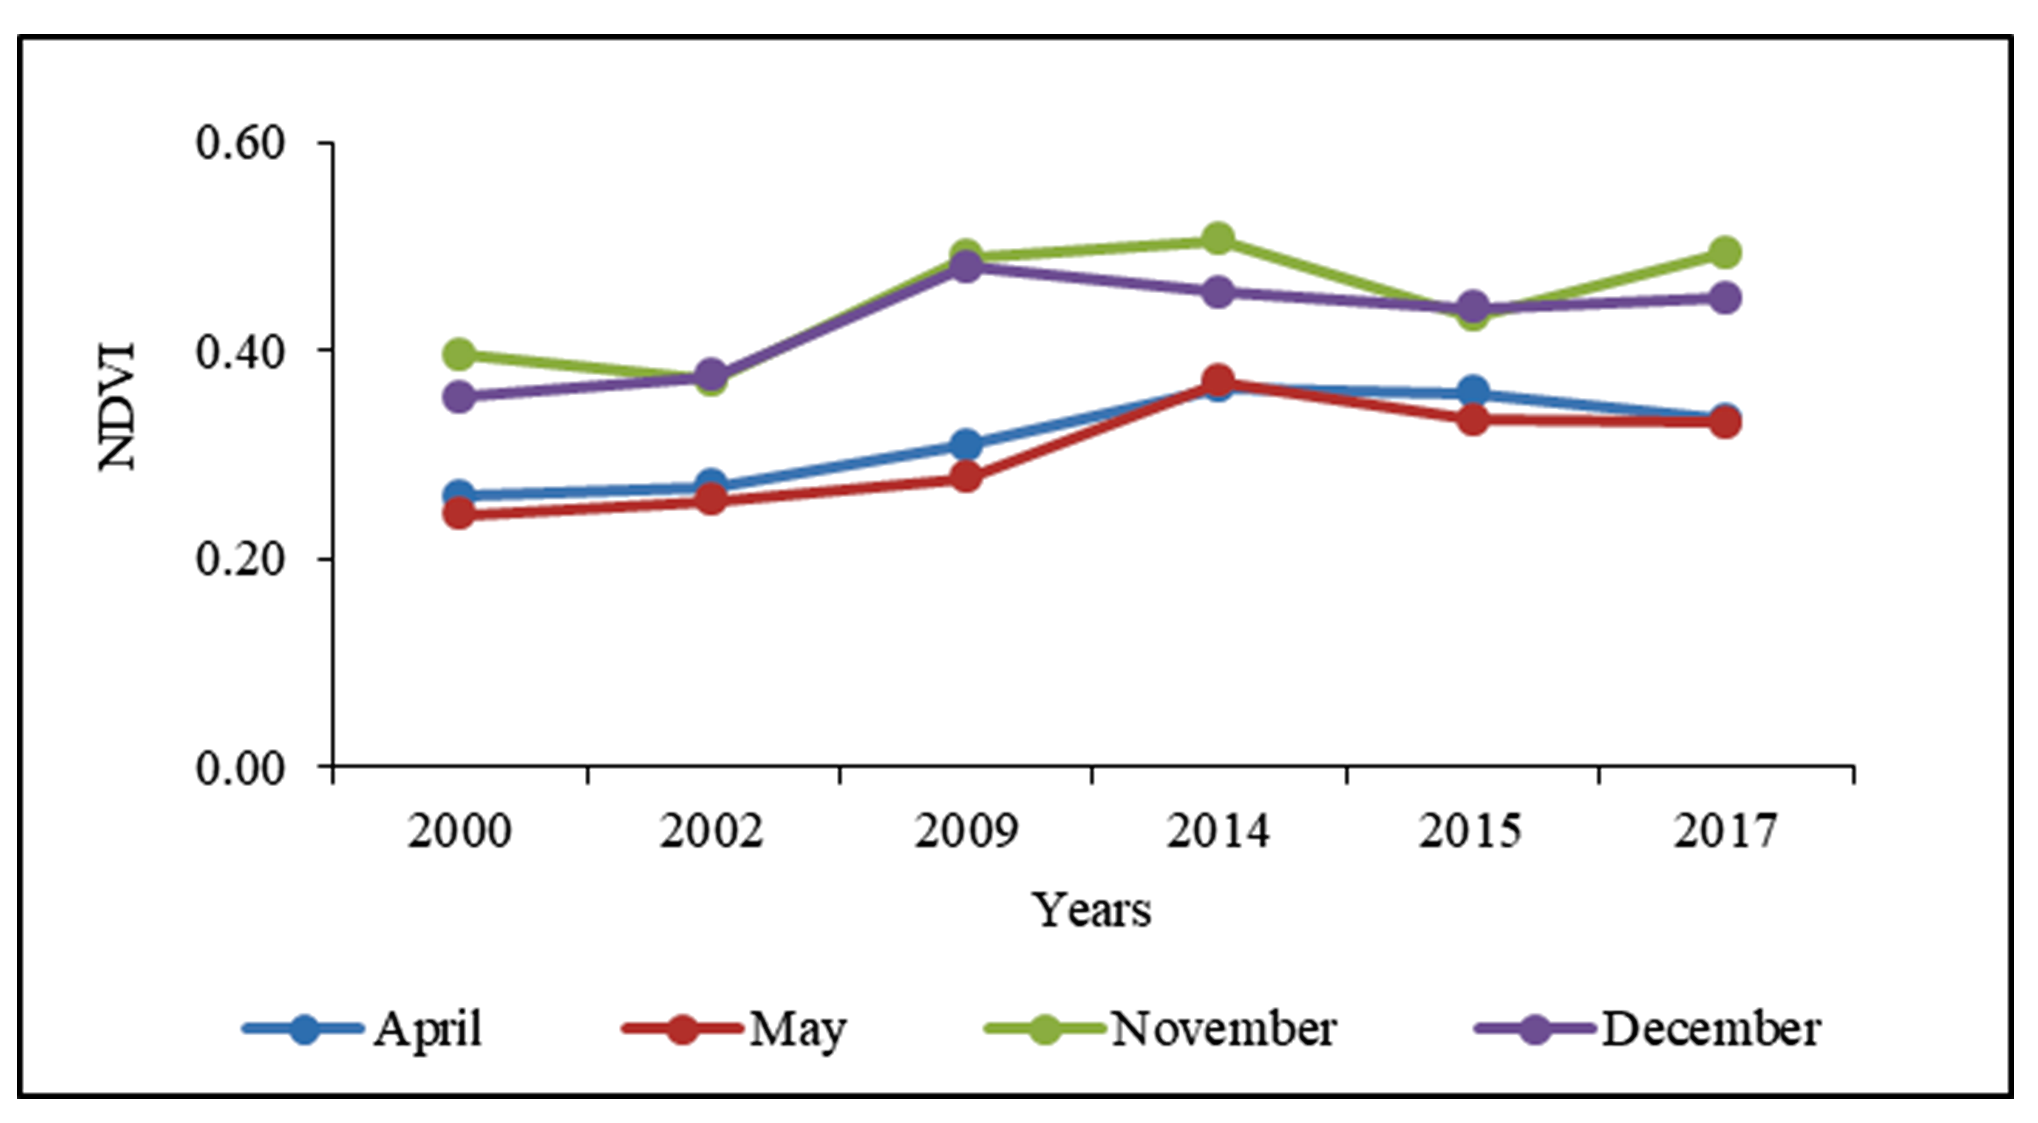
4.1 NDVI and LST
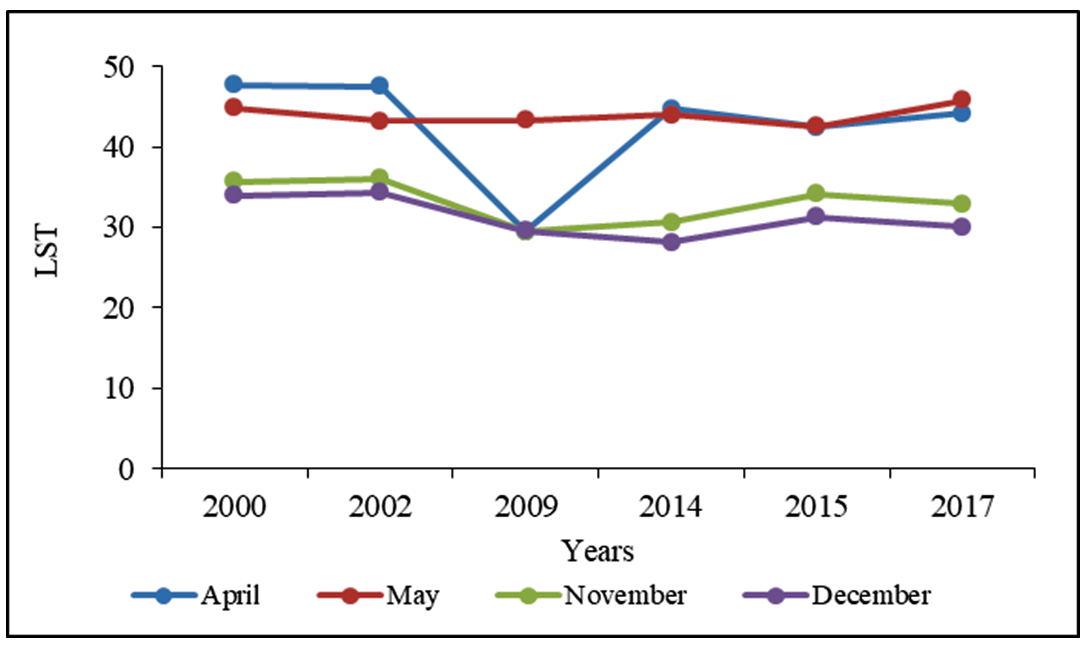
The study area was having different drought condition with change in temperature and vegetation, which was studied with the help of NDVI and LST as basic parameter for deriving the associated parameter. NDVI and LST values for the months of April and May (pre-monsoon) and November and December (post-monsoon) of the low rainfall years (2000, 2002, 2009, 2014, 2015 and 2017) have been plotted (Figure 2 and 3) and inverse proportion to each other. There is a decrease in temperature results into increasing the vegetation with high NDVI values and vice versa. The study shows that the NDVI decreases with increasing atmospheric temperature. This severity of drought is increasing in per-monsoon season (Jan-May) and goes on decreasing from post-monsoon season (November-December). NDVI values are decreasing during the pre-monsoon months of April and May whereas November and December show increasing vegetation density. The change study of these droughts indicates considerable alterations (p < 0.05) between the years of study. The association among NDVI and periodic precipitation was statistically noteworthy. There were substantial variations in NDVI and precipitation values. The maximum NDVI value was detected when the mean periodic precipitation was well scattered and the minimum NDVI value was documented when precipitation was less. Precipitation was less during the years 2000, 2002, 2009, 2014, 2015 and 2017. The lowest NDVI retorted as precipitation altered throughout the dry years, particularly 2000, 2002 and 2009, Higher NDVI values observed for both the seasons in 2014 as compare to other scanty rainfall years (Figure 2).
The higher NDVI values indicate healthy and dense vegetation. To enhance the prediction accuracy, it is necessary to integrate another parameter and hence the present study incorporates LST as a subsequent parameter. LST is between 32.9°C to 40.5°C (Figure 3) but in the year 2009, it has decreased. Dry soil usually has high LST and low NDVI.
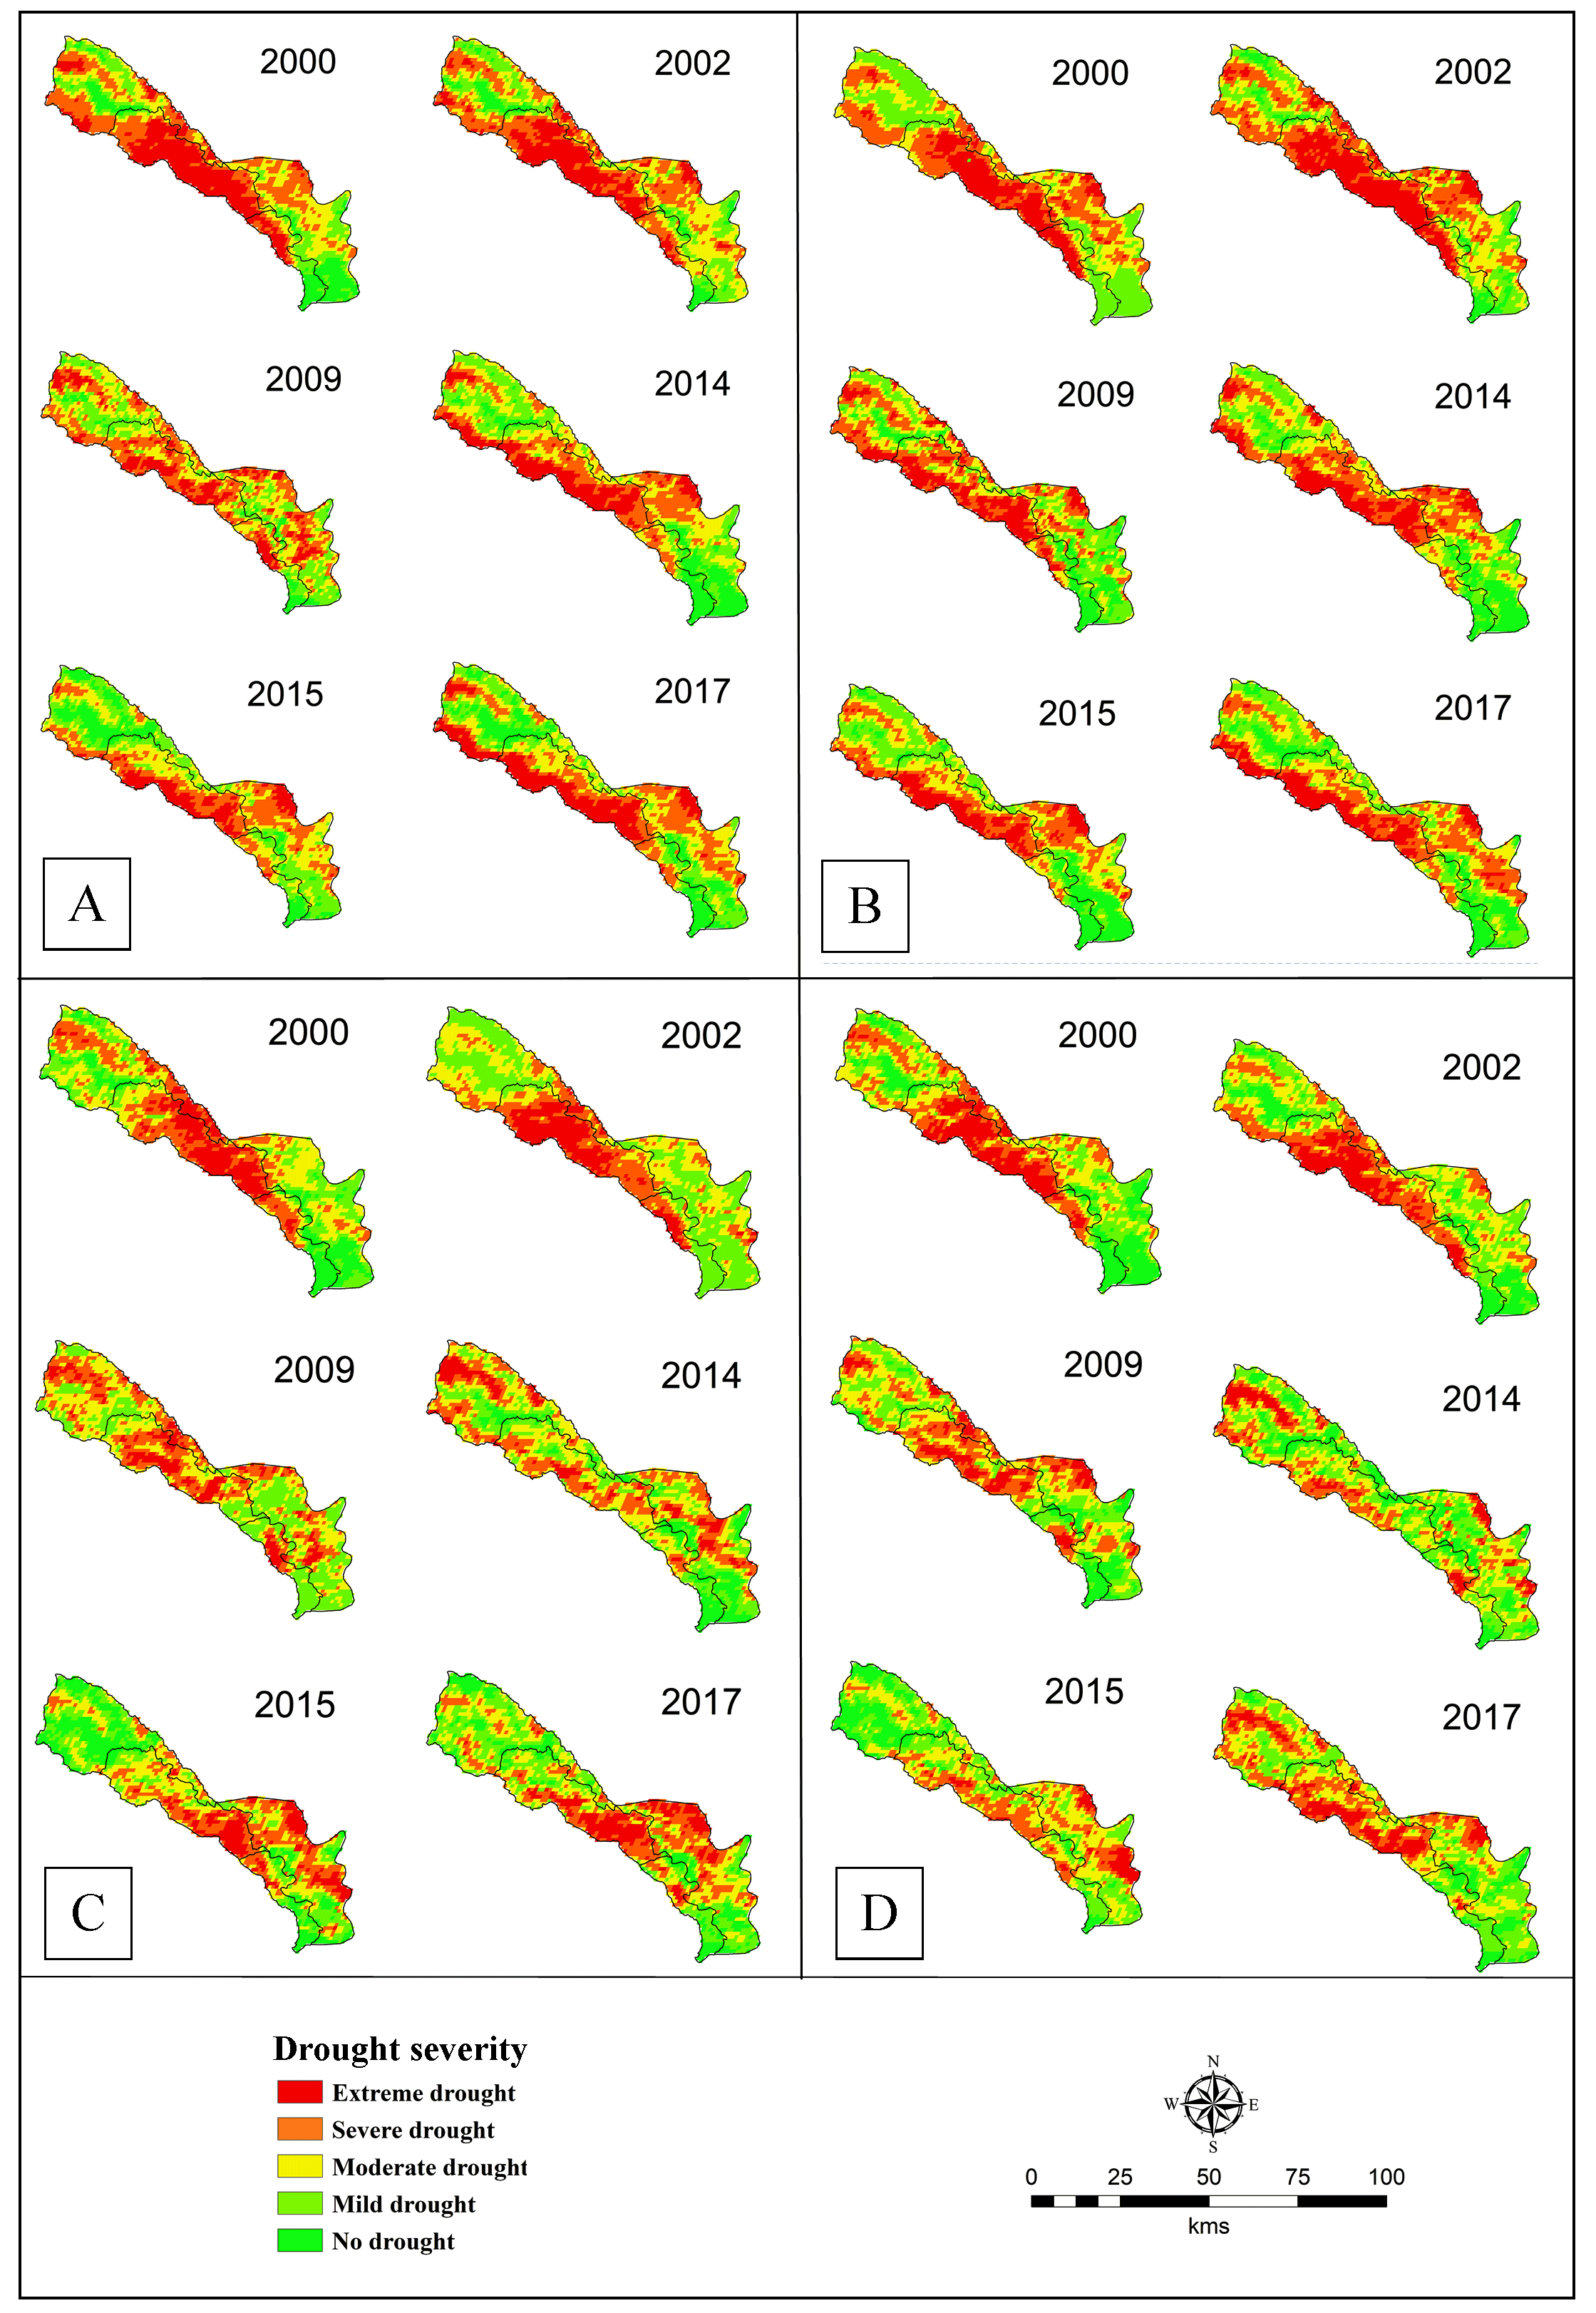
4.2 Vegetation Health Index (VHI)
The Vegetation Health Index (VHI) maps are prepared by combining LST day time temperature and NDVI (Figure 4A, B, C and D). It shows varying severity levels of agricultural drought mostly in the central, western and south western parts of the study area.
The central part of the study area shows severe to extreme drought condition in pre- and post-monsoon seasons for all six years. Upper part of the area having mild to no drought condition in most of the years because this area is in proximity to Western Ghats and hence receives high rainfall. The area under extreme drought category is high in April than May for the years 2000 and 2017.
VHI for the month of April in year 2000, 2002 and 2009, cover 27%, 28% and 29.9% area, respectively under severe drought conditions. Similarly, year 2014, 2015 and 2017 had a moderate drought covering 24.3%, 26.1% and 22.8% areas, respectively. Month of May for all the years under study except 2015 has recorded severe drought conditions covering 29.5%, 28.3%, 24.5%, 25.2% and 25% the total area correspondingly. Two post-monsoon months were November and December show a slight change in drought severity. In the month of November all the years excluding 2017 have recorded moderate drought condition covering the largest areas of 26%, 28%, 31%, 29.5% and 25% while 2017 records mild drought in the area of 28.3%. In December of 2000, 2002, 2009 and 2015 show moderate drought conditions in 23.8%, 25.8%, 28.4% and 30.4% of the total area, respectively. It has come down during 2014 and 2017 to mild drought conditions for 30.6% and 28.5% area, respectively.
Table 2. Distribution of drought severity
|
Years
|
Drought severity
|
Area (%)
|
|
April
|
May
|
November
|
December
|
|
2000
|
Extreme drought
|
24.3
|
19.7
|
14.3
|
16.0
|
|
|
Severe drought
|
27.0
|
29.5
|
24.8
|
22.4
|
|
|
Moderate drought
|
22.2
|
22.4
|
26.3
|
23.8
|
|
|
Mild drought
|
15.7
|
28.4
|
21.8
|
20.5
|
|
|
No drought
|
10.9
|
0.0
|
12.9
|
17.2
|
|
2002
|
Extreme drought
|
21.5
|
25.8
|
14.9
|
13.7
|
|
|
Severe drought
|
28.9
|
28.3
|
20.3
|
23.1
|
|
|
Moderate drought
|
24.4
|
23.0
|
28.5
|
25.8
|
|
|
Mild drought
|
19.2
|
17.2
|
36.2
|
24.2
|
|
|
No drought
|
6.0
|
5.7
|
0.0
|
13.2
|
|
2009
|
Extreme drought
|
15.1
|
19.5
|
12.1
|
11.5
|
|
|
Severe drought
|
29.9
|
24.5
|
26.3
|
24.8
|
|
|
Moderate drought
|
28.6
|
21.7
|
31.1
|
28.4
|
|
|
Mild drought
|
22.7
|
23.4
|
30.5
|
25.2
|
|
|
No drought
|
3.8
|
10.8
|
0.0
|
10.0
|
|
2014
|
Extreme drought
|
16.8
|
16.8
|
8.9
|
8.5
|
|
|
Severe drought
|
24.1
|
25.2
|
25.0
|
17.0
|
|
|
Moderate drought
|
24.3
|
25.1
|
29.5
|
27.5
|
|
|
Mild drought
|
21.5
|
20.2
|
24.1
|
30.6
|
|
|
No drought
|
13.3
|
12.7
|
12.5
|
16.4
|
|
2015
|
Extreme drought
|
11.0
|
13.9
|
11.4
|
5.3
|
|
|
Severe drought
|
24.5
|
24.0
|
21.6
|
20.2
|
|
|
Moderate drought
|
26.1
|
25.2
|
25.6
|
30.4
|
|
|
Mild drought
|
24.9
|
23.5
|
22.7
|
29.2
|
|
|
No drought
|
13.4
|
13.4
|
18.7
|
14.9
|
|
2017
|
Extreme drought
|
19.8
|
15.8
|
12.1
|
12.3
|
|
|
Severe drought
|
22.8
|
25.0
|
21.7
|
22.2
|
|
|
Moderate drought
|
22.8
|
22.3
|
25.5
|
28.0
|
|
|
Mild drought
|
20.3
|
23.4
|
28.3
|
28.5
|
|
|
No drought
|
14.3
|
13.5
|
12.5
|
8.9
|


 ,
Ajaykumar Kadam 2
,
Ajaykumar Kadam 2