Abstract
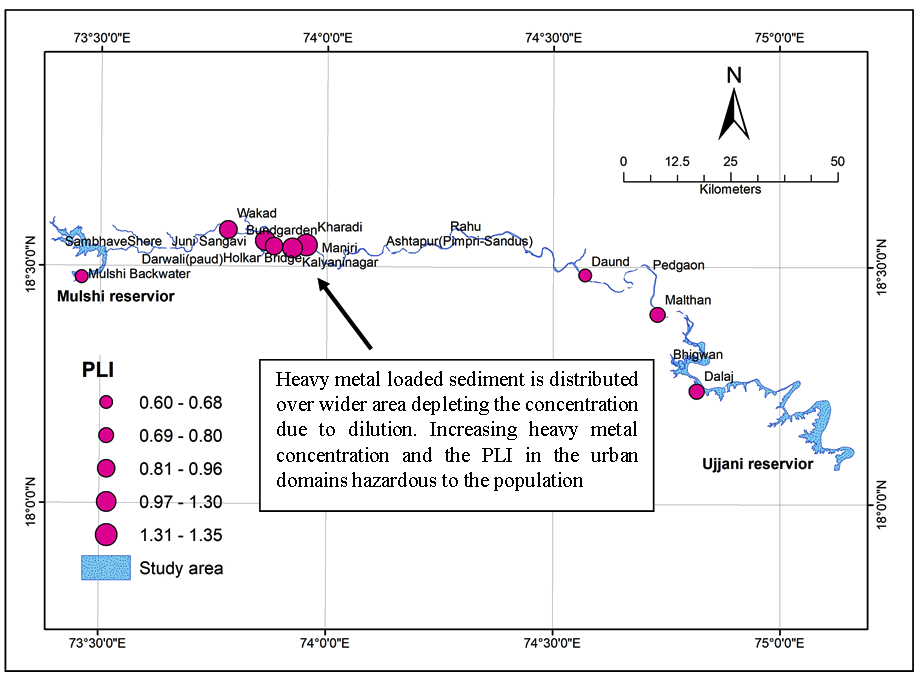
Pre-urban, urban and post-urban stretch of the Mula River in Pune District of Maharashtra (India) is examined for quantification of heavy metals (Cr, Co, Ni, Cu, Zn and Cd), calculation of the Pollution Load Index (PLI) and Contamination Factor (CF). They were estimated from the surface sediments (0-5 cm) at 10 sampling sites along the Mula river. High Cr anomaly (Max. 388.20 ppm) followed by Co (Max. 104.91 ppm), Ni (Max. 167.44 ppm), Cu (Max. 391.35 ppm), Zn (Max. 507.91 ppm) and Cd (Max. 2.38 ppm) is seen at various locations mostly encompassing the urban stretch. PLI is found to be high i.e., >1 in urban sites like Khadki, Kalyaninagar and Kharadi than the rural downstream sites. There is negligible mobility of the heavy metals and the urban floodplains are increasingly accumulating the heavy metals to a highly hazardous level.
1 . INTRODUCTION
Soil heavy metal (HM) contamination is a primary concern and severe disaster in many regions of the world. Studies pertaining to agricultural and urban soil contamination have received special consideration due to addition of heavy metals by both natural and anthropogenic sources (Song et al., 2018; Stevanović et al., 2018). However, the contribution of heavy metals in soils via anthropogenic inputs is much higher than that of natural sources (Adimalla and Wang, 2018; Adimalla, 2019). Heavy metal contamination has escalated due to their addition via industrial effluents, residential wastes, heavy usage of fertilizers and automobile exhaust emissions resulting from rapid expansion of agricultural and industrial development in the world (Song et al., 2018; Zhong et al., 2018; Adimalla, 2019). Heavy metal pollution of the natural environment is a universal problem. The studies of human exposure to heavy metals and the associated health risks have attracted attention of many researchers worldwide because of their potential toxicity (Zhang et al., 2016, 2017). These metals have a propensity to bioaccumulate and biomagnify (Pawar and Pawar, 2016). They are indestructible and most of them have toxic effects on living organisms when exceed in concentrations (Mmolawa et al., 2011). Anthropogenic sources are responsible for the introduction of heavy metals in the rivers. Introduction of metals into the rivers is primarily due to rock weathering, soil erosion, and dissolution of water-soluble salts. Naturally occurring metals (especially the trace metals) move through aquatic environments independent of human activities and usually without any hazardous effects (Garbarino et al., 1995; Opuene et al., 2008). Anthropogenic pollutants are discharged into river water system via industrial, domestic and agricultural wastewater (Cheng et al., 2014; Ho et al., 2001; Priju et al., 2007; Kumar and Pawar, 2011). Plants absorb heavy metals through soil which enter the food chain and become hazardous for living organisms (Biswal et al., 1998).
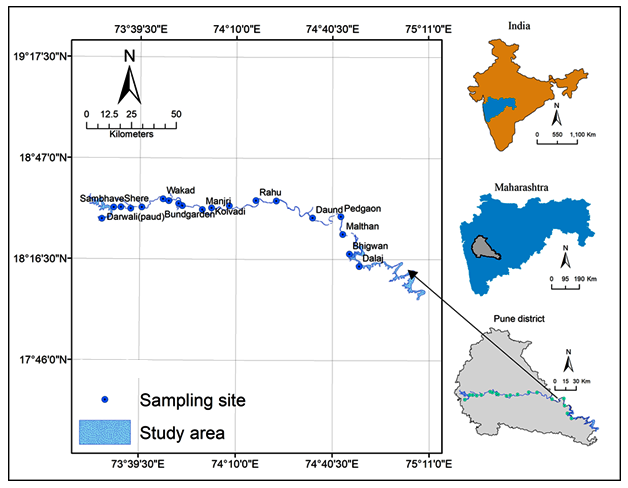
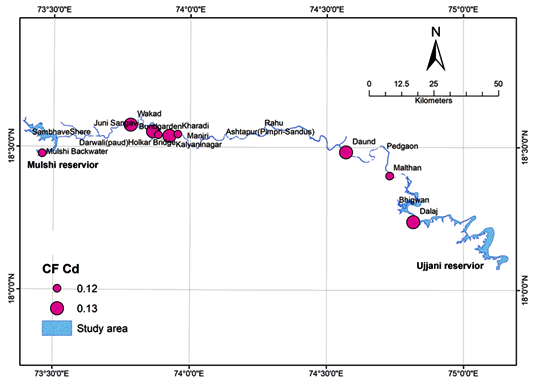
Sediments serve as sinks for most of the metals in aqueous phase (Klavins et al., 1995). The concentrations of heavy metals in soils and sediments vary with the rate of particle sedimentation, the rate of heavy metals deposition, particle size and the presence or absence of organic matter in the soils (Saloman et al., 1987). The urban and industrial areas are the sources of anthropogenic heavy metals and the rivers flowing from such areas often transport the heavy metal load downstream. These heavy metals are recycled during flooding and are re-deposited down streams. With this objective we attempted to examine the trend in heavy metal concentration in the flood plains of Mula River flowing rural upstream, urban and industrial area of Pune City and down streams (Figure 1).
Numerous ways can be adopted in order to assess the contamination of metals in sediments. Some of the most familiar ones are the index of geo-accumulation (I-geo) and Pollution Load Index (PLI). Contamination Factor (CF) has also been used to quantify pollution in the freshwater sediments (Singh et al., 1997). PLI represents the number of times by which the heavy metals concentrations in the sediment exceeds the background concentration, and give a collective estimate of the overall level of heavy metal toxicity in a particular sample (Priju et al., 2006). PLI is thus a speedy tool used to compare the pollution status of sediments (Adebowale et al., 2009). Although there is large amount of work done on contamination of sediments and soils by metals from various areas there is not much literature available in many parts of India. Therefore an attempt is made to study Pune Municipal Region, Maharashtra state from the heavy metal enrichment point of view. The main objective of this study was i) to assess the background levels of heavy metals in the soils and ii) to evaluate soil contamination if any using indices like CF and PLI. In order to achieve this objective surface elements were collected at 10 different sites along the banks of Mula River (Figure 3 a-f) and analyzed for 6 heavy metals (Cr, Co, Ni, Cu, Zn and Cd) concentration using Green shale (USGS) reference standards by X-ray fluorescence spectrometry (XRF).
2 . STUDY AREA
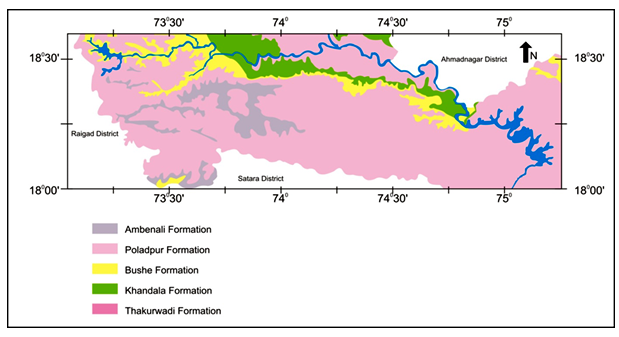
Pune metropolis is situated on the confluence of Mula and Mutha rivers and their tributaries, Pavana and Indrayani (Figure 1) traversing through the north-western outskirts of the urban area. Geologically the area is characterized by simple as well as compound type lava flows. Based on lithological characteristics the flows from the study area have been classified by GSI (2001) into different units (Table 1; Figure 2). Chemo-stratigraphically the study area is characterized by Poladpur, Bhushe, Khandala and Thakurwadi formations (Cox et al., 1985; Beane et al., 1986). Poladpur formation is exposed to south of the study area along the Pune-Saswad road in the Dive Ghat. Ujjani reservoir falls in this formation. It bears fine to medium grained basalts typically bearing small phenocrysts of plagioclase and augite, or plagioclase, augite and occassionally olivine. Majority of the study area is covered by the Bhushe Formation which is mainly exposed in the central part of the study area. Sampling locations Mulshi, Wakad, Khadki, Sangamwadi, Kalyaninagar lie in this Bhushe formation. It comprises of coarse grained, altered and amygdaloidal, aphyric or sparsely plagioclase phyric, compound lava flows. Flows are simple with vesicular, oxidized tops. They are fine to medium-grained basalts with small phenocrysts of plagioclase, augite and olivine. Basaltic flows of the Khandala formation comprises essentially of simple flows generally columnar joints. It is encountered towards the east of the study area covering like Kharadi, Wagholi, Loni etc. Thakurwadi formation forms the youngest geological formation in the study area exposed in the NW region of the study area it consists of a thick sequence of coarse grained amygdaloidal, aphyric compound flows with well-developed lava flows and appears to be highly altered. Alluvial deposits are seen all along the valley portion and are of varying thicknesses.
Inorganic chemistry plays a pivotal role in geology. The composition of rocks and minerals is vital in deciphering the chemical eminence of groundwater in general and heavy metals in particular. Since, the groundwater shows chemical interactions with the host rock to a considerable extent (Aravindan and Manivel, 2004). In view of this, information on chemostraigraphic classification of lava flows is imperative.
Table 1. Lithostratigraphic scheme proposed for western Maharashtra, GSI (2001)
|
Group
|
Sub-groups
|
Formations
|
Thickness (m)
|
|
North Sahyadri
Group
|
Mahabaleshwar
|
Mahabaleshwar
|
400
|
|
Dive Ghat
|
Purandargarh Formation
|
525
|
|
Diveghat Formation
|
375
|
|
Lonavala
|
Karla Formation
|
450
|
|
Indrayani Formation
|
250
|
|
Kalsubai
|
Upper Ratangarh Formation
|
600
|
|
Lower Ratangarh Formation
|
450
|
|
Salher Formation (Base not seen)
|
+350
|
3 . MATERIALS AND METHODS
1.1 Sampling
In the present study, amalgamation of both congenital as well as modern techniques for collection, analyses, processing and editing of geochemical data sets have been adopted for soil sampling and analytical techniques as well as using GIS tools. Total 10 soil samples were collected along the banks of Mula River from various locations. After removal of organic debris, trash, pebbles and stones, each soil sample was packed in self-locking polythene bags and were sealed in double bags to prevent cross contamination. Use of metal tool was strictly avoided and instead of a plastic spatula was used for sample collection.
Collected soil samples were dried for two days at 60oC until residual moisture was completely removed; these were then pulverized into a fine powder using US Standard in wooded mortar. Samples were further subjected to sieve analysis using a sieve of #240 mesh, 4 grams of the sieved samples was further subjected to XRF analysis (Table 2) for the determination of heavy metals in these soil. The samples were subjected to analysis on a SpectroXepos-EDXRF Model No. S/N-spectro-07004382 make XRF which is fully automatic, microprocessor controlled equipment with X-ray generator (detection limit 0.5 ppm). A palladium anode is used in the x-ray tube, reference materials, such as green shale issued by US Geological Survey were run along with the samples during the course of analysis.
Table 2. XRF analysis
|
Location
|
Cr
|
Co
|
Ni
|
Cu
|
Zn
|
Cd
|
|
(ppm)
|
(ppm)
|
(ppm)
|
(ppm)
|
(ppm)
|
(ppm)
|
|
Mulshi
|
244.92
|
3.18
|
167.44
|
302.82
|
165.22
|
2.12
|
|
Wakad
|
263.69
|
88.43
|
138.11
|
198.51
|
129.34
|
2.28
|
|
Khadki
|
323.30
|
104.91
|
142.70
|
364.34
|
347.88
|
2.32
|
|
Sangamwadi
|
263.82
|
78.33
|
145.40
|
238.04
|
154.47
|
2.18
|
|
Kalyaninagar
|
352.41
|
62.15
|
138.19
|
386.69
|
507.91
|
2.37
|
|
Kharadi
|
388.20
|
95.35
|
135.00
|
391.35
|
435.51
|
2.10
|
|
Manjari
|
175.19
|
86.06
|
113.93
|
185.04
|
119.33
|
0.74
|
|
Daund
|
129.73
|
67.12
|
100.74
|
133.53
|
105.73
|
2.38
|
|
Malthan
|
206.55
|
76.09
|
105.46
|
173.47
|
129.47
|
2.18
|
|
Ujjani
|
107.47
|
79.40
|
84.80
|
230.32
|
133.07
|
2.35
|
|
Mean
|
245.53
|
74.10
|
127.18
|
260.41
|
222.79
|
2.10
|
1.2 Assessment of Metal Contamination
1.2.1 Contamination Factor (CF)
The contamination factor and degree of contamination are used to determine the contamination grade of the sediment in the present study. Contamination factor is calculated and considered as background concentration. CF < 1: low contamination factor; 1 ≤ CF < 3: moderate contamination factor; 3 = CF < 6: considerable contamination factor; CF = 6: very high contamination factor.
Contamination factor (CF) is calculated (equation (1)) according to Thomilson et al. (1980) as:
\(CF = {C_{ms} \over C_{mc}}\) (1)
\(C_{ms}\) = metal concentration in a sample
\(C_{mc}\) = metal concentration in control sample
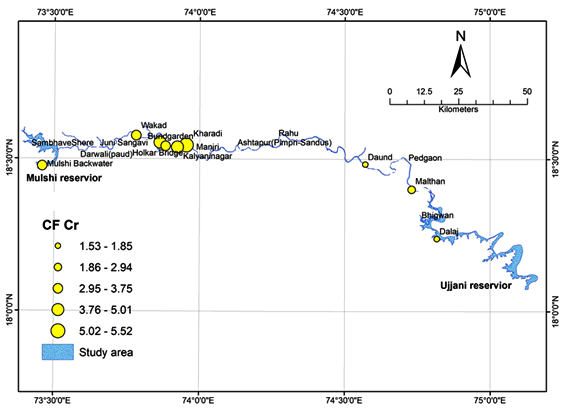
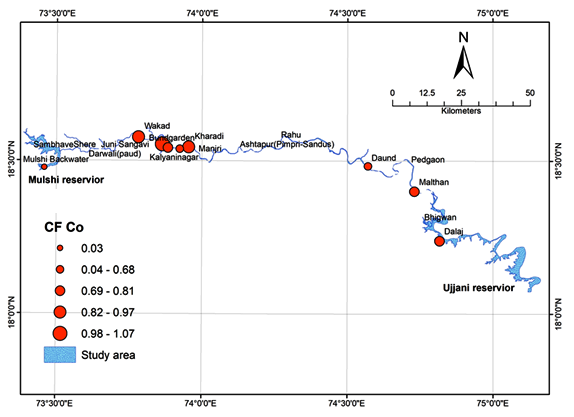
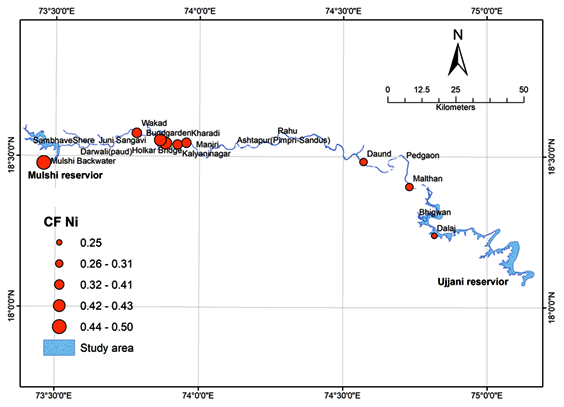
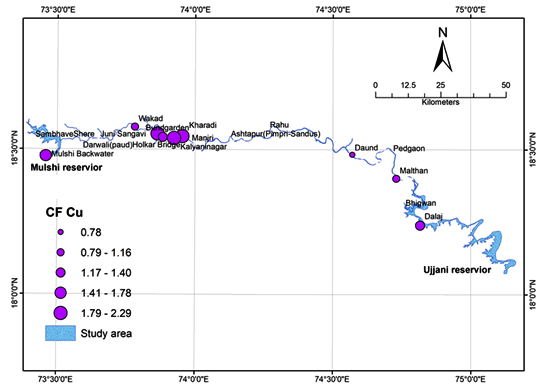
CFs for various metals were calculated (equation (1)) (table 3). Contamination Factor of samples collected in the urban sector like Khadki (4.60), Sangamwadi (3.75), Kalyaninagar (5.01) and Kharadi (5.52) indicate considerable contamination, whereas the downstream post urban stretches like Manjari (2.49), Daund (1.85), Malthan (2.94) and Ujjani (1.53) are moderately or less contaminated. CF of Co shows low contamination at all locations, except Khadki which indicates moderate contamination of 1.07. Ni exhibits low contamination. Cu indicates moderate contamination at all localities ranging from 1.02 to 2.29, except Daund which has lowest contamination of 0.78.
Table 3. Contamination Factor (CF) and Pollution Load Index (PLI)
|
Location
|
CF Cr
|
CF Co
|
CF Ni
|
CF Cu
|
CF Zn
|
CF Cd
|
Multiplication of all CF
|
PLI
|
|
Mulshi
|
3.48
|
0.03
|
0.50
|
1.78
|
3.90
|
0.12
|
0.05
|
0.60
|
|
Wakad
|
3.75
|
0.90
|
0.41
|
1.16
|
3.05
|
0.13
|
0.63
|
0.93
|
|
Khadki
|
4.60
|
1.07
|
0.42
|
2.14
|
8.21
|
0.13
|
4.74
|
1.30
|
|
Sangamwadi
|
3.75
|
0.80
|
0.43
|
1.40
|
3.64
|
0.12
|
0.80
|
0.96
|
|
Kalyaninagar
|
5.01
|
0.63
|
0.41
|
2.27
|
11.98
|
0.13
|
4.70
|
1.29
|
|
Kharadi
|
5.52
|
0.97
|
0.40
|
2.29
|
10.27
|
0.12
|
5.96
|
1.35
|
|
Manjari
|
2.49
|
0.88
|
0.34
|
1.08
|
2.82
|
0.04
|
0.09
|
0.67
|
|
Daund
|
1.85
|
0.68
|
0.30
|
0.78
|
2.49
|
0.13
|
0.10
|
0.68
|
|
Malthan
|
2.94
|
0.77
|
0.31
|
1.02
|
3.05
|
0.12
|
0.27
|
0.80
|
|
Ujjani
|
1.53
|
0.81
|
0.25
|
1.35
|
3.14
|
0.13
|
0.17
|
0.75
|
|
|
|
|
|
|
|
Standard Deviation
|
0.28
|
|
|
|
|
|
|
|
Standard Error
|
0.09
|
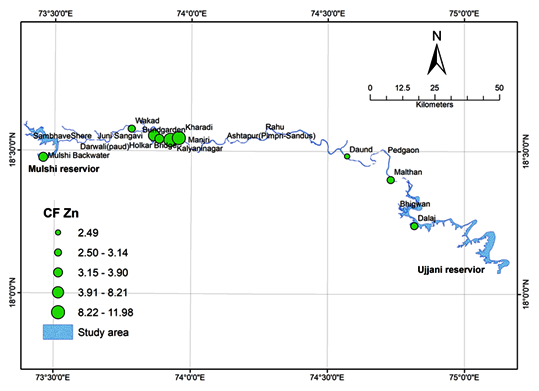
CF of Zn indicates considerable values at Mulshi (3.90), Wakad (3.05), Sangamwadi (3.64), Malthan (3.05) and Ujjani (3.14) indicate a considerable contamination; whereas Khadki (8.21), Kalyaninagar (11.98) and Kharadi (10.27) indicate very high contamination CF of Cd for all sites from Mulshi to Ujjani fall under low contamination ranging from 0.04 to 0.13.
1.2.2 Pollution Load Index (PLI)
PLI is obtained as CF, this CF is the quotient obtained by dividing the concentration of each metal with its control value. The PLI of the place are calculated by obtaining the n-root from the n-CFs that was obtained for all the metals. Generally, PLI (equation (2)) as Tomlinson et al., (1980) as:
\(PLI= \sqrt[n]{CF_1 \times CF_2 \times CF_3 \dots \times CF_n}\) (2)
where,
CF = contamination factor, n = number of metals
The PLI value of > 1 is polluted, whereas <1 indicates no pollution (Harikumar et al., 2009).
In order to effectively measure of degree of overall contamination, the PLI was calculated using equation (2), for each sample as presented in table 3. Mulshi, Wakad, Sangamwadi, Manjari, Daund, Malthan and Ujjani were comparatively unpolluted with Contamination Factor < 1whereas the sites in the urban stretch viz Khadki (1.30), Kalyaninagar (1.29) and Kharadi (1.35) are polluted and the pollution can be attributed to anthropogenic influences and or the unscientific disposal of non-treated industrial waste discharged and agricultural runoff into the river .
4 . RESULTS AND DISCUSSIONS
A study of the soil quality indicates that most of the toxic elements accumulation depending upon pollution status of sampling location. The results show that concentrations of heavy metals are more in urban areas like Khadki, Kalyaninagar and Kharadi, as compared to rural area in the source and sink regions namely Mulshi, Daund, Malthan and Ujjani. In urban areas anthropogenic impact is more evident due to discharge of industrial effluent and disposal of municipal waste. Soils were assessed using Cr, Co, Ni, Cu, Zn and Cd. The CF were observed generally indicates low, moderate in pre urban stretches and considerable to very high contamination by heavy metals in the urban and occasionally post urban regions. The mean heavy metal concentrations (in ppm) of 10 soils the samples along the bank of Mula River using XRF analysis is presented (Table 2) as 245.53 for Cr, 74.10 for Co, 127.187 for Ni, 260.41 for Cu, 222.803 for Zn and 2.10 for Cd. Amongst these the mean concentration of Cu is more and Cd is least. Figure 3 (a-f) presents the GIS plots of the elemental concentration variation at each location.


 ,
Ashok Issac 1
,
Ashok Issac 1