1 . INTRODUCTION
Groundwater is the primary source for drinking, domestic, industrial and agricultural purposes in different parts of the world (Fienen and Arshad, 2016; Wagh et al., 2016). Groundwater is widely used for drinking purposes in numerous urban areas (Altchenko et al., 2011; Lapworth et al., 2017). Rapid population growth, irrigation expansion, and increasing industrialization have prompted an increasing demand for groundwater. In recent decades, there is a rapid expansion of the urban areas, improper waste disposal from domestic and industrial areas. Many cities have no well-developed sewer and drainage systems (Kazi et al., 2009). These expansions and increasing demands are resulting in depletion and contamination of the resources. According to Farooq and Ustad, (2015) groundwater pollution has been increasing rapidly in many parts of the world, due to industrial effluents, agricultural fertilizers, municipal wastewater, landfill, and animal waste. Mohanakavitha et al. (2019a, 2019b) stated that the discharge of untreated wastewater and leachate from waste disposal site is contaminating groundwater in south India. Anthropogenic activities are causing degradation of groundwater quality and limiting the availability of freshwater resources.
Groundwater is extremely used for drinking water supply in the Main Ethiopian rift (Reimann et al., 2003). Many research studies (UNDP, 1973; Chernet, 1982; Wood and Talling, 1988; Halcrow, 1989; Gizaw, 1996, 2002; Kebede et al., 2005; Berhanu, 2007; Ayenew et al., 2008; Ayenew, 2008; Kebede et al., 2008; Demlie and Wohnlich, 2006; Demlie et al., 2007a, 2007b, 2008; Yitbarek et al., 2012; Amanial, 2015; Kawo and Shankar, 2018) reported on the groundwater chemistry in the Ethiopian rift. These finding reported that the chemical composition of groundwater in highland and rift valley aquifers are different. Many researchers have already reported high F- concentrations in the groundwater from rift valley (Ayenew, 2005; Tekle-Haimanot et al., 2006; Reimann et al., 2003; Rango et al., 2010; Furi et al., 2011; Haji et al., 2018). Mica-based volcanic aquifers; pyroxene and amphiboles are sources of fluoride in the rift valley groundwater (Furi et al., 2011). Further, liquid waste discharges from cities found in the rift valley are polluting groundwater. Taye (1988) reported that pollution of groundwater in the Dire Dawa groundwater basin. Tamiru (2004) studies status and groundwater vulnerability in Addis Ababa and reported that pollution of groundwater due to untreated waste discharge to rivers. Water quality studies conducted in the East Shewa Zone reported that pollution of groundwater. For instance, Haile Gashaw, (1999) stated that high TDS and fluoride concentration in the lake Ziway area. Dinka, (2015) studies the hydrochemical properties of different surface water bodies and groundwater available at Matahara region and reported that variations of chemical parameters in different water sources. Dinka, (2017) also stated pollution of groundwater by anthropogenic activities in Matahara region. Eliku and Suleiman, (2015) studied physicochemical and bacteriological parameters in Adama town and reported that water quality degradation due to inadequate sanitation and hygienic practices.
Worldwide, a number of hydrogeochemical studies have been conducted to identify geochemical processes and evolution of groundwater quality (Aravindan et al., 2008, 2011; Rango et al., 2010; Aravindan and Shankar, 2011a, 2011b; Kumar and Balamurugan, 2018; Wagh et al., 2018; Narsimha and Rajitha, 2018). The IDW interpolation method of a geographical information system (GIS) is widely used to map groundwater quality. GIS-based research is the best idea to observe the evolutionary tendency of water quality that keeps changing from time to time. This modern approach allows environment executives and decision-makers in the process of precise monitoring and rapid decision-making, tremendously. Spatial variation of groundwater quality is controlled by geology and anthropogenic activities within a groundwater basin (Subramani et al., 2005; Aravindan et al., 2010; Aravindan and Shankar, 2011a; Shankar et al., 2010, 2011, 2011a, 2011b; Venkateswaran et al., 2012; Li et al., 2016; Mahlknecht et al., 2017; Wu et al., 2017; Kawo and Shankar, 2018). Further, water quality index (WQI) has been widely used to evaluate the suitability of groundwater for domestic purposes (Rabeiy, 2017). Details of WQI were presented in Babiker et al. (2006), Gebrehiwot et al. (2011), Singh and Khan (2011), Selvam et al. (2013), Boateng et al. (2016), Jhariya et al. (2017), Keraga et al. (2017), Wagh et al. (2017), Ramya Priya and Elango (2018), Kawo and Shankar (2018) and Lad et al. (2018).
In this study, major cations and anions were analyzed and IDW interpolation in GIS was used to produce spatial variation map. In addition, spatial variation map of the Water Quality Index and suitability of groundwater for irrigation purposes were analyzed.
5 . RESULTS AND DISCUSSIONS
The descriptive statistics and WHO-Ethiopian standard limits for determined cations and anions were presented in Table 1. The pH values range from 7.3 to 8.4, with a mean value of 8.0. EC and TDS values range from 220.7 to 869.1 μS/cm and 141.2 to 556.2 mg/L, with mean values of 532.1 μS/cm and 340.6 mg/L, respectively. Ca2+ and Mg2+ ranges from 11 to 116 and 2.4 to 52.3 mg/L, with average values of 50.9 and 12.9 mg/L, respectively. Na+ and K+ ranges from 57 to 214 mg/L and 5.9 to 31.5 mg/L, with mean values of 101.6 and 14.7 mg/L, respectively. Major anion concentrations in the study area ranges from 7.9 to 263.9 mg/L for Cl−, from 0.8 to 496.1 mg/L for SO42−, from 256.2 to 349.6 mg/L for HCO32− and from 0.88 to 1.5 for F−.
Table 1. Statistical details and WHO-Ethiopian standard limits for determined hydrochemical parameters
|
Hydrochemical Parameters
|
WHO
2011
|
Ethiopian limit
|
|
Ions
|
Minimum
|
Maximum
|
Average
|
|
pH
|
7.3
|
8.4
|
8.0
|
6.5-8.5
|
6.5-8.5
|
|
EC (µS/cm)
|
220.7
|
869.1
|
532.1
|
1000
|
-
|
|
TDS (mg/L)
|
141.2
|
556.2
|
340.6
|
500
|
1776
|
|
Ca2+ (mg/L)
|
11.0
|
116.0
|
50.9
|
75
|
200
|
|
Mg2+ (mg/L)
|
2.4
|
52.3
|
12.9
|
50
|
150
|
|
Na+ (mg/L)
|
57.0
|
214.0
|
101.6
|
200
|
358
|
|
K+ (mg/L)
|
5.9
|
31.5
|
14.7
|
-
|
-
|
|
Cl− (mg/L)
|
7.9
|
263.9
|
50.5
|
250
|
533
|
|
HCO32− (mg/L)
|
256.2
|
349.6
|
283.5
|
200
|
-
|
|
SO42− (mg/L)
|
0.8
|
496.1
|
83.5
|
200
|
483
|
|
F- (mg/L)
|
0.88
|
1.5
|
0.95
|
1.5
|
3
|
5.1 Physical Characteristics of Ground Water (pH, Conductivity, TDS)
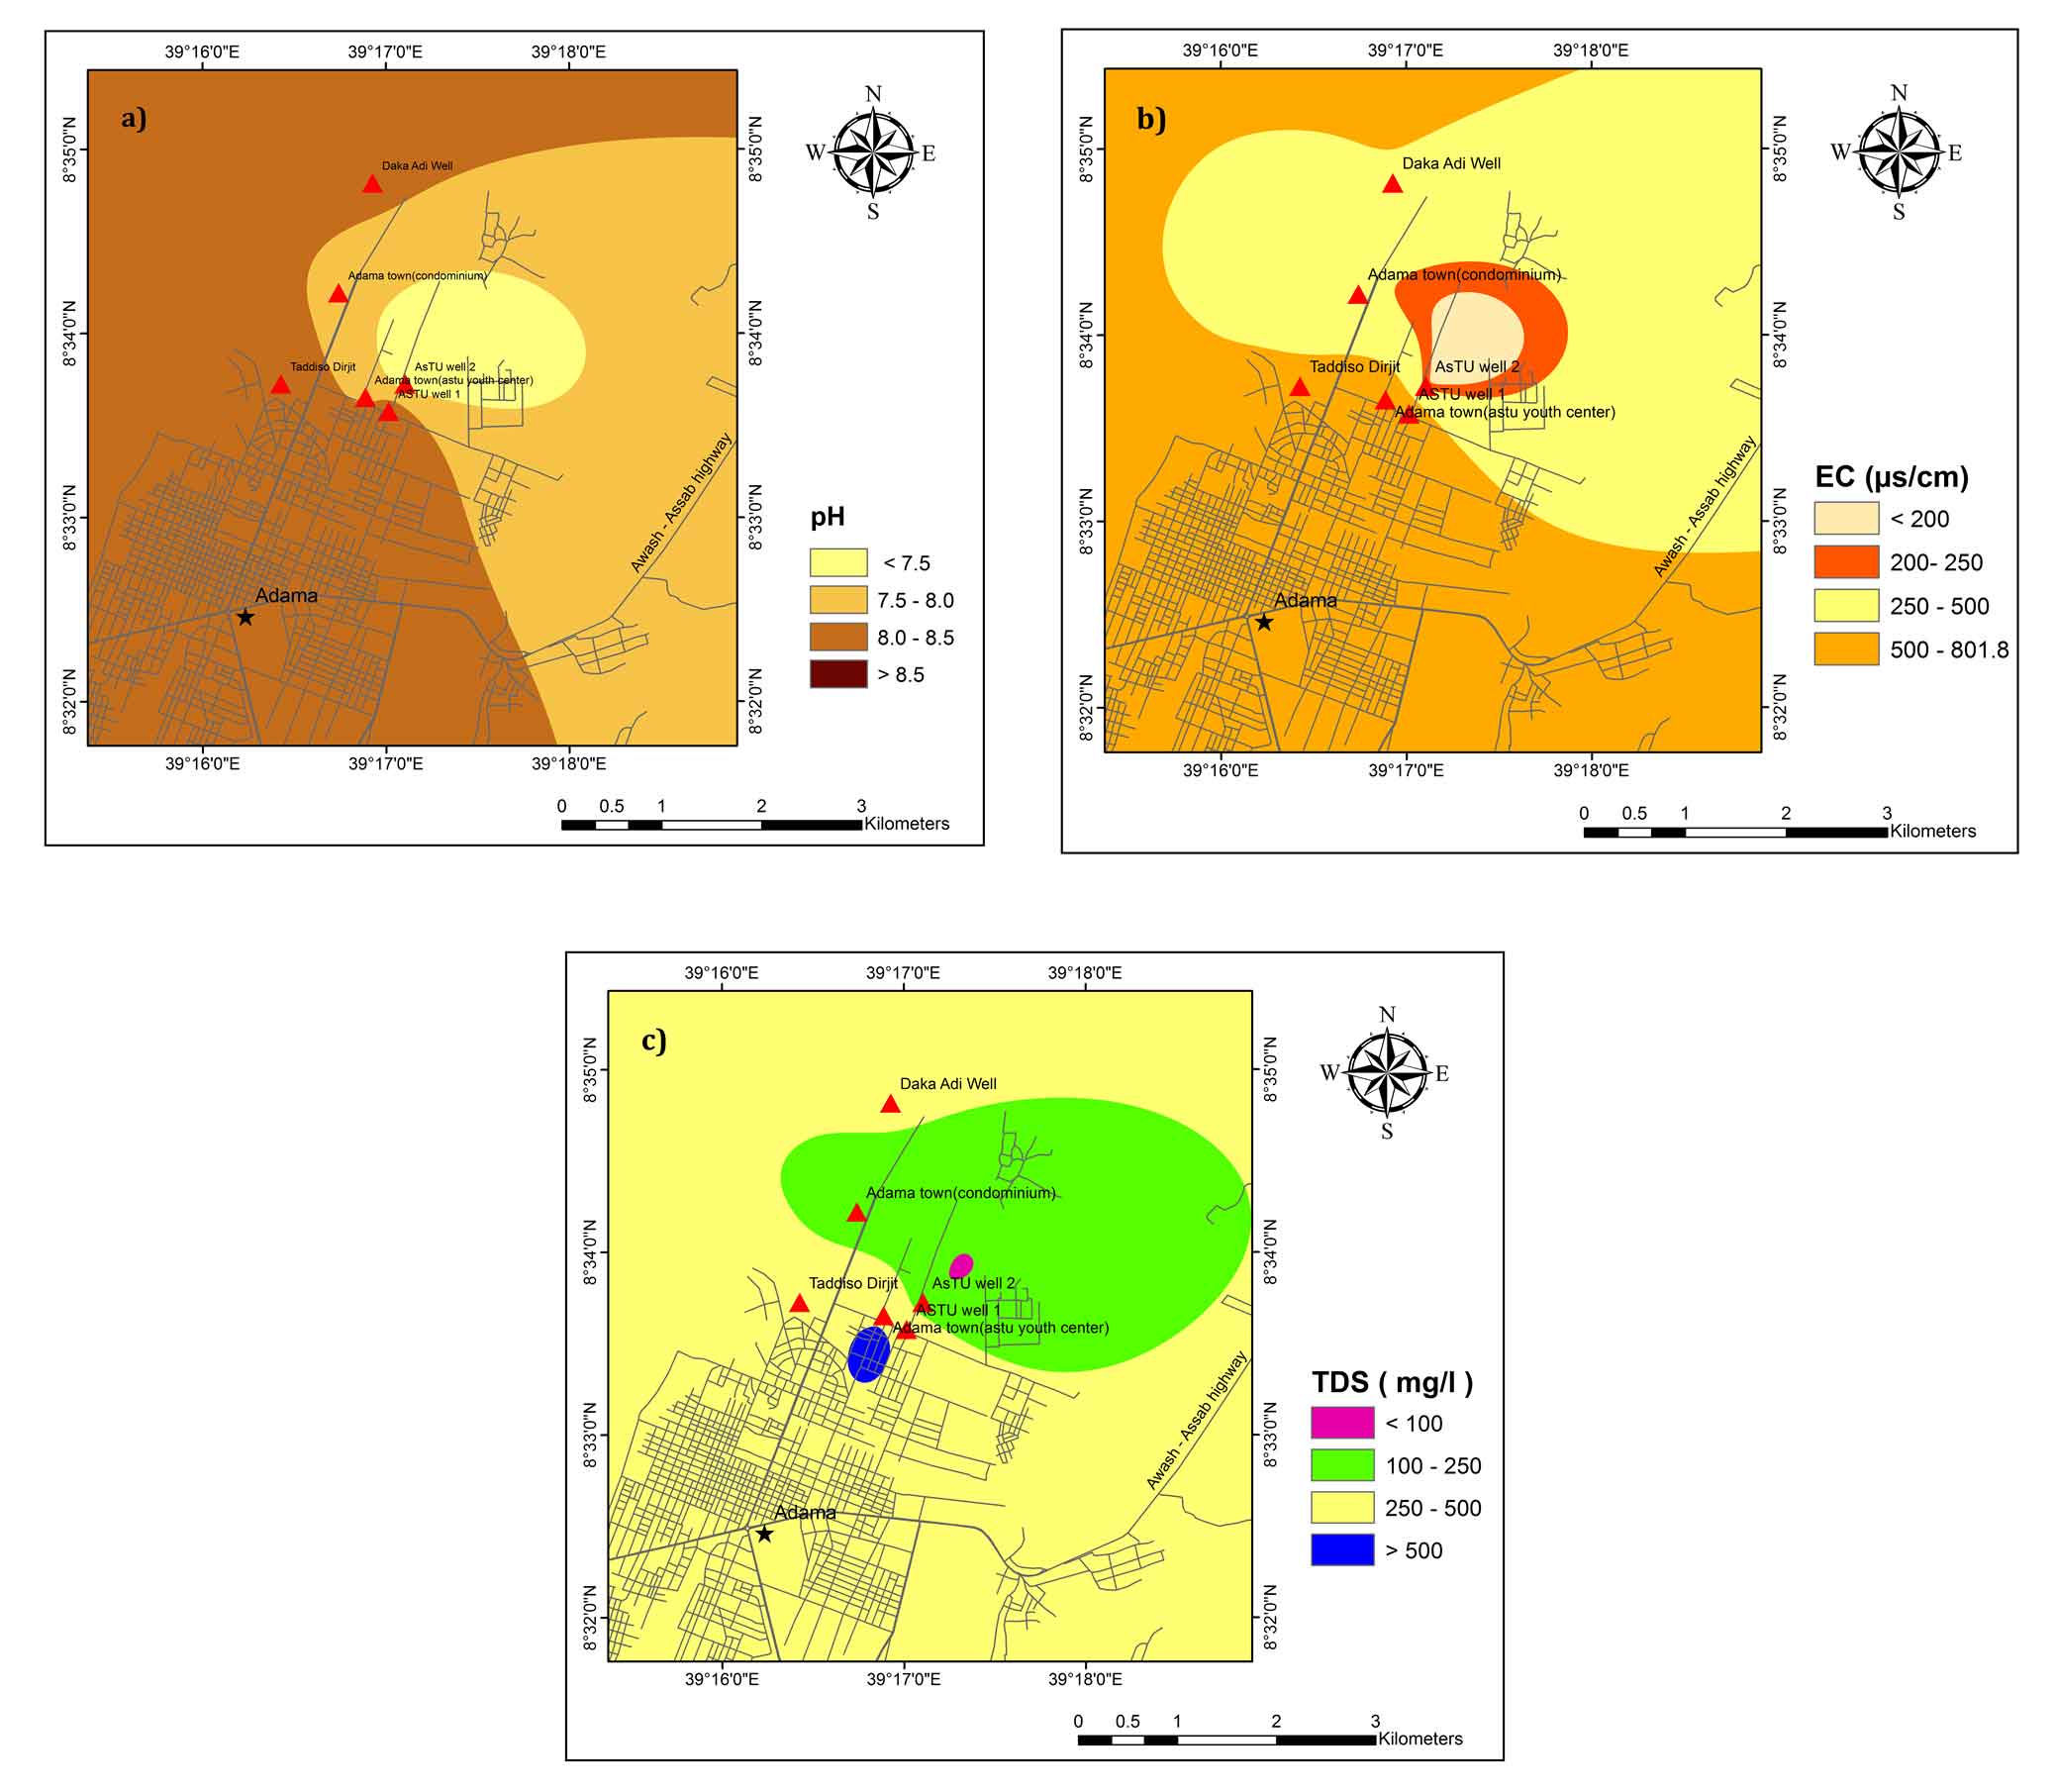
pH value shows that the groundwater of the study area is mainly alkaline in nature. Figure 2(a) shows an interpolated spatial variation map of pH of the groundwater. The lowest pH is recognized in ASTU Well 2 and the highest pH is observed in the central part of Taddiso Dirjit and ASTU Well 1. According to WHO (2011) standards, the pH of the water should between 6.5 and 8.5 (Table 1). The study area is dominated by the alkaline water due to the presence of alkalies in carbonate ions present (Davis, 1966). If pH < 8.2, it is a measure of bicarbonate ions. Groundwater in the rift valley has high pH values due to Na- rich igneous rock aquifer (Kawo and Shankar, 2018; Haji et al., 2018). The spatial variation map (Figure 2(b)) of EC values indicates that the Southwestern part of Adama town has a high EC concentration. As per WHO (2011), the allowable limit for EC is 1000 µs/cm and all groundwater samples are found to be within the drinking limits.
The source of high EC values in the study area might be agricultural activities and wastewater discharged from industries and cities (Amanial, 2015). Figure 2(c) shows the spatial variation map of TDS. The larger part of the study area has a TDS value of less than 500 mg/L and falls in the freshwater group except small areas found in the central part (BH4 kebele 03). BH4 kebele 03 shows brackish water type. Higher content of TDS is from the weathered media of the rock and longer residence time of groundwater in the aquifer (Rango et al., 2013; Mechal et al., 2017).
5.2 Chemical Characteristics of Ground Water
5.2.1 Major Cations
Calcium (Ca2+)
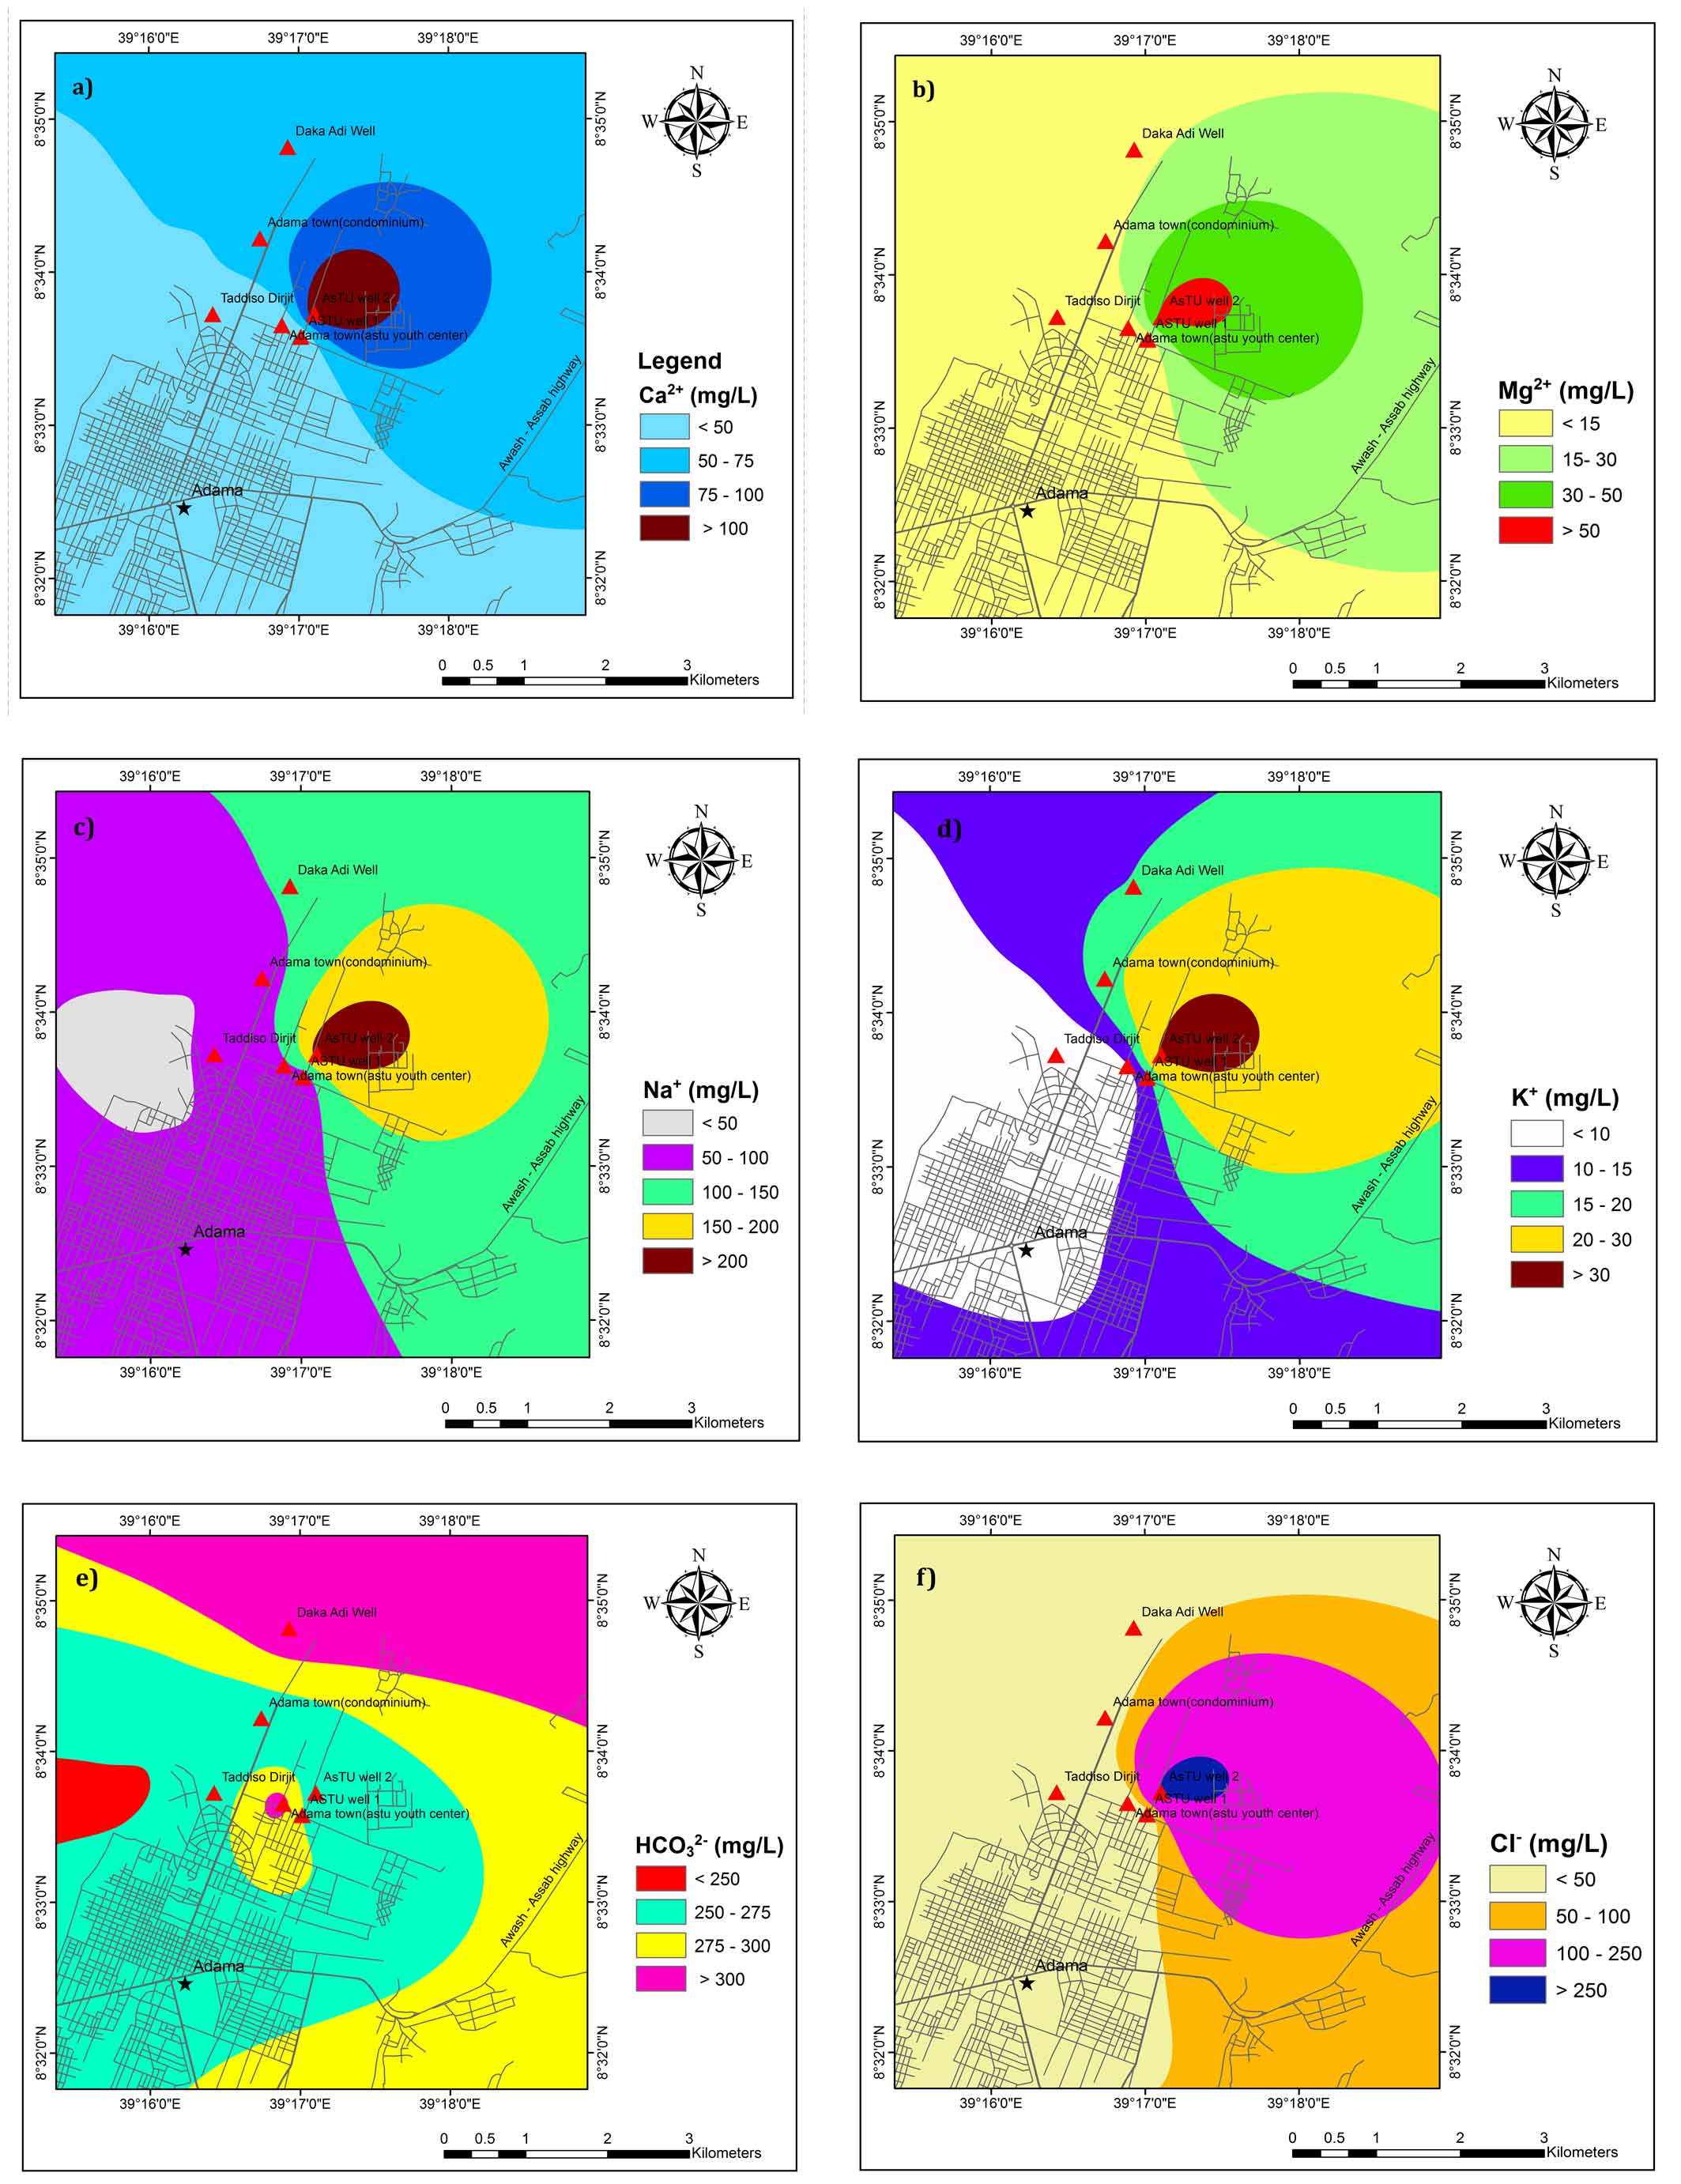
As per WHO (2011), the permissible limit for Ca2+ is 75 mg/L and 30 mg /L as a safer zone for drinking (Table 1). It is observed that most of the groundwater samples are found to be within the permissible limit of drinking water and fall in good groundwater quality zones except ASTU well 2 (Figure 3a). The possible source of high Ca2+ in samples from ASTU well 2 might be due to chemical and mineralogical composition of basic rocks through which it percolates.
Magnesium (Mg2+)
As per WHO (2011), the permissible limit for Mg2+ is 50 mg/L (Table 1). Spatially, Mg2+ in groundwater is above 50 mg/L in and around ASTU well 2 (Figure 3b). Basalt that contains ferromagnesian minerals such as olivine, pyroxenes, and amphibole are source of Mg2+ (Hem, 1985; Wagh et al., 2019a). On the basis of Mg2+ content, almost all the groundwater samples are suitable for drinking.
Sodium (Na+)
Sodium concentration is higher in ASTU Well 2. Deep percolating water from the topsoil layers could be a possible source of sodium due to longer residence time and water-rock interaction (Wagh et al., 2019b). Spatially, around ASTU Well 2 of the study area has greater than the desirable limit of sodium concentration in drinking water standard (Figure 3c).
Potassium (K+)
According to WHO’S standard, potassium concentration < 50 mg/L, 50-100 mg/L and > 200 mg/L is fall in a good zone, moderate zone and poor groundwater quality zones, respectively. Good zone and moderate zone are suitable for drinking purposes. The maximum concentration of potassium in groundwater samples of the study area is 31.5 mg/L (Table 1) which falls in the good zone. Spatial variation map of potassium shows that, groundwater samples fall in the good zone (Figure 3d).
5.2.2 Major Anions
Bicarbonate (HCO32−)
In the study area, bicarbonate concentration is high. Silicate and carbonate weathering process are sources of bicarbonate (Bala Krishna Prasad and Ramanathan, 2005). According to the WHO standard, HCO32− < 100 mg/L is categorized as a poor zone which is suitable only for industrial activity. The larger part of the study area has HCO32− concentration greater than 250 mg/L except for few areas in the Western part (Figure 3e). The possible source of HCO32− could be the magmatic release of CO2 by the active fault zones (Mechal et al., 2017; Rango et al., 2010).
Chloride (Cl-)
The chloride concentration in groundwater of the study area below desirable limit except ASTU well 2 which is exceeding the maximum allowable limit of 200 mg/L (Table 1). The spatial distribution of chloride concentration in the groundwater of the study area is illustrated in Figure 3f. ASTU well 2 of the study area has a poor groundwater quality zone (Figure 3f). The possible source of chloride is agricultural activities and leachate from waste disposal sites.
Sulphate (SO42−)
The highest desirable limit of Sulphate in drinking water quality is 200 mg/L and 483 mg/L according to WHO, 2011 and Ethiopian standard, respectively. In the study area, most of the samples are found to be within the prescribed limit for drinking purposes except ASTU well 2 (Table 1). This high content of SO42− in the basin might be associated with volcanic activity and lacustrine sediments (Ayenew, 2005; Kawo and Shankar, 2018).
Fluoride (F-)
The highest desirable limit of fluoride in drinking water quality is 1.5 mg/L and 3 mg/L according to WHO, 2011 and Ethiopian standards, respectively. Fluoride concentration in groundwater is within the desirable limit of WHO standards and Ethiopian standard in the study area (Table 1). Higher concentration of fluoride (1.5 mg/L) is observed at BH4 Kebele 03. The F- in Ethiopian rift groundwater comes from acidic volcanic rocks such as tuffs, fluvio/volcano lacustrine sediments, pyroclastic deposits, ignimbrite and rhyolite (Furi et al., 2011; Haji et al., 2018).
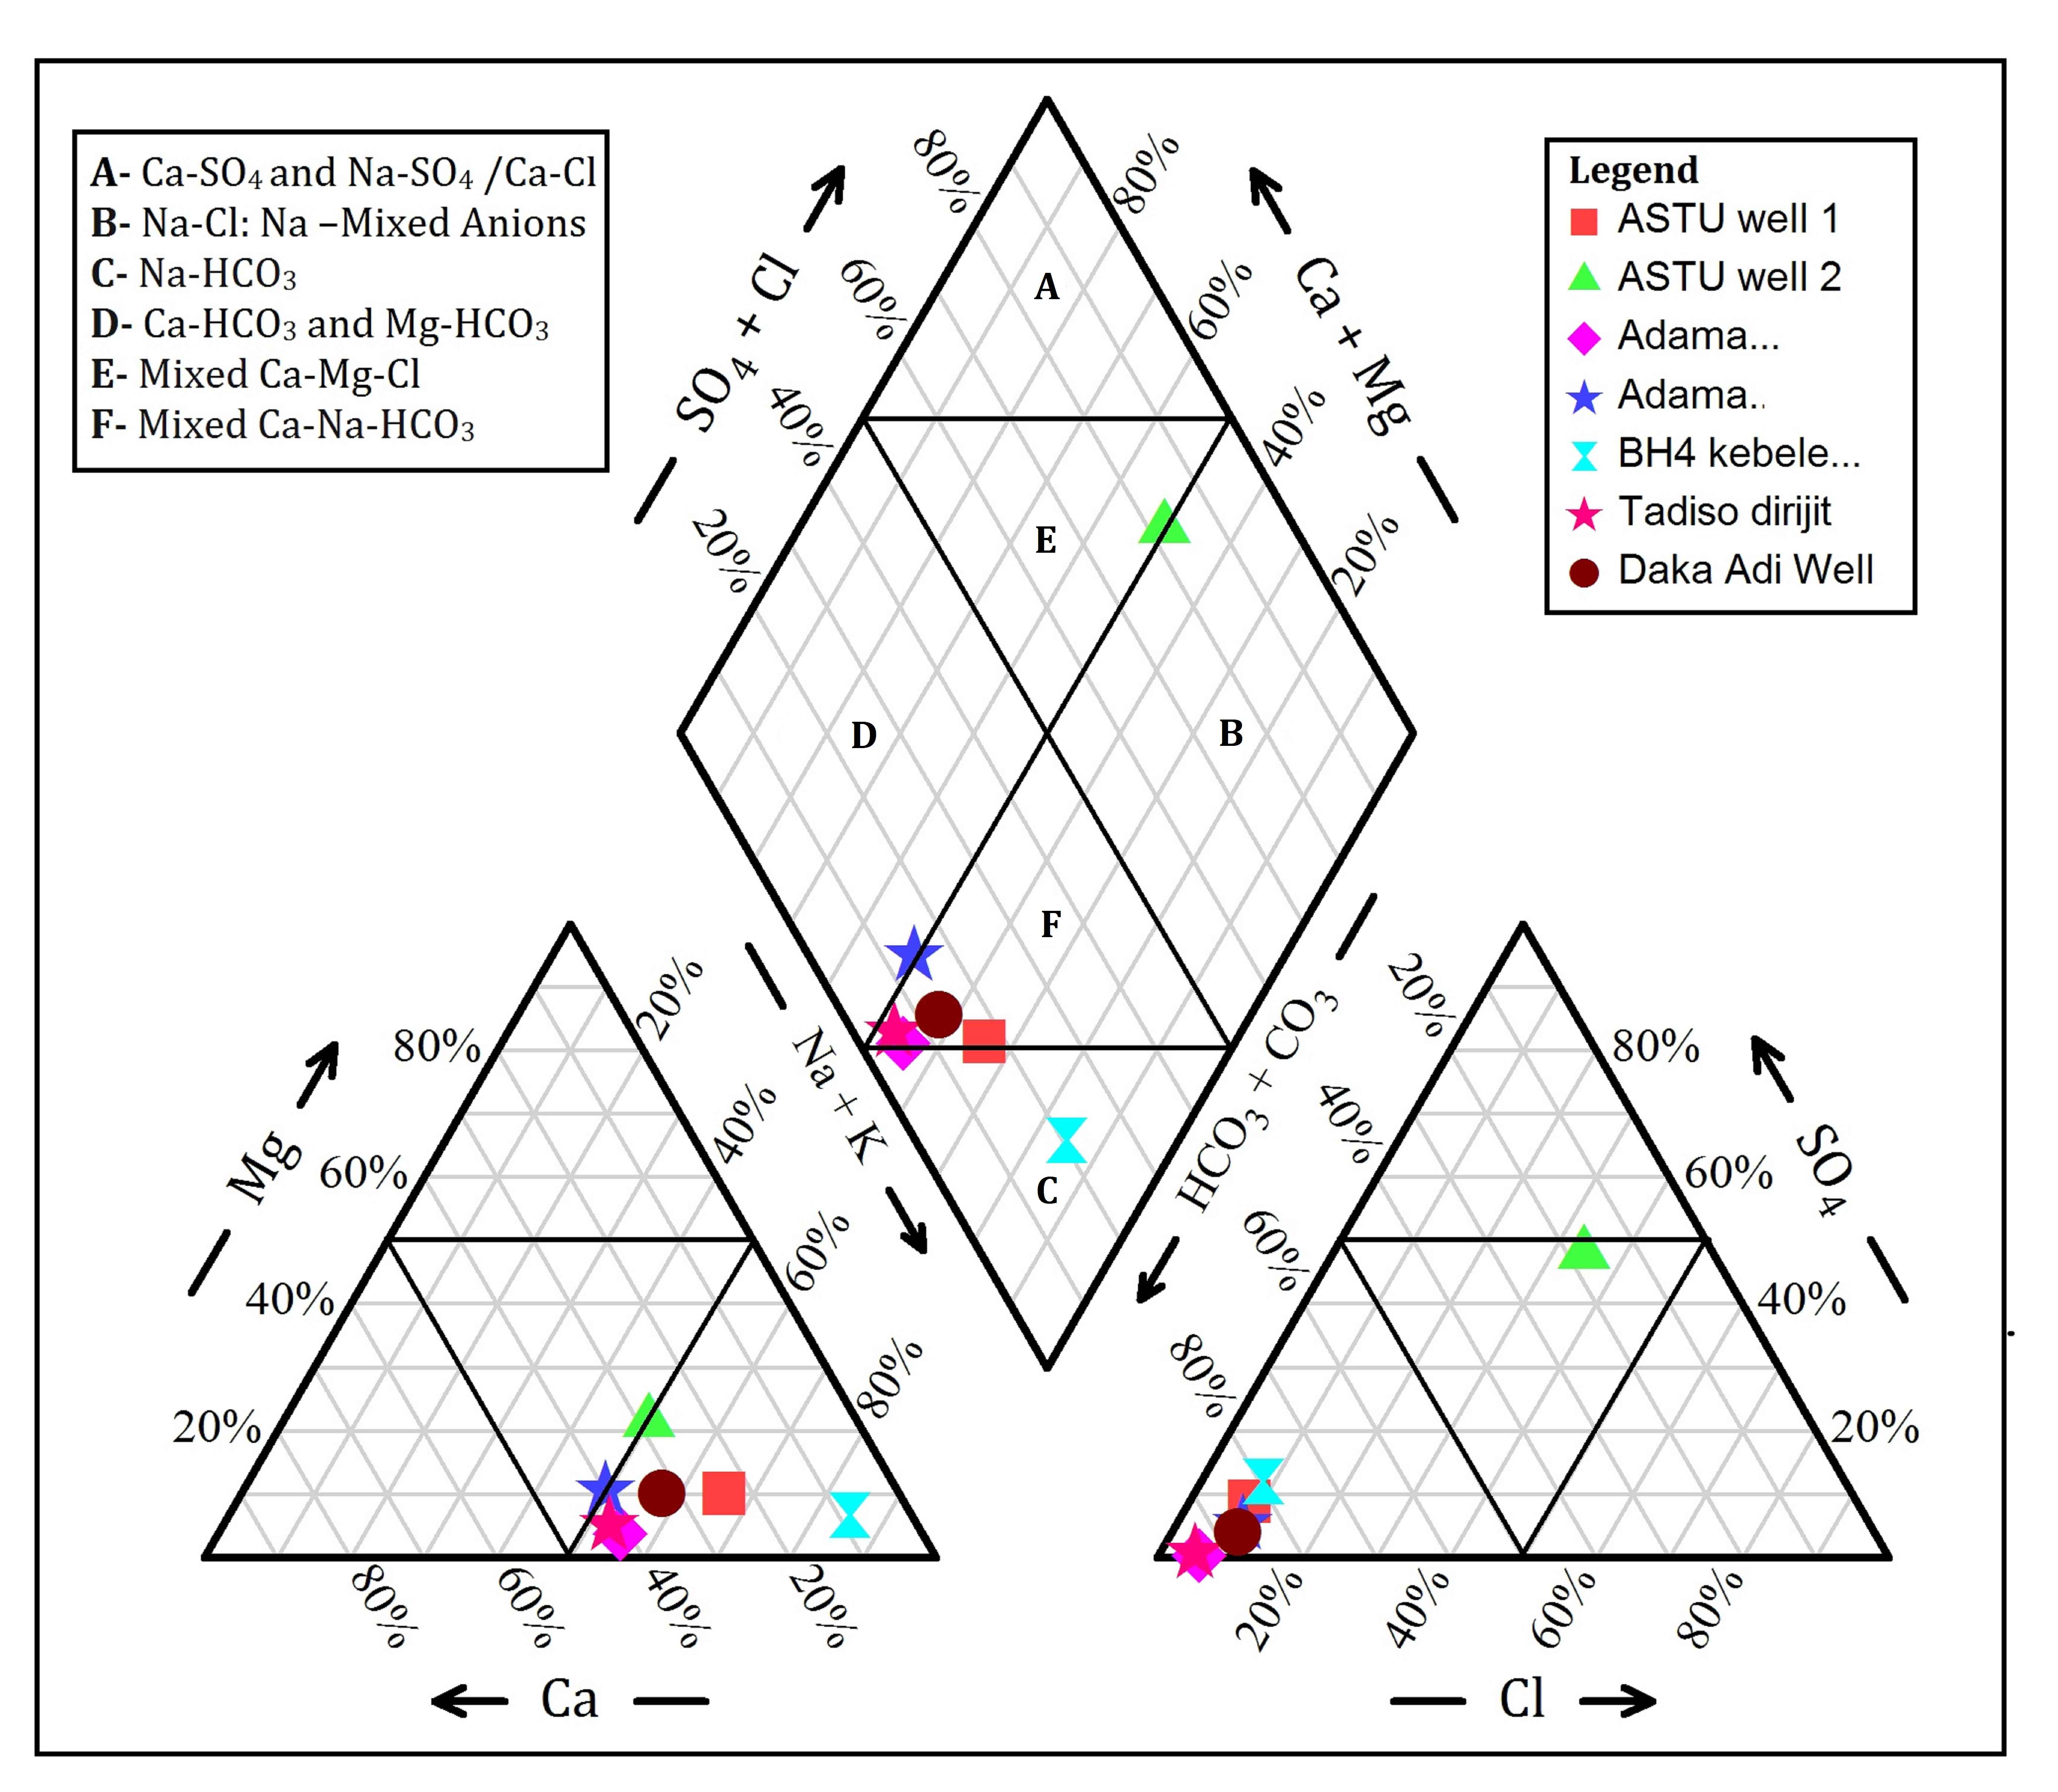
5.3 Hydrogeochemical Facies
The dominant water type in the study area is Mixed Ca–Na–HCO3 type facies type (Figure. 4). According to Kawo and Shankar (2018), Na/Ca–HCO3 water is dominant in escarpment and Na–HCO3 type of water is dominant in the rift floor. Ayenew, (2005) also reported that hot springs and groundwater in the rift valley has a Na–HCO3 water type, with high Na+ and HCO32− concentration. Haji et al., (2018), stated that a high concentration of fluoride which is related to Na–HCO3 type of waters.
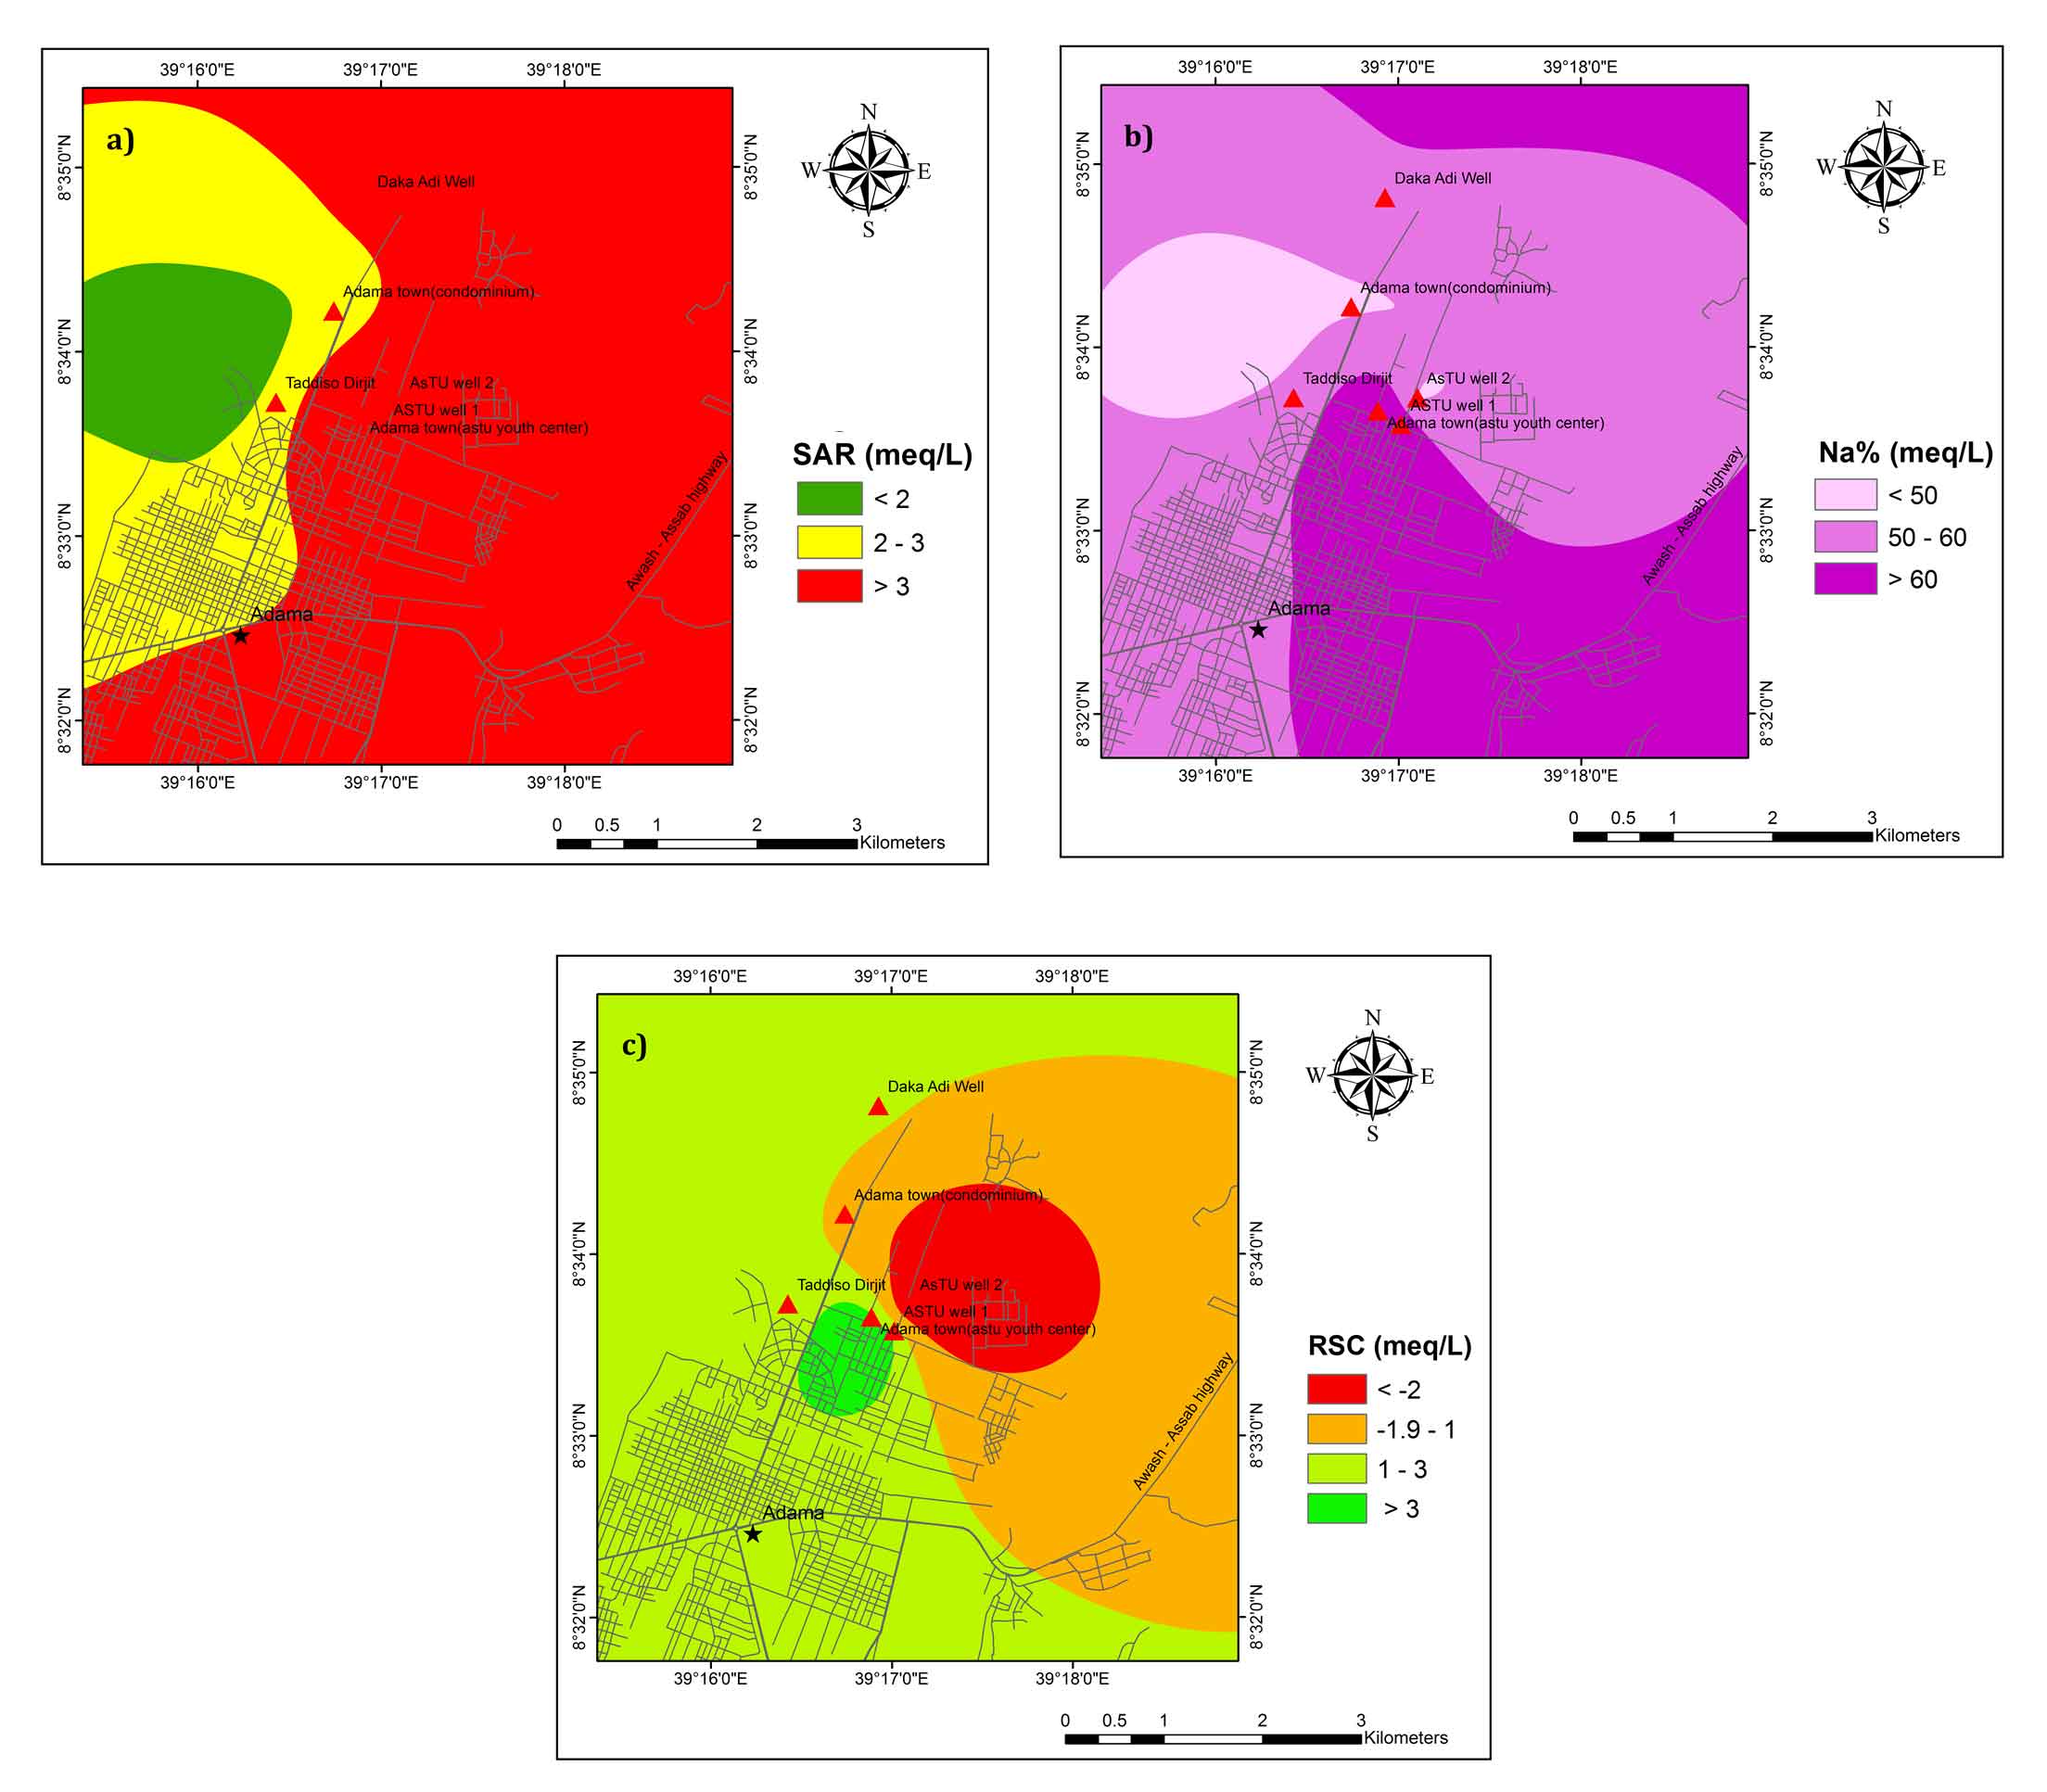
5.4 Suitability of Groundwater for Irrigation Purposes
Irrigation water quality indices such as Sodium Adsorption Ratio (SAR), Residual Sodium Carbonate (RSC), Sodium Percent (Na%) were used to investigate the suitability of groundwater. Higher concentration of dissolved ions in irrigation water has a negative effect on soil properties and decline productivity (Kaka et al., 2011; Li et al., 2011). Chemically, irrigation water should contain less dissolved ions and has no poisonous constituents (Shankar et al., 2011c).
Sodium Adsorption Ratio (SAR)
The SAR was used to evaluate the suitability of water for irrigation. It measures the proportion of sodium ions to calcium and magnesium in irrigation water (Kalra and Maynard, 1991). In this study, SAR was calculated using equation (equation (1)) (Richards, 1954).
\(SAR = {Na^+ \over {\sqrt{{Ca^{2+}+Mg^{2+}}}\over 2}}\) (1)
According to Richards, (1954) SAR <10, is considered excellent for irrigation (Table 2) and all the groundwater samples fall in the excellent water class. The calculated SAR value in the study area ranges from 2.3 to 7.4 and suitable for irrigation (Figure 5a).
Table 2. Classification of groundwater samples for irrigation purposes
|
Parameters
(meq/L)
|
Sample range
|
Range
|
Classification
|
Number of samples
|
|
Min.
|
Max.
|
Average
|
|
Alkalinity hazard (SAR) (Richards 1954)
|
2.29
|
7.36
|
3.64
|
< 10
|
Excellent
|
7
|
|
10 – 18
|
Good
|
0
|
|
18 – 26
|
Doubtful
|
0
|
|
> 26
|
Unsuitable
|
0
|
|
Na%
(Wilcox 1955)
|
49.57
|
84.81
|
59.36
|
< 20
|
Excellent
|
0
|
|
20 – 40
|
Good
|
0
|
|
40 – 60
|
Permissible
|
5
|
|
60 – 80
|
Doubtful
|
1
|
|
> 80
|
Unsuitable
|
1
|
|
RSC
(Raghunath 1987)
|
-5.89
|
4.75
|
1.04
|
< 1.25
|
Good
|
2
|
|
1.25 - 2.5
|
Doubtful
|
3
|
|
> 2.5
|
Unsuitable
|
2
|
Sodium Percentage (Na%)
High concentration of sodium in irrigation water reduces soil permeability and eventually causes soil to have poor internal drainage (Belkhiri and Mouni, 2012). Hence, it restricts air and water movements in the soil and this type of soils become hard when dry (Saleh et al., 1999). In this study, Sodium percentage was computed using equation (equation (2)):
Na% = [(Na++K+)/(Ca2++Mg2++Na++K+)]×100meq/l (2)
In the study area, the Na% ranges between 49.6 and 84.8 (Table 2). Na% indicates that around 70 % of samples fall in the field of the permissible limit. It was revealed from the analysis that the groundwater of doubtful and bad quality (ASTU well 1 and BH4 Kebele 03) was found 30% of the area (Figure 5b). Na% in irrigation water results in sodium accumulation and calcium deficiency in the soil. Therefore, good drainage, high leaching process and application of organic matter are possible solution to manage property of the soil (Beyene et al., 2019).
Residual sodium carbonate (RSC)
The high concentration of carbonate and bicarbonate in groundwater affects the suitability of groundwater for irrigation (Kawo and Shankar, 2018). High concentrations of bicarbonate in irrigation water causes precipitation of calcium and magnesium in the soil and the soils become more concentrated (Eaton, 1950; Srinivasamoorthy et al., 2014). The relative proportion of sodium in the water is increased in the form of sodium carbonate denoted as residual sodium carbonate (RSC) (Eaton, 1950; Ragunath 1987). In this study, RSC was calculated using equation (equation (3)):
RSC = {(HCO3- + CO32-) – (Ca2++ Mg2+)} (3)
RSC more than 2.50meq/L of is unsuitable for irrigation purposes (Ragunath 1987). The results of RSC values show that 28.6% of the samples are fall in good quality whereas 42.9 % and 28.6 % of samples fall in the category of doubtful and unsuitable class, respectively (Table 2; Figure 5c) for irrigation purpose.
5.5 Water Quality Index (WQI)
Many researchers have been used WQI to map groundwater quality and its suitability for drinking purposes (Singh, 1992; Subba Rao, 1997; Avvannavar and Shrihari, 2008). In WQI the rating system was used for individual water quality parameters to determine the overall drinking water quality (Mitra et al., 2006; Sahu and Sikdar, 2008). In this study, the WHO (2011) guideline for drinking purpose was considered to calculate of WQI. pH, TH, TDS, major cations and anions were given weight (wi) to compute WQI. The highest wi was assigned to parameters that has a significant health effect. F- was assigned the highest wi followed by pH, TDS, TH, Ca2+, Mg2+, Na+, and SO42- as shown in Table 3. The least weight is assigned for chloride. Then, the relative weight (Wi) for each parameter is computed from the using (equation (4)). A quality rating scale (qi) for each parameter also calculated using (equation (5)). Finally WQI is calculated using equation (equation (6)). Categories of WQI are presented in Table 4. The categories of WQI for each samples is represented in Table 5.
Wi = wi/Σni = 1 wi (4)
qi = (Ci/Si) × 100 (5)
SIi = Wi × qi and WQI = ΣSIi (6)
where, Wi is the relative weight, wi is the weight of each parameter, n is the number of parameters, qi is the quality rating, Ci is the concentration of each chemical parameter in each water sample, Si is the WHO standard for each chemical parameter, SIi is the sub-index of ith parameter.
Table 3. Relative weight of chemical parameters
|
Chemical parameters
|
WHO (2011)
|
Weight (wi)
|
Relative weight
|
|
F-
|
1.5
|
5
|
0.179
|
|
pH
|
6.5 - 8.5
|
4
|
0.143
|
|
TH
|
300
|
4
|
0.143
|
|
TDS
|
500
|
4
|
0.143
|
|
Ca2+
|
75
|
3
|
0.107
|
|
Mg2+
|
50
|
3
|
0.107
|
|
SO42-
|
200
|
2
|
0.071
|
|
Na+
|
200
|
2
|
0.071
|
|
Cl-
|
250
|
1
|
0.036
|
|
|
Σwi = 28
|
Σwi = 1.000
|
Table 4. Water Quality Index and their status of groundwater (Sahu and Sikdar, 2008)
|
Range
|
Type of water
|
Number of the samples
|
% of the samples
|
|
< 50
|
Excellent water
|
0
|
0
|
|
50 - 100
|
Good water
|
06
|
85
|
|
100-200
|
Poor water
|
01
|
15
|
|
200-300
|
Very poor water
|
0
|
0
|
|
> 300
|
Unsuitable
|
0
|
0
|
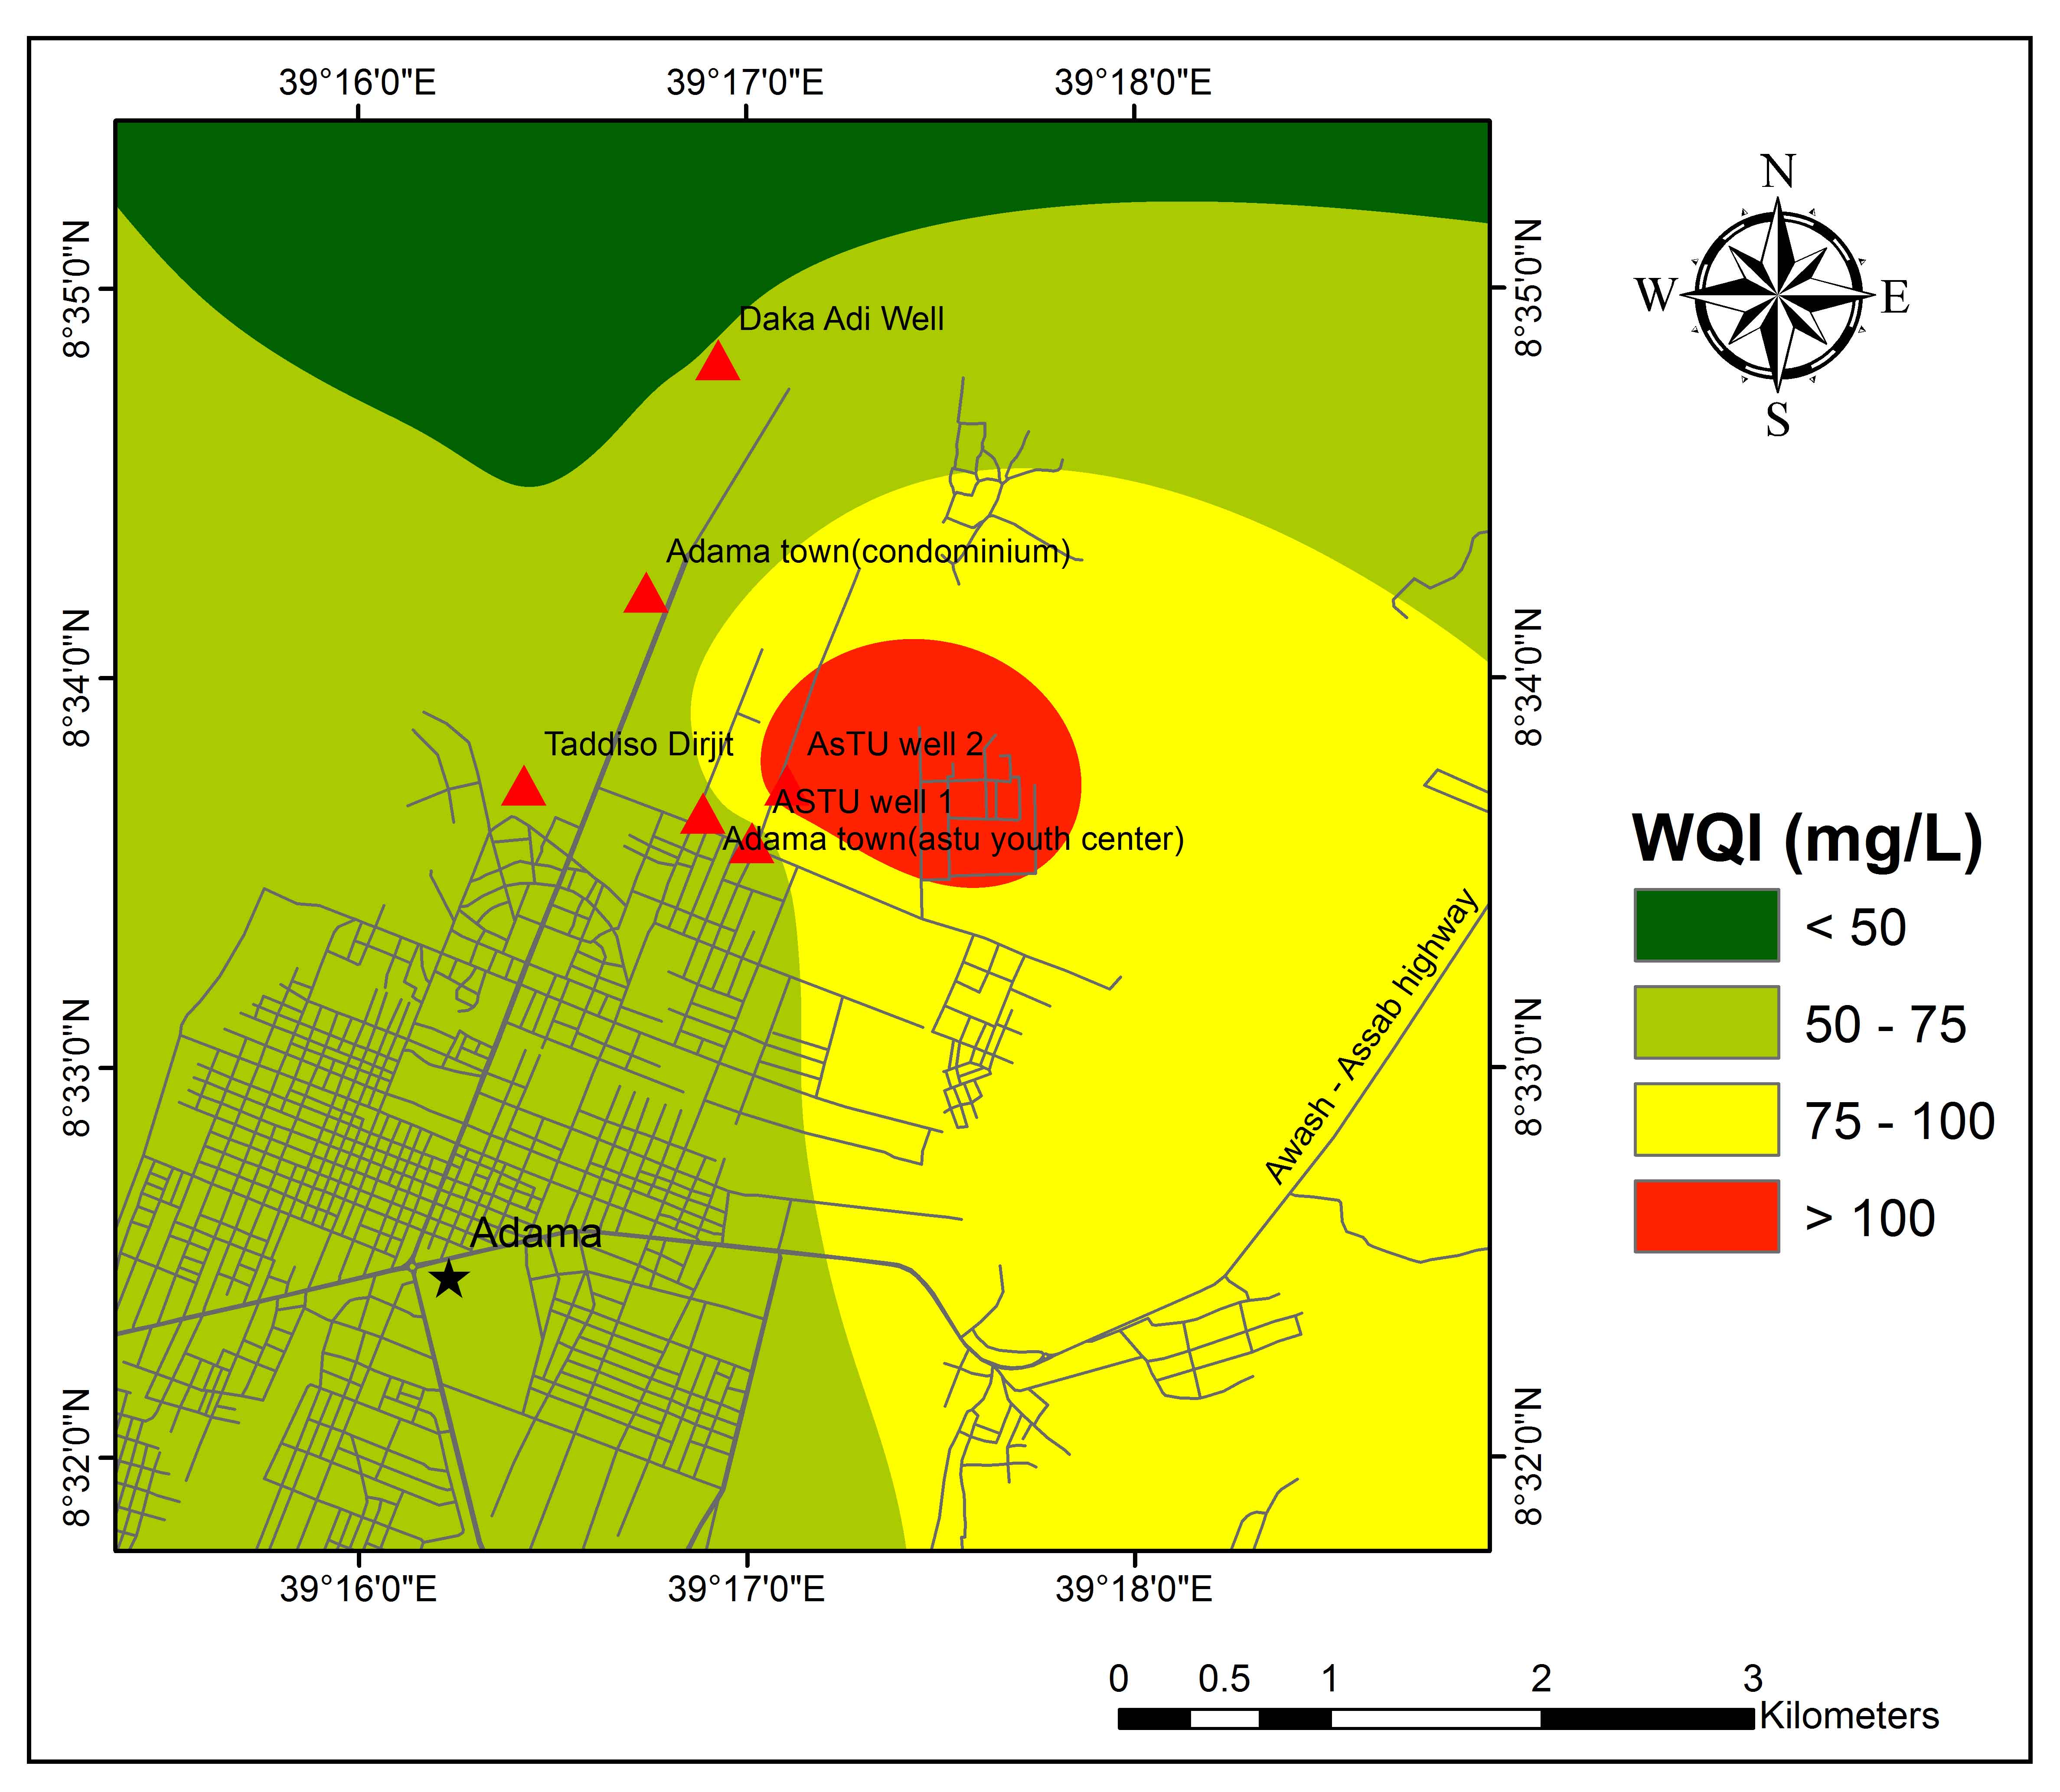
WQI of the study area ranges between 51 and 114 (Table 5). The result of WQI indicates that 85 % and 15% of water samples fall in the category of good and poor water quality, respectively. The spatial distribution of WQI, (Figure 6) represents most of the regions with good quality groundwater. Except ASTU Well 2 which is fall in poor quality groundwater all other samples fall in good quality for drinking purposes.
Table 5. Calculation of WQI for individual water samples
|
Well No.
|
Well Name
|
WQI
|
Classification
|
|
1
|
ASTU well 1
|
65
|
Good water
|
|
2
|
ASTU well 2
|
114
|
Poor water
|
|
3
|
Adama town (ASTU youth center)
|
60
|
Good water
|
|
4
|
Adama town (condominium)
|
59
|
Good water
|
|
5
|
BH4 kebele 03
|
78
|
Good water
|
|
6
|
Taddiso Dirjit
|
64
|
Good water
|
|
7
|
Daka Adi Well
|
51
|
Good water
|


 ,
Nafyad Serre Kawo 2
,
Nafyad Serre Kawo 2