Abstract
Urbanization has been contributing more in global climate warming, with more than 50% of the population living in cities. Rapid population growth and change in land use / land cover (LULC) are closely linked. The transformation of LULC due to rapid urban expansion significantly affects the functions of biodiversity and ecosystems, as well as local and regional climates. Improper planning and uncontrolled management of LULC changes profoundly contribute to the rise of urban land surface temperature (LST). This study evaluates the impact of LULC changes on LST for 1997, 2007 and 2017 in the Rajshahi district (Bangladesh) using multi-temporal and multi-spectral Landsat 8 OLI and Landsat 5 TM satellite data sets. The analysis of LULC changes exposed a remarkable increase in the built-up areas and a significant decrease in the vegetation and agricultural land. The built-up area was increased almost double in last 20 years in the study area. The distribution of changes in LST shows that built-up areas recorded the highest temperature followed by bare land, vegetation and agricultural land and water bodies. The LULC-LST profiles also revealed the highest temperature in built-up areas and the lowest temperature in water bodies. In the last 20 years, LST was increased about 13ºC. The study demonstrates decrease in vegetation cover and increase in non-evaporating surfaces with significantly increases the surface temperature in the study area. Remote-sensing techniques were found one of the suitable techniques for rapid analysis of urban expansions and to identify the impact of urbanization on LST.
1 . INTRODUCTION
Cities are facing higher urbanization problems in developing countries than developed countries, and the proportion of urban growth is estimated in medium and small-sized cities (Grimmond, 2007; Karl et al., 1988; Lilly Rose, 2009; McKinney, 2002; Rahman et al., 2018). The rapidly growing urban population significantly changes the land use / land cover (LULC) and creates negative impacts on urban land surface temperature (LST) (Argüeso et al., 2014; Bahi et al., 2016; Habitat, 2016). In recent years, population of Rajshahi city is growing immensely along with the urban development as population of Rajshahi city was about 1200256 (1991), 1535635 (2001), 2286874 (2011) and 24,06874 (2014) (Clemett et al., 2006; Rajshahi Development Authority, 2008; BBS, 2013). This rapid growth brings city expansion, transformation of different LULC and affected the LST in Rajshahi district (Aguilar et al. 2003; Kafy et al., 2019; Kafy et al., 2019b; Rajshahi Development Authority, 2008). Thus, the evaluation of urban LULC change and its influence on LST is important to create an environmental friendly city.
The rapid population growth and LULC change are closely related (Grimmond, 2007; Rahman et al., 2018; Speth, 2005). The significant growth of population affects severely on ecosystem, social aspect and human health (Aguilar et al., 2003; Al-Hathloul and Rahman, 2003; Trolle et al., 2019). Rapid conversion of LULC influenced by population growth and urban development modifying the thermal condition (Argüeso et al., 2014; Niyogi, 2019; Rasul et al., 2015; Tran et al., 2017; Zhou et al., 2011) and higher LST results in urban heat islands (UHI). It leads to degradation of Earth environment and human health (Hart and Sailor, 2009; Kumar et al., 2012; Lilly Rose, 2009; Maimaitiyiming et al., 2014; Mallick et al., 2008; Priyadarsini, 2012; Rahman et al., 2017; Shatnawi and Abu Qdais, 2019). Geographic Information System (GIS) and Remote Sensing techniques are effective and powerful tools for analysis of LULC changes and LST (Dewan and Corner, 2013; Lilly Rose, 2009; Scarano and Sobrino, 2015; Zhou et al., 2011). Several studies have demonstrated the LULC change and its impact on LST using GIS and multi-temporal remote sensing data (Ahmed, 2011b; Celik et al., 2019; Dewan and Corner, 2013; Lilly Rose, 2009; Maduako et al., 2016; Mallick et al., 2008; Pal and Ziaul, 2017; Shatnawi and Abu Qdais, 2019; Tran et al., 2017).
In Bangladesh, studies on LULC changes and LST are available for Dhaka, Khulna and Chittagong city only (Ahmed, 2011a, 2011b; Ahmed et al., 2013; Dewan and Corner, 2013; Hussain et al., 2016). However, this type of work has not been carried out for one of the largest district (Rajshahi) of Bangladesh. Rajshahi district shows tremendous LULC changes, increase in surface temperature and become one of the predominant problems for Rajshahi in last 20 years. Therefore, the present work investigates the effect of LULC changes on LST for the year of 1997, 2007 and 2017 in the Rajshahi district using multi-temporal and multi-spectral Landsat 8 OLI and Landsat 5 TM satellite data sets.
2 . STUDY AREA
Rajshahi district is located in the Northwest region of Bangladesh between 24°12′ to 24°42′ N latitude and 88°15′ to 88°50′ E longitude. This district is the social, economic and administrative hub of the Northern region of Bangladesh (Figure 1). Topographically, surface elevation is ranging from 1 to 18 m, the area is almost flat. The district (2428 km2) consists of 9 Upazilas, 13 Municipalities and 147 Wards. (Clemett et al., 2006; Rajshahi Development Authority, 2008). It predominately has tropical wet and dry climate. The average temperature is between 22 to 25 °C with 1448 mm rainfall (BBS, 2011). Historically, Rajshahi district is known for rural agrarian community. However, after the construction of Jamuna Bridge and industrialization, this area is significantly experiencing rapid urbanization. The rapid urbanization remarkably changed the intensity of winter and summer season during the last couple of decades which is detrimental to environment, livelihood and agricultural production of this district.
3 . DATA AND METHODOLOGY
The study deals with multi-temporal Landsat 4-5 Thematic Mapper (TM), and Landsat 8 Operational Land Imager (OLI) satellite images obtained from US Geological Survey (USGS) website (https://earthexplorer.usgs.gov) where path is 138 and row is 43 (Table 1) for the years, 1997, 2007 and 2017. All the images contain 30m spatial resolution. The Landsat images (Level 1 Terrain Corrected product) were projected to UTM zone 46 North projection using WGS-84 datum. To avoid the seasonal variation all the Landsat images were downloaded maximum one-month interval (Kafy et al., 2019; Kafy et al., 2017). Images were captured from cloud-free environment in late autumn of September, October and November for preparation of LULC and LST distribution maps (Good and Giordano, 2019; Kafy et al., 2018; Kafy et al., 2019; Kafy et al., 2017). Image processing, image classification, image change detection was processed in ERDAS Imagine 15 software. LST distribution and mapping were conducted in ArcMap 10.6.
Table 1. Landsat images
|
Satellite images
|
Date of acquisition
|
Sensor
|
Path/row
|
Bands
|
Spectral range (Wavelength  m) m)
|
Spatial resolution (m)
|
|
Landsat 4-5
|
May 9, 1997;
May 5, 2007
|
TM
|
138/43
|
1
|
0.45-0.52
|
30
|
|
2
|
0.52-0.60
|
30
|
|
3
|
0.63-0.69
|
30
|
|
4
|
0.76-0.90
|
30
|
|
5
|
1.551.75
|
30
|
|
6
|
10.4012.50
|
120 resampled to 30
|
|
7
|
2.082.35
|
30
|
|
Landsat 8
|
May 16, 2017
|
OLI
|
138/43
|
1
|
0.43-0.45
|
30
|
|
2
|
0.45-0.51
|
30
|
|
3
|
0.64-0.67
|
30
|
|
4
|
0.53-0.59
|
30
|
|
5
|
0.85-0.88
|
30
|
|
6
|
1.57-1.65
|
30
|
|
7
|
2.11-2.29
|
30
|
|
8
|
1.36-1.38
|
15
|
|
9
|
0.50-0.68
|
30
|
|
10 (TRIS1)
|
10.60-11.19
|
100 resampled to 30
|
|
11 (TRIS 1)
|
11.50-12.51
|
100 resampled to 30
|
3.1 Classification of Land Use / Land Cover
The LULC categorized into four types: water bodies, built-up area, vegetation cover and bare land. The determined training areas are used to classify satellite image complying maximum likelihood supervised classification (MLSC). The accuracy assessment of land use classification (overall accuracy, Kappa coefficient, and accuracy validation) was applied. Several studies described the method of mostly used MLSC for image classification (Kafy et al., 2018; Kafy et al., 2019). For accuracy assessments, 350 points were randomly selected for evaluating each classified map using Google Earth images.
3.2 Land Surface Temperature Derivation
The Digital Numbers (DN) of the thermal bands (Band 6 in Landsat 5 TM and Bands 10 in Landsat 8 TIRS) were used to estimate the LST. In the primary stage, spectral radiances ( \(L_{\lambda} \) ) of the Landsat 5 TM and Landsat 8 TIRS bands were calculated by using the equation (1) and equation (2), respectively. Finally, \(L_{\lambda} \) was used to derive the LST in Degree Celsius using the equation (3).
\(L_{\lambda} (Landsat \ 5 \ TM) = L_{min}+{L_{max}-L_{min} \over Qcal_{max}+Qcal_{min}} \times DN\) (1)
\(L_{\lambda} (Landsat \ 8 \ OLI) = ML \times DN \times AL\) (2)
\(LST= {T_B \over 1+{(\lambda \times {T_B \over \rho})} \times In (\varepsilon)} -273.15\) (3)
where, ML (0.0003342) is multiplicative rescaling factor (band-specific), and value of AL is 0.1, which is a additive rescaling factor (band-specific) (Kamran et al., 2015; Sholihah and Shibata, 2019). The values for Landsat TM, Lmax and Lmin were collected from satellite metadata file. The wavelength of emitted radiance λ is 11.5 µm.
\( \rho= h \times {c \over \sigma} = 1.438 \times 10^{-2}\) mK (where, h indicates Plank’s constant which is equal to 6.626×10⁻³⁴ Js, c indicates the velocity of light, which is equal to 2.998×10⁸ ms-2 and \(\sigma\) is the Boltzmann constant (5.67×10⁻⁸ Wm2k-4 = 1.38 ×10⁻²³ JK-1). \(\varepsilon\) is the land surface emissivity which is ranged between 0.97 and 0.99.
\(T_B= {k_2 \over In({{k_1 \over L_\lambda}+1 })} \) , where \(T_B\) is the satellite brightness temperature and the constant K1 and K2 values for 1) Landsat-5: K1 is 607.7 and K2 is 1260.6 and 2) Landsat 8: K1 is 774.9 and K2 is 1321.07, respectively.
4 . RESULTS AND DISCUSSIONS
4.1 Land Use Land Cover
The LULC (1997, 2007 and 2017) (Figure 2) was calculated from classified images (Table 2). LULC maps demonstrate a rapid increase in built-up areas (6.80%) and significant decreased in vegetation and agricultural land (-7.74%) from 1997 to 2017. Moderate increase and decrease in bare land (2.84%) and water bodies (-1.89%) also noticeable. In 1997, the area under water bodies was 303km2, which slightly reduce to 257 km2 in year 2017. In 1997, the built-up area (179 km2) was a small in the city center. In 2007, the total urbanized area was increased massively which replaced the areas of water bodies and vegetation. The rapidly increased (344 km2) urbanized area was scattered in the outer portion of the city boundary and suburban area by the year 2017. The vegetation and agricultural land was the predominant land use type in all the years but was significantly decreased from 1235 km2 to 1047 km2 in 1997-2017. Maximum vegetation and agricultural land initially converted to bare lands and later it changed into the built-up areas. Therefore, the bare lands were moderately increased from 711km2 to 780km2 in 1997 to 2017.
Table 2. Distribution of LULC
|
Year
|
1997
|
2007
|
1997-2007
|
2017
|
2007-2017
|
1997-2017
|
|
LULC classes
|
Area
|
Area
|
Change (%)
|
Area
|
Change (%)
|
Change (%)
|
|
km2
|
%
|
km2
|
%
|
km2
|
%
|
|
Water Body
|
303
|
12.48
|
275
|
11.33
|
-1.15
|
257
|
10.58
|
-0.74
|
-1.89
|
|
Built-Up Area
|
179
|
7.37
|
285
|
11.74
|
4.37
|
344
|
14.17
|
2.43
|
6.80
|
|
Vegetation Land
|
1235
|
50.86
|
1113
|
45.84
|
-5.02
|
1047
|
43.12
|
-2.72
|
-7.74
|
|
Bare Land
|
711
|
29.28
|
755
|
31.10
|
1.81
|
780
|
32.13
|
1.03
|
2.84
|
4.2 Accuracy Assessment of Classified LULC maps
Table 3 demonstrates the overall accuracy, Kappa coefficient and land use classification. For each period, the overall accuracy is over 87%, and in comparison to the year 1997 and 2017, the overall accuracy was higher in 2017. The value of Kappa coefficient was above 0.85 for all the images.
When the coefficient of Kappa is higher than 0.75, the degree of accuracy is categorized as very good (Congalton and Green, 2008; Foody, 2002; Pontius Jr and Millones, 2011; Story and Congalton, 1986). In order to validate the LULC classifications, a comparison was done between the sampling points (300 points) and their corresponding point on Google Earth images in the same time period. The validation values for all the periods are more than 90%. It can be concluded that the good accuracy was estimated in overall accuracy assessments, Kappa coefficient statistics and validation.
Table 3. Accuracy assessment
|
User accuracy (%)
|
Producer accuracy (%)
|
Classification accuracy
|
Kappa statistics
|
|
Year
|
Water body
|
Built-up area
|
Vegetation
|
Bare soil
|
Water body
|
Built-up area
|
Vegetation
|
Bare soil
|
|
1997
|
100
|
85
|
85
|
80
|
100
|
100
|
71.43
|
100
|
90.00%
|
0.866
|
|
2007
|
100
|
75
|
100
|
85
|
100
|
100
|
100
|
66.67
|
87.67%
|
0.876
|
|
2017
|
100
|
85
|
100
|
80
|
100
|
100
|
83.33
|
100
|
91%
|
0.893
|
4.3 Changes in LULC
It is clear from Figure 3 and Table 4 that most LULC units have been changed in last 20 years. The changing rate of bare land (22.42%) is higher and positive followed by built-up areas (12.75%). The values in the parenthesis in the legend of the Figure 2 illustrate the percentage of changed area under different category. The positively experienced area is 31.22%, negatively experienced area is 34.47% and stable land proportion is 34.31%. Water body and vegetation cover show negative while built-up and bare land experienced positive changes. During the entire study period, maximum transformation rate was found for vegetation land (25.21%) followed by bare land (10.34%). The majority of the unchanged pixels (60.14%) were found in the period of 1997-2007 and maximum changes in the pixels (65.69%) were found in the period of 1997-2017. The most intense dynamics of change were concentrated in the central contiguous urban area where constant unidirectional transfers of other lands to built-up areas. Land under vegetation, agriculture and wetland adjacent to the urban area are extremely susceptible to be replaced by the residential or commercial land use.
Table 4. Change matrix and transformation rate of LULC (1997 to 2017)
|
Changes
|
Water bodies
|
Built-up area
|
Vegetation
|
Bare land
|
|
Area change to (km2)
|
0.00
|
309.48
|
35.26
|
544.46
|
|
Area converted from (km2)
|
170.28
|
19.25
|
612.11
|
251.07
|
|
Transformation rate (%)
|
7.01
|
0.79
|
25.21
|
10.34
|
|
Increasing rate (%)
|
0.00
|
12.75
|
1.45
|
22.42
|
|
Decreasing rate (%)
|
8.03
|
0.00
|
10.25
|
0.00
|
4.4 Changes in Land Surface Temperature
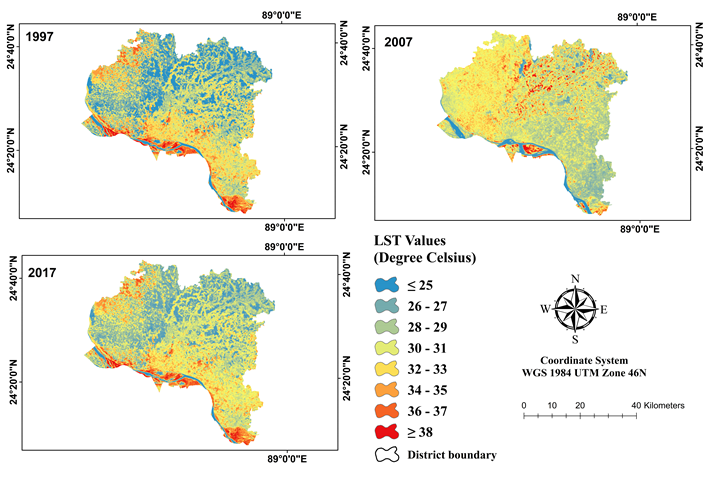
Figure 4 and Table 5 indicate a spatial pattern and areal distribution of LST in three phases e.g. 1997, 2007 and 2017. Clear reddish hue shows higher temperature and bluish color shows low LST in all maps. Such spatial patterns of LST concentration and temporal shift LST pattern highlight the change in LULC classes rapidly. Figure 6a-c emphases on the condition of temperature of 1997-2017. Usually, LST is confined within the range of 17-25 ºC during 1997, 18-33 ºC during 2007 and 26-42 ºC during 2017. Out of total area (2428 km2), 40.28% area represents temperature from 28-30 ºC in1997 followed by 44.05% area in 2007. The urban core areas are sensitive to high concentration of LST. From 1997 to 2017, the temperature was heaved up to and 37.63% area was faced 37-39 ºC in year 2017. This growth is wholly arithmetic but more realistic growth of the temperature was measured using the spatial average and it designates that since 1997-2017, approximately 13 ºC LST has increased. The Northeastern part of the study area exhibits lowering in temperature due to higher vegetation and agricultural land whereas the southwestern part exhibits the rise in LST due to rapid urban expansion and declining of water bodies as well as vegetation cover.
Table 5. Distribution of LST
|
Ranges of LST (ºC)
|
Area (1997)
|
|
Area (2007)
|
|
Area (2017)
|
|
km2
|
%
|
km2
|
%
|
km2
|
%
|
|
≤25 ºC
|
266.73
|
10.94
|
|
-
|
-
|
|
-
|
-
|
|
26-27 ºC
|
696.15
|
28.55
|
|
627.3
|
25.68
|
|
|
|
|
28-29 ºC
|
982.26
|
40.28
|
|
1076.1
|
44.05
|
|
70.89
|
2.91
|
|
30-31 ºC
|
493.17
|
20.23
|
|
736.44
|
30.15
|
|
246.33
|
10.10
|
|
32-33 ºC
|
-
|
-
|
|
3.06
|
0.13
|
|
618.63
|
25.36
|
|
34-35 ºC
|
-
|
-
|
|
-
|
-
|
|
918
|
37.63
|
|
36-37 ºC
|
-
|
-
|
|
-
|
-
|
|
396.27
|
16.24
|
|
≥38 ºC
|
-
|
-
|
|
-
|
-
|
|
189.72
|
7.78
|
|
Total
|
2428
|
|
|
2428
|
|
|
2428
|
|
4.5 Validation of Estimated LST
The LST is obtained from the thermal bands of Landsat 4-5 TM and Landsat 8 OLI images through the simplest method. Though for retrieving LST, this is the simplest method it agonizes with certain limitations. Firstly, clear sky is major requirement to obtain accurate readings in LST retrieval using satellite remote sensing techniques. Hence, cloud coverage can create an acute problem. Secondly, all the surface materials don’t have unique emissivity value in a specific area (Chen et al., 2006; Dar et al., 2019; Neteler, 2010). These problems will drive to the unrealistic LST estimation in a region. To validate the LST estimation from remotely sensed data, maximum and minimum surface temperature data procured from the Bangladesh Metrological Department (BMD) for the year May1997, 2007 and 2017 in the day time. The deviation between estimated LST and recorded LST has shown in Table 6. The deviations have been calculated based on BMD recorded LST estimation. Negative deviation in LST indicates estimation is higher than the recorded temperature and positive deviation value indicates lower recorded value from recorded temperature.
Table 6. Validation of remotely sensed LST
|
Year
|
1997
|
2007
|
2017
|
|
Source of estimated/recorded LST
|
Maximum
|
Minimum
|
Maximum
|
Minimum
|
Maximum
|
Minimum
|
|
Remotely Sensed Estimated LST (ºC)
|
25.38
|
17.45
|
33.49
|
18.5
|
38.78
|
26.65
|
|
BMD recorded LST (ºC)
|
28.3
|
21
|
29.6
|
22.2
|
34
|
24.9
|
|
Deviation (ºC)
|
2.92
|
3.55
|
-3.89
|
3.7
|
-4.78
|
-1.75
|
|
Deviation (%)
|
10.31
|
16.9
|
-13.14
|
16.67
|
-14.05
|
-7.028
|
The highest deviation was noticed in maximum and minimum temperature for the year 2017 (-4.78 ºC) and (-1.75 ºC), respectively. In 2007, maximum and minimum deviation in temperature was (-3.89 ºC) and (3.7 ºC), respectively. Finally, on the basis of BMD estimation, highest maximum deviation was found for year 2017 (-14.05%). Temperature difference for both remotely sensed estimated and BMD recorded LST is 13.4 ºC and 5.7 ºC, respectively in last 20 years. Considering all the limitations of remote sensing derived LST estimation, the deviation between estimated and recorded LST is acceptable and can be used further analysis in future like LST simulation and temperature condition index in any region.
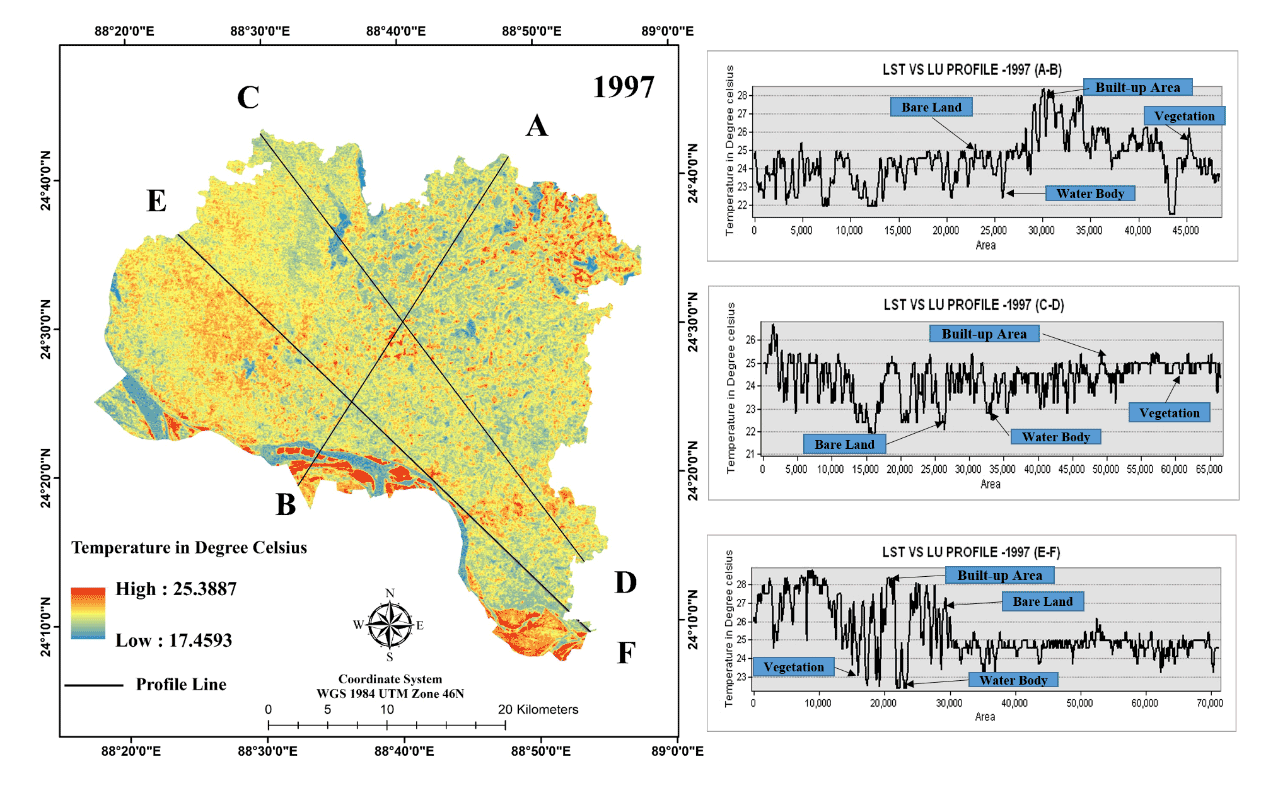
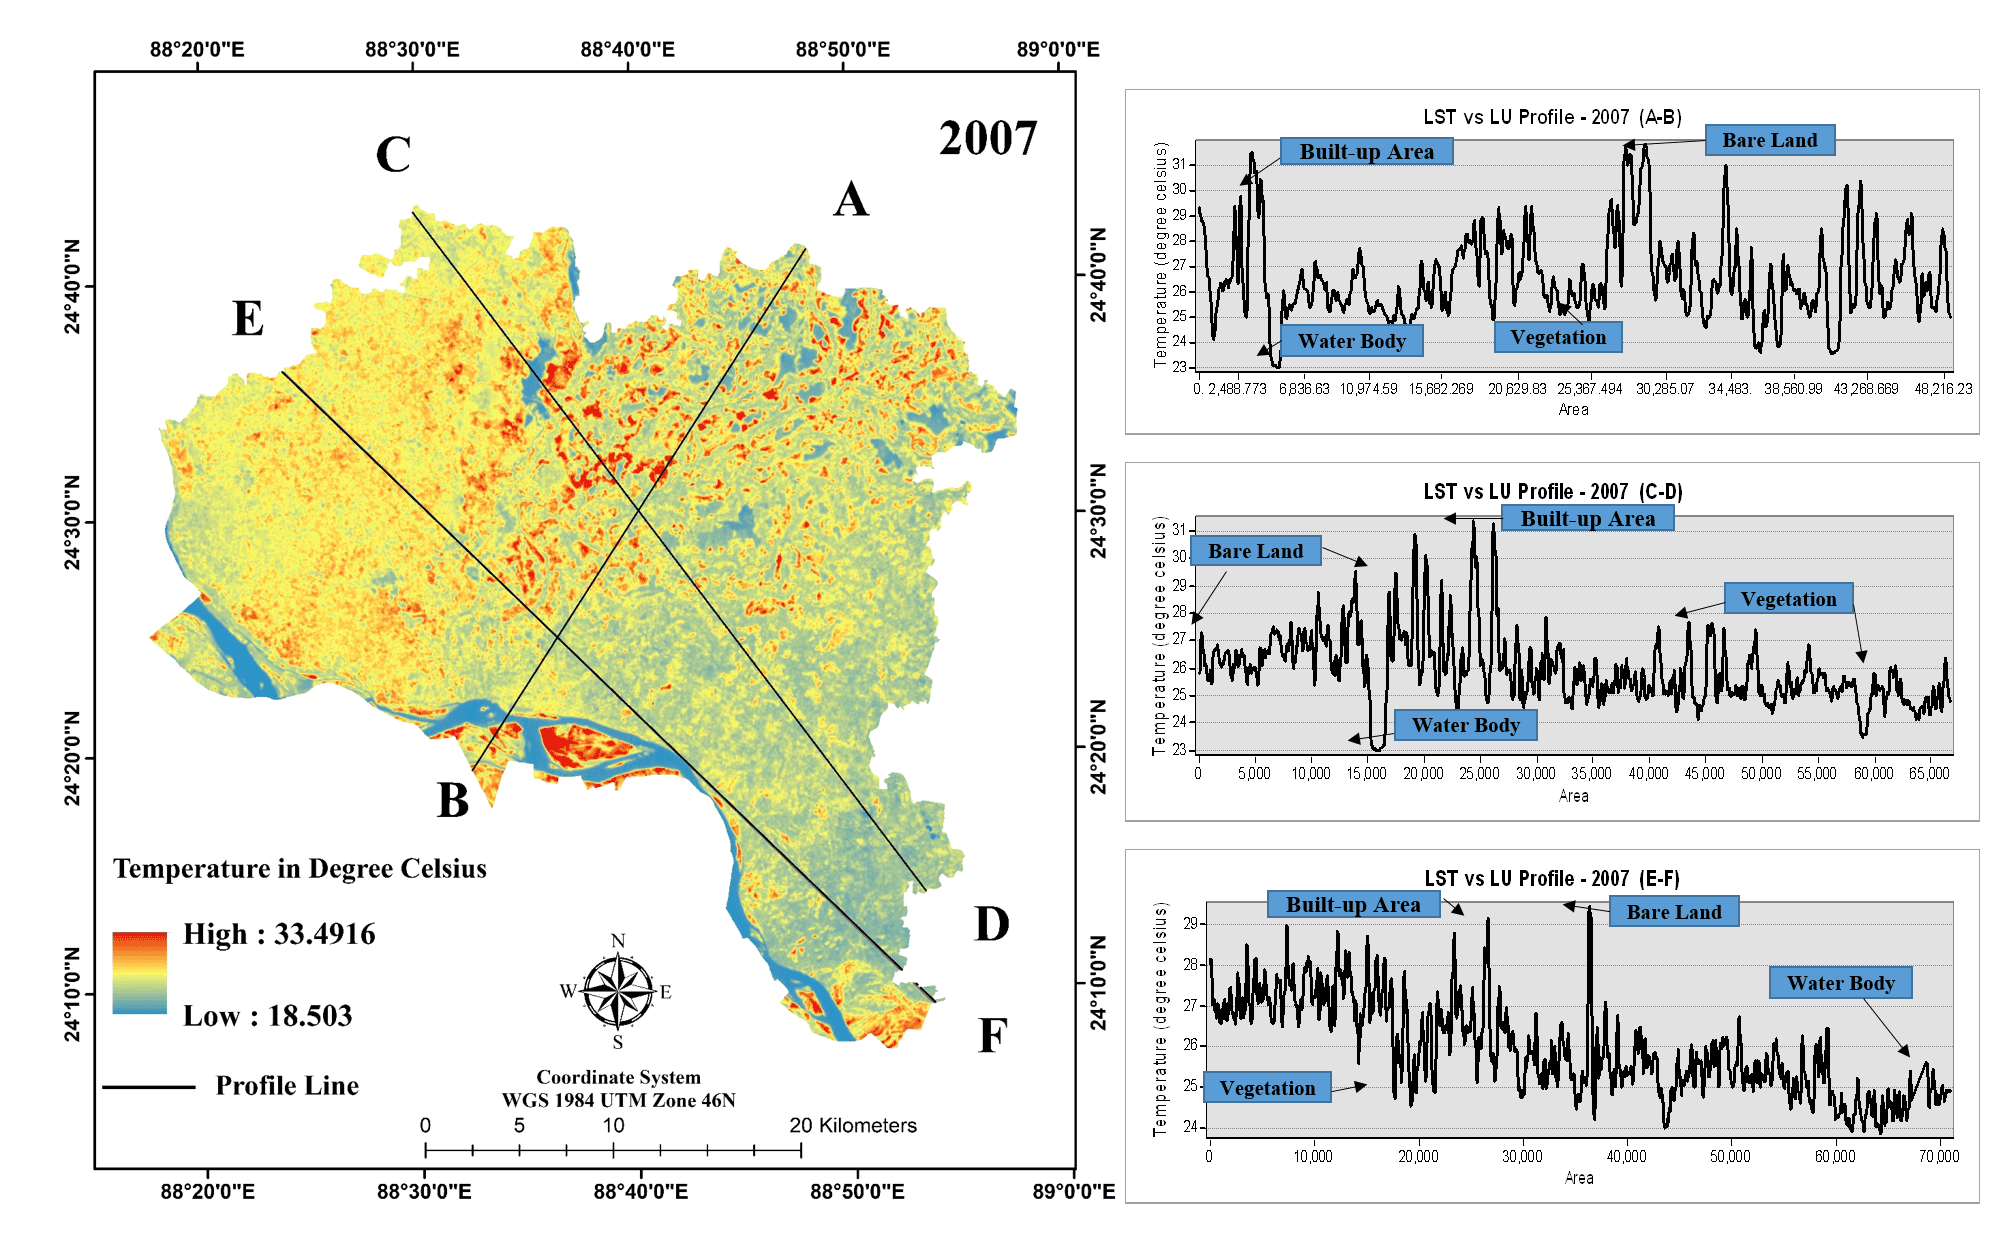
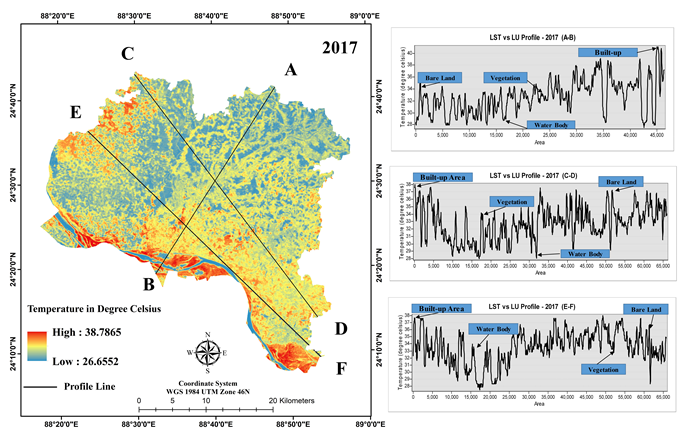
4.6 LULC Vs LST profiles
The emitted radiative energy from the surface of the ground, which includes rooftops, surfaces of pavement, vegetated area, bare soil and water, is recorded from the remote sensed LST. Three cross-sections were made across the study area to represent the LULC wise LST, and the average LST of each type of LULC (Figures 5, 6 and 7). Because of the higher concentration of LST values in Southern and Western zone two cross-sections (CD and EF) was made in a Southwest direction. From the profile it was found that urban core area with dominant built-up land experienced LST > 25 ºC in 1997, > 32 ºC in 2007, and > 38 ºC in 2017, respectively. Also, higher LST recorded > 24ºC, > 31ºC and > 36ºC for bare land in three different year cross-sections. Associate with the built-up area and bare land other two land use (water bodies and vegetation land) recorded the lowest temperature ranging from < 19ºC to <35ºC. According to Table 7, the minimum temperature recorded for year 1997 and 2017 in water bodies (18ºC and 26ºC) and for 2007 in vegetation and agricultural land (19ºC). Following that, the maximum temperature was recorded for the year 1997 and 2017 in built-up areas (25ºC and 38ºC) and for 2007 in bare land (33ºC).
Table 7. LULC and LST distribution
|
LULC
|
|
1997
|
2007
|
2017
|
|
Water body
|
Area (km2)
|
209.23
|
152.88
|
95.55
|
|
%
|
8.62
|
6.30
|
3.94
|
|
Min. Temp.(0C)
|
18.06
|
22.84
|
26.42
|
|
Max. Temp. (0C)
|
21.06
|
19.69
|
33.86
|
|
Built-up area
|
Area (km2)
|
498.33
|
662.97
|
838.88
|
|
%
|
20.52
|
27.31
|
34.55
|
|
Min. Temp. (0C)
|
22.06
|
32.85
|
35.03
|
|
Max. Temp. (0C)
|
25.38
|
33.35
|
38.78
|
|
Vegetation
|
Area (km2)
|
1228.43
|
1113.28
|
779.59
|
|
%
|
50.59
|
45.85
|
32.11
|
|
Min. Temp. (0C)
|
20.38
|
18.5
|
27.92
|
|
Max. Temp. (0C)
|
22.36
|
29.17
|
35.98
|
|
Bare soil
|
Area (km2)
|
407.19
|
417.97
|
659.54
|
|
.%
|
16.77
|
17.21
|
27.16
|
|
Min Temp. (0C)
|
23.81
|
29.15
|
36.12
|
|
Max. Temp. (0C)
|
24.62
|
33.49
|
36.37
|
5 . CONCLUSION
Based on the Landsat images of 1997, 2007, and 2017, we examined the trend of LULC changes and fluctuation of LST in Rajshahi district, Bangladesh. It was found that there was an increase in the urban area from 1997 to 2017 about 165 km2, where 188 km2 and vegetation area was lost. LST shows a rapidly increasing trend in city areas, while in areas occupied by water bodies shows less. In the last 20 years, highest LST was increased by 13ºC. 63% area was faced 34-35 ºC in the year 2017. It should be noted that rapid growth of urban area is the key driving process of LULC changes and subsequent rise in LST. Without a radical decentralization policy, however, it is difficult to prevent the rapid urbanization growth. A massive increase in LST can damage the human health and components of the ecosystem. The local government, urban planners and environmental engineers of Rajshahi can consider the rapid urban growth and the formation of LST based on the results in this study. The outcomes also provide the updated information and improved understanding for the urban planners in developing an inclusive policy for a city and make a city more comfortable and sustainable for the future.


 ,
Abdullah-Al- Faisal 2
,
Abdullah-Al- Faisal 2
 ,
Mahbubur Rahman 5
,
Mahbubur Rahman 5