Spatial characteristics of the watersheds located in Northeast Libya were analyzed in the study.
The seasonal runoff in the wadis during the rainy seasons is the surface water resource in the study area.
The outlets of the wadis mostly in the temporary lakes are topographically flat depressions located downstream.
Remote Sensing (RS) data sets: SRTM elevation data, Landsat 8 (OLI) imagery and Global Climate Monitor (GCM) data were used for the analysis.
Five land use land cover classes: alluvial plains, spreading zones, forest, Grassland and bare rock area were identified.
Abstract
The present study is to evaluate the spatial characteristics of the watersheds located in Northeast Libya, which is vital since the area is promising for surface water investment in rain-fed agriculture and pastoral activities. The study conducted using Geographical Information System (GIS) and Remote Sensing (RS) data sets: SRTM elevation data, Landsat 8 (OLI) imagery and Global Climate Monitor (GCM) data. SRTM data processed in ArcGIS, where elevations show a progressive decrease towards the South and eleven watersheds delineated (17721km2). Moreover, the perimeter, slope, aspect, and stream length of the watersheds also calculated. The hydrologic divide bounds the watersheds in the North delineated; it extends from the Southwest to the East with a length of 470km. Also, the outlets of the watersheds, which are mostly temporary lakes, those locally known as Balat assessed spatially. Landsat 8 imagery classified by Quantum GIS (QGIS), where five classes identified (alluvial plains, spreading zones, forest, grassland and bare rocks). Furthermore, precipitation and temperature data from the GCM was mapped, where the precipitation shows the highest rates in the North and gradual decrease to the South, unlike the temperature values indicate an increase towards the South and drop in the North.
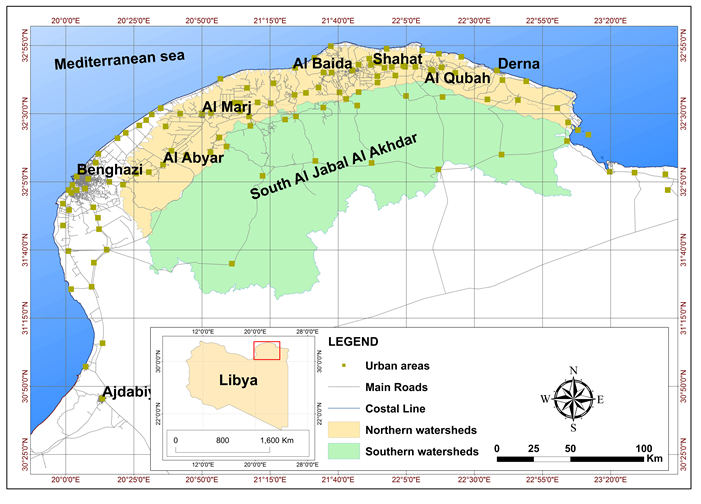
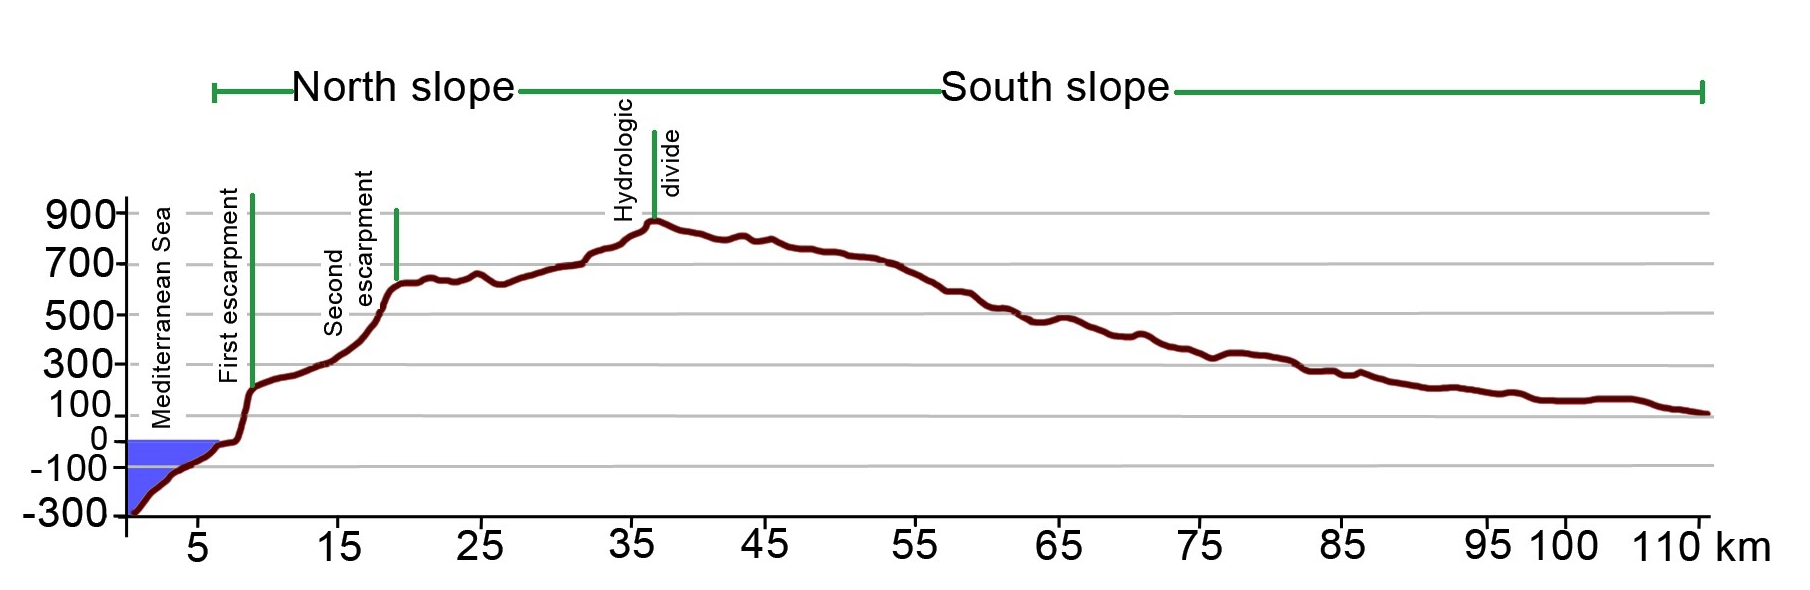
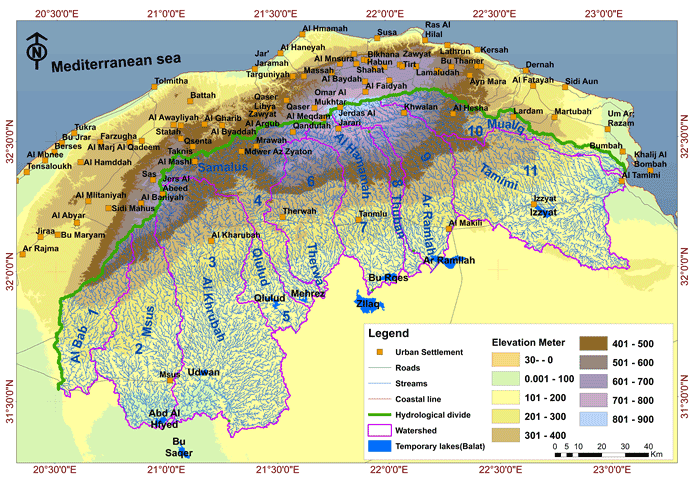
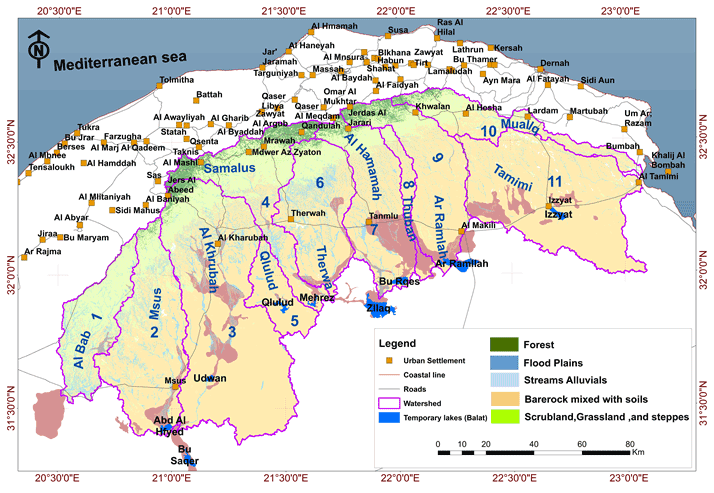
The study area located Northeast Libya, known as Al Jabal Al Akhdar (Green Mountain), as illustrated in figure 1, which is a crescent-shaped ridge reaching more than 875m above mean sea level in its central part as shown in the topographical profile (Figure 2). The Northern slope consists of two escarpments, divergent in the West but convergent gradually closer in the East direction; both escarpments are parallel to the Mediterranean seacoast. Also, the two escarpments dissected by several wadis, especially the second (Pallas, 1978). On the other hand, the Southern slope dips gradually toward the South. The hydrologic network Al Jabal Al Akhdar reflects the morphological features that divided into the Northern watersheds those flows to the North, which are short and profoundly cut and reach the sea after a few tens of kilometers, and the Southern watersheds those flows to the South, which are long, wide, and flat. They progressively disappear as valleys and become large spreading zones at the Southern breaking slope of Al Jabal Al Akhdar (Hamad, 2005).
Figure 1. Study area
Figure 2. North-South profile (SRTM data)
2 . STUDY AREA
2.1Geology
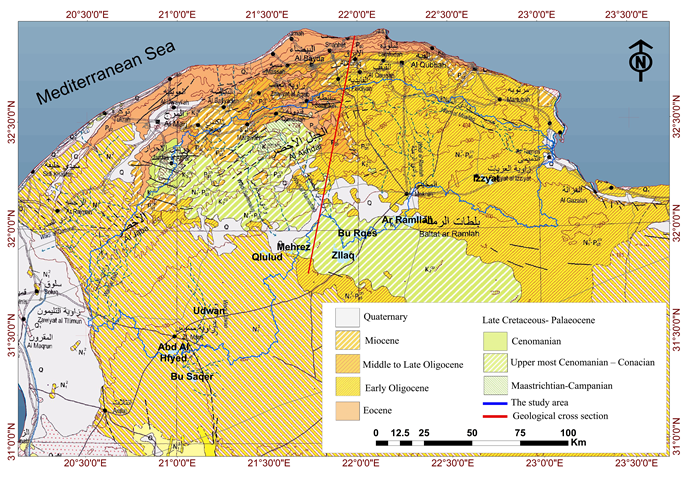
The exposed geological formation in the study area, mainly consisting of marine carbonate rocks from late Cretaceous age to Quaternary, as shown in the geological map (Figure 3). The late Cretaceous outcrops only distributed in the Northwest of the study area. While the Tertiary formations partially outcrop under thick, widespread Quaternary deposits cover in the whole study area. Based on a previous surface geological survey carried out by IRC in (1974), these formations described in summary as following:
Figure 3. Geology (IRC, 1974)
a) Late Cretaceous- Paleocene
The oldest formations outcropping in the northwest of the study area of Cenomanian to Paleocene (Danian) ages, where the following succession identified:
Qasr Al Abid Formation (Cenomanian)
Consist of greenish marl, glauconite, and pyrite, where only the upper part is outcropping with a thickness of more than 40m.
Al Baniyah Formation (Uppermost Cenomanian – Conacian)
It is represented by thick beds of limestone and dolomitic limestone intercalated frequently with marls and marly limestone in the upper part, with a thickness of more than 500m.
Al Majahir Formation (Campanian)
Consist of a sequence of marly limestone, microcrystalline limestone, and dolomitic limestone that interlayered with marl and calcareous clay, with thickness, ranges from 80 to 200 m.
Wadi Dukan Formation (Maastrichtian).
Consist of hard grey to brown dolomite crystalline to microcrystalline intercalated with porous dolomitic limestone in the upper part, with thickness ranges from 50 to 150m, which increase towards the Southwest of the study area.
b) Quaternary
The Quaternary deposits exposed in the whole study area, and consist of ancient and recent alluvial deposits.
2.2 Water Resources
The seasonal runoff in the wadis during the rainy seasons represents the surface water resource in the study area. Some of the runoff captured by water harvesting structures and used for domestic purposes, and some infiltrate into the groundwater, and the rest evaporates. Groundwater resource is the essential source for domestic and agriculture uses, where two main aquifers identified by (Franlab, 1978) and (GWA, 2006):
Upper cretaceous aquifer
The aquifer consists of dolomite and dolomitic limestone and characterized by a good quantity and quality of water, with thickness varies from 50 to 250m, distributed spatially in the Northern parts of the study area.
Tertiary Aquifer
The aquifer spatially distributed in the middle and southern parts of the study area and consists of carbonate rocks, dolomitic limestone, and dolomite in the Kharubah area and calcarenite limestone, while in the Makhili area consists of argillaceous limestone intercalated with evaporates, gypsum and halite.
Libyan secretariat of agricultural and land reclamation under the Executive Authority for Al Jabal Al Akhdar contracted with consultants to carry out several studies during the seventies. Frnlab French consultant carried out two phases of studies. The first phase was for collection, analysis, and interpretation of the preliminary data during 1974. The second phase carried out in (1976) the detailed study for groundwater by drilling exploratory wells and characterizing the groundwater in the region to determine the promising areas for groundwater abstraction for agriculture, where the irrigation scheme, economic feasibility, and soil the study conducted by C-Louti in 1977. Regarding surface water, Frnlab (1974) delineated the watersheds using the United States Geological Survey (USGS) topographic maps produced by in 1963, and conducting hydrological measurements during the period (1974-1976) leading to the identifications of the optimal locations for 27 selected dams in the area, those still not constructed yet. Moreover, Arlab Consulting Engineers contracted in (1982) with the Executive Authority for the supervision of drilling of production wells and piezometers and further groundwater studies. Also, the contract includes the complementary investigation of surface, groundwater, and climatological survey. Another work conducted by SWECO in (1986) regarding pasture land mapping for about 550,000 hectares. In 2004 several production water wells drilled for grazing and other purposes in the period of 2001-2007 (Hamad, 2008). The main focus for investment in water resources lies in the groundwater, which led to improper management and no property for the available surface water, which causes uncertainty for the surface water due to the scarcity of hydrological data. The exploitation of surface water is limited only to a few structures designed to collect rainfall from small catchment areas. These types of structures since ancient times built on moderate slopes or in low-lying positions in which the precipitation collected from catchment areas by a low rock or concrete walls which direct it into impervious underground storage compartments offered an essential source of water for human and livestock consumption. Although, many of these retention structures are old and some of them built more recently. The capacities of most of the structures are a few cubic meters. And recently, a few reservoirs of reinforced concrete constructed which are considerably larger, with capacities of up to 4,000 cubic meters. Also, the local communities made control of surface runoff water in wadis and depressions where cultivation practiced. The application is generally in the form of low retention walls or gabions built across wadis and depressions to give some control over the flood flows and improve water use for domestic use, agriculture and livestock. These structures result in larger areas being flooded for more extended periods, thereby increasing the area suitable for cultivation and improving yields, also reduce the water erosion.
Since the studies are scarce after the earlier mentioned work carried out in the area, therefore there is a need for essential knowledge background for the watersheds, which is crucial for better watershed planning and management. Furthermore, the assessment of the spatial characteristics is a cornerstone for the hydrologic studies and watersheds management. Therefore, this research aims to conduct a spatial study using the GIS techniques with RS data in order to delineate the watersheds and extract their spatial characteristics, land cover types, and the pattern of the principal climatic elements the precipitation and temperature.
3 . METHODOLOGY
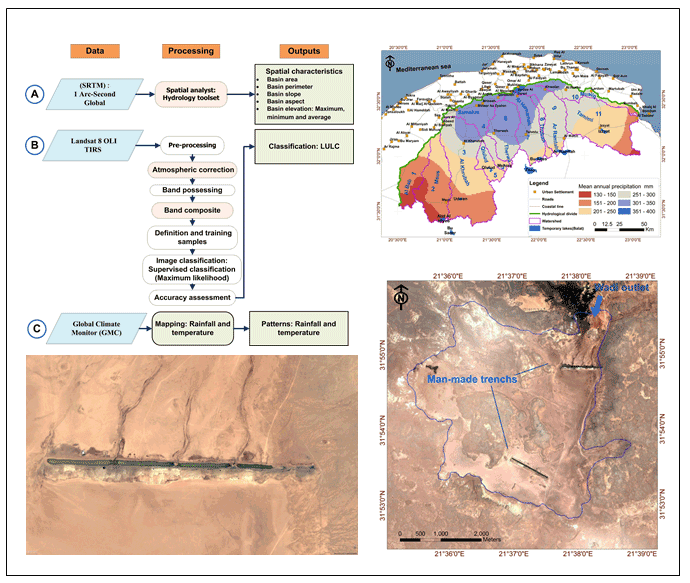
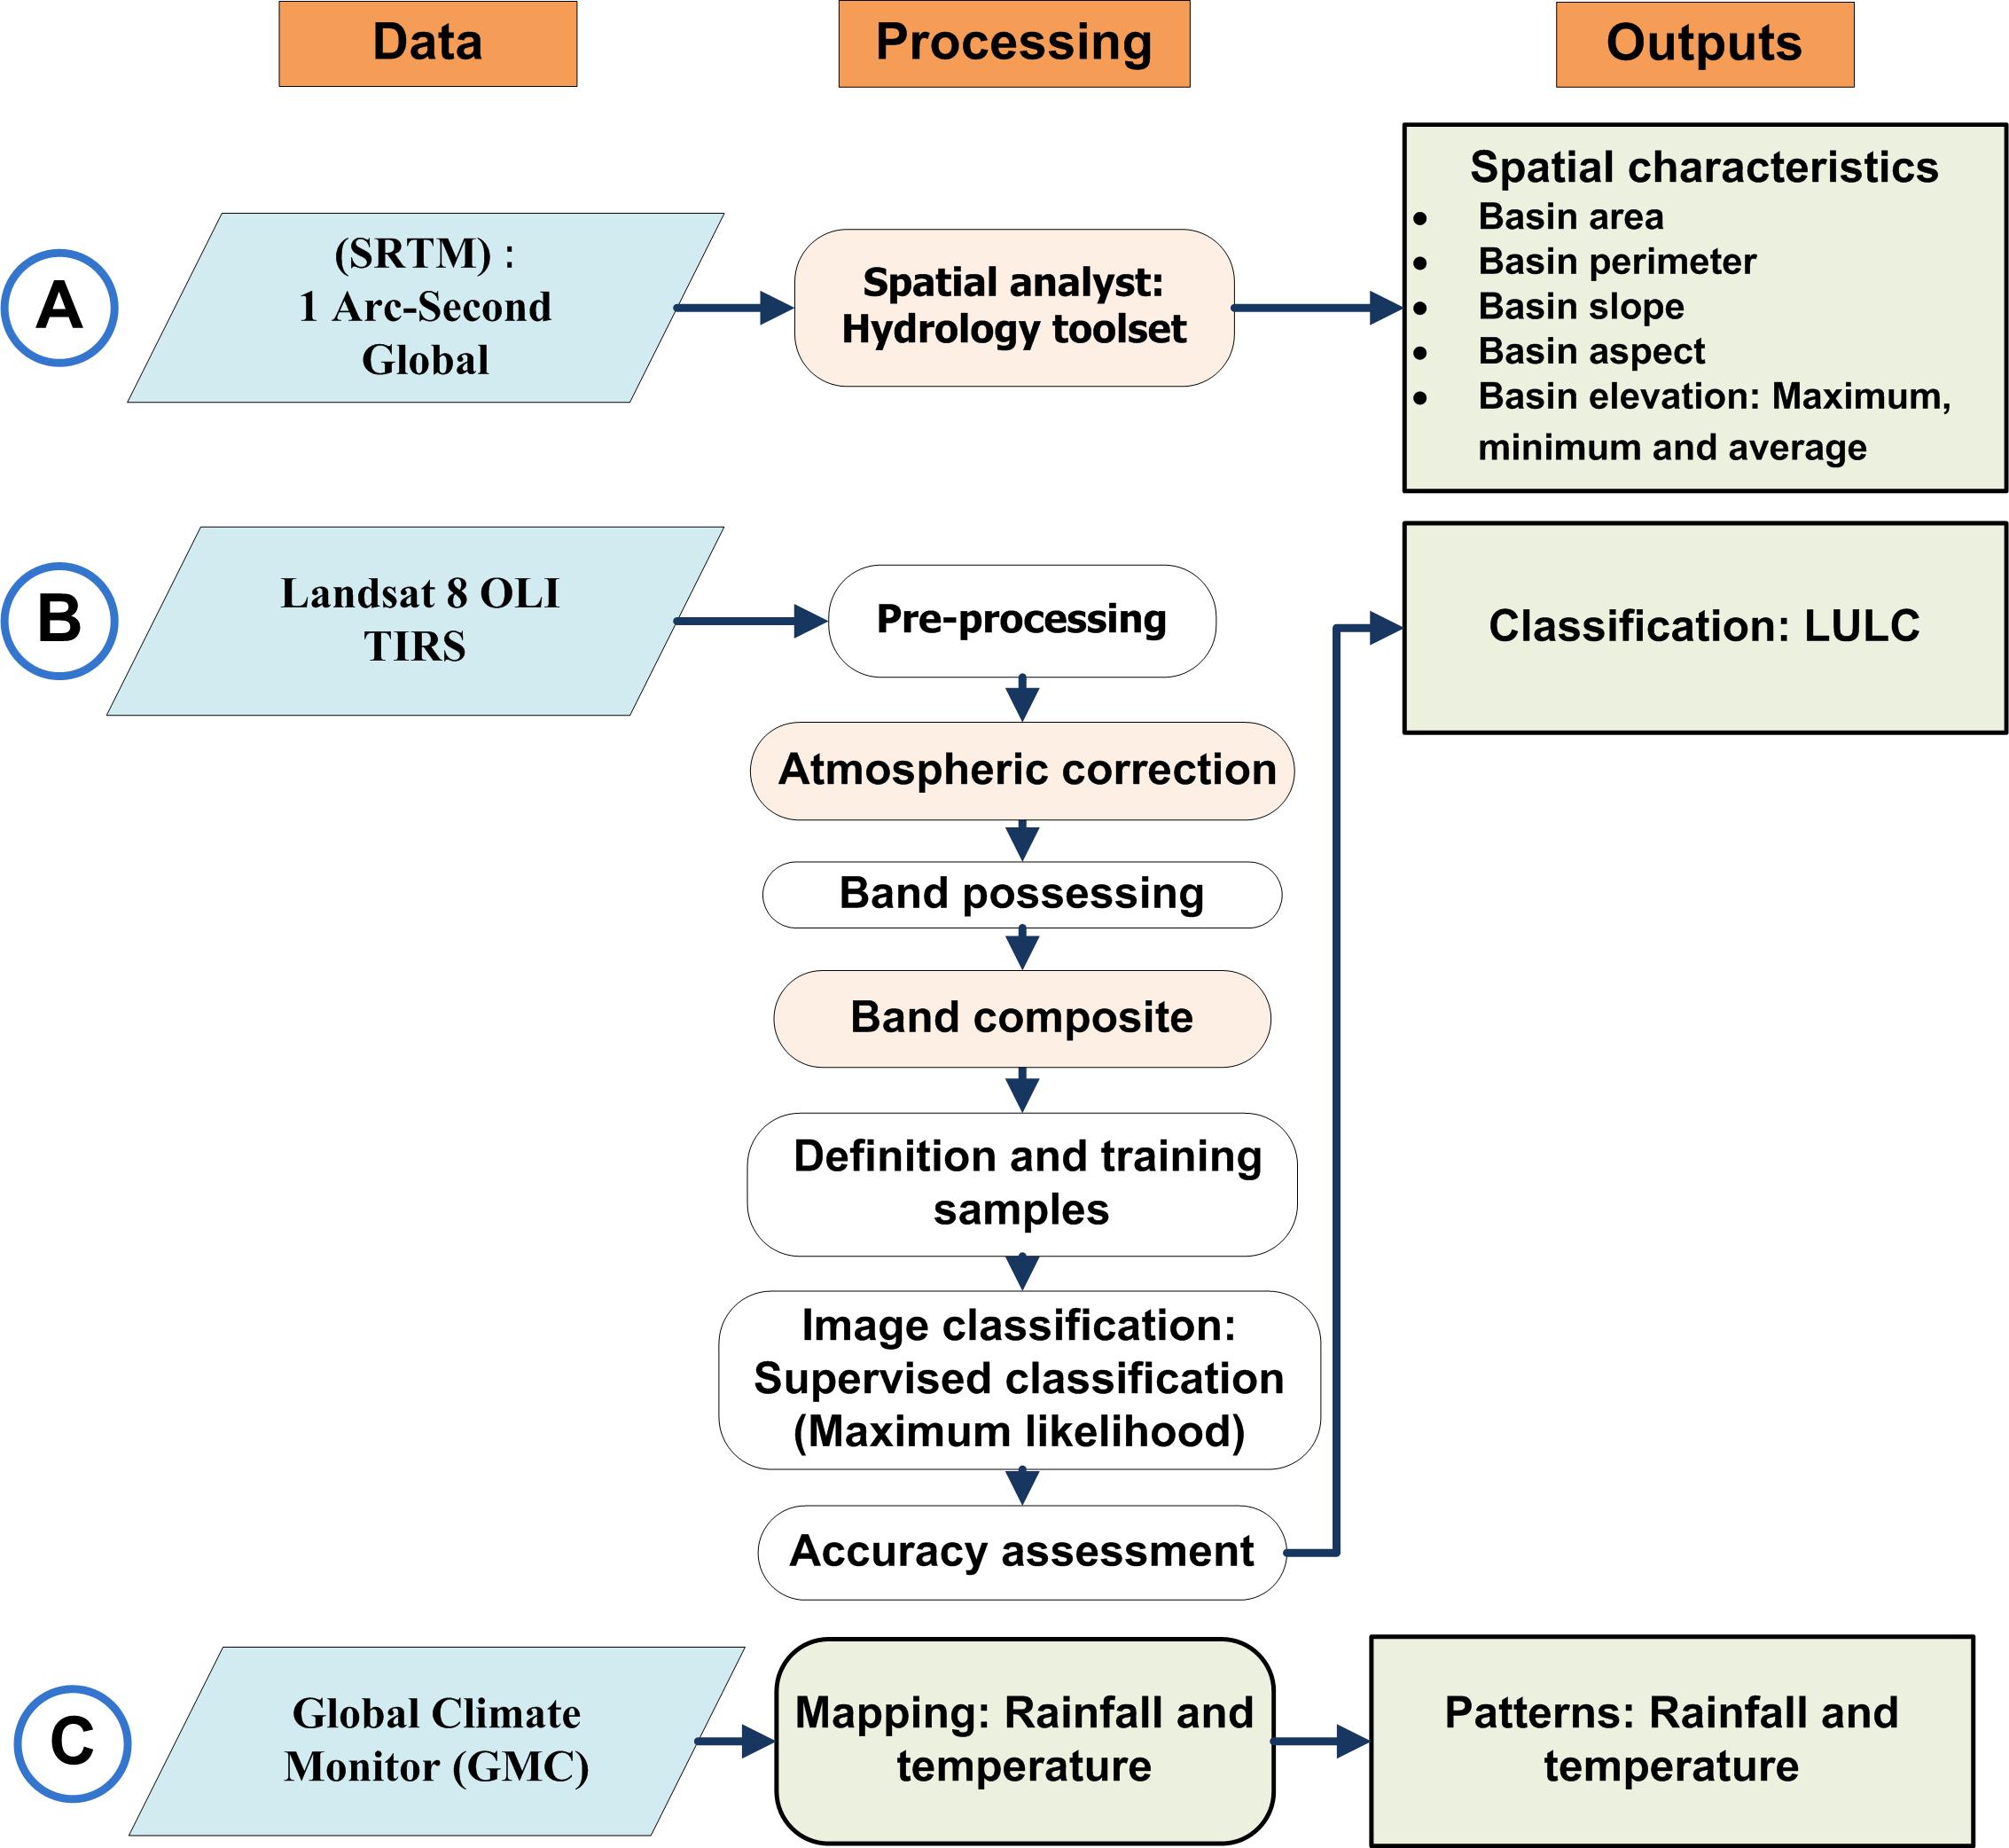
The research methodology summarized as in figure (Figure 4) based on the data given in table 1. The watershed delineation conducted using the hydrology toolset in the software, ArcGIS Spatial Analyst extension. The tool offers elevation data processing to delineate watersheds, create stream networks through sinks identifications, and flow direction determination, and flow accumulation calculation, in addition to morphometric parameter computation and hydrologic analysis (ESRI, 2018). The hydrology toolset used the digital elevation model (DEM) data from Shuttle Radar Topography Mission (SRTM) available at the USGS Earth Resources Observation and Science (EROS).
Figure 4. Methodology
Table 1. Data
Data
Metadata
Digital elevation Model (DEM)
SRTM [Shuttle Radar Topography Mission]
Spatial resolution: 30 m
C-band wavelength: 5.6 cm
Satellite images
Landsat 8 OLI [Operational Land Imager] and TIRS [Thermal Infrared Sensor]
Resolution: 15 - 30m, multispectral.
Paths: 182, 183, 184
Rows: 37, 38
Dates: (07/01/2018 to 09/30/2018)
Precipitation
Tempreture
Global Climate Monitor
Resolution: 0.5 degree
Period: 2007- 2018
Moreover, the resultant features processed with spatial analyst tools in ESRI ArcGIS to extract their spatial characteristics. Land cover classification conducted using Landsat 8 OLI [Operational Land Imager] products that processed in Quantum GIS (QGIS) software using Semi-Automatic Classification Plug-in (SCP), which open-source plugin for QGIS that conduct semi-automatic supervised and unsupervised classification for remote sensing images. Also, it provides several tools for the pre-processing of images, the post-processing of the classifications, and the raster calculation (ESRI, 2018). The land cover layer produced according to step-B (Figure 4). The pre-processing was conducted by using DOS1 for atmospheric correction and supervised classification was performed using Maximum Likelihood (ML) classification algorithms. The accuracy was assessed by Semi-Automatic Classification Plug-in (SCP) accuracy tool with the help of ROIs using stratified random points. Also, the SCP accuracy tool provides the error matrix (Table 4).
Climatic data for the study area is very scarce, due to no periodical measurements, concerning some available measurements, conducted in short periods collected during the time of the earlier studies mentioned above. Therefore, this research uses the precipitation and temperature data from global climate monitor (GCM) which is a platform handle global climate data, where it offers the access to climatic information from 1901 to the date; also, it is an open-source project developed by the University of Seville Climate Research Group (GCM, 2019).
4 . RESULTS AND DISCUSSIONS
The result of the elevation data processing, which is illustrated in figure 5 and the spatial characteristics in the table 2 and table 3. The overall areas of the watersheds are 17721 km2. The hydrologic divide, which that bound the watersheds in the North delineated, where its length computed as 47075km, extends from the Southwest to East. The delineated watersheds classified based upon the areal extent according to (Singh, 1994) as basins excluding Thuban, which considered a watershed. The slope in the Northern parts, which is the head of water zones, prevails moderate slopes, while in the middle, the transitional zones prevail low slope values and very low in the deposition zone. The aspect ratio for all the watersheds is facing Southeast direction, except Muallq and Tamimi watersheds those facing East directions. Also, it was evident from the layout of the watersheds the influence of the upper Cretaceous and Tertiary tectonic events that were dominant in the study area, in addition to the impacts of the climatic processes, which induced the weathering, and erosion processes of the geologic formations.
Figure 5. Delineated watersheds of the southern Al Jabal Al Akhadar
Table 2. Spatial characteristics
Name
Area km2
Length( Km)
Perimeter (Km)
Minimum
Elevation (m)
Maximum
Elevation (m)
Average
Elevation (m)
Average
Slope (deg)
Average
Aspect
Stream Lengths (km)
Al Bab
1082.0
74
332
98
603
276
3.4
157°
1537
Msus
2039.0
90
416
44
644
212
2.5
134°
4083
Al Khrubah
3928.0
105
599
63
670
222
2.3
124°
7982
Samalus
1511.0
87
512
139
775
419
3.6
149°
2763
Qlulud
569.0
45
216
140
303
188
2.2
119°
1150
Therwa
1484.0
67
309
141
736
364
3.7
151°
2891
Al Hamamah
1522.0
78
354
124
832
364
3.6
149°
2914
Thuban
301.0
65
251
125
762
382
3.8
148°
572
ArRamlah
1559.0
81
364
131
880
427
3.1
140°
2990
Muallq
869.0
109
426
-6
852
417
3.3
106°
1631
Tamimi
2857.0
79
491
-2
464
220
2.2
112°
7241
Table 3. Spatial characteristics of the temporary lakes (Balat)
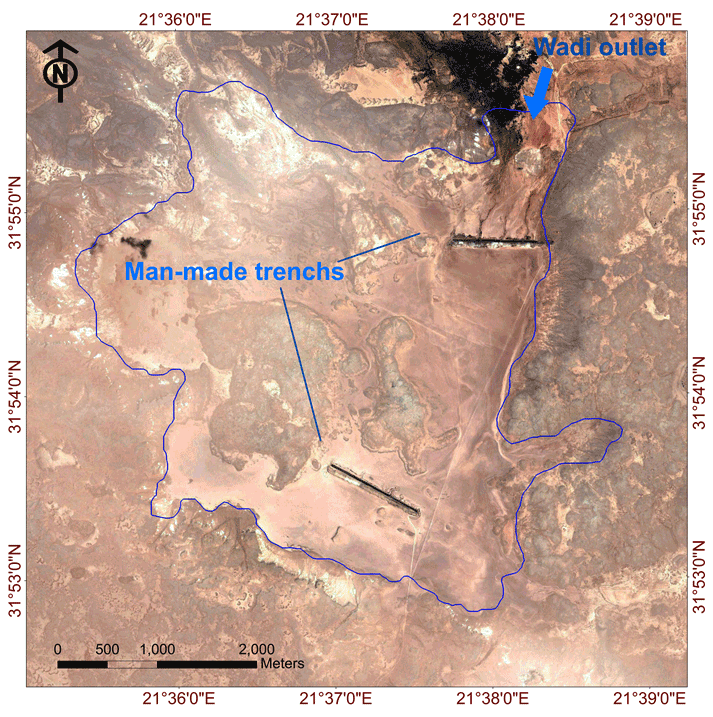
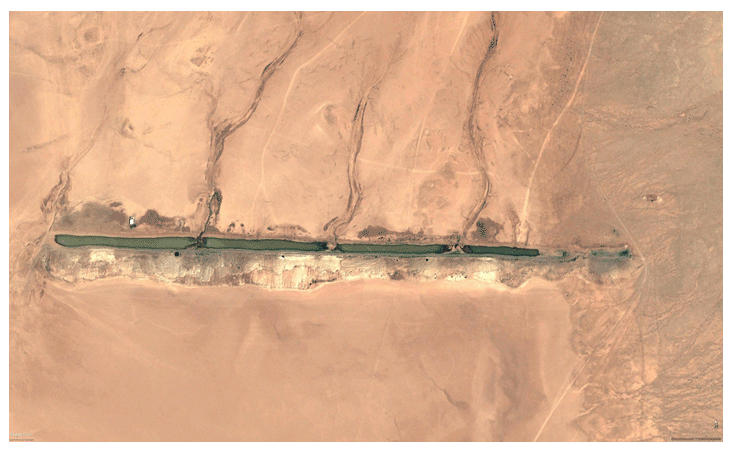
Furthermore, stream lengths calculated for all the watersheds, which are 35757.8km. The streams in the study area can be defined according to (EPA, 2008) as ephemeral those flows shortly due to the direct response to rainfall events in the immediate surrounding area and its channel always above the groundwater aquifer. Moreover, a large number of wadis in the upstream of the watersheds are remarkable, which decreased southward and become braided in some localities in the midstream, and downstream. The outlet of the wadis mostly in the temporary lakes, those locally known as balat, which are topographically flat depressions areas located downstream. The spatial characteristics of the balat are shown in table 3, where the balat are vital areas for grazing, in which the surface water during the rainy season harvested by manmade trenches which is one of the prevailing water harvesting techniques in the region for collecting and storing water during the rainy seasons to be used for watering during the dry periods, as in the figures 6 and 7 and the trench generally about 1km long with 40m wide, and reaches about 5m in depth in the middle.
Figure 6. Mehrez temporary lake (Google Earth image, 2019)
Figure 7. Aerial view of manmade trench in Balat Mehraz (Google Earth image, 2019)
Table 4. Accuracy assessment
LULC
Producers’ accuracy (%)
Users’ accuracy (%)
Alluvial Plains
68.8
71.1
Spreading Zone
77.8
81.5
Forest
71.4
77.4
Grassland and steppes
87.9
81.3
Bare rock
94.7
95.6
Overall accuracy (%)
0.9
Kappa Coefficient
0.8
Table 5. Land use land cover
Wadi
Alluvial Plains (km2)
Spreading Zone
(km2)
Forest (km2)
Grassland and steppes (km2)(km2)
Bare rock (km2)
Al Bab
28
157
2
690
205
Msus
93
520
18
218
1190
Al Khrubah
361
254
51
511
2751
Samalus
45
90
279
655
442
Qlulud
27
23
0
13
506
Therwa
88
197
18
311
870
Al Hamamah
115
333
10
250
814
Thuban
78
11
0
51
161
ArRamlah
127
36
102
301
993
Muallq
13
40
37
386
393
Tamimi
263
57
0
57
2480
Land cover classification processed for accuracy as in table 4 and the land cover map produced (Figure 8), also the area of each land cover class computed, as shown on the table 5. The land cover consists of five classes which can be described as in the following:
Figure 8. Land use land cover
Alluvial plains
Flat areas formed as a result of erosion due to weathering and runoff, as the sediment from the upstream, transported to the lower plain composed mainly of ancient alluvial deposits that consist of silt, sand, clay and gravel.
Spreading zones
Mostly located on the banks of the wadi channel and consisting of recent alluvial sediment of silt, sand, clay, and gravel.
Forest
Forest consists of dry Mediterranean woodlands, which limited only to the Northern parts of the study area and consist mainly of cypress Juniper (Juniperus spp.), Cypress (Cupressus spp.), Pinus (halepensis spp.) and Ilex (Ilex spp.) and other trees.
Grassland and steppes
It consists of plant communities of dwarf shrubs, grasses and annual herbs sparsely distributed in the study area.
Bare rock
Bare rock consists of consolidated and non-consolidated marine carbonate formations that range in age from late Cretaceous to Quaternary.
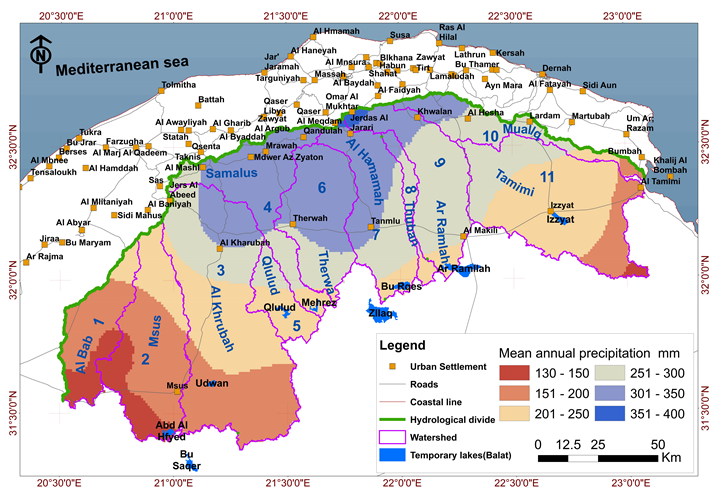
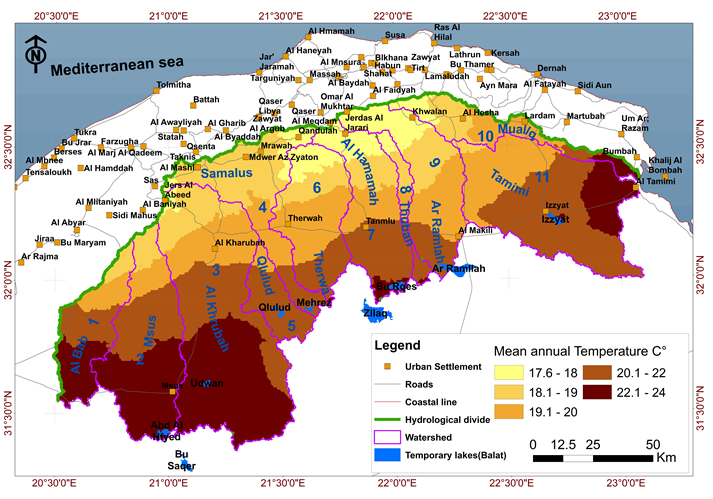
Climate in the study area classified as a semi-arid climate in the North and as an arid climate in the South (Hamad, 2008). Average annual precipitation from 2008 to 2018 (Figure 9) shows the highest rates of rainfall in the Northern parts that gradually decreased to the south direction, while the precipitation mainly occurs from October to March and April. Also, the distribution and amount of rain showed great differences between years; during the rainy season, sudden and robust runoff flows to the temporary lakes. The runoff is mostly lost by the evaporation due to higher temperature (Figure 10), the mean annual temperature, which shows the increases of temperature southward. The coldest January temperature is 8-12°C. The highest temperatures occur from June to August, with maximum temperatures over 40°C. The mean July temperature is 22-26°C.
Figure 9. Mean annual precipitation (2008-2018)
Figure 10. Mean annual temperature (2008-2018)
5 . CONCLUSIONS
The South of the Al Jabal Al Akhdar area assessed spatially, where the results show large and wide watersheds with low and moderate slopes. The land cover assessment shows only the Northern parts covered with forest, while the most are barren lands intercalated with alluvial plains, spreading zones, grassland. The watersheds receive a considerable amount of precipitation, which small quantities harvested or naturally recharged to the groundwater aquifers. Unfortunately, the rest unallocated and appropriately invested, as most of the rainfall lost by evaporation because of the high-temperature in the South parts of the study area. Moreover, the remain of runoff goes to the sudden floods that occur annually leading to natural disasters that cause human and economic losses, in addition to soil loss by erosion and transport from the North to the South as its noticed from the land cover map, where this loss will lead to degradations in the Northern parts of watersheds. Finally, the study area very vital, especially for pastoral activities, also promising in surface water investment rainfed agriculture, but the watersheds require further detailed studies for the morphometric and hydrological characteristics. Although these studies rely on data, which are scarce in the study area, earth observation satellite data are adequate with the support of ground-truth.
Tables
Figures
Conflict of Interest
The author hereby declares no conflict of interest.
Acknowledgements
The author would like to thank the staff members of the New Libya organization, especially Mr. A. Arhuma, for providing GIS facilities and also special thanks to Dr. Murad Aburas, Miss. Sara Almabruk and Miss. Safa Tarbah for his valuable comments those greatly contributed to the improvement of the manuscript.
Abbreviations
DEM: Digital Elevation Model; EROS: Earth Resources Observation and Science; ESRI: Environmental Systems Research Institute; GCM: Global Climate Monitor; GIS; Geographical Information System (GIS); GWA: General Water Authority; IRC: Industrial Research Center; LULC: Land Use Land Cover; ML: Maximum Likelihood; OLI: Operational Land Imager; QGIS: Quantum GIS; RS: Remote Sensing; SCP: Semi-Automatic Classification Plug-in; SRTM: Shuttle Radar Topography Mission; TIRS: Thermal Infrared Sensor.
References
1.
Arghin, S. S., 1980. Hydrogeology of El Marj basin. MSc Thesis University of Nevada Reno USA.
2.
Arlab Consulting Engineers, 1982. Supervision of drilling water wells in South Al Jabal Al Akhdar Area. Executive Authority of Al Jabal Al Akhadr-Libya. Unpublished report.
3.
C-Louti (Italian consultant), 1977. Soil investigation and irrigation network design in South Al jabal Al Akhdar Area. Executive Authority of Al Jabal Al Akhadr-Libya. Unpublished report.
Franlab (French consultant), 1974. Water resource study of the Southern Flank of Al Jabal Al Akhdar., Phase I. Executive Authority of Al Jabal Al Akhadr-Libya. Unpublished report.
8.
Franlab (French consultant), 1978. Water resource study of the Southern Flank of Al Jabal Al Akhdar., Phase II, Executive Authority of Al Jabal Al Akhadr –Libya. Unpublished report.
GWA [General Water Authority] Libya, 2006. Water Statues of East Libya.
11.
Hamad, M. S., 2005. Delineation of South Al Jabal Al Akhdar CatcmentArea. General Water Authority. Unplished report.
12.
Hamad, M. S., 2008. Spatial analysis and interpretation of groundwater levels and hydrochemistry in south Al Jabal Al Akhdar. Master thesis. Salzburg University- Austria.
13.
IRC [Industrial Research Center], 1974. Startigraphic Lexicon of Libya, 300.
14.
Pallas, 1980. Water resources of the socialist people’s Libyan Arab Jamahiriya. The geology of Libya-second symposium on the geology of Libya, held at Tripoli, September (12-16), 1978, 539-593, Academic Press.
15.
Singh, V. P., 1994. Elementary Hydrology. Prentice Hall of India Private Limited, 377-406.
16.
SWECO, 1986. Land Mapping and Pasture Survey of the South Al Jabal Al Akhdar area, South Al Jabal Project (SJP). Unpublished report.