Abstract
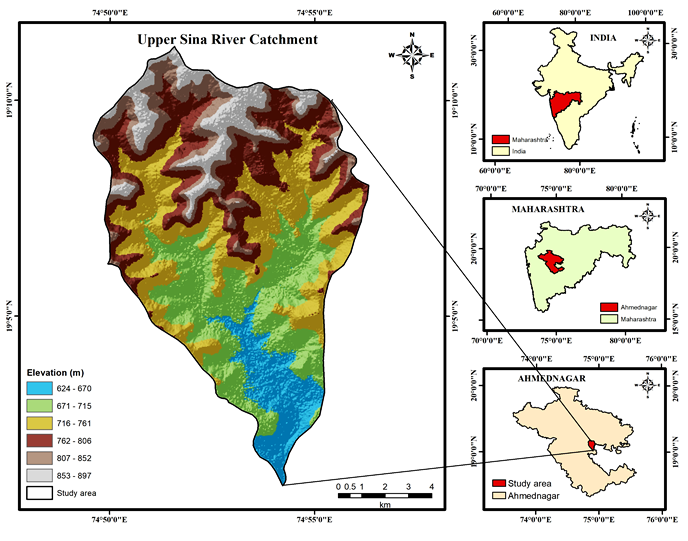
The site suitability for construction of water conservation structures is an important step towards groundwater conservation in arid and semi-arid regions. Water is the most crucial for maintaining an environment and ecosystem which is helpful to sustaining all forms of the life. The increasing water scarcity day to day has been one of the common problems over a period of time. On top of it, when the area is a part of rain shadow zone like Ahmednagar district, water conservation activities are become more important. The present study aims to identify the suitable zones for water conservation activity. Multi- criteria evaluation is carried out using Geographic Information System (GIS) techniques to help the choice makers in defining suitable site for construction of water conservation structures. Different layers which were considered for multi-criteria evaluation: slope, land use land cover, soil texture, lithology, soil depth, soil erosion, wells, lineaments and drainage network. Analytical Hierarchy Processes (AHP) is used for weighted sum to find suitable sites for implementation of water conservation activity using selected criterions. The site suitability map was classified into four classes: highly suitable, moderately suitable, less suitable and not suitable with area of 19.19%, 26%, 49.03% and 5.78, respectively. This map will help for selection of suitable sites for construction of Mati Nala Bund (MNB), Check Dam, Cement Nala Bund (CNB) and Continuous Contour Trenches (CCT) for conservation of groundwater resource in the region.
1 . INTRODUCTION
Water storage is the insurance for feature and acts as a barrier against the variability of the rainfall in different region and therefore increases the resilience of the sponsor against dry spell during the rainy season (Payen et al., 2012; Kumar et al., 2017). Groundwater conservation is critically depending on the sources of water, climate change and degradation of land (Kadam et al., 2017). This study was focused on selecting the suitable sites for construction of water conservation structures. Furthermore, it will be helpful for planning and monitoring the water conservation activities, i.e. Continuous Contour Trenches (CCT), Cement Nala Bund (CNB), Loose Boulder Structure (LBS) and Check Dams using AHP. Multi-criteria decision making (MCDM) refers the alternatives based on the human decision from a finite set of parameters in terms of the multiple criterions (Roszkowska, 2013). This technique also used for land suitability analysis (Zolekar and Bhagat, 2015; Zolekar, 2018) and watershed prioritization for development (Gaikwad and Bhagat, 2017; Kadam et al., 2019). Multi-thematic geospatial datasets of Upper Sina river catchment was used for the site suitability analysis for water conservation using AHP and GIS techniques. The criterions used for analysis are: land use land cover (LULC), stream network, slope map, lineament map, soil depth, soil erosion, soil texture, soil depth and other appropriate results by forming geospatial queries on spatial information to form maps to present the outputs of all the operations (Mukhopadhaya, 2016). These techniques of site suitability analysis require measurements that are to be regenerated to values which are common and converted into ease out of the final selection of the sites (Bunruamkaew et al., 2011; Kadam et al., 2012, Mukhopadhaya, 2016, Kadam et al., 2017). The thematic maps and their weights were combined in GIS environment to prepare final output map for potential suitable site (Lohar et al., 2018; Anbazhagan et al., 2005; Varade et al., 2017). This study focuses on mainly to find out suitable sites for construction of water conservation structures using GIS techniques. The data analysis was done using several GIS tools like spatial analysis, density tool, conversion tool and ranking method. The purpose this study is to find suitable locations for construction of conservation measures for reducing runoff and soil deposition in conservation structures in downstream zones.
3 . METHODOLOGY
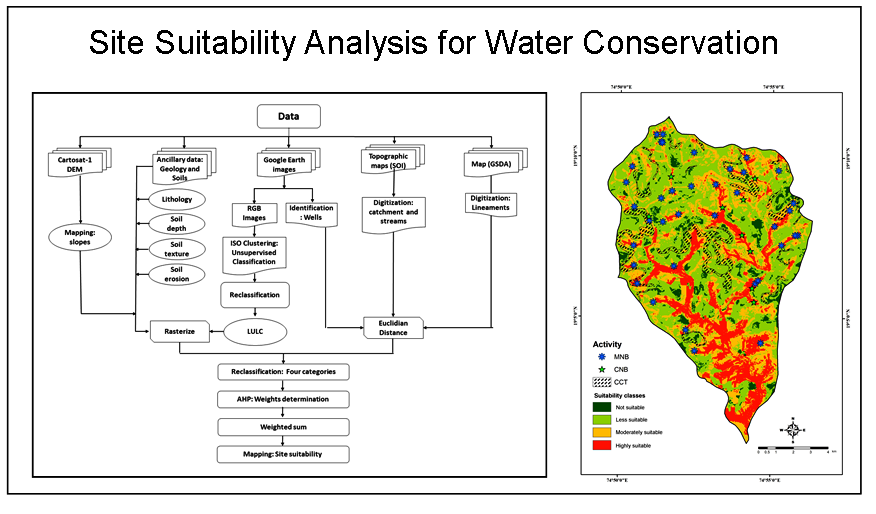
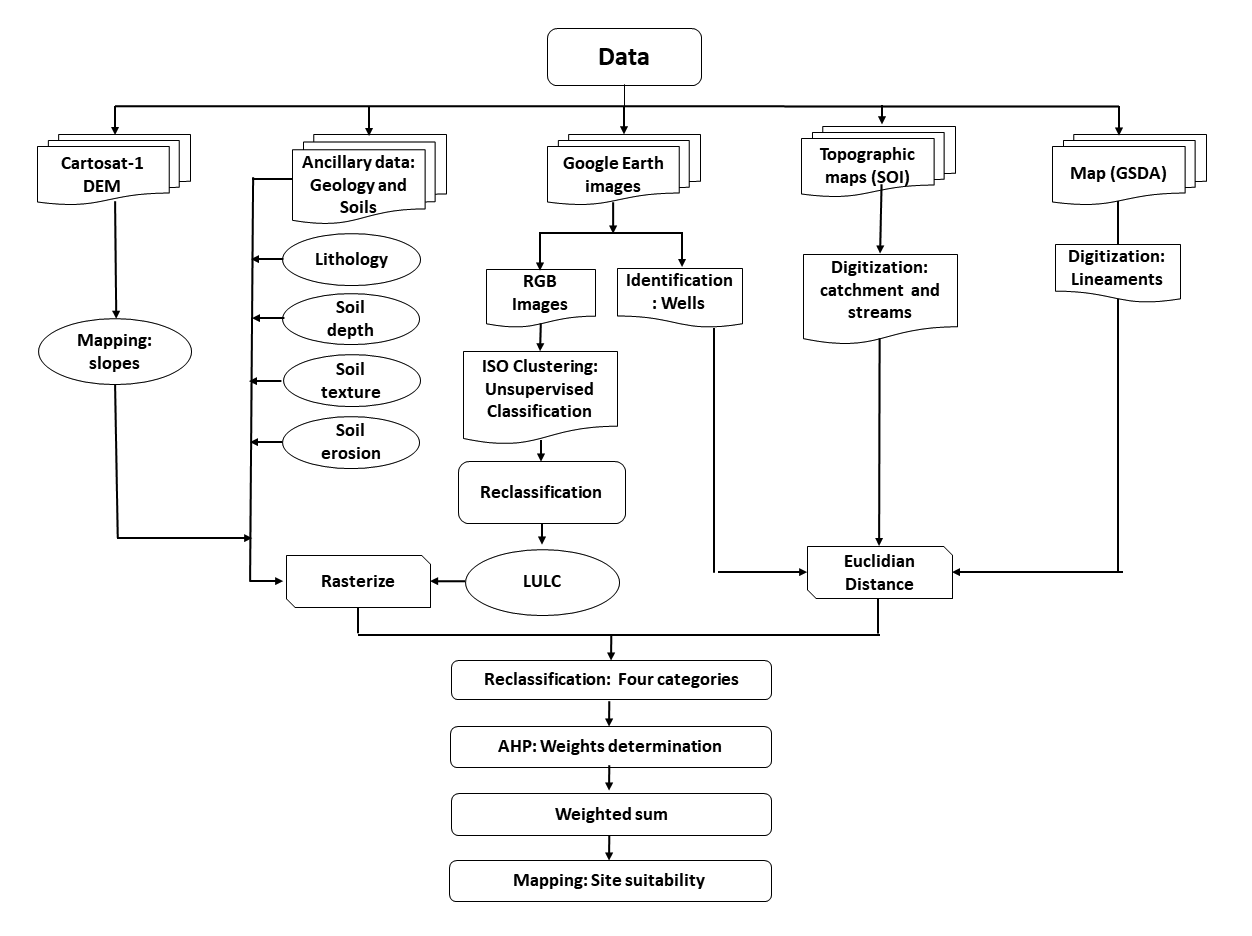
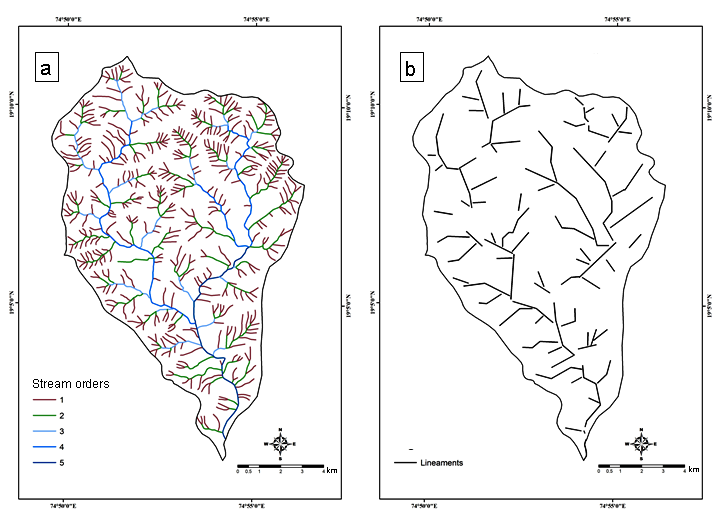
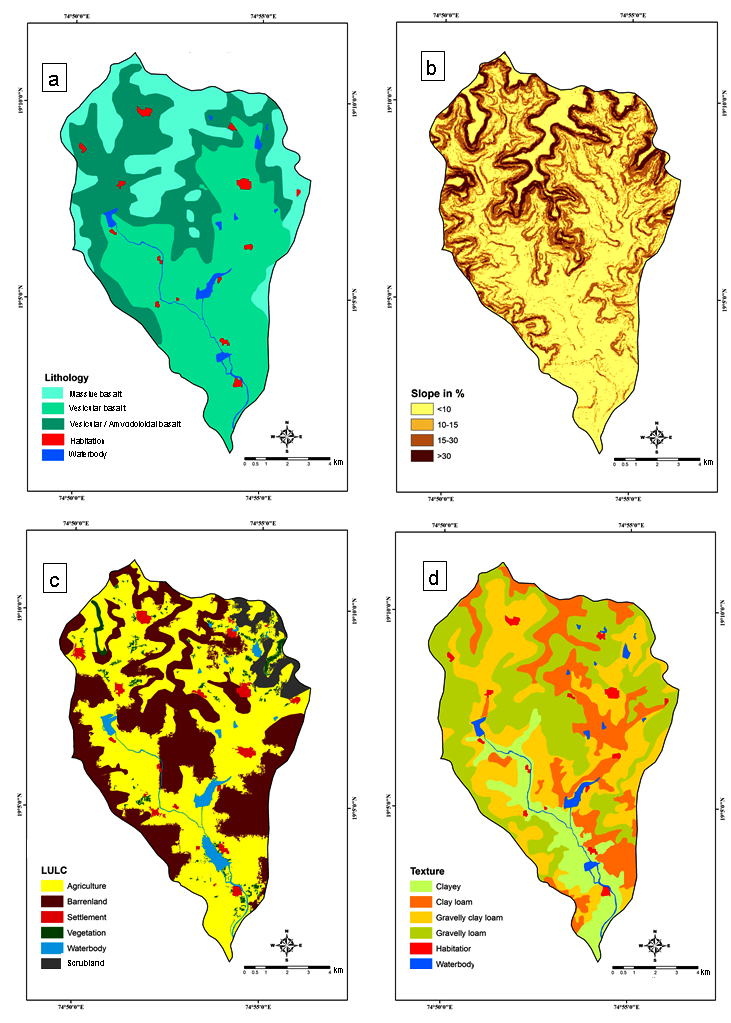
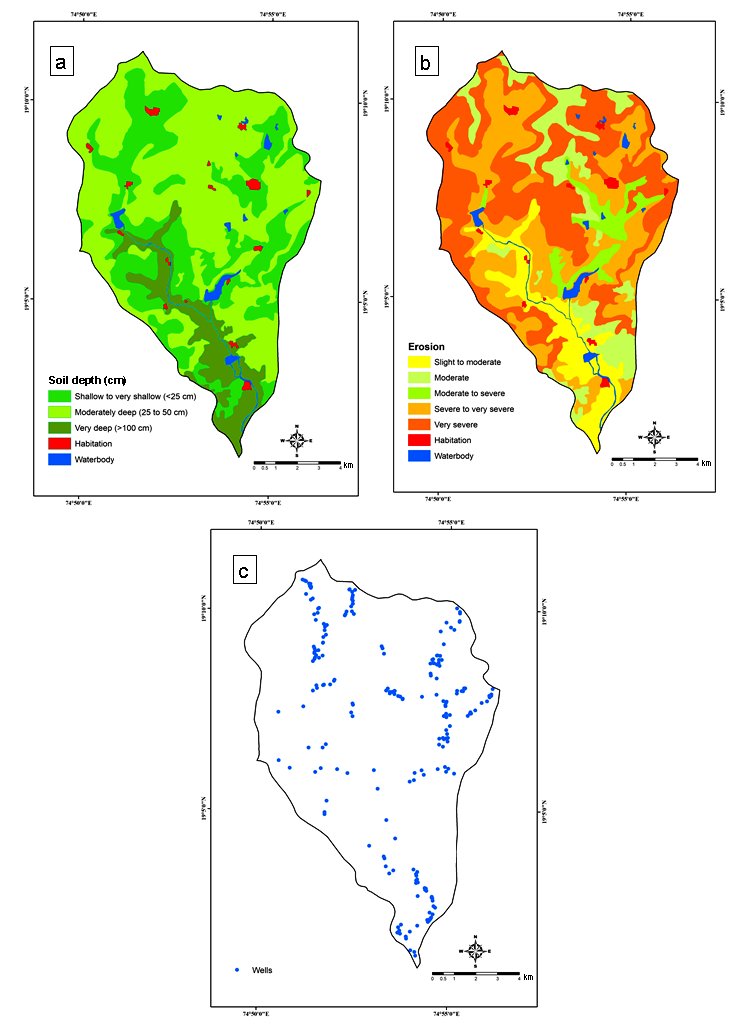
Multi-thematic layers were considered for site suitability analysis for water conservation activity. The streams were digitizing from Toposheet. Lineaments were identified using map procured from Groundwater Surveys and Development Agency (GSDA) with orientation and density in ArcGIS 10.3. Digital Elevation Model (DEM) was downloaded from homepage of the Bhuvan and processed to prepare the elevation and slope maps. Lithology map was prepared from the map procured from Geological Survey of India (GSI). The soil depth, soil erosion, soil texture maps were prepared based on map from National Bureau of Soil Survey and Land Use Planning (NBSS and LUP). Land Use Land Cover (LULC) was classified from Google Earth images (January 2018) using ISO cluster unsupervised classification (Table 1). The ancillary data was converting into raster from vector datasets and reclassified for further process. Further, MCDM technique, AHP was used to assign the weights and to calculate weighted sum using reclassified parameters. Finally, the site suitability for implementation of water conservation activity was calculated (Figure 2).
Table 1. Data
|
Data
|
Sources
|
|
DEM
|
CARTOSAT-1 Digital Elevation Model (2011), ISRO, NRSC, India.
|
|
Satellite images
|
Google Earth Pro.
|
|
Lineaments
|
Groundwater Surveys and Development Agency (GSDA), Pune, India.
|
|
Lithology
|
Geological Survey of India (GSI), India.
|
|
Soil depth
|
National Bureau of Soil Survey and Land Use Planning (NBSS and LUP), Nagpur, India.
|
|
Soil erosion
|
|
Soil texture
|
|
Stream network
|
Toposheet, Survey of India.
|
|
Wells
|
Google Earth Pro.
|
The suitability analysis for this study was processed through eight steps: 1) Selection of study area and identification of multiple thematic criterion for the analysis; 2) Delineation of catchment area from Toposheet and confirmed DEM; 3) Preparation of slope map from DEM; 4) Finding the proximity to calculate the Euclidean distance of wells, lineaments and steams network and reclassification; 5) Assigning weight using AHP technique to calculate weighted sum with the help of reclassified maps: lineaments, slope, soil depth, soil erosion, soil texture, LULC, wells, stream networks, etc. (Figure 3, 4 and 5); 6) Delineation of suitable sites for application of water conservation activities; 8) Selection of suitable sites for construction of conservation structures: Construction of Mati Nala Bund (MNB), Check Dam, Cement Nala Bund (CNB) and Continuous Contour Trenches (CCT) for conservation of groundwater resource in the region. Guidelines from Integrated Mission for Sustainable Development (IMSD) were used for selecting the suitable sites for water conservation structures (Singh et al., 2009; Padmavathy et al., 1993; Kumar et al., 2017): 1) the slope should be less than fifteen percent; 2) the land use will be barren land, scrubland or river bed; 3) the soil infiltration rate should be less and 4) the soil should be sandy loam.
3.1 Analytical hierarchy process (AHP)
The AHP method was introduced by in Saaty (1977). It is a multi-criteria decision-making approach used to solve complex problems. It is an inclusive method that integrates alternatives and subjective to views of selected exporters, numerically. This technique rushes the procedure by recognizing and allocating weights to every measure. The significance of each factor within each unit accomplishes by allocating each set of parameter in pairwise assessment for each of the factor correct to higher section (Das, 2019). The rank scale of criterion ranges from 1 (equal importance) to 9 (extreme importance). The pairwise comparison elaborates the importance of each factor that influences the water conservation potentials (Mundalik et al., 2018). The rows in the matrix follow the inverse value for each factor and its importance with additional factor.
After preparing the thematic layers, the AHP process has been applied to give weights to all criterions considered for this study. These criterions are controlling the water conservation potentials of an area are such as slope, land use land cover, soil texture, lithology, soil depth, soil erosion, wells, lineaments, drainage network. The AHP is a very flexible and well-structured method to take action (Saaty, 1980; Dou et al. 2017). The AHP method were used for determine weights and ranks of all parameters for the site suitability for water conservation activity.
The AHP method is used for all parameter to give value according to its importance of each criterion and weights were calculated (Table 2). A pairwise comparison matrix has been built-in, which the diagonal elements are equal to 1 (equation (1)). The importance of all these parameters is given based on different criteria. Each parameter of these values describes the relative importance between two parameters. For instance, the first row represents the relative importance of stream with other eight parameters. (e.g., the stream is more important than the lineaments and lithology, thus the lineaments have a value of ½).
Table 2. Pairwise comparison matrix
|
Criteria
|
Stream
|
Lineament
|
Lithology
|
Slope
|
LULC
|
Soil texture
|
Soil depth
|
Soil erosion
|
Well
|
|
Stream
|
1
|
2
|
3
|
4
|
5
|
6
|
7
|
8
|
9
|
|
Lineament
|
1/2
|
1
|
2
|
3
|
4
|
5
|
6
|
7
|
8
|
|
Lithology
|
1/3
|
1/2
|
1
|
2
|
3
|
4
|
5
|
6
|
7
|
|
Slope
|
1/4
|
1/3
|
1/2
|
1
|
2
|
3
|
4
|
5
|
6
|
|
LULC
|
1/5
|
1/4
|
1/3
|
1/2
|
1
|
2
|
3
|
4
|
5
|
|
Soil texture
|
1/6
|
1/5
|
1/4
|
1/3
|
1/2
|
1
|
2
|
3
|
4
|
|
Soil depth
|
1/7
|
1/6
|
1/5
|
1/4
|
1/3
|
1/2
|
1
|
2
|
3
|
|
Soil erosion
|
1/8
|
1/7
|
1/6
|
1/5
|
1/4
|
1/3
|
1/2
|
1
|
2
|
|
Well
|
1/9
|
1/8
|
1/7
|
1/6
|
1/5
|
1/4
|
1/3
|
1/2
|
1
|
\(A= (a_{ij})=\begin{bmatrix} a_{11} & a_{12} & ... & a_{1n} \\ a_{21} & a_{22} & ... & a_{2n} \\ a_{n1} & a_{n2} & ... & a_{nn} \end{bmatrix} , a_{ii}=1, a_{ij}= \frac{1} {a_{ij}}, a_{ij}\ne0\) (1)
Weighted arithmetic mean was performed to calculate the weights in the pairwise comparison matrix (Table 3). The values in the pairwise comparison are normalized to acquire the normalized values in the standard pairwise comparison matrix (equation (2)) (Table 4). The weight of all the parameters is determined by mean row method in the standard pairwise comparison matrix. The maximum characteristics root was expressed as:
\(AW= \lambda_{max}W\) (2)
Table 3. Normalized pairwise comparison matrix
|
Criteria
|
Stream
|
Lineament
|
Lithology
|
Slope
|
LULC
|
Soil texture
|
Soil depth
|
Soil erosion
|
Well
|
Weights
|
|
Stream
|
0.3535
|
0.4239
|
0.3951
|
0.3493
|
0.3071
|
0.2717
|
0.2428
|
0.2192
|
0.2000
|
0.3070
|
|
Lineament
|
0.1767
|
0.2120
|
0.2634
|
0.2620
|
0.2456
|
0.2264
|
0.2081
|
0.1918
|
0.1778
|
0.2182
|
|
Lithology
|
0.1178
|
0.1060
|
0.1317
|
0.1747
|
0.1842
|
0.1811
|
0.1734
|
0.1644
|
0.1556
|
0.1543
|
|
Slope
|
0.0884
|
0.0707
|
0.0659
|
0.0873
|
0.1228
|
0.1358
|
0.1387
|
0.1370
|
0.1333
|
0.1089
|
|
LULC
|
0.0707
|
0.0530
|
0.0439
|
0.0437
|
0.0614
|
0.0906
|
0.1040
|
0.1096
|
0.1111
|
0.0764
|
|
Soil texture
|
0.0589
|
0.0424
|
0.0329
|
0.0291
|
0.0307
|
0.0453
|
0.0694
|
0.0822
|
0.0889
|
0.0533
|
|
Soil depth
|
0.0505
|
0.0353
|
0.0263
|
0.0218
|
0.0205
|
0.0226
|
0.0347
|
0.0548
|
0.0667
|
0.0370
|
|
Soil erosion
|
0.0442
|
0.0303
|
0.0220
|
0.0175
|
0.0154
|
0.0151
|
0.0173
|
0.0274
|
0.0444
|
0.0259
|
|
Well
|
0.0393
|
0.0265
|
0.0188
|
0.0146
|
0.0123
|
0.0113
|
0.0116
|
0.0137
|
0.0222
|
0.0189
|
Table 4. Weights of the criterion
|
Criterion
|
Weight
|
Weighted influence (%)
|
Suitability levels
|
Sub-criterion
|
|
Distance from Stream
(M)
|
0.31
|
31
|
Low
|
50
|
|
Least
|
200
|
|
Moderate
|
500
|
|
High
|
>500
|
|
Distance from lineaments
(Meter)
|
0.22
|
22
|
Low
|
<50
|
|
Least
|
200
|
|
Moderate
|
500
|
|
High
|
>500
|
|
Lithology
|
0.15
|
15
|
Low
|
Habitation mask
|
|
Least
|
Massive basalt
|
|
Moderate
|
Vesicular/Amygdoloidal basalt
|
|
High
|
Water body mask
|
|
Slope
|
0.11
|
11
|
Low
|
>30
|
|
Least
|
15-30
|
|
Moderate
|
10--15
|
|
High
|
<10
|
|
LULC
|
0.08
|
8
|
Low
|
Settlement / Water body mask
|
|
Least
|
Barren land
|
|
Moderate
|
Scrubland/ vegetation
|
|
High
|
Agricultural area
|
|
Soil texture
|
0.05
|
5
|
Low
|
Habitation mask
|
|
Least
|
Gravelly clay loam / gravelly loam
|
|
Moderate
|
Clayey
|
|
High
|
Clay loam /water body mask
|
|
Soil depth
|
0.04
|
4
|
Low
|
Shallow to very shallow (<25 cm) / habitation mask
|
|
Least
|
Moderately deep (25 to 50 cm)
|
|
Moderate
|
Very deep (>100 cm)
|
|
High
|
Water body mask
|
|
Soil erosion
|
0.03
|
3
|
Low
|
Water body mask
|
|
Least
|
Severe to very severe / moderate to severe
|
|
Moderate
|
Moderate/slight to moderate
|
|
High
|
Habitation mask / very severe
|
|
Distance from wells
(M)
|
0.02
|
2
|
Low
|
<100
|
|
Least
|
200
|
|
Moderate
|
500
|
|
High
|
>500
|
The consistency ratio (CR) was calculated as (Saaty, 1980):
\(CR= \frac {CI} {RI}\) (3)
\(CR= 0.04\)
\(CI= \frac {\lambda _{max}-n} {n-1}\) (4)
where, CR stands for consistency ratio, CI represents consistency index, RI indicates the random index (Saaty’s (1980)) (Table 5), \(\lambda _{max}\) represents the principal eigenvalue of the matrix, and n is number of criterions in the matrix.
The consistency ratio (CR) was accepted (Saaty, 2008), the value is < 0.10, and it indicates a sensible level for the pairwise comparison matrix. If, in the case of consistency ratio is (CR) > 0.10, the values of CR have been readjusted according to the Saaty (1977). Detailed process of performing AHP was based Saaty (1990). All the criterions were considered individually and classified into different sub-criteria and weights were assigned to each sub-criteria based on relative importance using AHP techniques (Table 4).
Table 5. RI Values
|
Criterion
|
1
|
2
|
3
|
4
|
5
|
6
|
7
|
8
|
9
|
10
|
|
RI
|
0.00
|
0.00
|
0.58
|
0.90
|
1.12
|
1.24
|
1.32
|
1.41
|
1.45
|
1.49
|
4 . RESULTS AND DISCUSSIONS
Soil and water conservation depends on numerous topographic factors of a study area. Simultaneously assessments of those factors using modern techniques can provide a clear picture of site suitability for water conservation activity. In this paper, total of nine topographic factors were considered for mapping of site suitability for water conservation activity with the help of AHP.
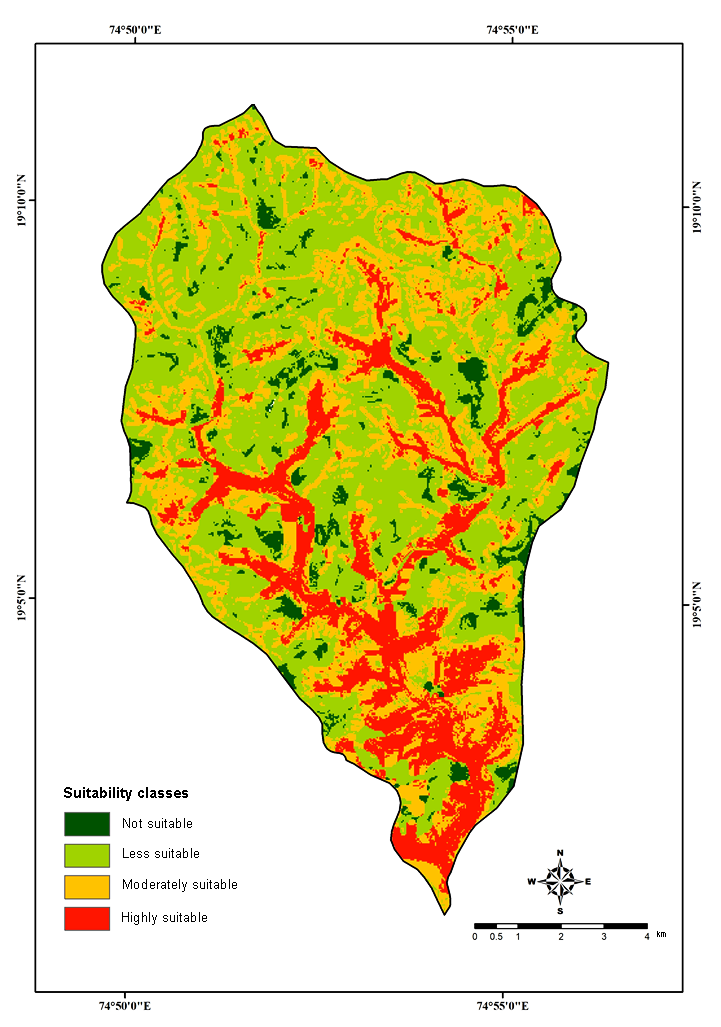
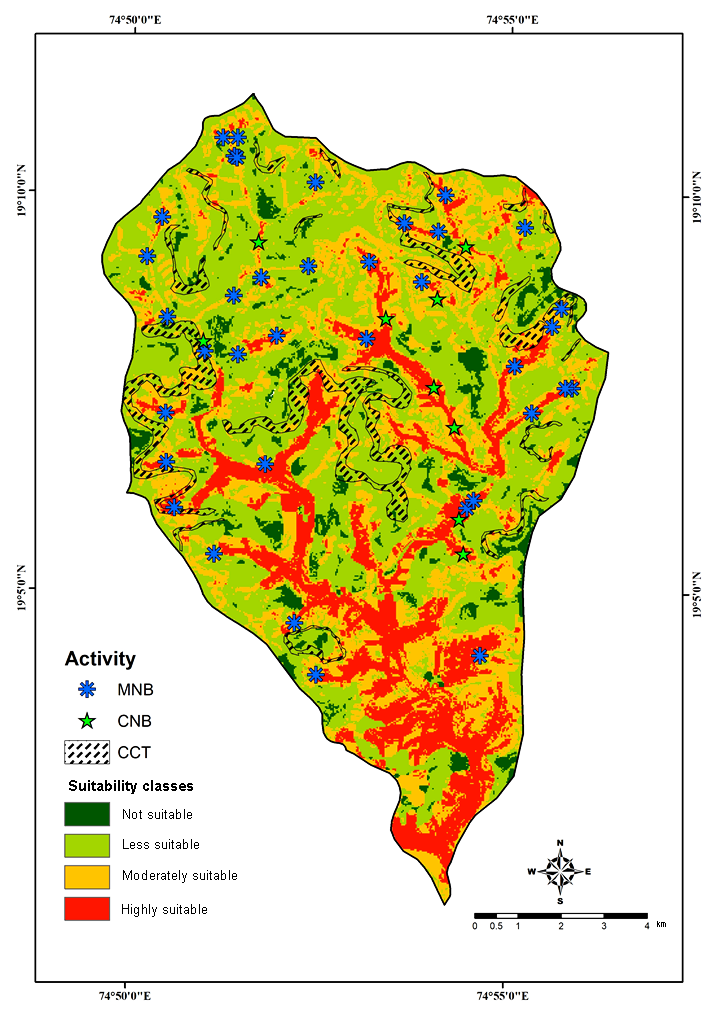
The result implies that maximum area falls under less suitable and not suitable (unsuitable) zones. The results help to find out suitable sites for implementation of water conservation activities, which will be helpful to improve soil moisture as well as groundwater levels. Some of the water conservation structures already exist in the study area. In addition to them, some more new structures can be suggested for water conservation purposes (Figure 7) with saving of required money and time for implementation of government policy in this region.
The site suitability map is classified into four suitability classes based on AHP analysis: highly suitable, moderately suitable, less suitable and not suitable (Figure 6). The area in the category ‘not suitable’ is estimated about 5.78% with steep slopes and barren land. The area in the category, ‘less suitable’ is estimated about 49.03% with 2nd and 3rd ordered streams. The ‘moderately suitable’ area is estimated about 26% with gentle slope and gravelly clay loam. Only 19.19% of the area is classified as ‘highly suitable’ with 5th order streams (Pandey et al., 2011) (Figure 6).
Some sites for application of soil and water conservation structures were identified in this analysis. Suggested sites are potential location to build the Mati Nala Bund (MNB), Check Dam, Cement Nala Bund (CNB) and Continuous Contour Trenches (CCT) (Figure 7).
Table 6. Suitable Sites for water conservation structures
|
Type of structure
|
Stream
|
LULC
|
Slope
|
|
LBS
|
2nd order Stream
|
Barren land
|
Steep
|
|
MNB/CNB
|
3rd order Stream
|
Scrub land
|
Moderate
|
|
Check Dam
|
4th order Stream
|
Vegetation
|
Very gentle
|
|
Dams
|
5th order Stream
|
Agricultural land
|
Gentle
|


 ,
Ravindra Medhe 1
,
Ravindra Medhe 1