1 . INTRODUCTION
Road traffic accidents become a major threat for global public health and injury prevention problems. It is also one of the common causes of death, globally and mostly the leading cause of death for young people from 15 to 29 years old (WHO, 2013). Besides, more people were killed due to road traffic accidents than Malaria and by end of the decade. It is projected that road traffic accidents will become a bigger killer than HIV-Aids (IRTAD, 2013). In addition, road traffic accident caused 13 fatal per 100,000 populations as a leading causes of death in Bangladesh besides the number is 18 for world context (Sivak and Schoettle, 2014) which indicates that Bangladesh has the highest fatality rate in road accidents in the world.
The frequent incident and higher rate of road accidents make Dhaka (the capital of Bangladesh) one of the vulnerable City in terms of road safety. The number of motor vehicles in Dhaka city has increased due to the rapid urbanization which considered as a factor of higher number of road accidents. Recent studies show that the yearly urban growth rate in Bangladesh remained at 4% in 2010, though the present growth of engine vehicles remains at 8%. As a result, the road networks are encountering more prominent congestion, physical deterioration and widely unsafe for public. Moreover, the number of casualty and estimated damage of road accident definitely has an significant impact on economy of Bangladesh as the economic cost of road accidents to developing countries (i.e. Bangladesh) is 2-3% of GDP (WHO, 2013).
Under this circumstance, the transport regulator and traffic law enforcers are more concerned than earlier to ensure the road safety. In addition, road safety analysis is a complex issues because of the analysis concentrated in the context of engineering, geography and human behavior. Identification of accident-prone location and assessing the pattern of accident are critical to implement road safety measures more skillfully because of location based safety measurement. A systematic geospatial approach can play a vital role to detect significant spatial accident location accurately. Many traffic agencies and organizations are using GIS [Geographic Information System] technologies to convert the road accident information into spatial database and hotspot analysis (Hossain and Ahmad, 2014; Xie and Thill, 2008; Erdogan et. al., 2008; Anderson, 2006; Deepthi and Ganeshkumar, 2010).
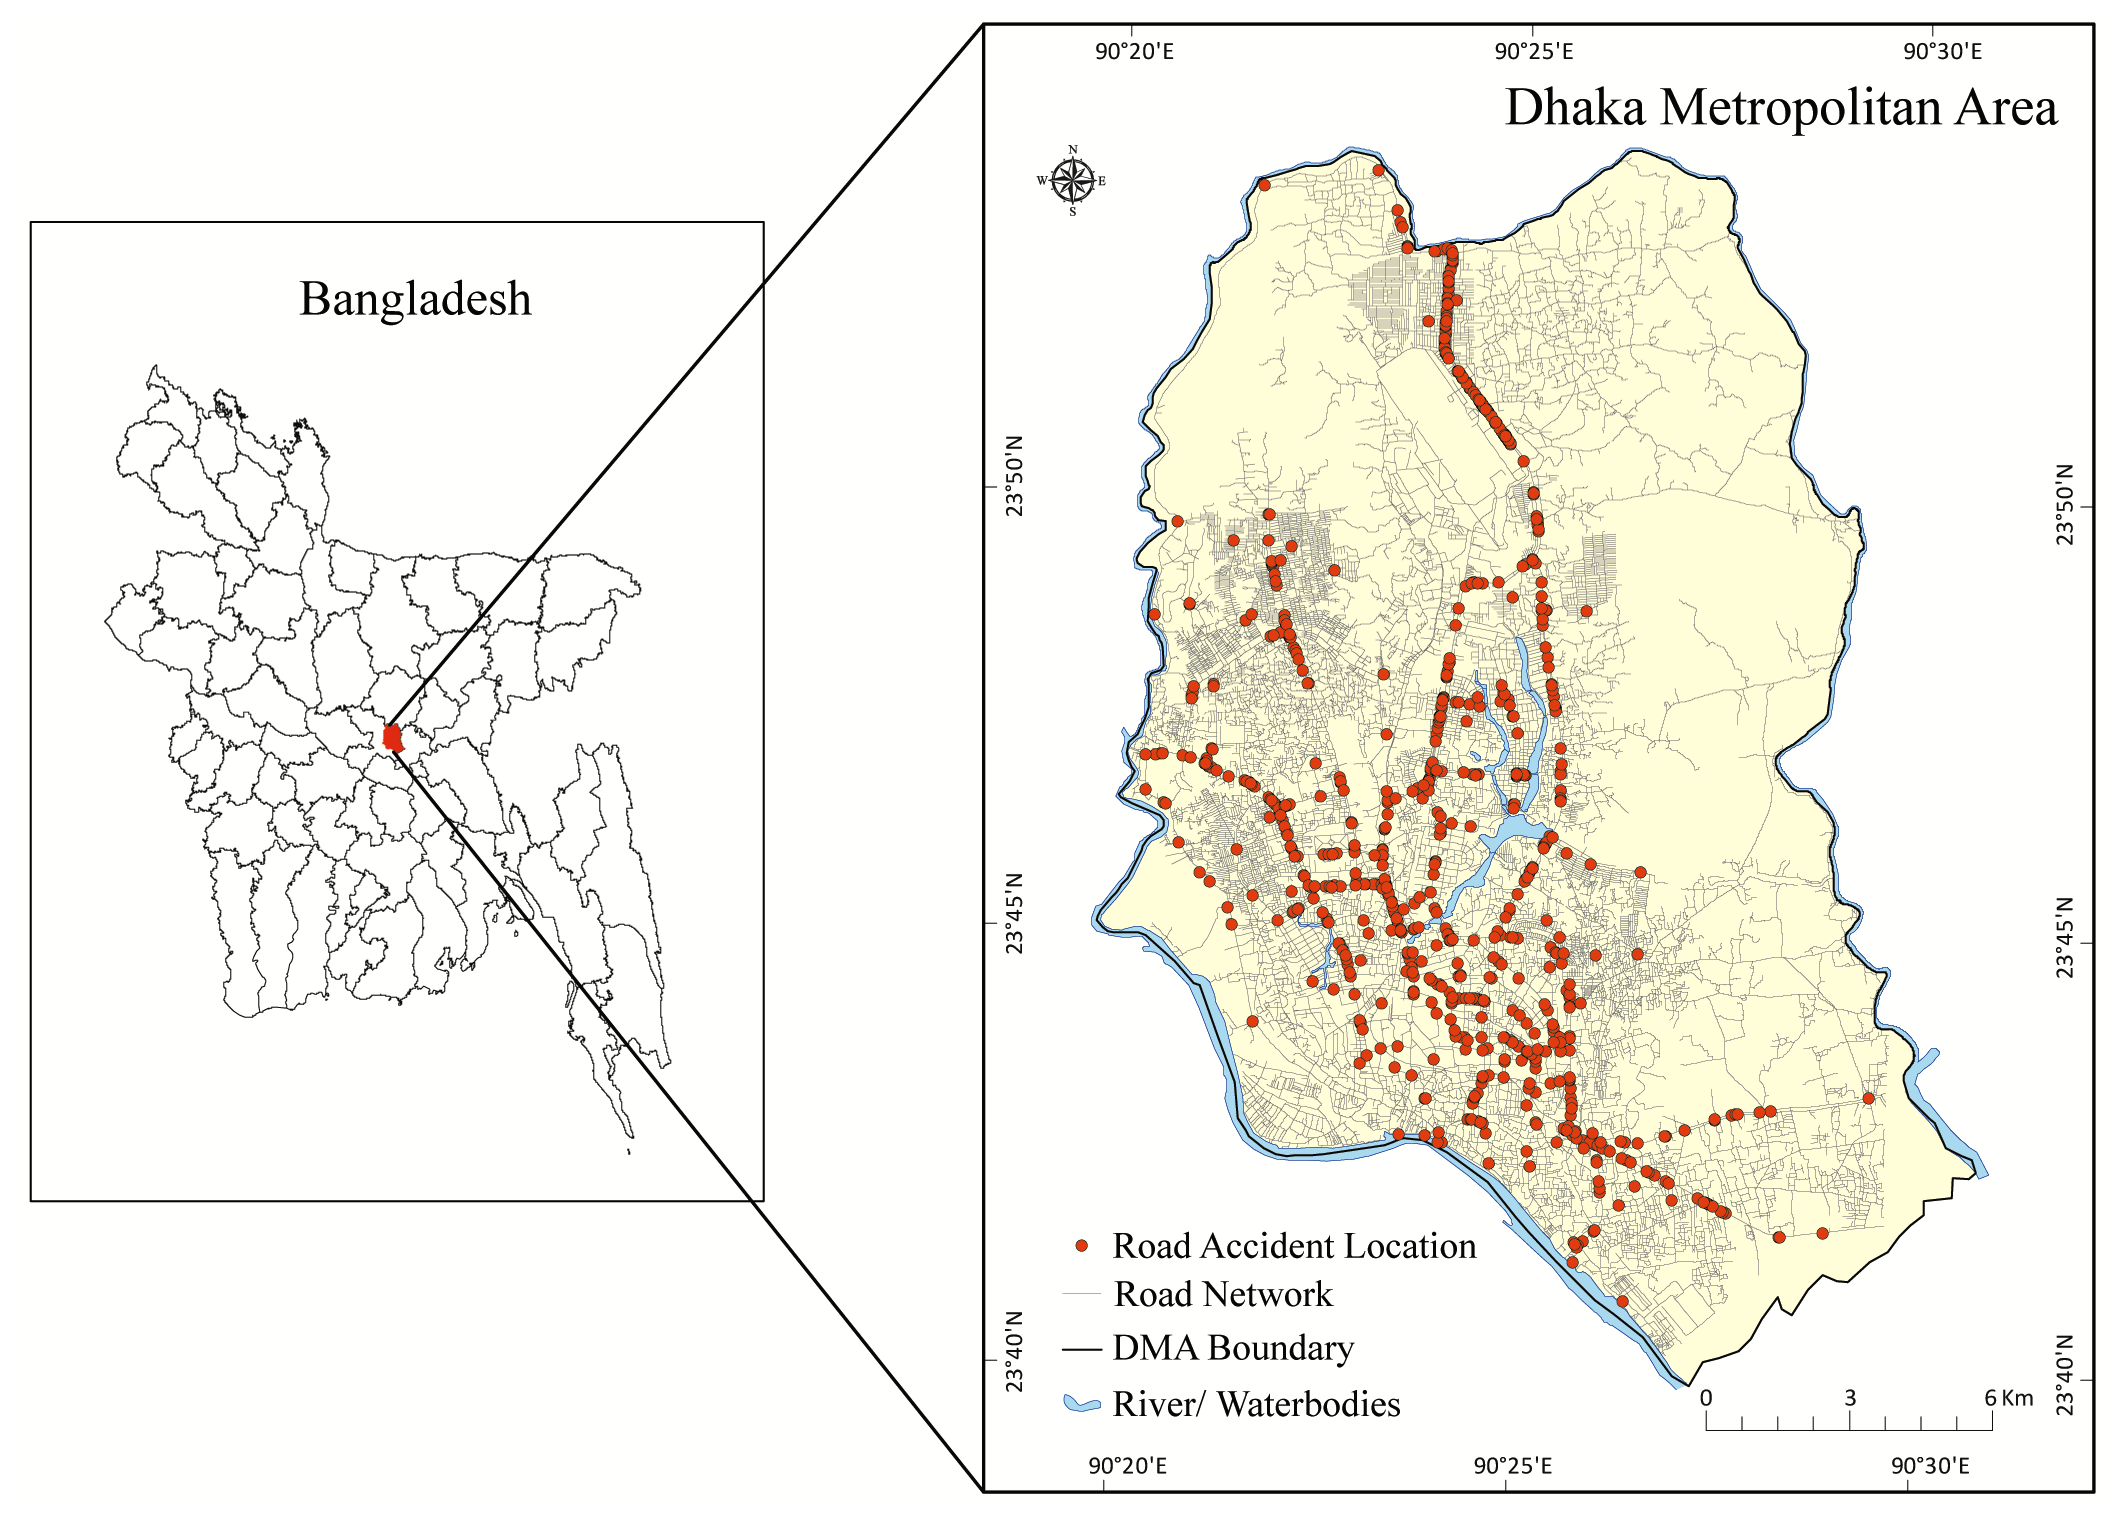
This paper presents a new approach to identify the road traffic accident hotspots zones in the Dhaka Metropolitan Area (DMA) by preparing a spatial road accident database with different related information. A GIS framework was developed and spatial analysis carried out to identify vulnerable location of road accident for road safety measures. The study area confined within Dhaka Metropolitan Area (DMA) which including both Dhaka North City Corporation (DNCC) and Dhaka South City Corporation (DSCC) area (Figure 1).
2 . METHODOLOGY
The study can be described into two broad categories: firstly, to create spatial database identifying precise accident locations and secondly, to identify the accident hotspots through spatial analysis. GIS is proficient tool for decision-making and therefore, this study used a GIS based method to identify accident hotspots which can assist to prevent and reduce road traffic accidents (Hossain and Ahmad, 2014; Mandloi and Gupta, 2003; Erdogan et. al., 2008). Generally, estimation of road accidents and unsafe roads were determined with the help of traffic accident statistics in a conventional method but using actual field data and GIS to predict the spatial pattern of traffic accidents is more systematic to assess the real scenario in the road networks.
2.1 Accident Database
Road Traffic Accident (RTA) dataset was acquired from the Accident Research Institute, Bangladesh University of Engineering and Technology (ARI-BUET) for the present study. The datasets represent accident locations (Figure 1) for three years from 2010, 2011 and 2012. The total number of accident recorded on the database was 1230 from 2010 to 2012. The location data for each accident represents as distinct X and Y coordinates with detail landmarks. Although the total collected data was for about 1230 points, but 979 accident datasets have distinct X and Y coordinates with detail landmark information. Therefore, the study was considered about 979 datasets for spatial analysis (Table 1). These road accident locations have detailed information such as location in XY, landmark, date, time, vehicle’s type and causalities number. Further, the database converted into shape file using the spatial adjustment tool of ArcGIS for the appropriate analysis in GIS platforms. In addition, road network data was collected from two city corporations and corrected with the help of Google Map.
Table 1. Accident dataset (2010-2012)
|
Year
|
Accident data
|
Spatial accident data
|
|
2010
|
458
|
369
|
|
2011
|
400
|
338
|
|
2012
|
372
|
272
|
|
Total
|
1230
|
979
|
2.2 Severity Index
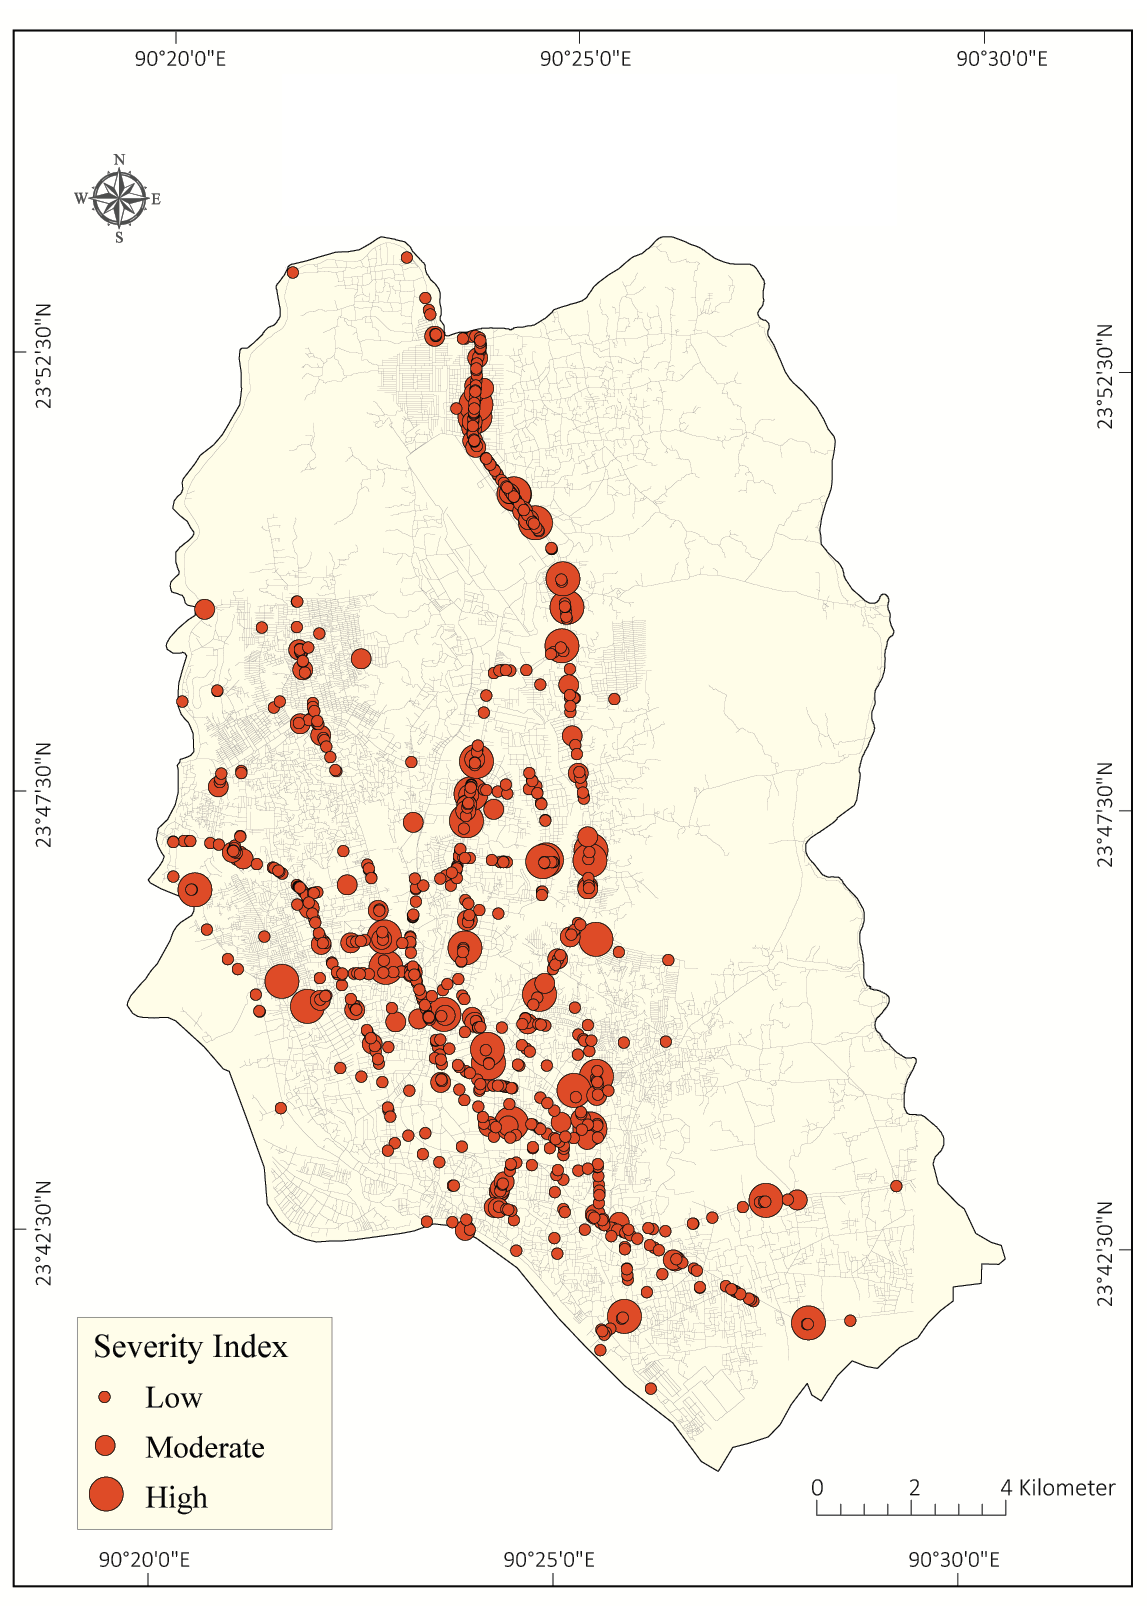
In spatial statistics, a weighted data is important to analysis the data more accurately to understand the distribution of data. In this study, weighted data was used to determine the distribution of RTA. Accident severity weighting numbers (Severity Index) were estimated to justify the magnitude of RTA (Anderson, 2006). Severity Index (SI) was calculated by the following equation (1) and the equation ordered the fatal number than other accidents.
\(SI=2.5 \times Number \ of \ fatal+2.0 \times Number \ of \ serious injury+1.5 \times Number \ of \ other \ injury \) (1)
2.3 Hotspot analysis
Hotspot analysis is widely used analysis of spatial patterns of traffic accidents (Anderson, 2009). A hotspot may be defined as a location, area or zone within a definite boundary has the high concentration of incidence of any particular features. Moreover, hotspot zone is a geographic area where certain events occur more than the average. In broad, static spatial patterns can find out of occurred incidences through the hotspot analysis by spatial clustering and surface generation (Chang, 2004).
Use of only one method can inconclusive to identify of the hotspot zones. If spatial statistics is used to identify the hotspots, than zones with high accident concentration may be left out. Conversely, if spatial analysis is used to make out the hotspot regions then zones with a high total number of severity indices per unit area may be ignored. It is therefore necessary not to rely upon a single analysis method to identify the accident hotspots zone. Depending on the objectives of this study, different zones could be identified as hotspot zones. Three major methods were used in this study which have the competences to estimate the hotspots of accident incidents: Cluster and outlier analysis (Anselin Local Moran’s-I), hotspot analysis using Getis-Ord Gi* Statistics and Kernel Density Estimation (KDE). ArcGIS 10x Software was used for analysis and delineation of hotspot zones.
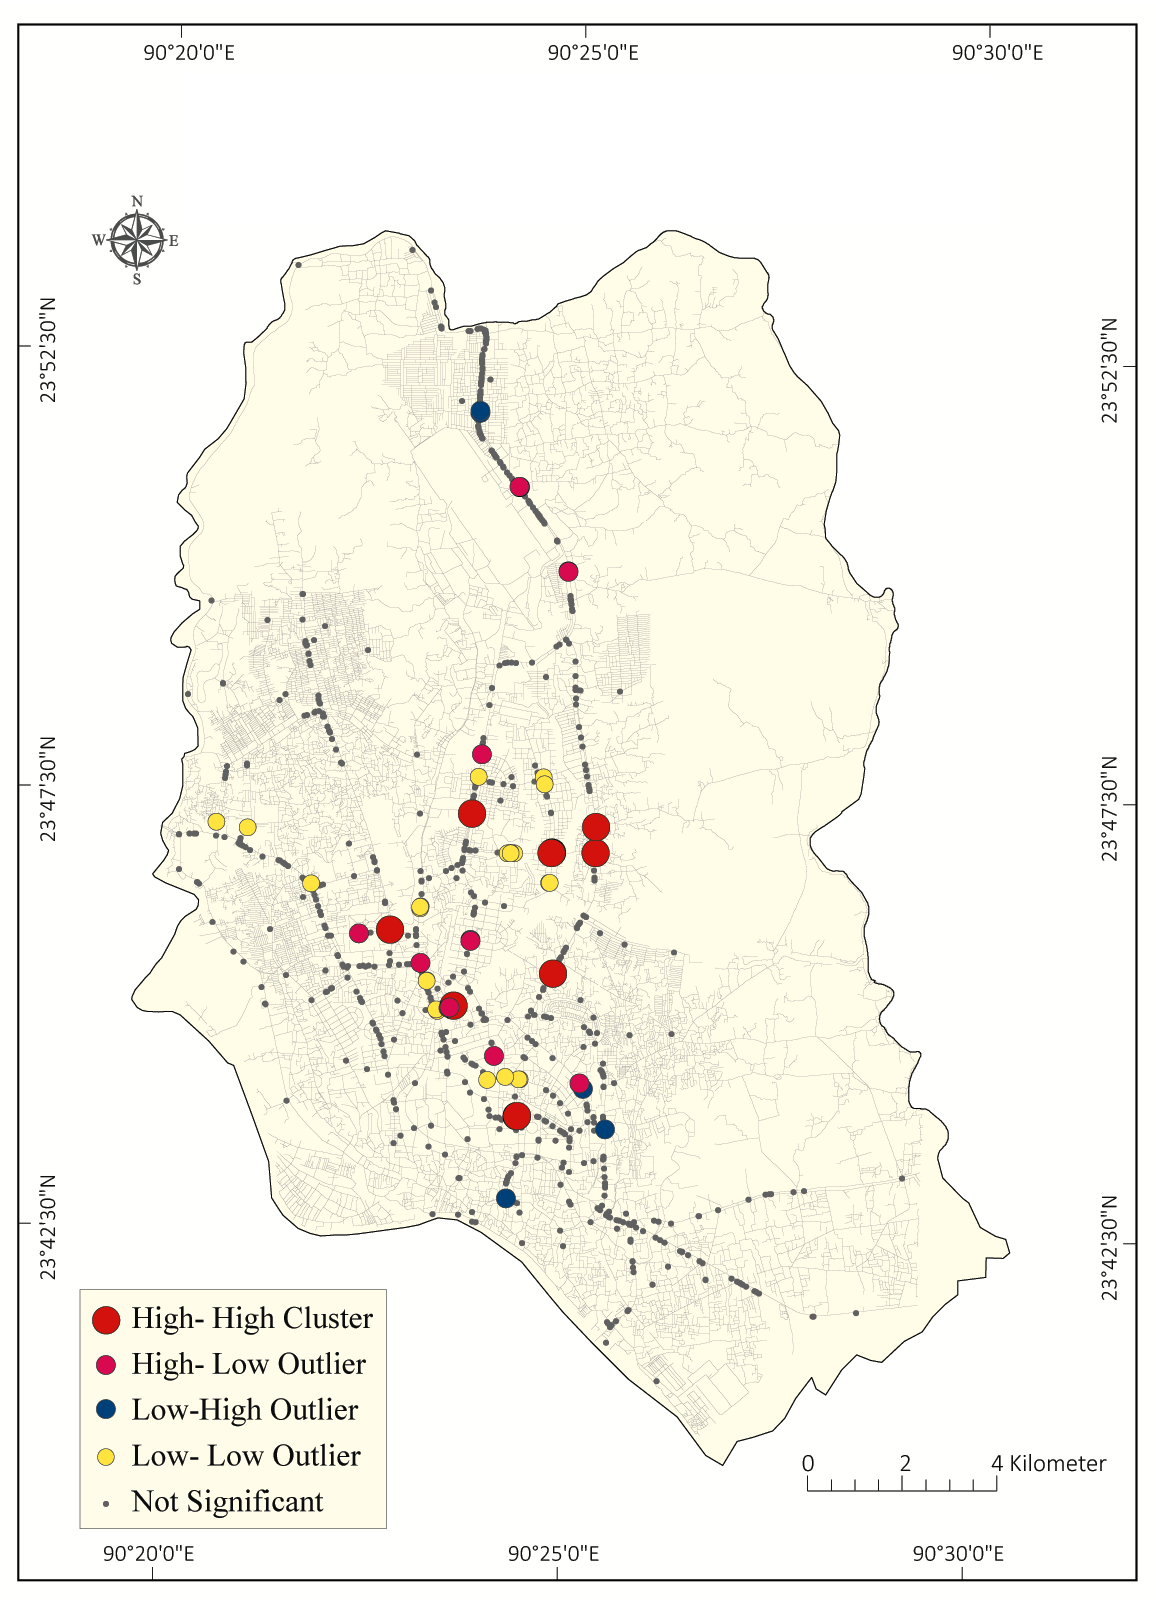
The identification of spatial clusters of features with high or low values can be analyzed using the cluster and outlier analysis tool in ArcGIS. The Anselin Local Moran’s-I tool was used for such analysis that also identifies spatial outliers. However, statistically significant spatial outliers were estimated using cluster and outlier analysis (Anselin Local Moran’s-I) tool where a higher values bordered by lesser values or lesser values surrounded by higher values (ESRI, 2014).
The Getis-Ord Gi* statistic (pronounced G-i-star) analysis tools calculates Z-scores for each feature in a dataset. Further, Z-score values were classified to define the levels of identified clusters. The hotspot analysis was performed by the extension tool of ArcGIS. The tool measures the levels by counting each feature within the considerable neighboring feature. Although feature with a higher values is interesting in this analysis but have not the possibility a statistically significant hotspot (ESRI, 2014).
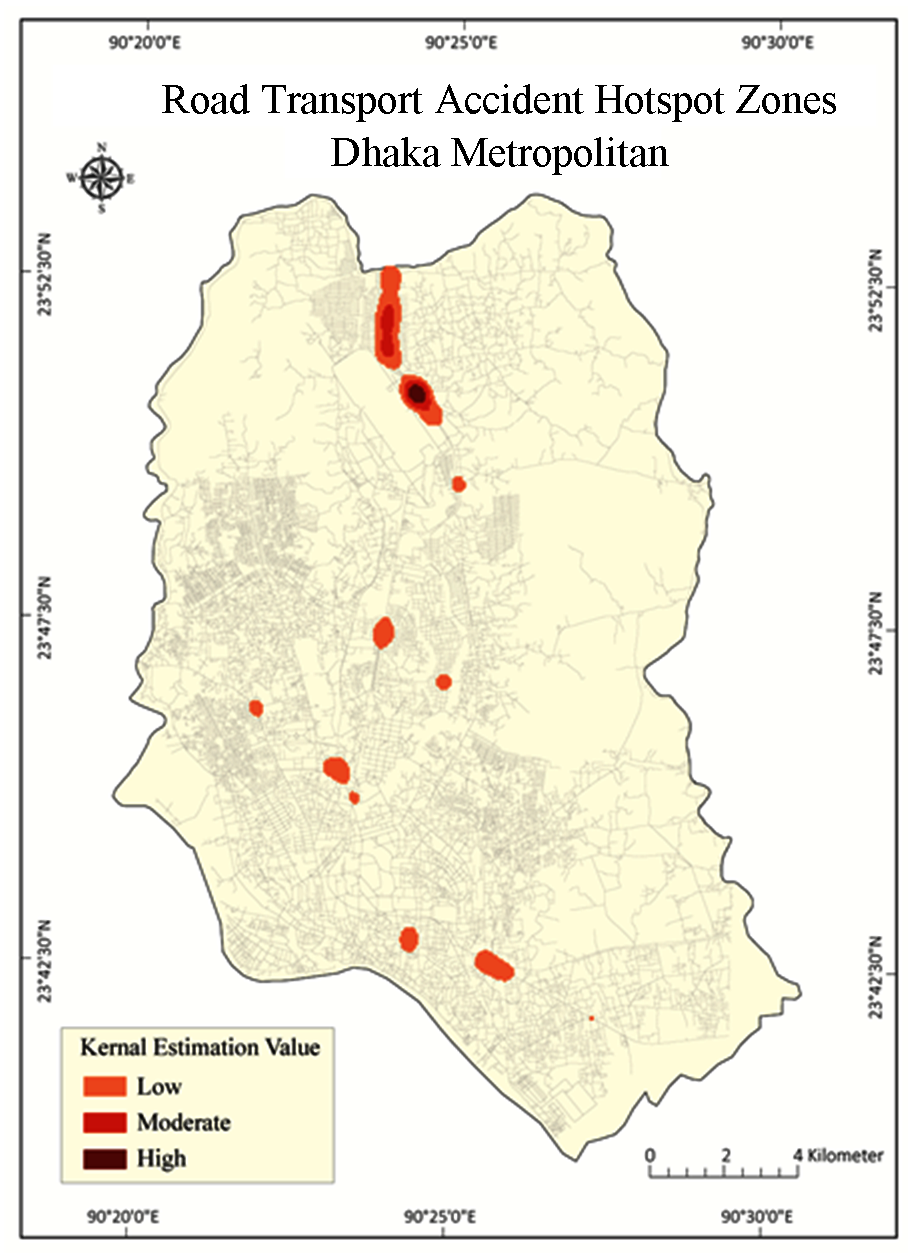
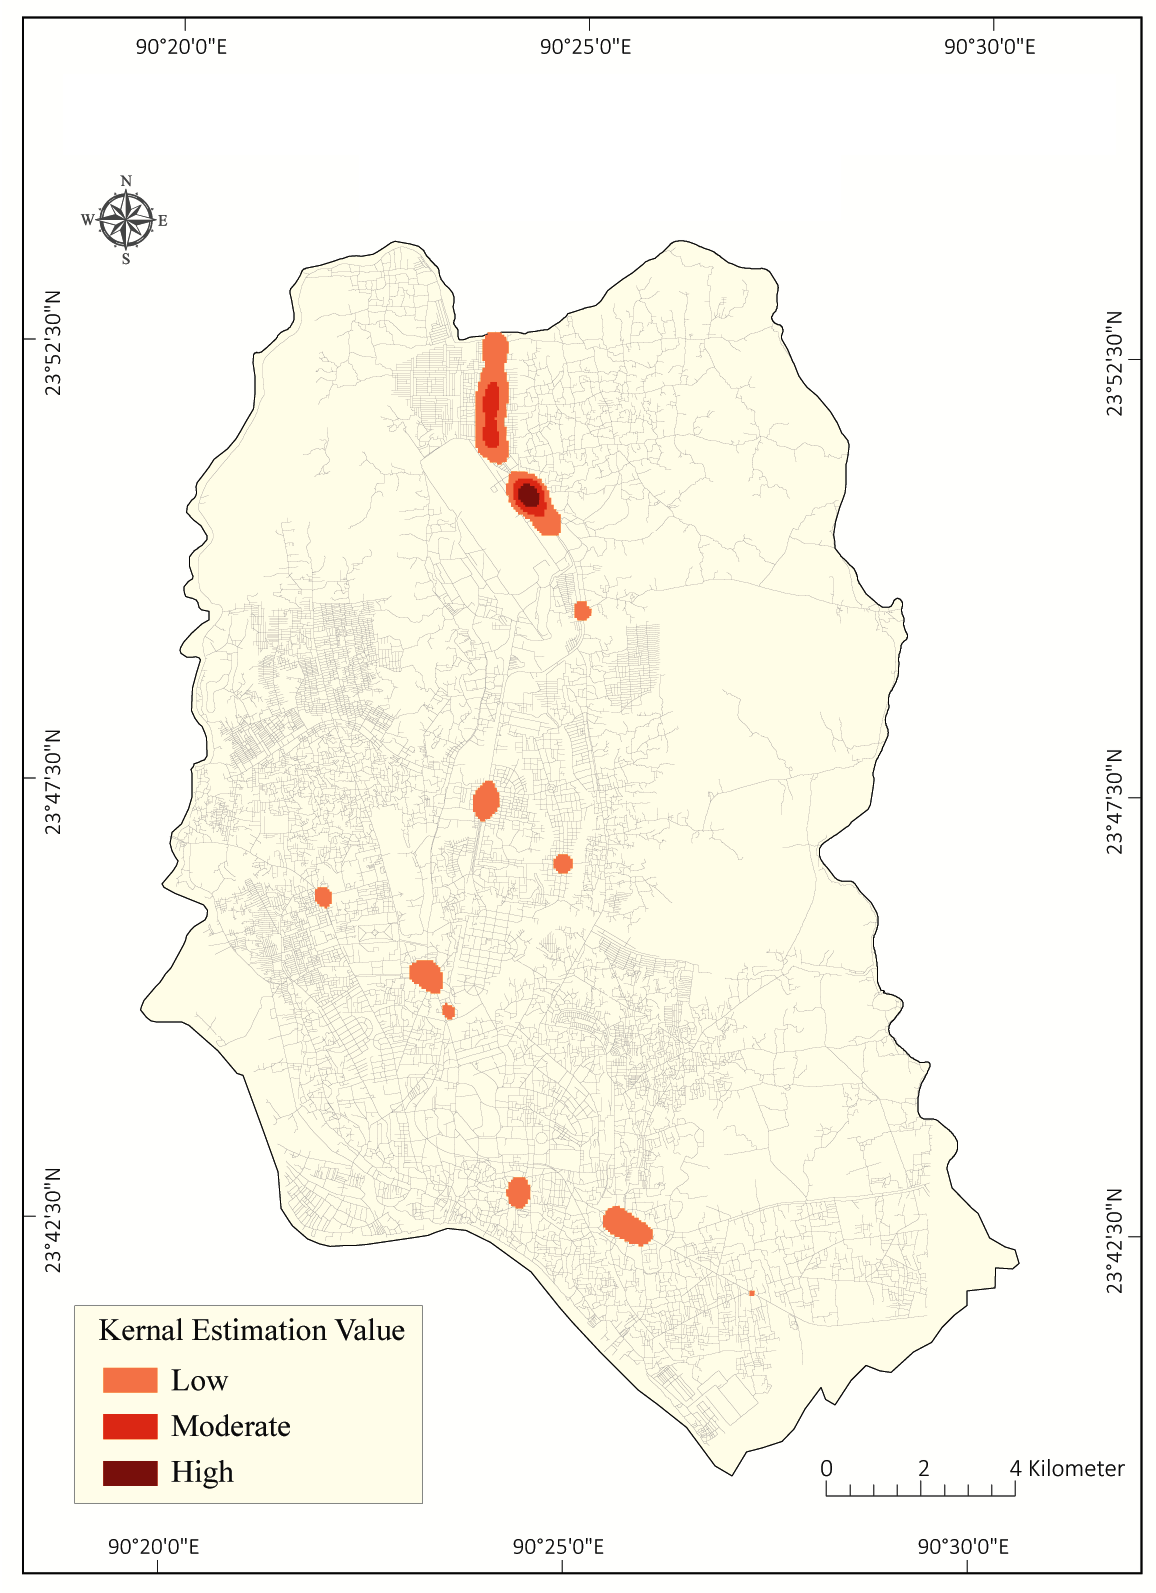
The accident concentration zones were prepared by using Kernel Density Estimations (KDE) (Deepthi and Ganeshkumar, 2010). KDE method was used to identify the most accident-prone locations and it calculates SI values for per unit area from a traffic accident point features using a kernel function which generates an acceptable plane surface to each point. With the density analysis tool in ArcGIS, the density of input features were calculated within a neighborhood of each output raster cell.
3 . RESULTS AND DISCUSSIONS
SI was estimated to perform various spatial analysis and spatial statistics for hotspot identification of RTA for the years, 2010, 2011 and 2012. Figure 2 shows the distribution of the SI and this figure indicates some high severity zones. However, it needs a statistical significance test to examine the degree of concentration where the SI is used as a weighted value.
Cluster and outlier analysis explains the locations of statistically significant hotspots, cold-spots, spatial outliers and similar features with a 600m fixed threshold distance. Various clusters and outliers analysis was identified total 12 clusters as hotspots in DMA (Figure 3).
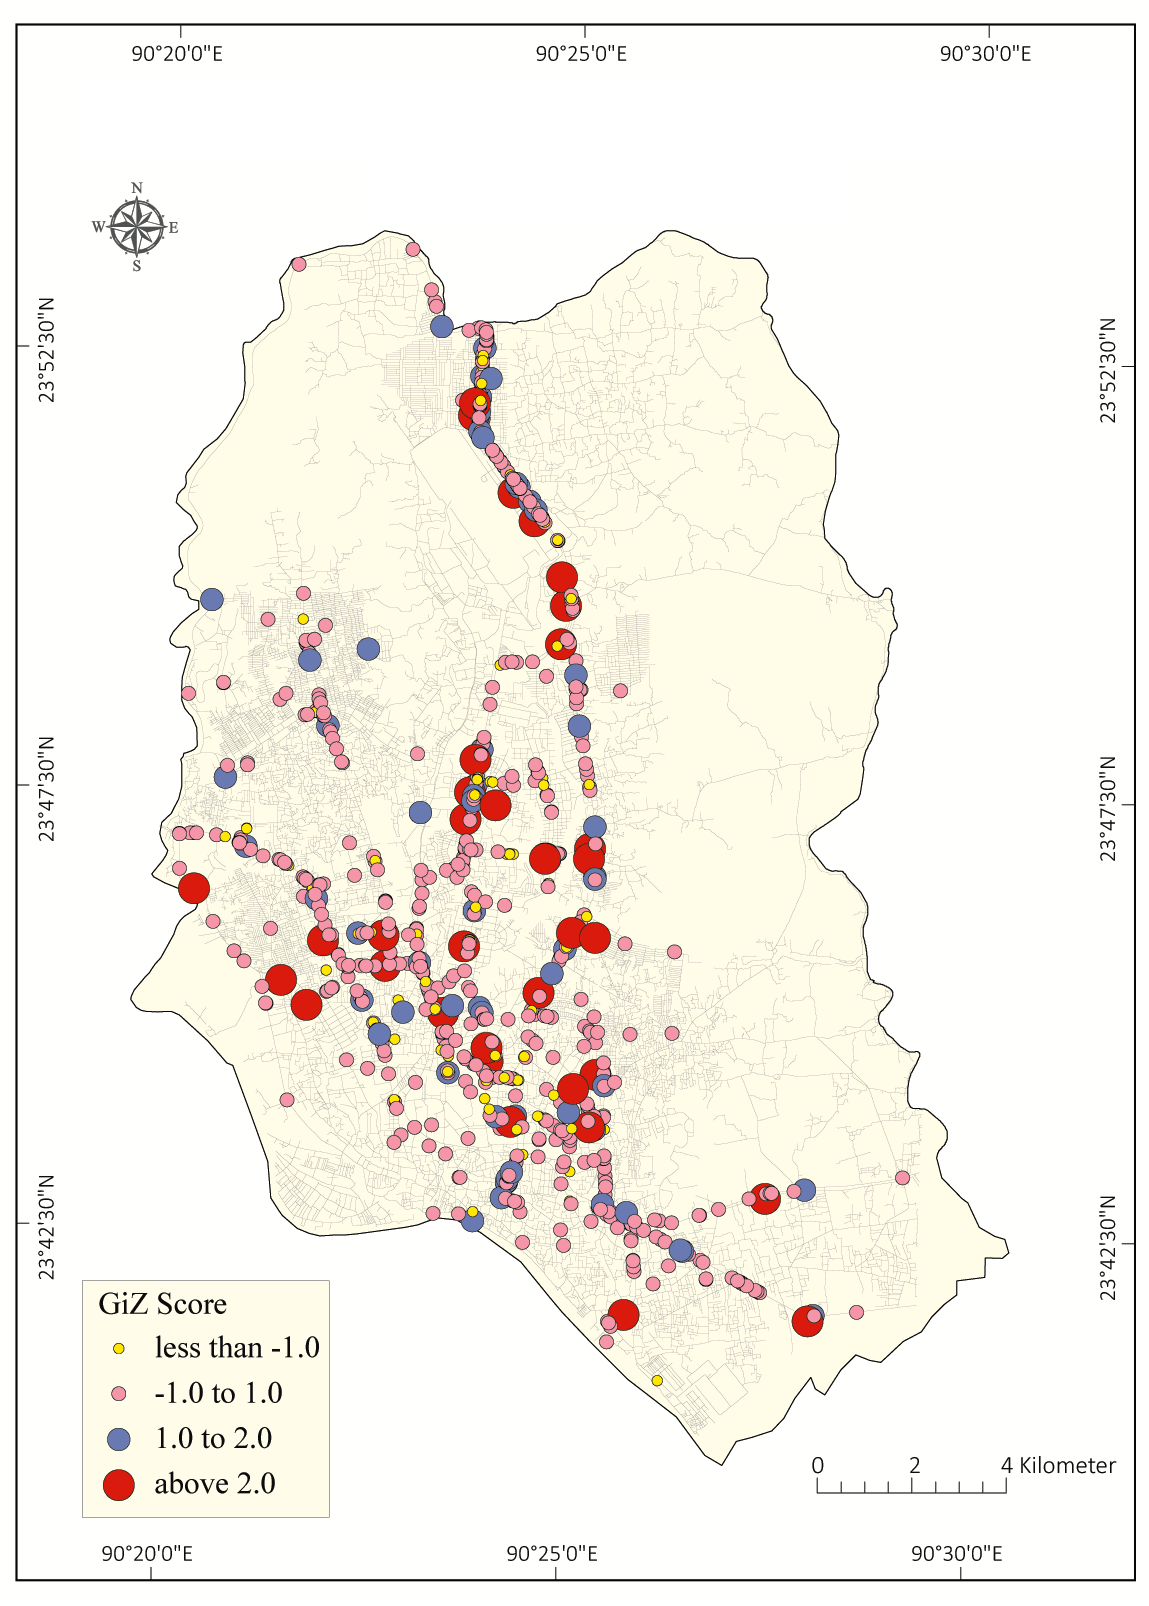
Z-score values were considered for hotspot detection using Getis-Ord Gi* Statistic. Features having higher values and bounded by other features with higher values were consider as statistically significant hotspots. With the distance threshold of 600m, the analysis identified the Z-score value about 2.0 as the cut-off value. It means that areas with Z-score values higher than 2.0 is the hotspot zones for RTA (Figure 4). About 55 accident points were placed within this hotspot zones identified using Getis-Ord Gi* Statistics.
In KDE method, 600m circular search area is applied that determines the distance to search for accident point location. SI of accident data in a particular point location was weighted as statistical parameter for the identification of the hotspot zones. KDE analysis brings 11 most vulnerable areas for RTA (Figure 5) where considerable accident occurred from the year 2010 to 2012.
The hotspot zone identification was processed using various spatial statistics and analysis. As a result, those zones were marginally varying from particulars tools. However, the three methods which were applied in the study have different prospect of analysis and a total number of 22 hotspot zones were recognized in the entire DMA through those methods. Furthermore, out of 979 spatial accident data 458 were located in those hotspot zones.
The average SI value of the RTA within the hotspot zones was 2.60 while the total RTA SI value was 2.37 (Table 2). Although, the total reported RTA number shows a diminishing trend but the average SI value was increased from the year, 2010 to 2012 (Table 3). In addition, fatal RTA in hotspot zones was slightly higher than that of total RTA (Table 4).
Table 2. A summary of hotspot zones in Dhaka Metropolitan Area
|
Sr. No
|
Hotspot zones
|
Total number
|
Average Severity Index
|
Roads/Corridors
|
|
Accident
|
Fatal
|
Injury
|
|
1
|
Konnapara-Demra
|
4
|
4
|
3
|
4.00
|
Dhaka- Demra Road
|
|
2
|
Baribad Dipnagar
|
3
|
3
|
2
|
3.83
|
Baribad Road (Gabtoli - Sadarghat)
|
|
3
|
Palton Crossing
|
4
|
2
|
5
|
3.75
|
Sahid Sayad Nazrul Islam Sharoni - Topkhana Road
|
|
4
|
Saddam Market-Matuail
|
4
|
6
|
0
|
3.75
|
Dhaka- Chittagong Road
|
|
5
|
Gulshan-1 Crossing
|
10
|
3
|
17
|
3.65
|
Gulshan Avenue
|
|
6
|
Badda
|
13
|
15
|
5
|
3.65
|
Bir Uttam Rafiqul Islam Ave/ Progoti Sharoni
|
|
7
|
Jurain-Postagola
|
4
|
5
|
1
|
3.63
|
Dhaka - Mawa Highway
|
|
8
|
Areoplan Crossing
|
6
|
7
|
2
|
3.50
|
Begam Rokeya Saroni - Bijoy Sharoni - Lake Road
|
|
9
|
Rampura-Bonosree
|
18
|
10
|
19
|
3.31
|
DIT Road
|
|
10
|
Kuril-Joarshahara
|
5
|
4
|
3
|
3.20
|
Airport Road
|
|
11
|
Khilgaon-Kamalapur
|
22
|
19
|
10
|
3.02
|
Outer Circular Road and Atish Depankar Road
|
|
12
|
Bangshal-Naya Bazar Crossing
|
14
|
9
|
9
|
2.89
|
North South Road
|
|
13
|
Bonnai Chairmanbari - Kakoli crossing
|
27
|
16
|
17
|
2.65
|
Airport Road
|
|
14
|
Karwan Bazar-SAARC fountain
|
23
|
13
|
14
|
2.63
|
Kazi Nazrul Islam Avenue - Panthapath
|
|
15
|
Rayerbag
|
8
|
8
|
0
|
2.50
|
Dhaka- Chittagong Road
|
|
16
|
Khilkhet Nikunja
|
14
|
9
|
7
|
2.50
|
Airport Road
|
|
17
|
Jatrabari Crossing - Janapath crossing
|
32
|
29
|
4
|
2.48
|
Dhaka- Chittagong Road
|
|
18
|
Tejgaon Industrial Area
|
7
|
4
|
3
|
2.29
|
Saheed Tajuddin Ahmed Sharoni
|
|
19
|
Uttara Jasimuddin Crossing - Abdullahpur
|
108
|
73
|
35
|
2.29
|
Dhaka -Mymensigh Road
|
|
20
|
Airport Round circle
|
80
|
56
|
24
|
2.27
|
Dhaka -Mymensigh Road
|
|
21
|
Farmgate-Khamarbari
|
33
|
17
|
14
|
2.02
|
Manik Mia Avenue - Kazi Nazrul Islam Avenue
|
|
22
|
Shymoli - Sishumela Crossing
|
14
|
8
|
1
|
1.57
|
Mirpur Road - Agargaon Road
|
Table 3. Average Severity Index values
|
Years
|
RTA
|
RTA at Hotspots
|
|
2010
|
1.99
|
2.19
|
|
2011
|
2.51
|
2.67
|
|
2012
|
2.60
|
2.93
|
|
Average
|
2.37
|
2.60
|
Table 4. Severity types
|
Types
|
RTA
(%)
|
RTA at Hotspots (%)
|
|
Fatal
|
70.83
|
66.39
|
|
Grievous
|
15.35
|
17.98
|
|
Simple
|
5.27
|
5.72
|
|
Motor Collision
|
8.55
|
9.91
|
|
Total
|
100.00
|
100.00
|
4 . CONCLUSIONS
The study commenced with the objectives to analyze the hotspot zones of RTA in DMA that influenced the road safety analysis to find unsafe bus stops. The intention was to seek urban road safety by identifying the hotspots and unsafe bus-stops through GIS based analysis which provides dynamic support to take proper measures for road safety. Spatial analysis and spatial statistics were bringing to be carried out these objectives. The study reflected upon the high concentration zone of RTA by hotspot zoning with a particular severity aspect. In cluster analysis, local Moran index above 95% cut-off value of the density was considered as hotspots and total 12 locations identified as a hotspots. In addition, there are 55 locations were identified as hotspots using Getis-Ord Gi* Statistics analysis including the previous 12 hotspot from cluster analysis. KDE method also relates with the previous spatial method because there is a huge cluster of low SI accident found in DMA where the accidents intensity was very high in magnitude.
The results from analyzed accident data in DMA show that the methods have the ability that can be statistically detecting spatial patterns and clusters of traffic accident data, reasonably identify, and analyses traffic accident hotspot zones. A systematic method of hotspots zone identification using GIS is very appropriate with reliable accident database to take measures of road safety of Dhaka metropolitan area.


 ,
Khandaker Tanvir Hossain 2
,
Khandaker Tanvir Hossain 2