Aeolian desertification is one of the foremost environmental and social-economic problems facing the world.
The River Vedavathi in the lower reaches is selected for detection of desertified area near to the channel.
The spatial database consisted of change detection layers prepared from Landsat 4, 5, 7 and 8 satellite imageries.
Geometric calculation method is used for detection of desertified area.
The Aeolian sand desertification is increased into the alarming rates with the land extent of 30.4 km2 in reviewed period.
The present study can be used by decision makers to develop economically sustainable plan for the protection and management of river environment.
Abstract
Desertification is one of the foremost environmental and social-economic problems facing the world. Thus, the observation and early detection of desertification is primary objective for scientific and policy organizations, with geospatial techniques as similar as Remote Sensing (RS) and Geographical Information System (GIS) being a candidate choice for the enlargement of monitoring systems. The present study purposes to assess the desertification caused by Aeolian sand deposits near Vedavathi River in a semi-arid region of Anantapur district, aided by temporal data of satellite imageries of past 28 years (1990 to 2018), were collected and processed. The extent of desertified land for the years 1990, 2000, 2010 and, 2018 is assessed, respectively about 28.22 Km2, 33.86 Km2, 46.30 Km2 and, 58.62 Km2. For the past 28 years, the Aeolian sand desertification is increased into the alarming rates with the land extent of 30.4 Km2.
Keywords
Semi-Arid region , Satellite data , GIS , Desertification , Aeolian sands , Landsat
1 . INTRODUCTION
Dry land of the world can be either classified as arid, established on climate or desert, established on surface physical characteristics (vegetation, landforms, etc.). For the persistence of this review, we will use the climatic classification implemented by UNESCO in 1979. Deserts thus can be categorized as semiarid having precipitation less than 550mm, arid with the precipitation less than 250mm and finally hyper arid with precipitation less than 25mm. Desertification is a foremost type of land deprivation happening around the globe, has convert one of the thoughtful conservational issue to the world (Reynolds et al., 2007; Adger et al., 2001; Tucker et al., 1991). The UNCOD [United Nations Conference on Desertification] conference held at Nairobi in the year 1977 pronounced biological impending reasons for desertification. Afterwards, the fruition of the desertification and its definition have been reviewed by many scholars (Pradeep Kumar et al., 2019; Amal Kar, 2016; Arya et al., 2014; Bai et al., 2011; Ajai et al., 2009; Reynolds et al., 2007; Anonymous, 2005; Reynolds and Stafford-Smith, 2002; Eswaran et al., 2001; Thomas and Meddleton, 1994; Rajasekhar et al., 2020). However greatest inclusive and extensively acknowledged explanation of ‘desertification’ denotes to land deprivation is happening in arid, semi-arid, and sub-humid zones, consequential after the influences with climatic variations then humanoid doings (UNEP, 1992). The Aeolian desertification is a foremost kind of desertification; it is well-defined as land degradation by wind erosion, mostly subsequent from extreme humanoid doings and climate variation in deserted regions (UNCCD, 2004). At universal and provincial regions, wind plays significant part in geomorphological progressions and environmental alteration due to erosion, transportation and deposition of superficial sediments by the exploit of wind is the key for Aeolian process. Consequently, after the standpoint of geomorphology, land degradation progression in which wind movement is the important forceful influence, and sandy desertification (Eswaran et al., 2001, Rajasekhar et al., 2019b). The study part of the Anantapur district is one of the most sensitive environments and is suffering wide-ranging draught environments and Aeolian desertification (Pradeep Kumar et al., 2019; Rajasekhar et al., 2019c). This area is strongly affected by regional atmospheric circulation patterns and having low rainfall of about 520mm considered as lowermost in the study area. Most regions of the present study grieve from an arid climate, this ensuing in a delicate ecology that generates advantageous circumstances for desertification (Mas et al., 1999; Li et al., 2001). Under the impact of climate change and human activates, this become significant (Harshika et al., 2012). Desertification has become severe problem that is obstructing socio-economic expansion and threatening its ecological environments of the study part (Zhang et al., 2003). Therefore, present study attempted to detect and delineate the desertified land near to Vedavathi (Hagari) River in Adrea Pradesh (India) using Landsat datasets.
2 . STUDY AREA
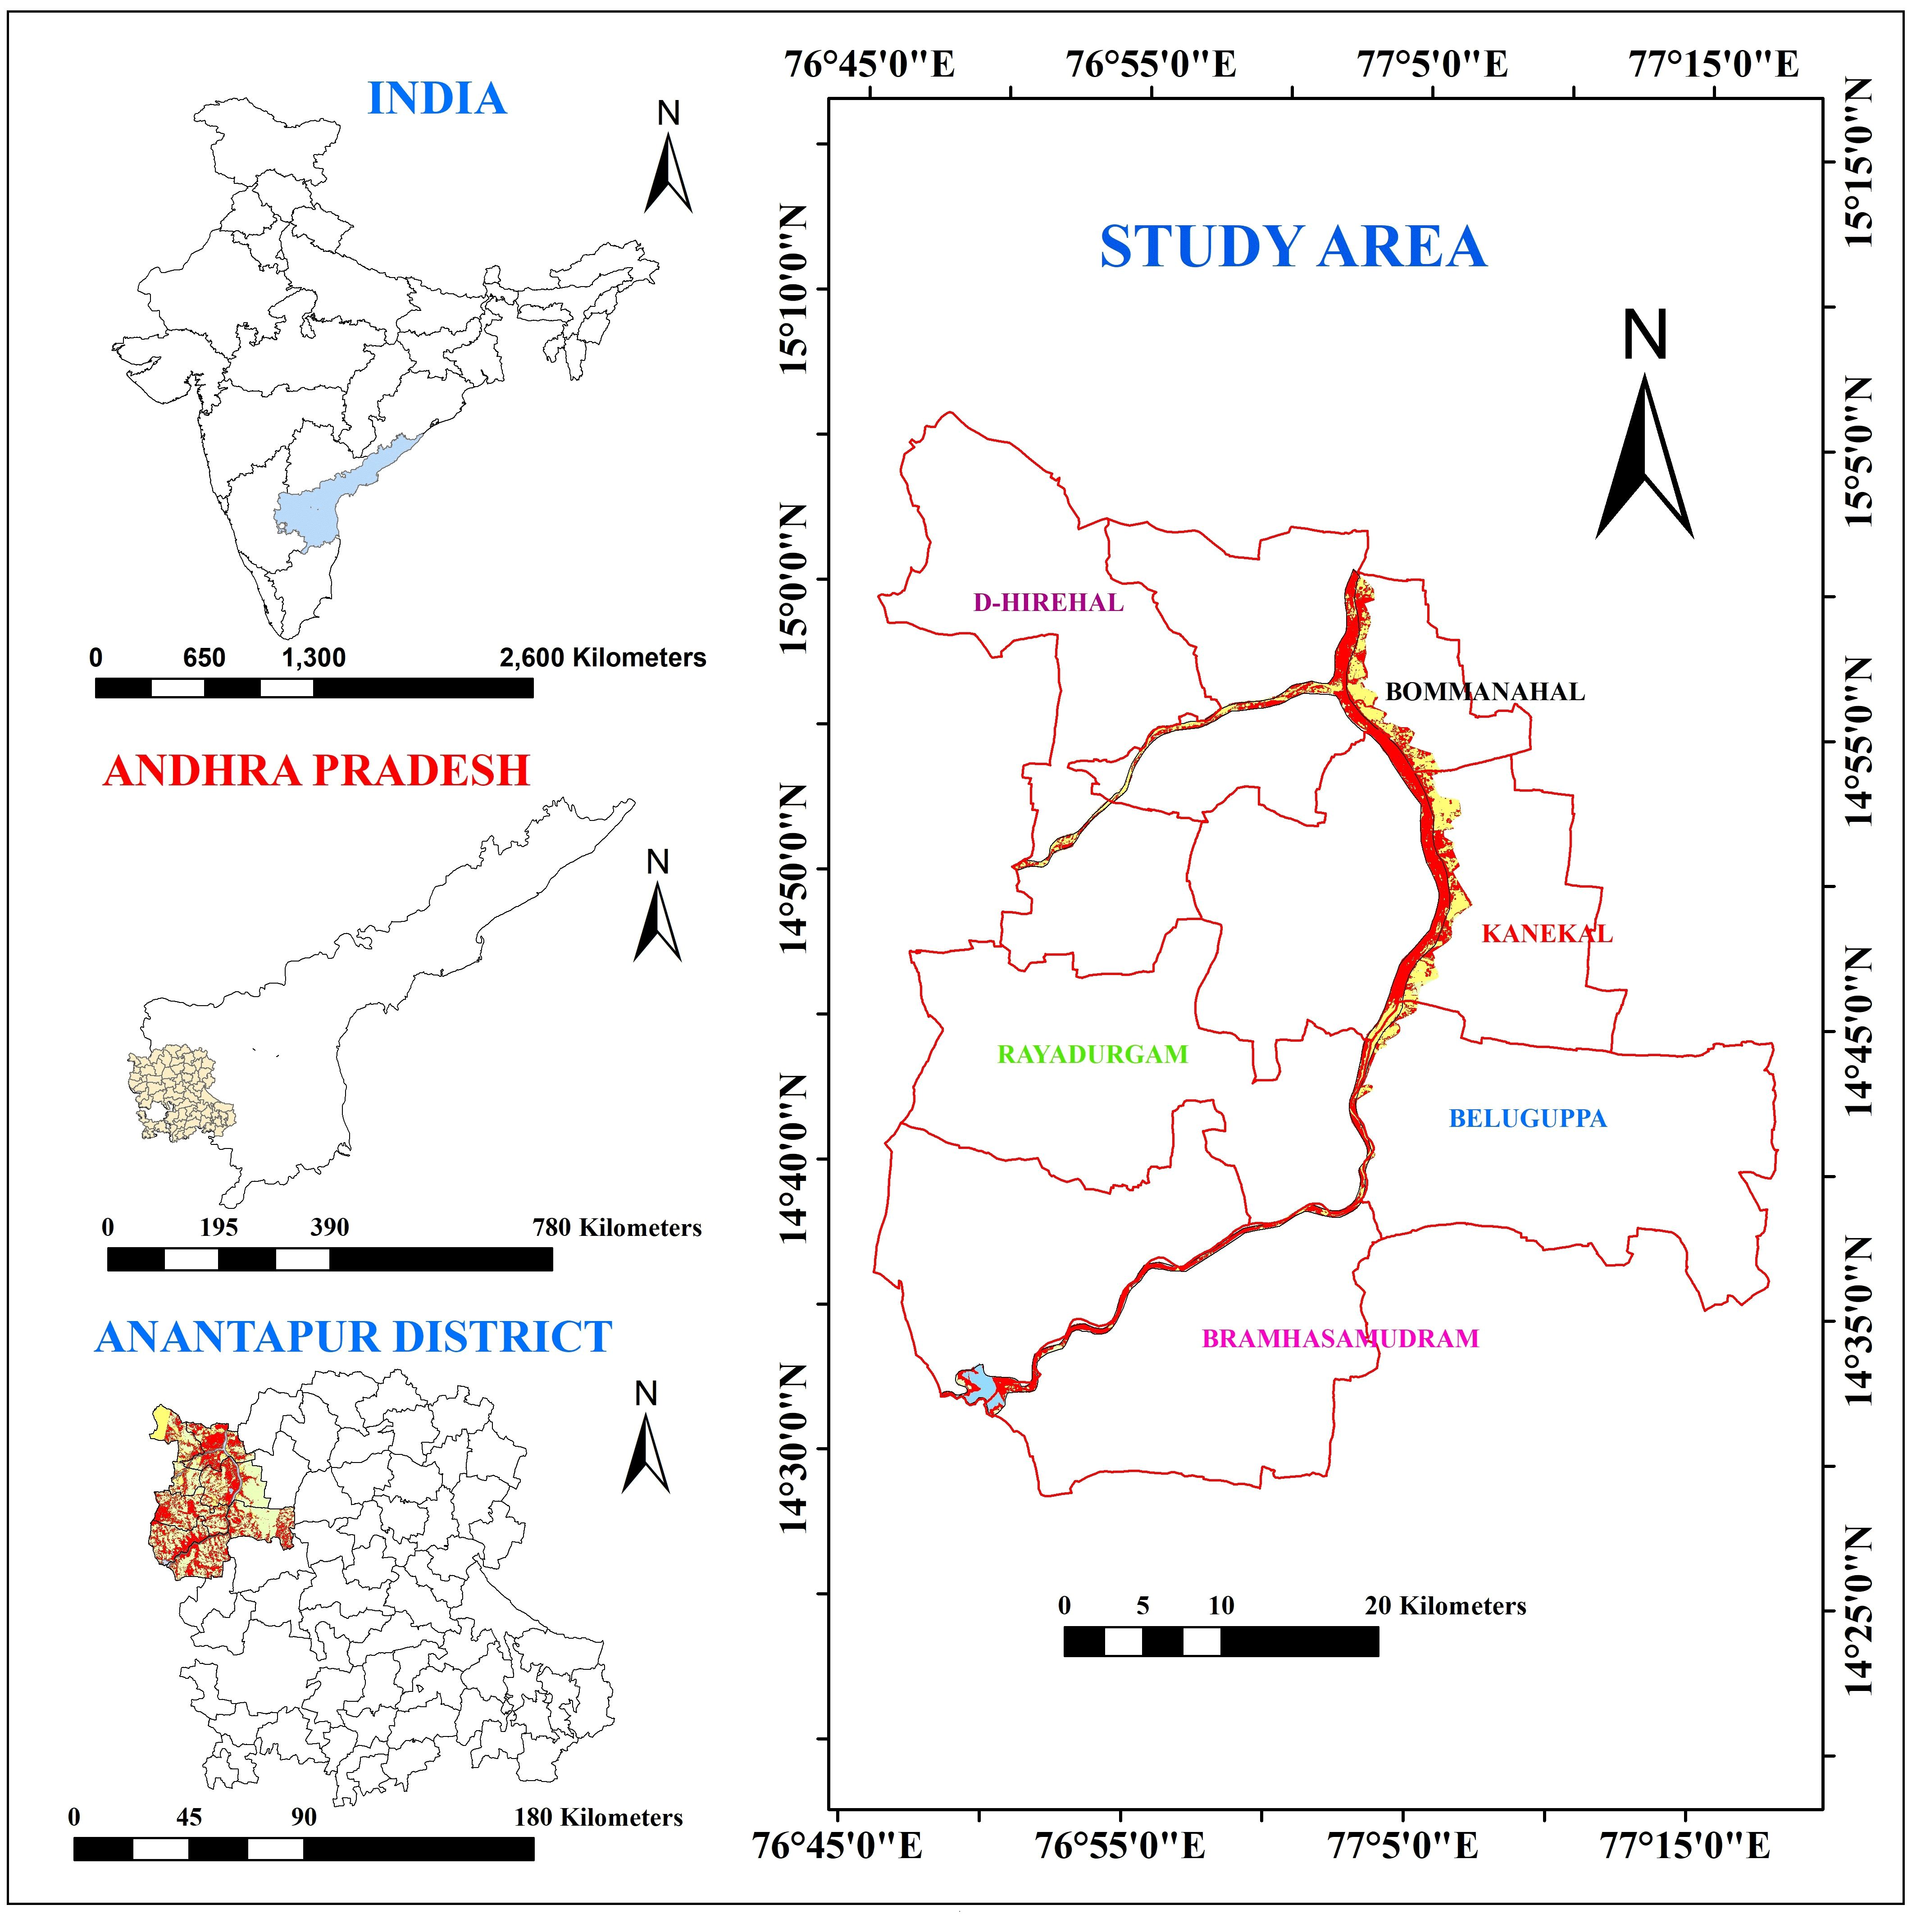
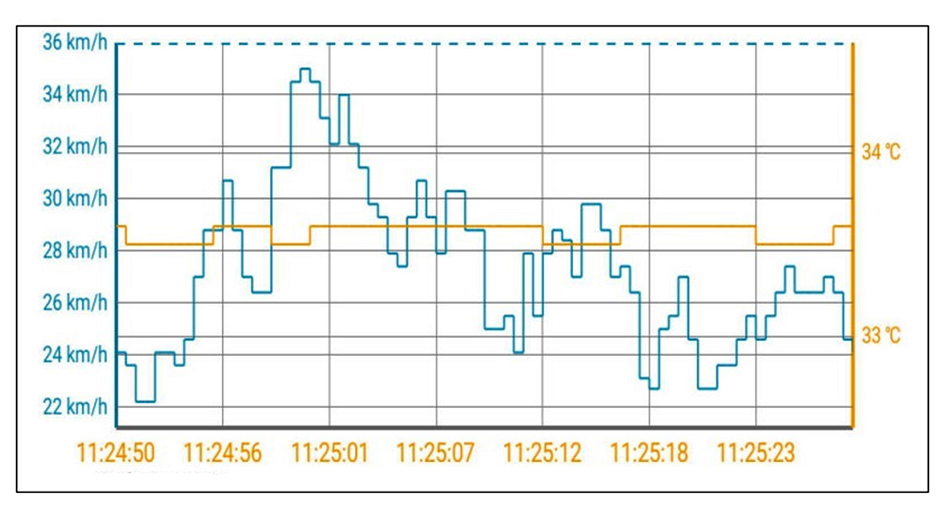
The Vedavathi (Hagari) River is the tributary of the Tunga Bhadra River. The Vedavathi River rises from the Bababudanagiri Mountains of Western Ghats and streams through the Karnataka and Andhra Pradesh states. The river Vedavathi known as Hagari in the lower reaches rises near in the Western Ghats. It has a total length of 391 Km and of which the length in the Karnataka state is 293 Km and forms the common boundary between Karnataka and Andhra Pradesh for 26 Km. Vedavathi river lies between 14°30' and 15°10' N and 76°45' and 77°15'E and mainly flows through Bommanahal, Kanekal, Beluguppa, Brahmasamudram, Gummagatta, Rayadurgam, D-Hirehal mandalas of Anantapur district which is the South most district of Rayalaseema region of Andhra Pradesh state and it is fallen in the Survey of India (SOI) toposheets of 57B/13, 57B/14, 57B/15, 57F/1, 57F/2, 57F/3, 57F/5,57F/6 and 57F/7 (Figure 1). The study area west being located in the rain shadow area of Western Ghats and is one among the villages which are frequently facing drought conditions in the country. The present study area receives an average rainfall of 520mm is lower most in the state (Pradeep Kumar et al., 2018, Rajasekhar et al., 2018a and 2018b). This region is facing humid climate with temperature alternating from 24 to 46o C in summer. Vedavathi River is the foci and most significant rivers in Anantapur district. It is seasonal or an ephemeral river, thus remain as dry throughout the year. Local historical evidence shows that, nearly 200 years ago, due to heavy flood in the Vedavathi River, maximum of the fine sand from the river fed has been drifted and placed up to a substantial distance on agricultural fields plummeting soil fertility on the eastern sideways of the river. During the months of June to August, this region experiences strong surface winds nearly 36 to 38 Km/h from west to easterly direction by the Southwest Monsoon. Unidirectional Asymmetrical Ripple marks in the sand dunes are evidence for this migration in easterly direction of the study part. Figure 5 depicts the Anemometer wind speed in the SW monsoon). For this durable surface winds sand has been wandered to the crop fields and the land degradation is happening and finally decertified.
Figure 1. Study area: Vedavathi River
2.1 Hydrogeomorphology Setting
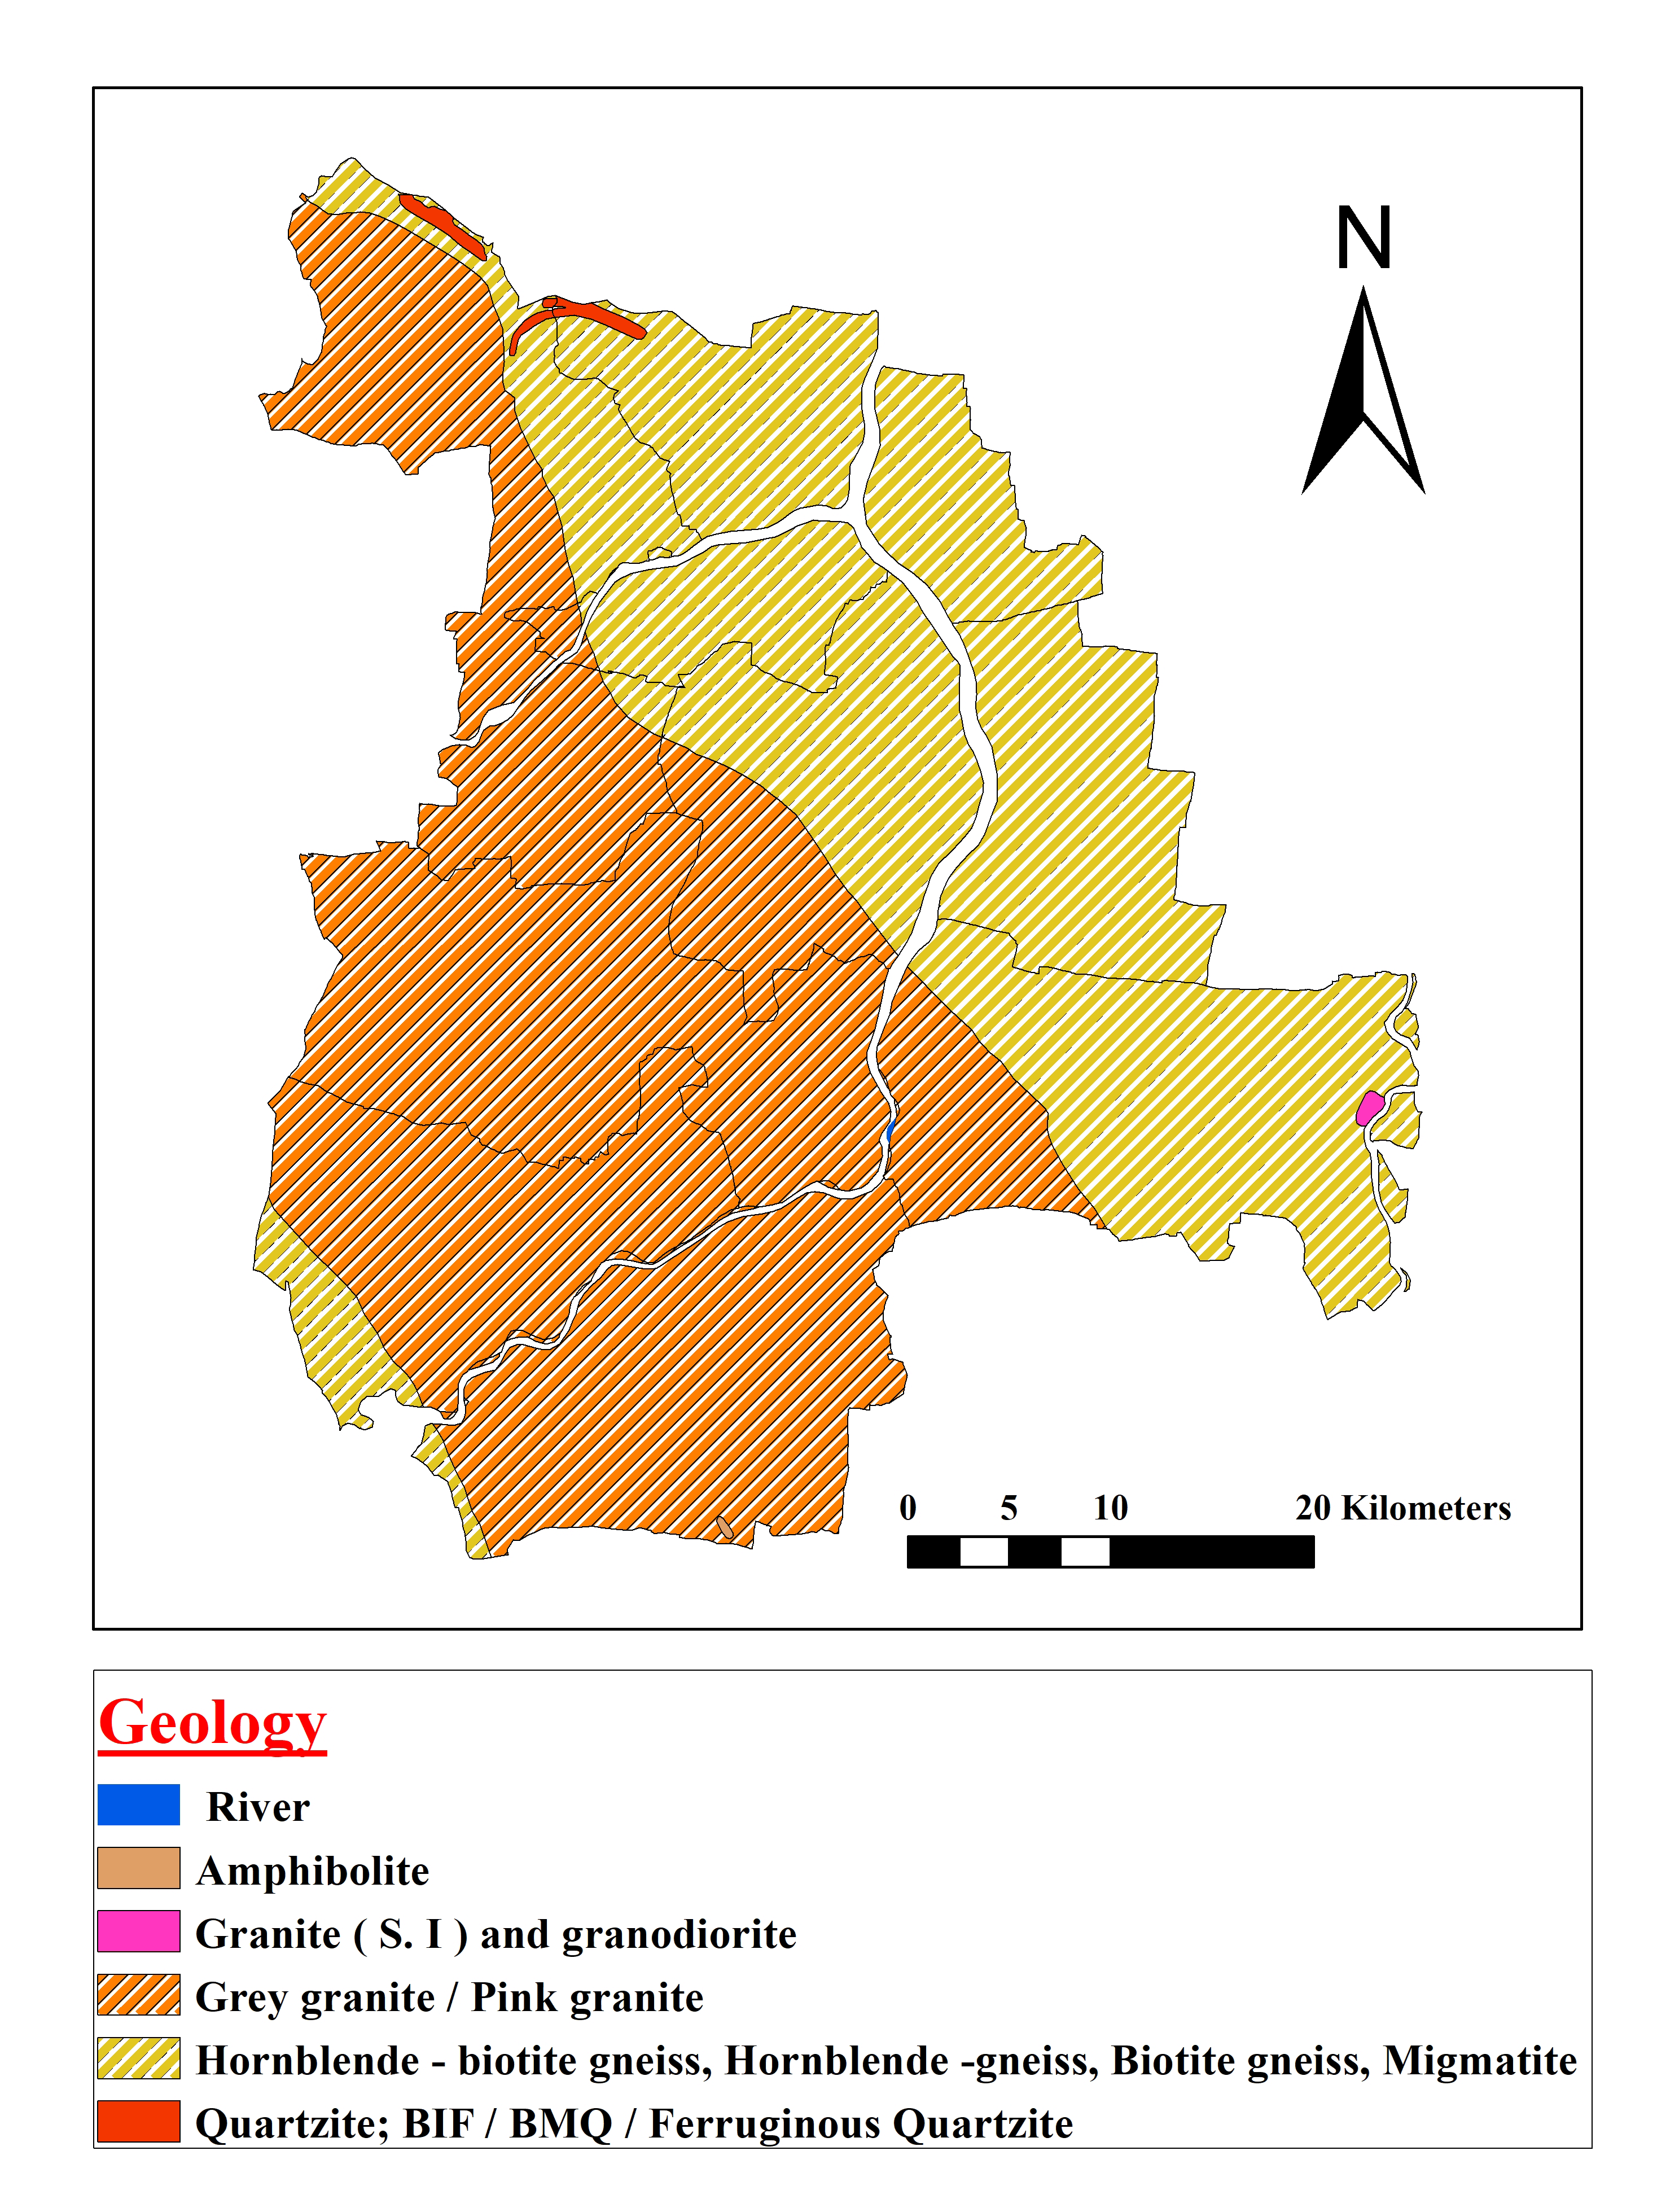
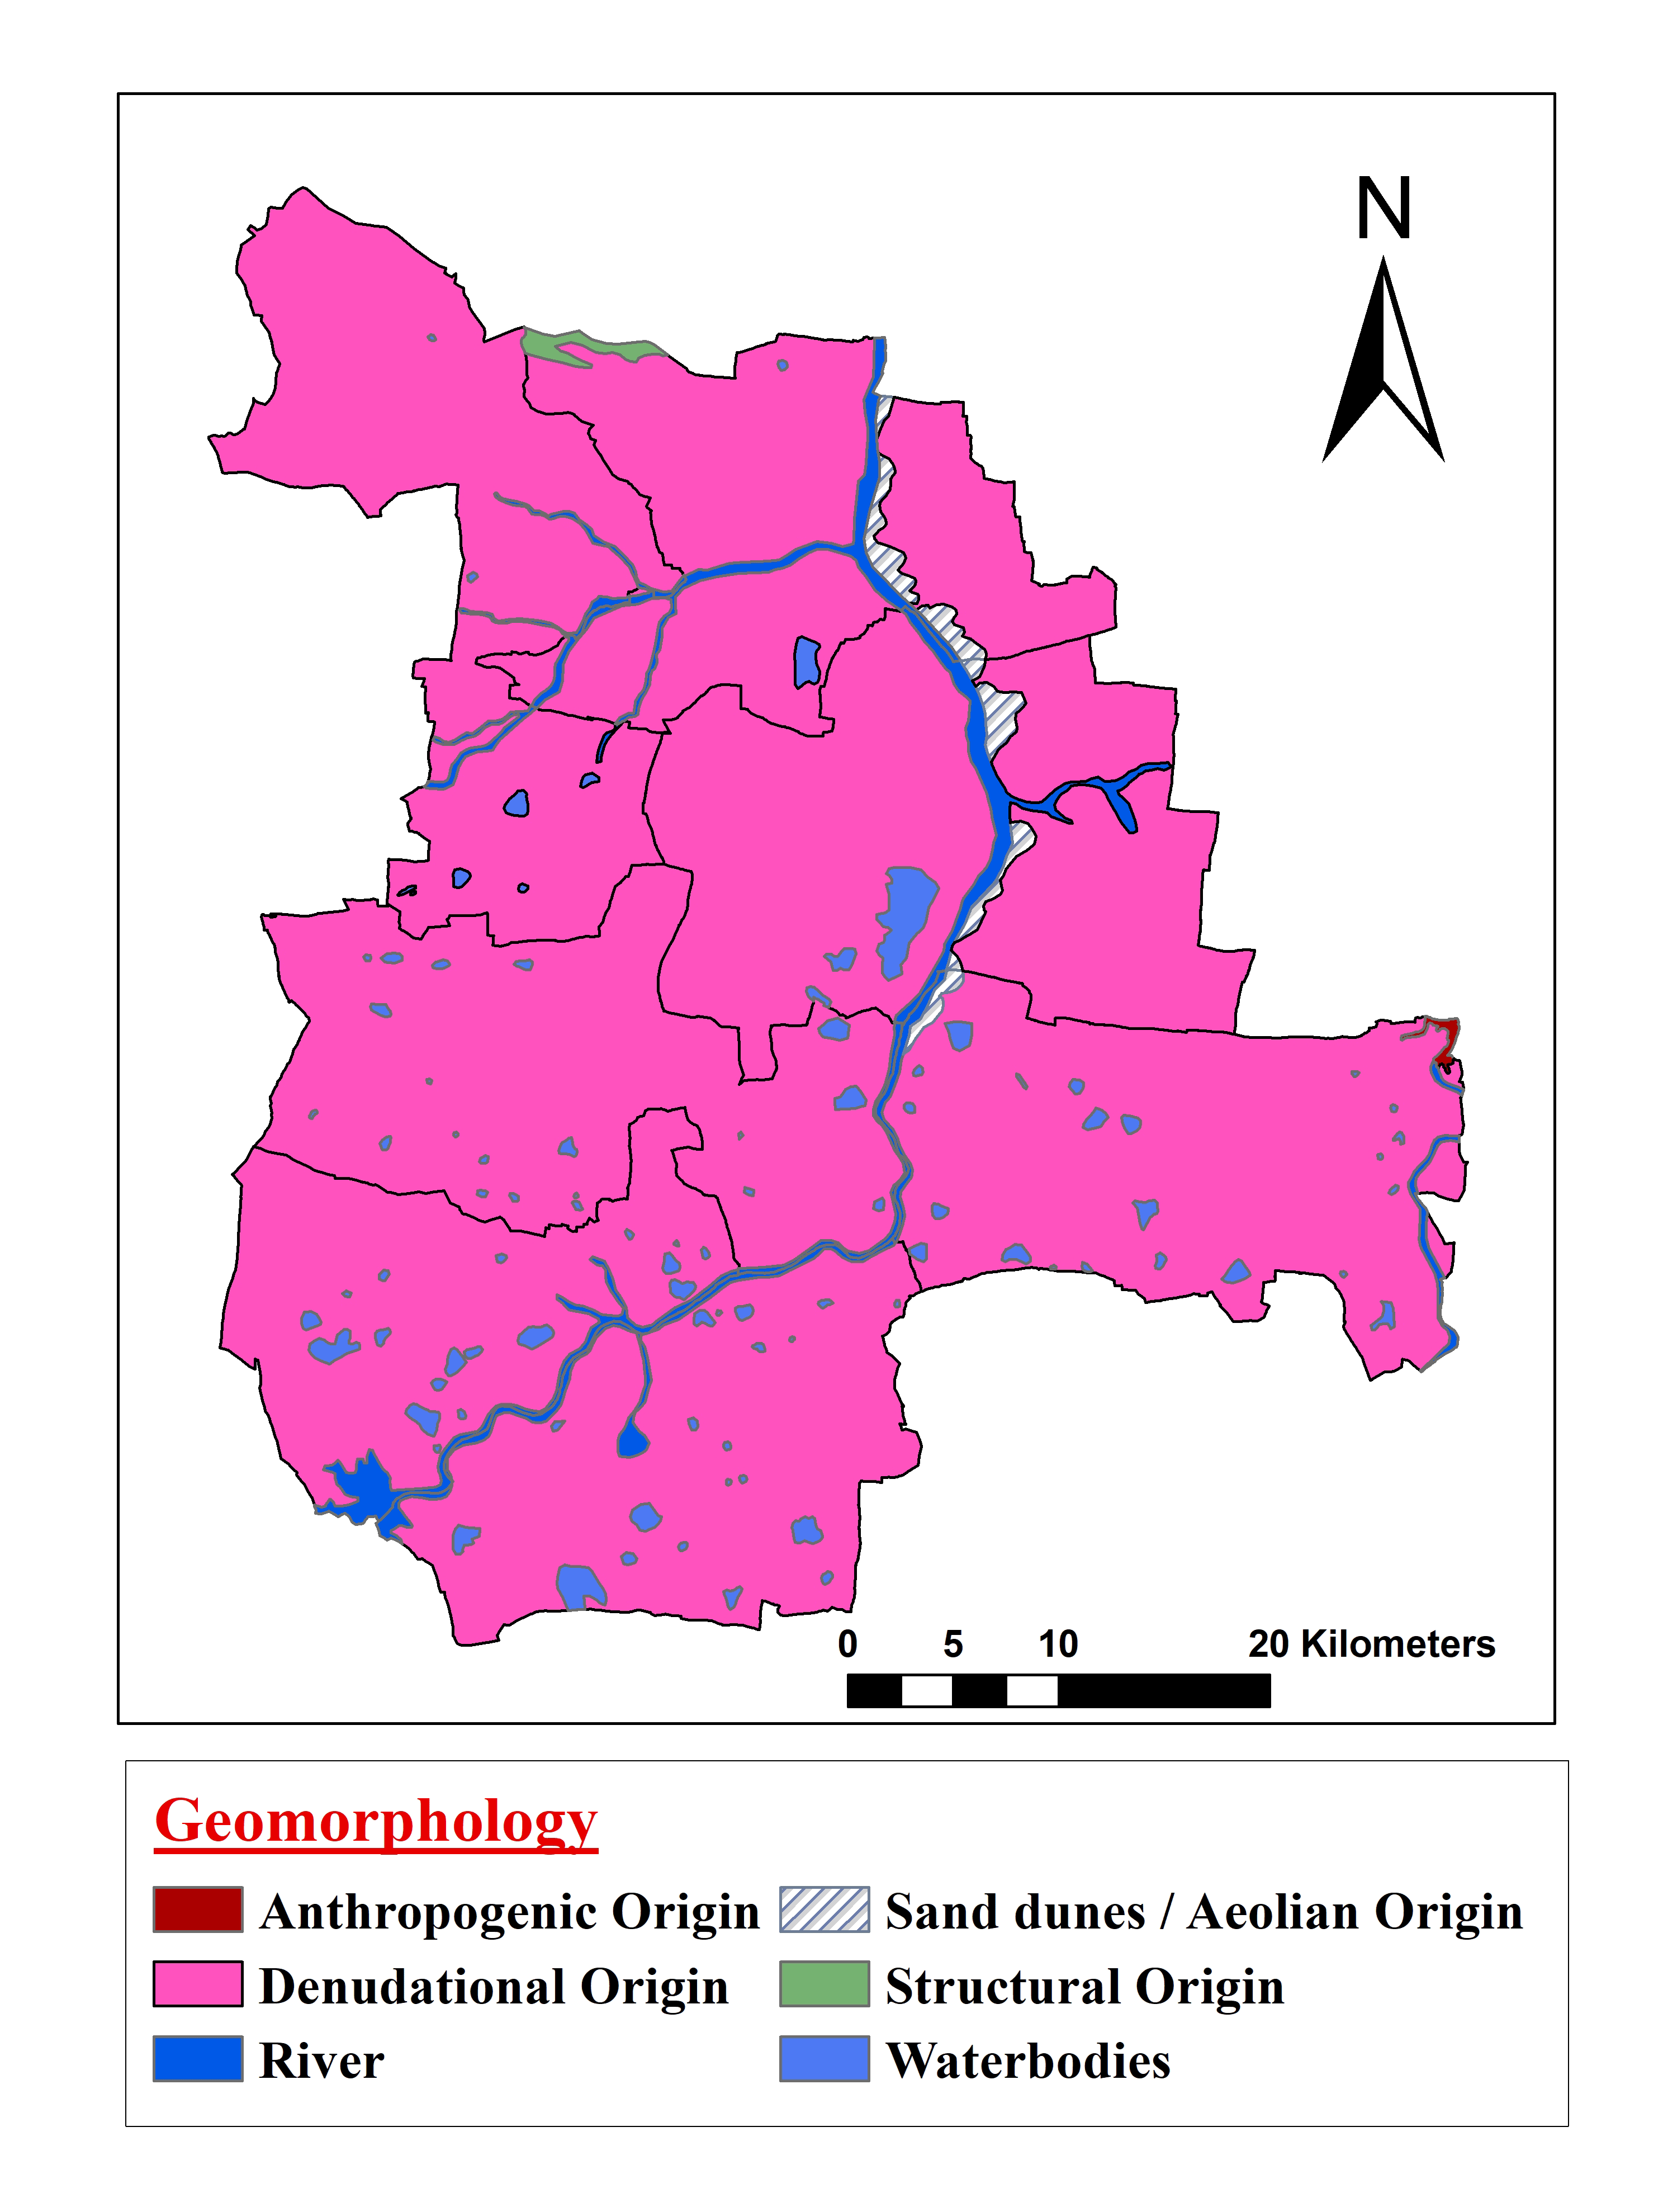
The study area covered by hard rock terrain along with an Archaean Peninsular Gneissic Complex (PGC) of hornblende-biotite gneiss, granodiorite and Lamprophyre (GSI, 2002). These granite rocks intersect with the underground dikes. The major rock types present in the eastern portion of the study area belongs to the Archean age, they are PGC consisting felsic hornblende-biotite gneiss, hornblende gneiss, granite, granodiorite, biotite gneiss and Migmatites. Quartzite, Banded Iron Formations (BIF), Banded Magnetite Quartzite’s and ferruginous quartzite’s are also present in the top portion of the study area, they belong to the Dharwar super group of Archean to lower Proterozoic age. Pink granite or Grey granite (closepet granite) is current in the western portion of the study area (Figure 2a). In case of denudational landforms, shallow weathered pediplain, fairly and shallow weathered pediplains, pediment, pediment complicated, residual hill and denudational hill, fairly and shallow weathered pediplains, pediment, pediment in complicated and active geomorphological changes have been occurred by the action of wind or Aeolian process. Unidirectional Asymmetrical Ripple marks are present in the study part, which gives evidence for the active Aeolian process (Figure 7). Unstable sand dunes and alluvium is seen all along the Vedavathi River (Figure 2b).
Figure 2a. Geology
Figure 2b. Geomorphology
3 . METHODOLOGY
3.1 Database
The spatial database consisted of change detection layers prepared from RS data Landsat 4, 5, 7 and 8 satellite imageries are used. The satellite data is geometrically corrected enhanced for visual interpretation, ground truth collection and land degradation map preparation. Landsat 8 satellite imagery merged satellite data is available as a default base layer which is helpful in delineating the change classes in a better way (Table 1). Landsat 4-5, Landsat 7 satellite images for year 1990 to 2010 and Landsat 8 satellite images for 2018 were used for LULC change detection. These images were imported in ERDAS Imagine software 2014, ArcGIS environment to prepare FCC [False Color Composite] images. The sub-setting of data sets were executed for extracting present study from satellite images by implementing georeferencing for boundary outline of area of interest.
LULC classification carried out through supervised image classification in ERDAS IMAGINE 2014 software, using Landsat satellite imageries over the study area, which were acquired from USGS Earth Explorer (https://earthexplorer.usgs.gov/). In the present study, an integrated use of multispectral satellite data is used for the generation of database and extraction of numerous LULC patterns. Details of the data used are shown in Table 1. The image classification process performed in ERDAS imagine environment to prepare land use / land cover (LULC) analysis by supervised classification. Four signature files have been created namely sand/sand dunes, vegetation, fallow land and water bodies (Table 3). These supervised classifications based LULU has been done for the years 1990, 2000, 2010 and, 2018. Vedavathi River is attentive, where the sand is initiated and migrated from the tributary banks to adjoining areas. Vedavathi river shape file is created and clipped on LULC map for the past 28 years. LULC parameters were analyzed and classified into 5 classes, associated with their orientation in space (Rajasekhar et al., 2019c). The determination of the Landsat images was impacted by low cloud cover over the study area (Table 1). These images are pre-processed by clip methods using geospatial techniques such as, ERDAS Imagine 2014 and ArcGIS environments.
3.3 Land Use Land Cover Classification
To carry out the LULC analysis, supervised classification technique with maximum likelihood algorithm was applied in the ERDAS Imagine 2014. Maximum likelihood algorithm is one of the best and easiest approaches in the image classification method with RS data sets. This approach is based on the pixel based probability analysis for a specific feature. The theory adopts for probabilities are identical for all features and the input pixels have a standard dissemination. However, this method takes a long time to calculate, is highly dependent on the normal distribution of data in each input range, and tends to over classify with relatively signature editor in the covariance matrix. The spectral analysis approach computes the spectral analysis between the candidate vector pixel measurement vector and the mean vector for each signature, and the spectral analysis (Table 2). It requires the shortest calculation time among other image classification approach, but pixels that do not need to be unclassified are classified and class variability is not taken into account. Field work was carried out for inaccessible and doubtful regions were corrected in the ERDAS Imagine environment. The most important final step at classification process is accuracy assessment. The aim of accuracy assessment is to quantitatively assess how effectively the pixels were sampled into the correct land cover classes. Moreover the key emphasis for accuracy assessment pixel selection was on areas that could be clearly identified on Landsat image, Google earth images and Google map. Four LULC change detection types are classified in the study area viz., (i) sand dunes (ii) vegetation (iii) fallow land and (iv) water body.
Table 2. Ground signatures of Landsat imageries
Category
Landscape
Tone and texture
Picture of landscape
FCC subset
Sand/sand dunes
Sand dunes, including areas with flat sands, dense barchans, dues chains, mobile star dunes, and climbing dunes
Whitish yellow to bright white and wavy texture.
Vegetation
The form and branching of the plants and trees and scrub will determine.
Vegetation appears in red color, this is more suitable in vegetation identification.
Fallow land
Agricultural fields without crops or sometimes waste lands may include as fallow land.
Bluish/greenish grey with smooth texture.
Lighter tone with irregular texture
Water body
It comprises man-made reservoirs / lakes / tanks / cannels also natural lakes, rivers / streams and creeks, etc.
Cyanish blue to blue according to the depth of water and sediment content with dark tone.
3.4 Change Detection Analysis
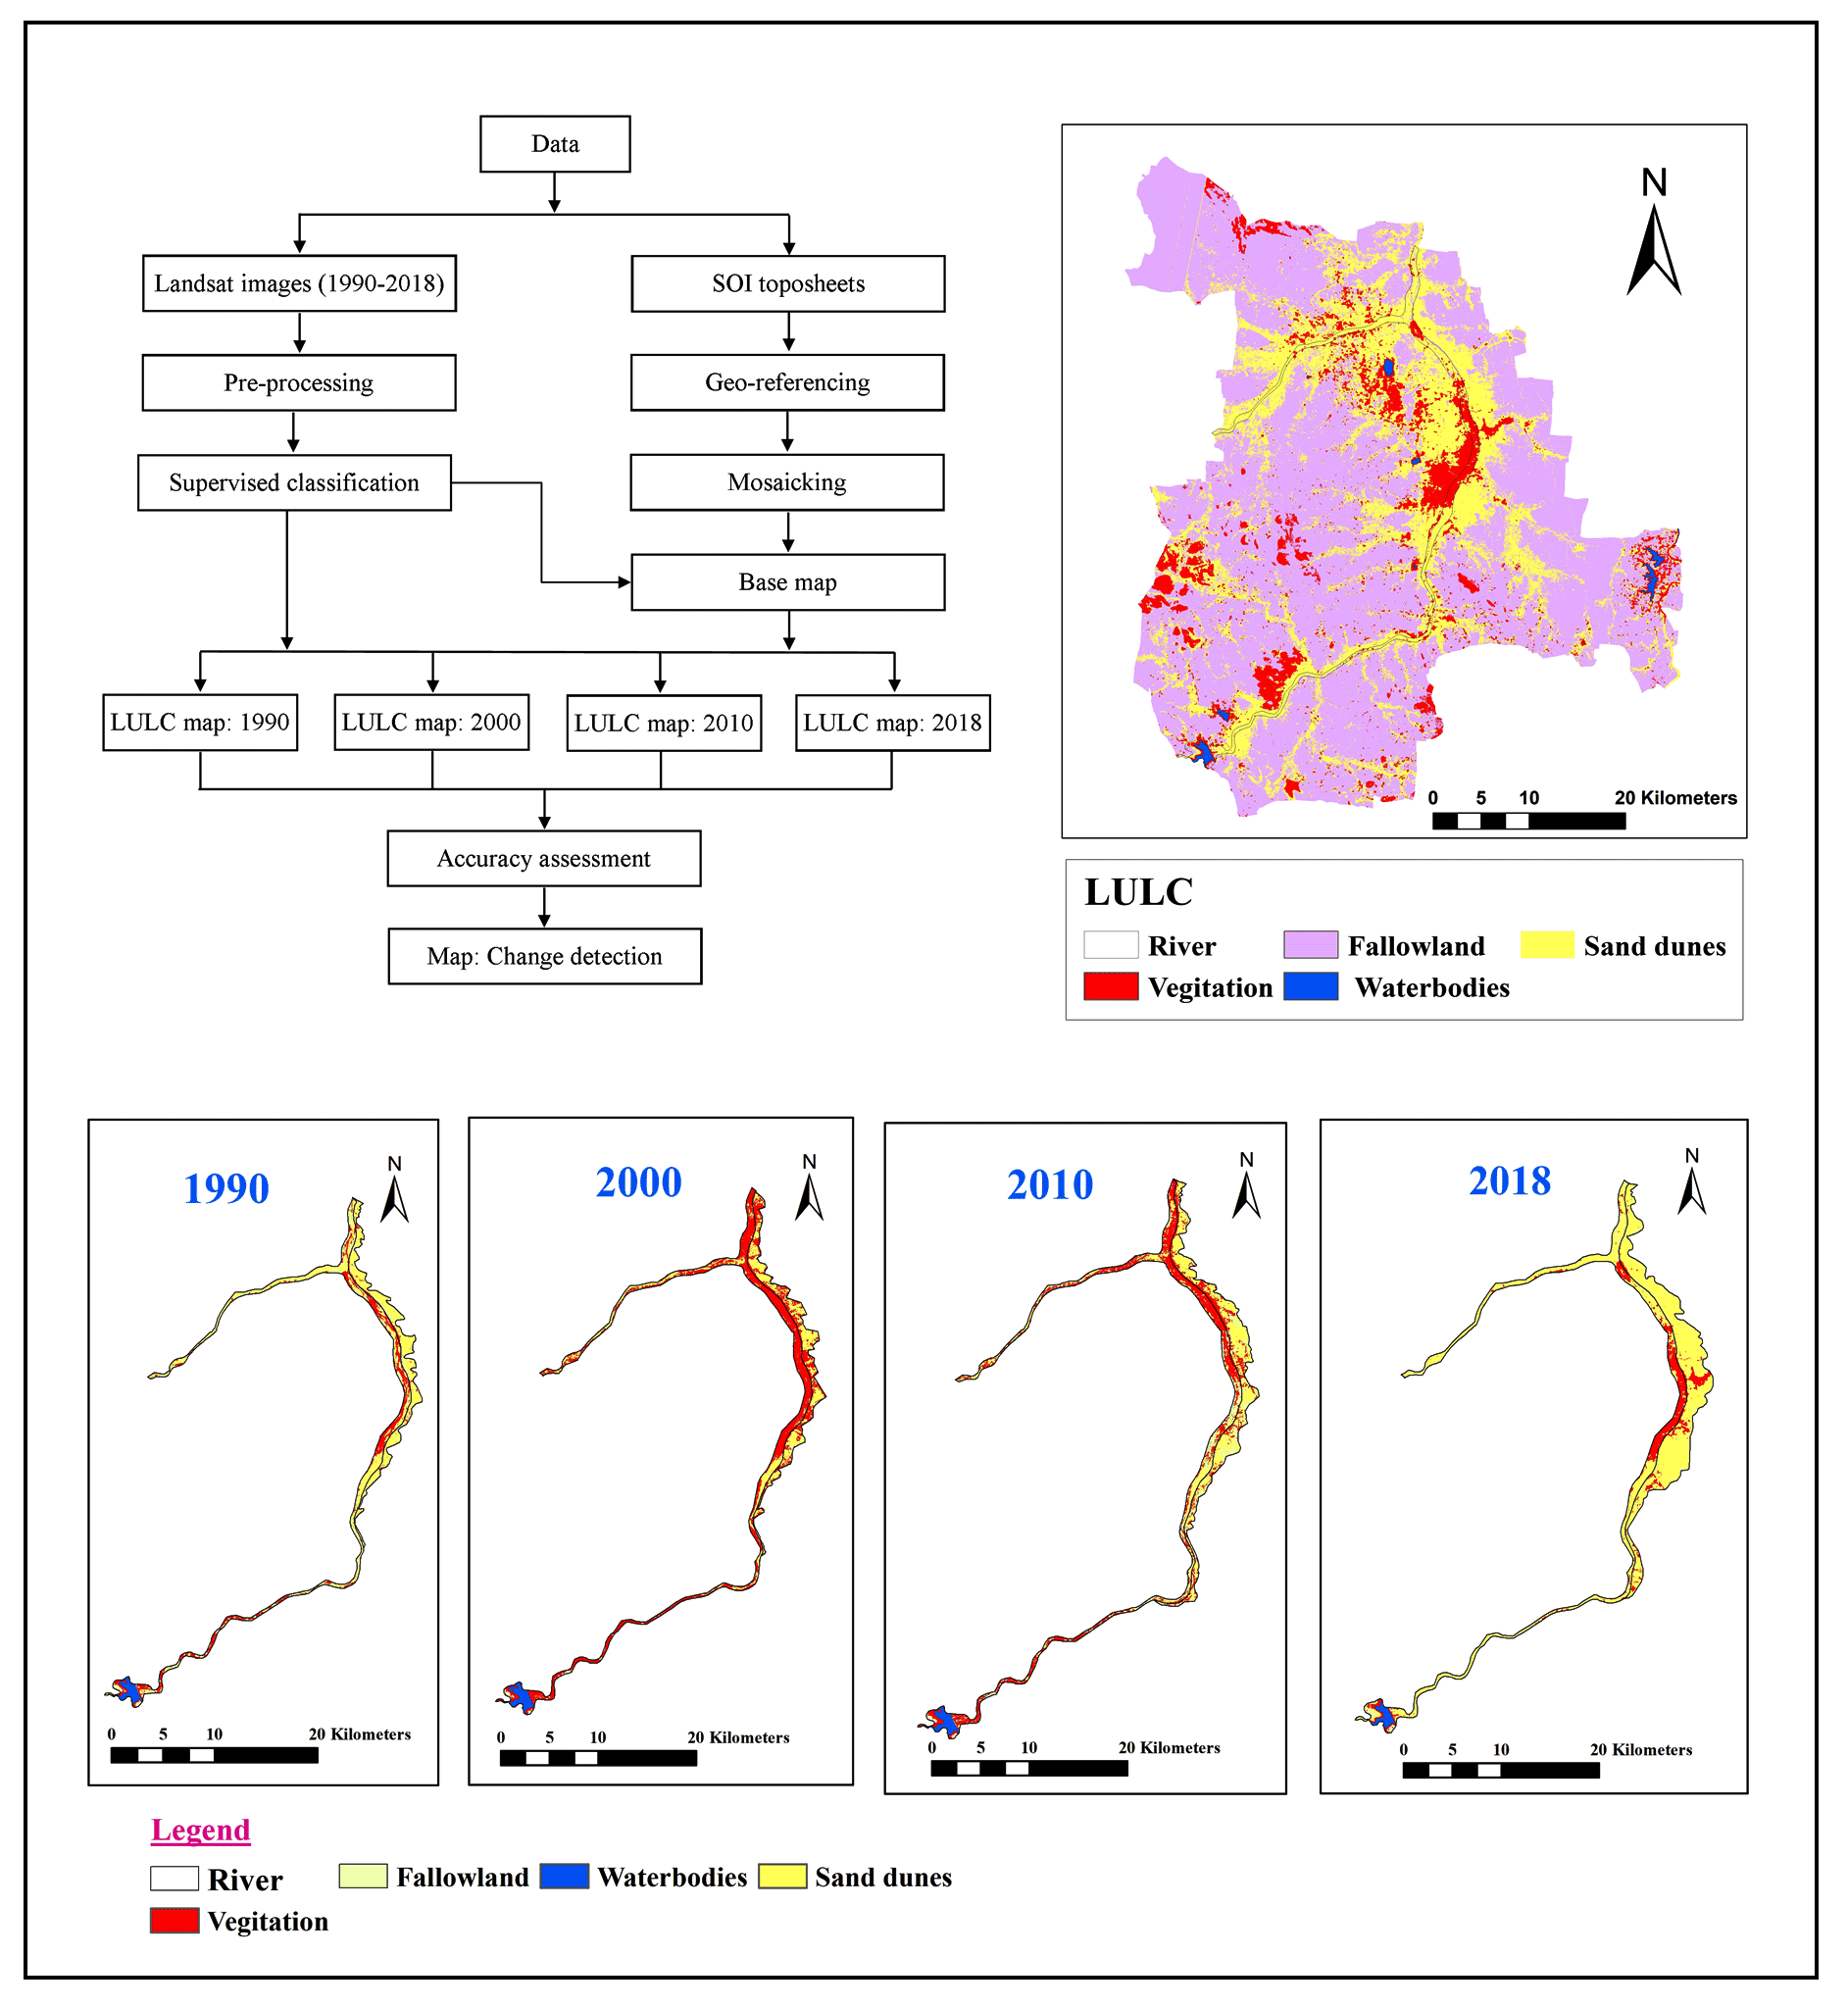
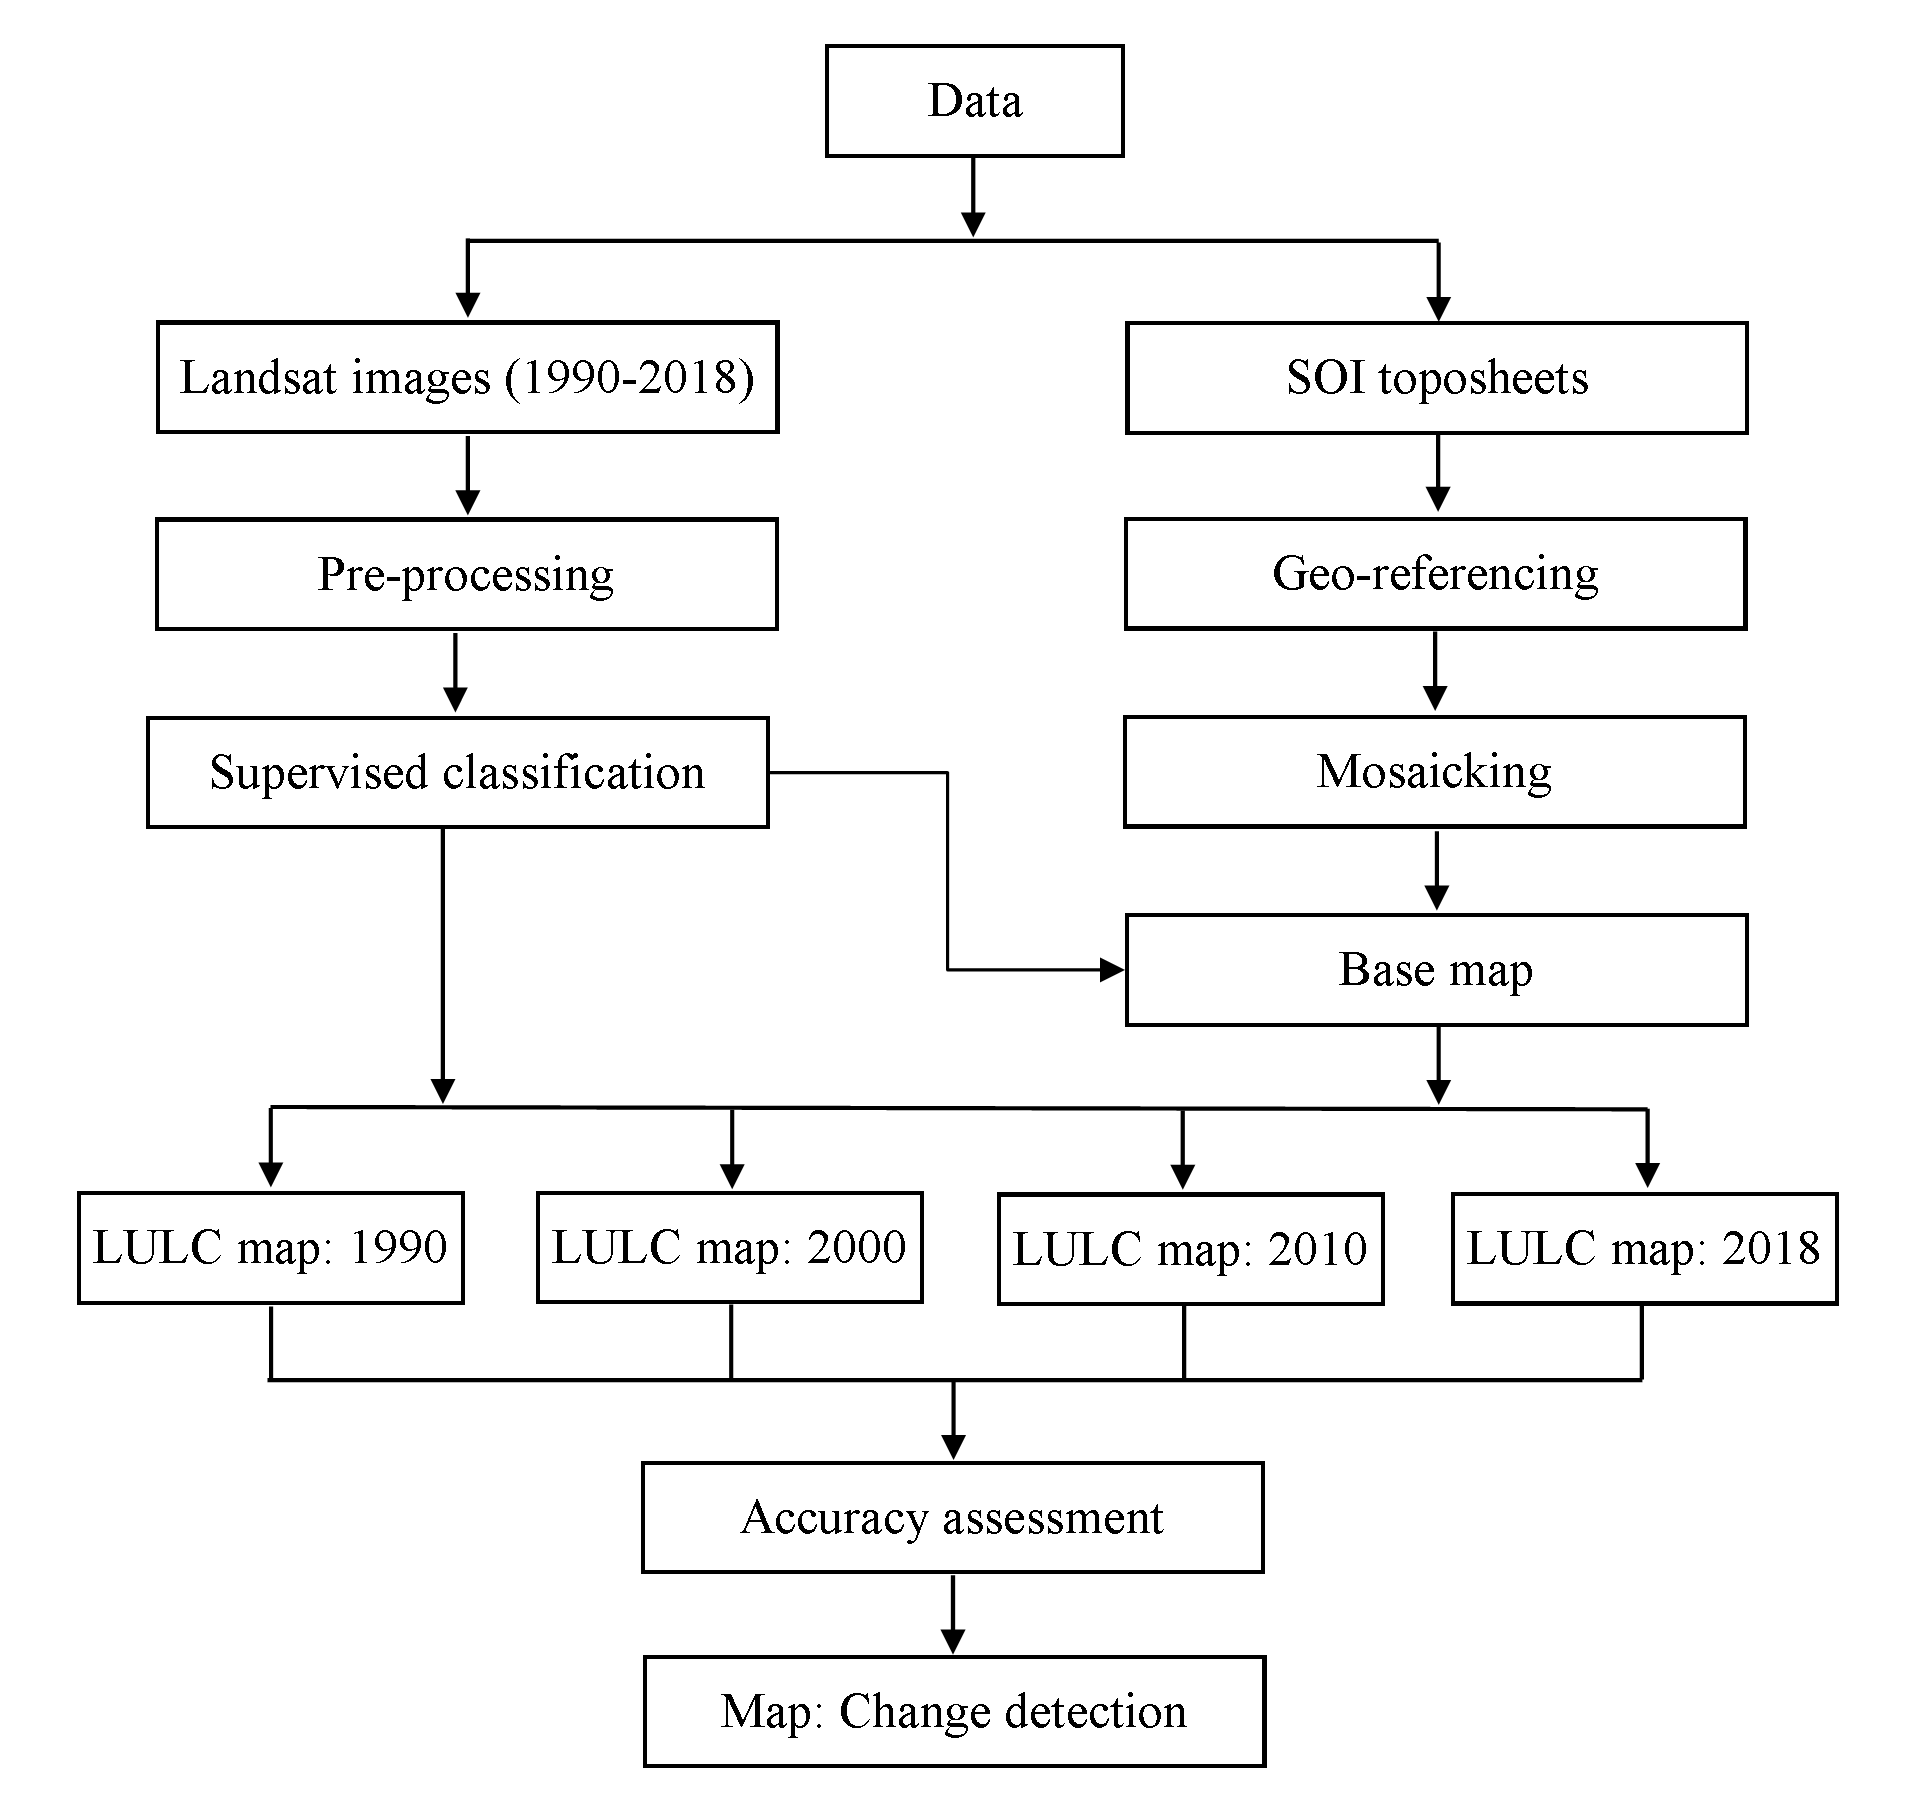
Geometric calculation method is also adopted for knowing the area of desertification or migrated area. The collective data has been handled for preparation of Desertification Status Maps (DSM). Further, we have collected statistical data for perceptive the rate of relocation of Aeolian sands. For execution change detection, a supervised and unsupervised classification was performed in the ERDAS imagine software by image classification technique. A pixel-based judgment was used to prepared change detection by pixel data to interpret the changes more efficient for the advantage of ‘from’ ‘to’’ data. The classified images for various years’ data compared using pixel data calculation to identify to calculative aspects in years from 1990 to 2018 (Rajasekhar et al., 2018b). Computable areal data of the overall desertified changes as well as gains and losses in both class between 1990 and 2018 were then accumulated. The overall methodology for present study is shown Figure 3.
Figure 3. Methodology
4 . RESULTS AND DISCUSSIONS
4.1 Land Use Land Cover
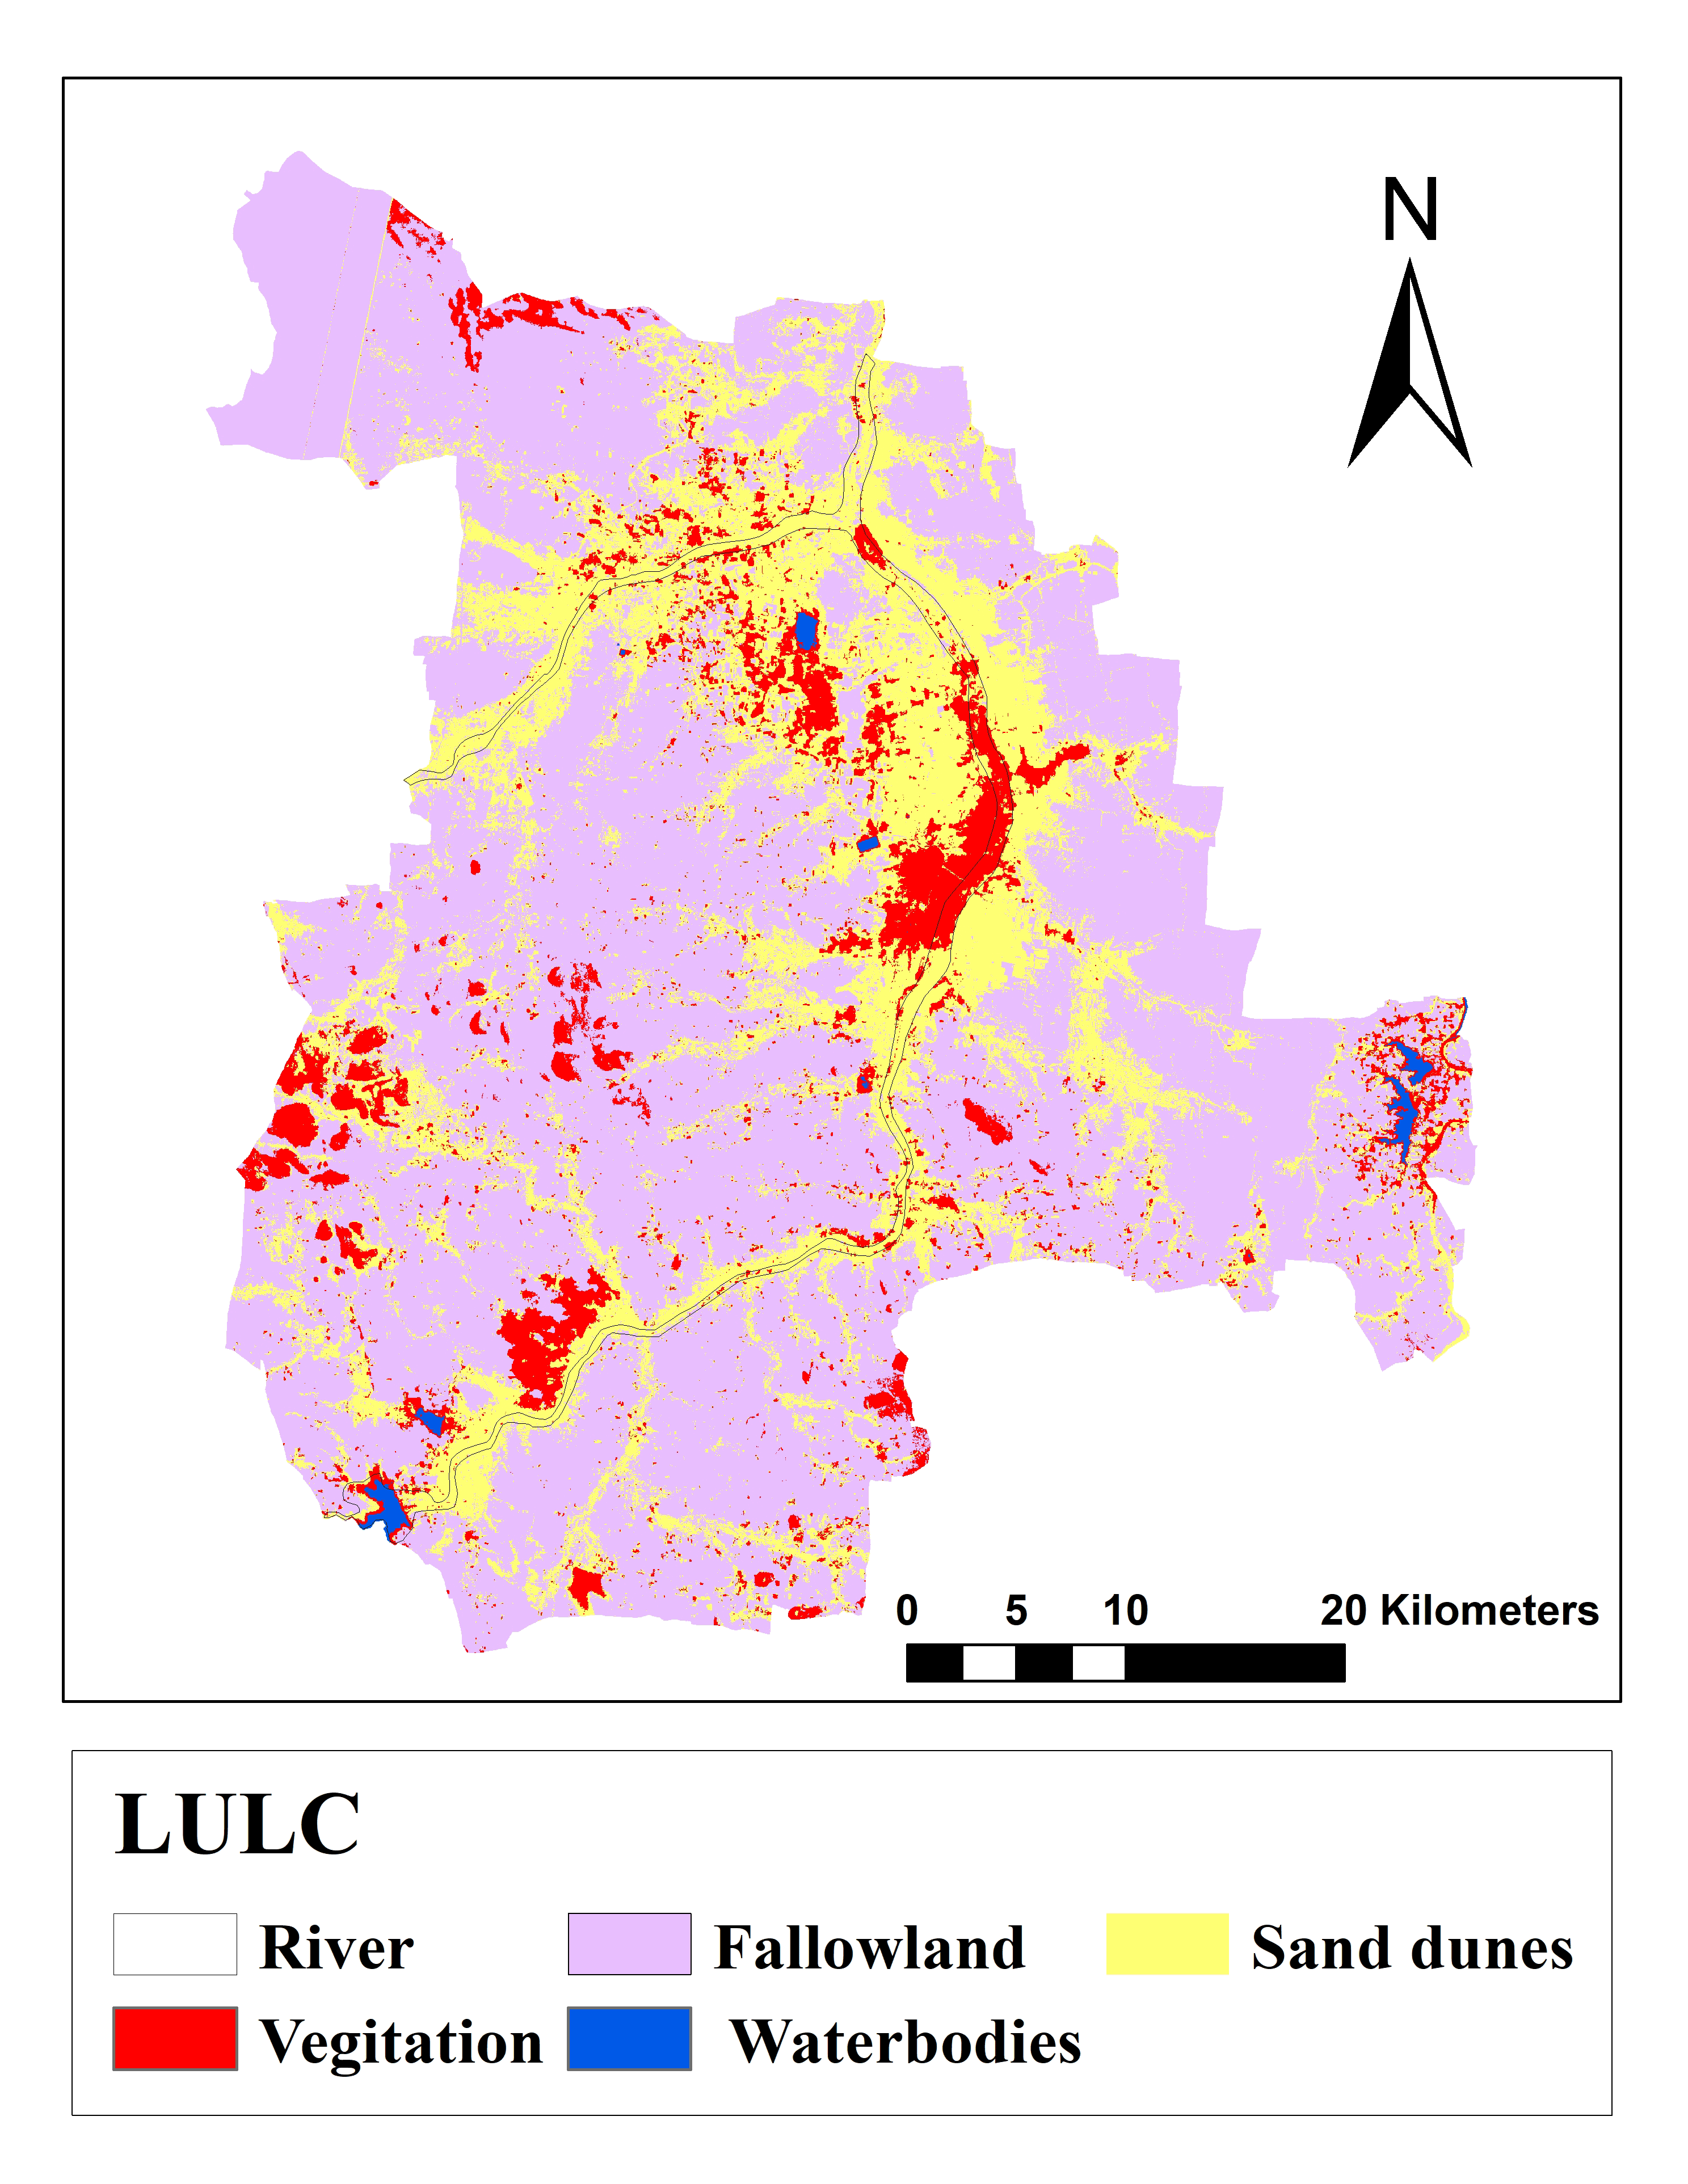
LULC in the region includes vegetation, fallow land, water bodies, and sand dunes. Present study shows LULC is major result to identify and estimate the land use exploitation which has a greater key role in the desertification by man-made process (Sreenivasulu et al., 2014; Rajasekhar et al., 2017 and 2019c; Pradeep Kumar et al., 2019). They have also contributed to the reduction of biological productivity, diversity and sustainability of the land. Mining, brick kiln deeds and industrial seepage affected areas are included under the anthropogenic factors (Figure 4).
Figure 4. Land use land cover
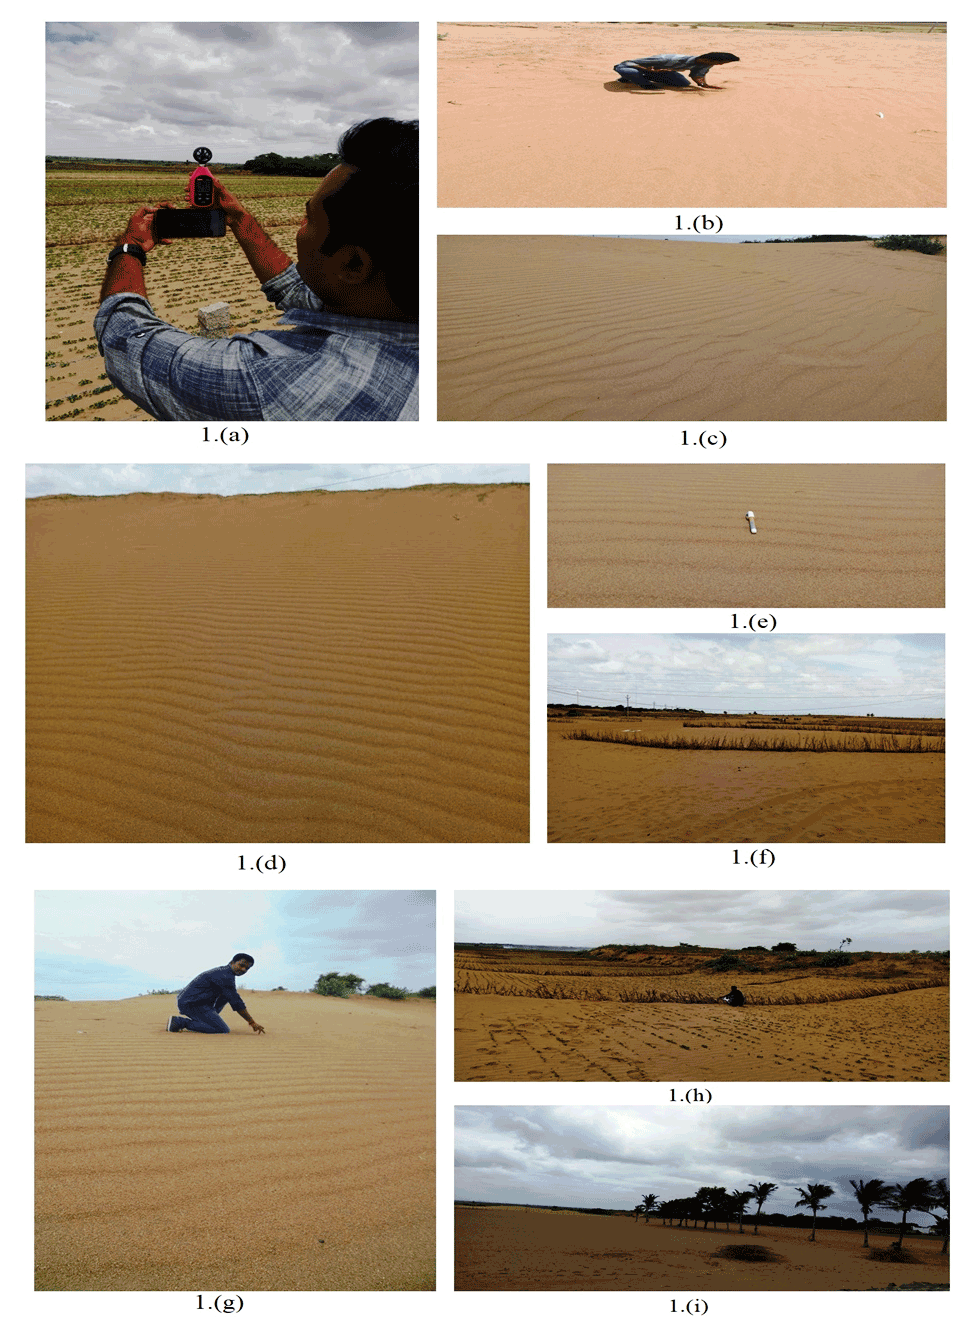
In this part an active geomorphological changes have been occurred by the action of wind. Unidirectional Asymmetrical Ripple marks are present in the study part, which gives evidence for the active desertification (Figure 7). Unstable sand dunes and alluvium is seen all sideways of the Vedavathi river due to high surface winds happening from SW monsoon (June -September). This sand has been migrated, the land degradation happens and finally desertified. Sand and dunes play an important key role in the change of ecosystems in the present study and its categorized into different types with their size, shape, incidence of environment, degree of complexity and the direction of winds. The risk of wind erosion is severe in the arid and semi-arid regions. It includes both the removal and deposition of soil particles due to the action of the wind and the abrasive effects of moving particles during transport. In sandy areas that accumulate with rain, the sand partially stabilizes completely, depending on the vegetation cover that it establishes.
4.2 Change Detection Analysis
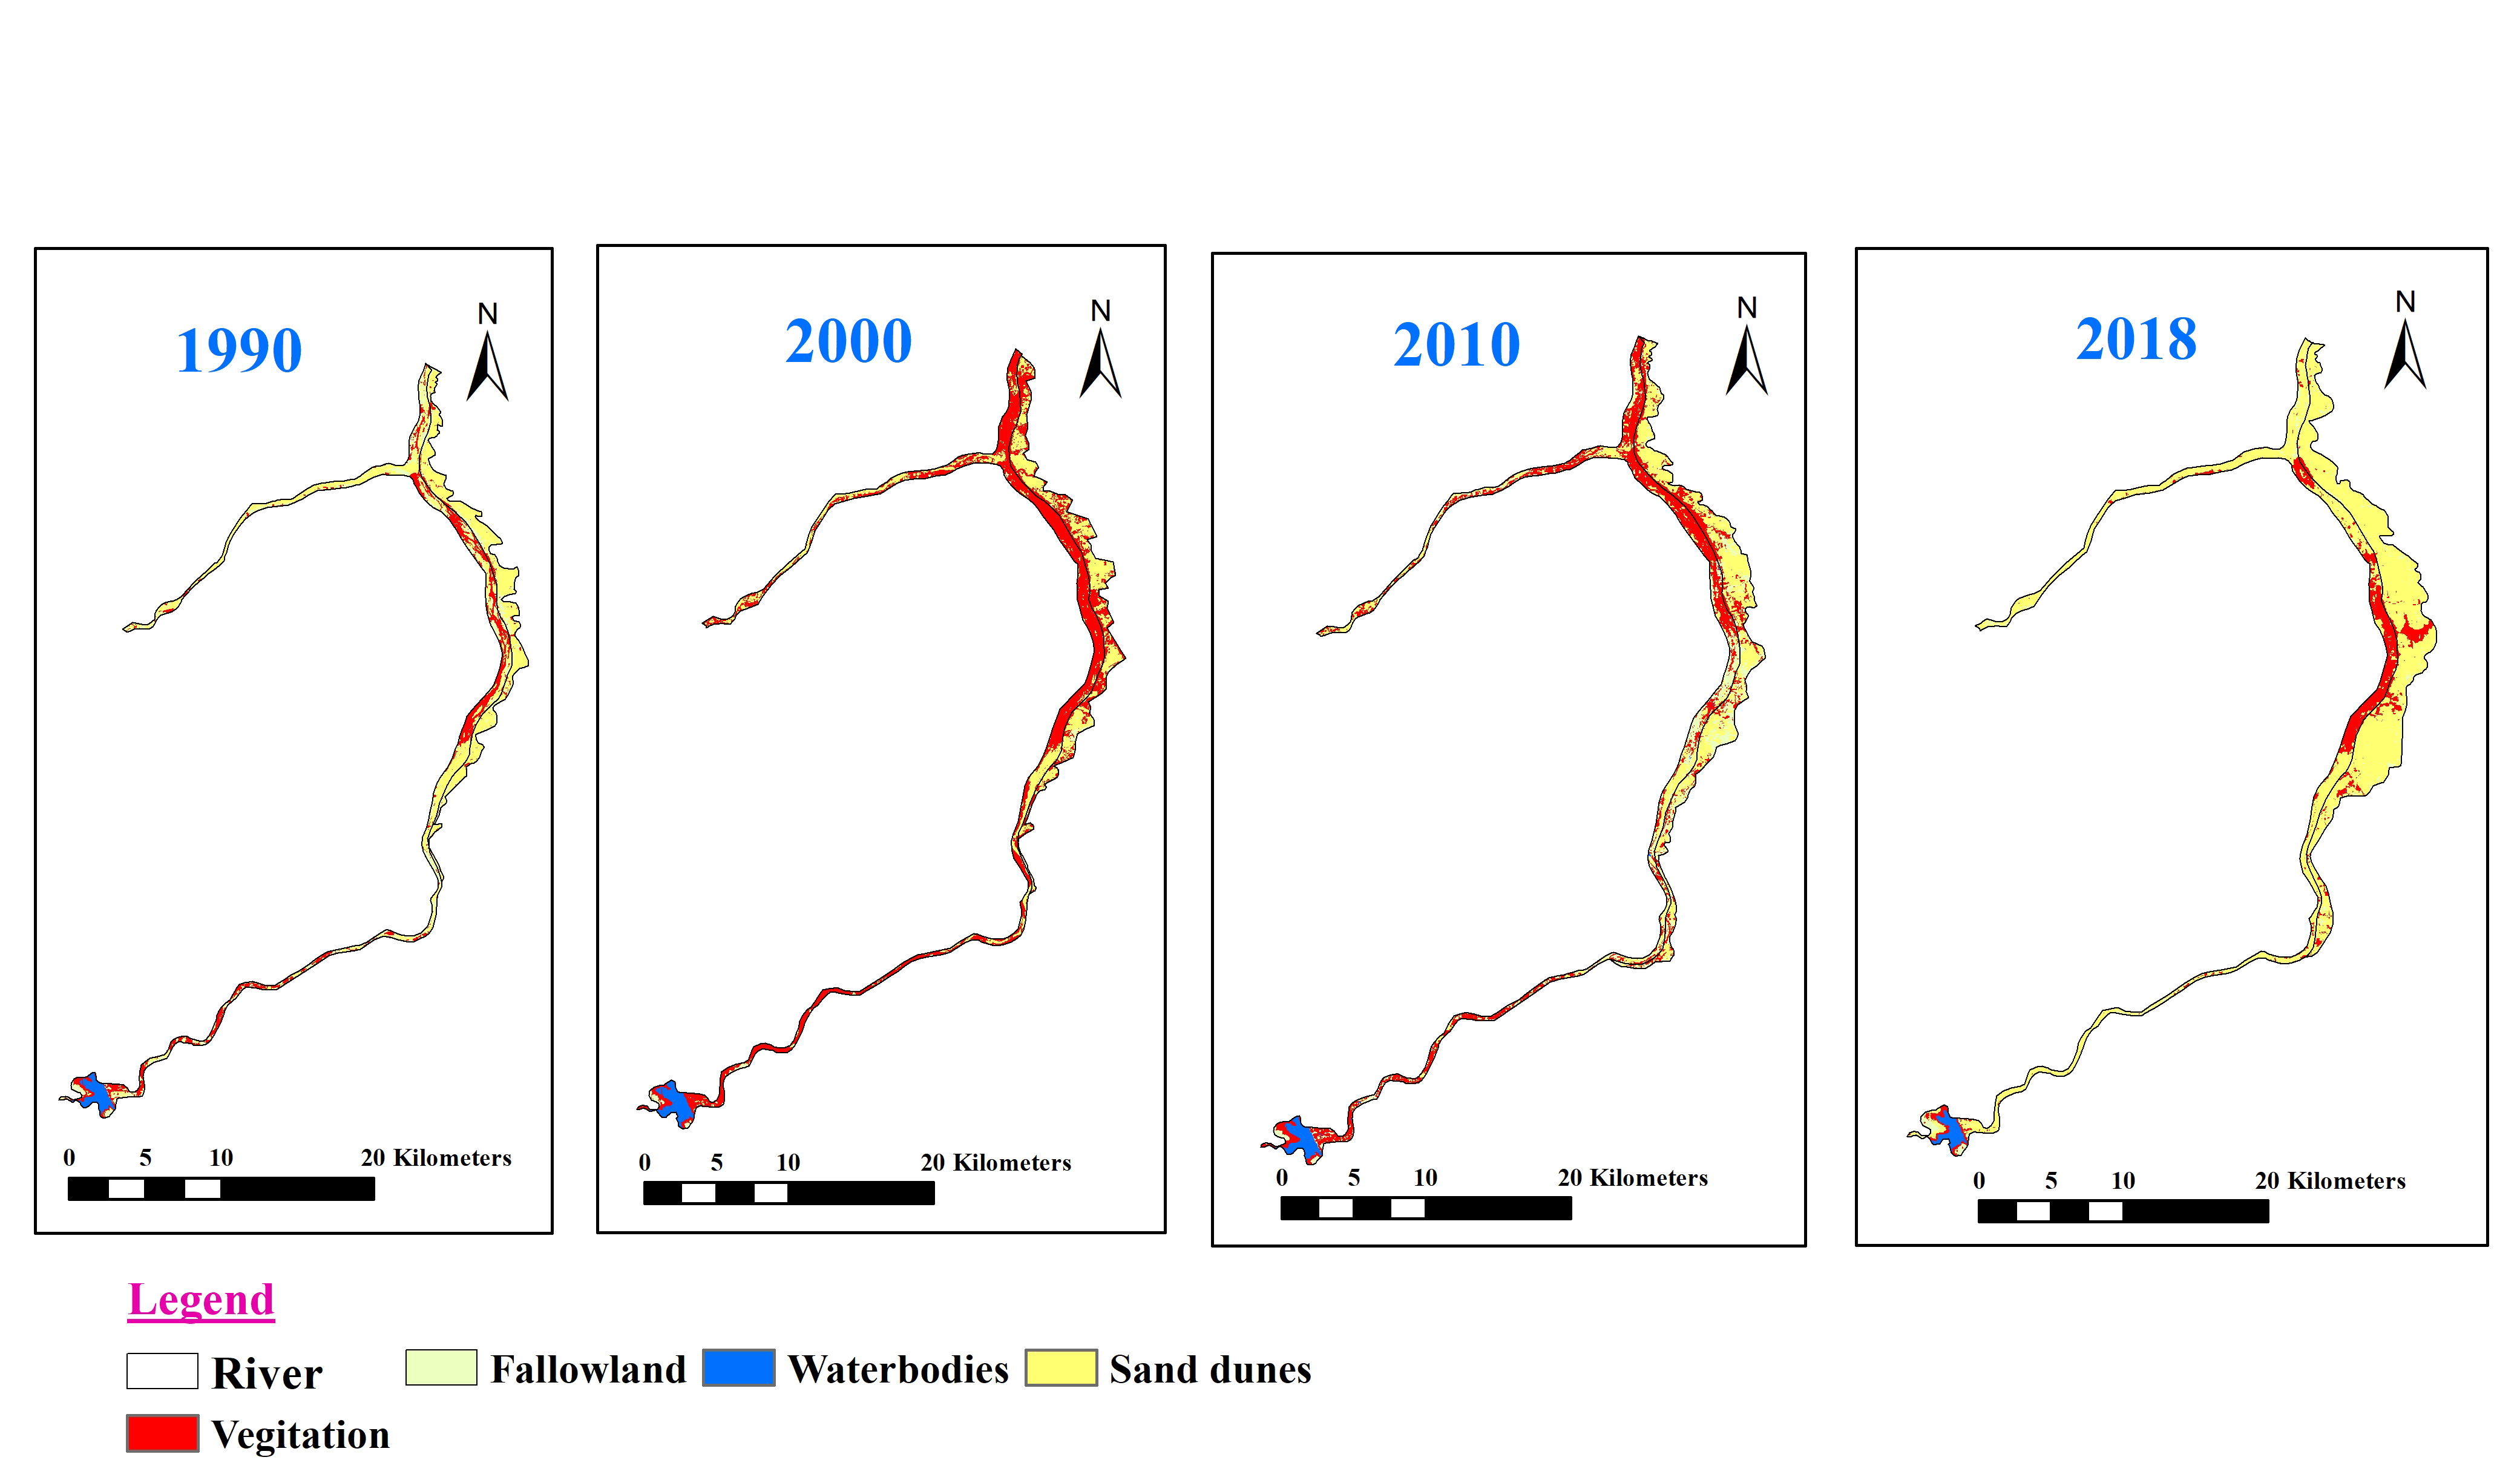
The Vedavathi River areas are fallen under the rain shadow zone according to the Koeppen’s climatic division in India. Migration of the desert sand dunes are usually seen in the right side of the mandalas. Vedavathi river bed is the place of origination of the sands and the migration is carried by the transporting agent of wind. Hence these sands are called as Aeolian sands and this type of desertification is named as Aeolian desertification. The south-west monsoon season (June- September), study area facing high surface winds flow West to Eastern side, with the speed of 22 Km/h to 36 Km/h (Figure 5). For of these strong surface winds, the sand has been migrated to the agricultural fields which is reducing the soil fertility and causing devastation to the agriculture in the study area. The resultant figure 5 clearly depicts the rate of migration of sand and sand dunes in the study area. Different size and shapes of the sand dunes present in the study part, wherever transverse and linear type of dunes are very common. Figure 7 shows different types of sand dunes and desertification status in the study area. Unidirectional Asymmetrical Ripple marks will give the evidence of this migration of sands and desertification from west to eastern side. All approaches for the past 28 years have been taken in to the consideration, i.e., 1990 to 2018, the analyzed statistics clearly reveals the rate of migration of Aeolian sands along the Vedavathi River. Present study indicates the DSM individually for the years 1990, 2000, 2010, and 2018 (Figure 6). In the year 1990 Aeolian sand desertification is calculated in the extent of 28.22 Km2 and in the year 2000 it is calculated in the extent of 33.86 Km2. For the decade 1990 to 2000 desertification is increased to 5.64 Km2. In the year 2010 the Aeolian sand desertification is calculated in the extent of 46.30 Km2 and in the year 2018 it is calculated in the extent of 58.62 Km2 (5862 hectares). For the year 2010 to 2018 the desertification is increased to 12.32 Km2. For the past 28 years the Aeolian sand desertification is increased in to the alarming rates with the land extent of 30.4 Km2 (Table 3). Migration of sand in 28 years’ span is calculated through geometric calculation technique, which evidently expose that the sand dunes were migrated uninterruptedly and desertification process is highly active in this area. This study clearly reveal that the Aeolian sands present in the Vedavathi River is caused for this desertification.
Figure 5. Wind speeds
Figure 6. Change detection
Table 3 Change detection analysis
Years
1990
2000
2010
2018
Change (1990-2018)
Desertified area (Km2)
28.22
33.86
46.30
58.62
30.4
4.3 Accuracy Assessment
In grouping procedure, the role of Accuracy Assessment (AA) is quite vital. For the significant accentuation for exactness evaluation, pixel choice was on zones that could be obviously distinguished on Landsat high resolution image, Google Earth and Google Map (Schull et al., 2005). Image was characterized at 50 points. Topographical guides and Google Earth maps were used as a kind of perspective source to group the selected features (Dewan and Yamaguchi, 2016). Table 2 demonstrates the connection between ground truth information and the relating characterized information, revealed through the error matrix report. The accuracy can be computed by:
\(Overall \ accuracy = {No. \ of \ correct points \over Total \ number \ of \ points} \times 100\)
KAPPA analysis is a discrete multivariate technique used in accuracy assessments (Jenness and Wynne., 2007). KAPPA analysis yields a Khat statistic (an estimate of KAPPA) that is a measure of agreement or accuracy. Using the formulae equipped on ArcGIS. The results from the AA showed overall accuracy about 84% from random sampling process for the image.
Figure 7. (a) Anemometer readings; b, c, d and e: Asymmetrical ripple marks; f, g, h, and i; Sand dunes encroachment in the crop land
5 . CONCLUSIONS
Landsat data from 1990 to 2018 has been castoff to examine the movements in the desertification sensitivity over the earlier twenty-eight years along the Vedavathi River. This work discloses that migration of sand dunes and desertification happening by the Aeolian sand deposits present in the Vedavathi River. RS Landsat data has been effectively helped to develop DSM maps. The current research exposes that Aeolian desertification in the present study growing extremely fast by the transformation in environmental conditions. In the past 28 years 30.4 km2 of agricultural land is desertified. Bommanahal, Kanekal, and Beluguppa mandalas are seriously affected by the Aeolian desertification, which are present in the eastern side of the Vedavathi River in south central part of the Anantapur district of AP, India. For monitoring the desertification and to take action plans towards the mitigation of desertification is possible by DSM maps. Some of the recommendations can comprise that to decrease of surface wind speeds, in order to sidestep sand migration on agricultural fields, suitable agriculture aid to inhibit the desertification and restoration of rigorously desertified lands for prolific consumption for cultivation perseverance.
Tables
Figures
Conflict of Interest
The authors declare no conflict of interest.
Acknowledgements
The first author B. Pradeep Kumar, greatly thankful to Department of Science and Technology (DST), Government of India, for financial support through INSPIRE programme (Sanction order No. DST/INSPIRE Fellowship/2017/IF170114). We are also thankful to USGS for remote sensing data and Department of Geology, Yogi Vemana University, for necessary facilities for carrying out the research work.
Abbreviations
AA: Accuracy Assessment; BIF: Banded Iron Formations; DSM: Desertification Status Maps; FCC: False Colour Composite; LULC: Land Use Land Cover; GIS: Geographical Information System; GSI: Geological Survey of India; PGC: Peninsular Gneissic Complex; RS: Remote Sensing; SOI: Survey of India; UNCOD: United Nations Conference on Desertification.
Amal, K., 2016. Desertification, Central Arid Zone Research Institute (CAZRI).
8.
Anonymous, 2003. Desertification Status Mapping- Technical Guidelines. Forest, Land use and Photogrammetry group, RESIPA, Space Application Venter, Ahmadabad, 34.
Dhinwa, P. S., Dasgupta, A. and Ajai, 2016. Monitoring and assessment of desertification using satellite remote sensing. Journal of Geomatics, 10(2), 201-216.
GSI [Geological Survey of India], 2002. Geological Survey of India District Mineral Resources Map Anantapur, Andhra Pradesh, India.
15.
Harshika, A. K. and Sopan I., 2012. Land use land cover classification and change detection using high resolution temporal satellite data. Journal of Environment, 01(04), 146-15.
16.
Jenness, J. and Wynne, J. J., 2007. Kappa analysis (kappa_stats. avx) extension for ArcView 3x. Jenness Enterprises.
Pradeep Kumar, B., Raghu Babu, K., Rajasekhar, M. and Ramachandra, M., 2019. Assessment of land degradation and desertification due to migration of sand and sand dunes in Beluguppa Mandal of Anantapur district (AP, India), using remote sensing and GIS techniques. The Journal of Indian Geophysical Union, 23(2), 173-180.
21.
Pradeep Kumar, B., Rajasekhar, M., Ramachandra, M. and Siva Kumar Reddy P., 2018. Assessment of land degradation and desertification due to migration of sand dunes - A case study in Bommanahal Mandal, Anantapur district, Andhra Pradesh, India using Remote Sensing and GIS techniques. IJRAT, 6 (6), 1-7.
22.
Pradeep Kumar. B., Raghu Babu. K., Rajasekhar M. and Narayana Swamy, B., 2019. Change detection analysis of Land Use and Land Cover in Tadimarri mandal of Anantapur district, AP, India, using Geospatial Techniques. IJRAR- International Journal of Research and Analytical Reviews, 6(2), 634-640.
Rajasekhar, M., Raju, G. S., Raju, R. S. and Basha, U. I., 2017. Landuse and landcover analysis using remote sensing and GIS: A case study in Uravakonda, Anantapur District, Andhra Pradesh, India. IRJET, 4(9), 780-785.
Reynolds, J. F., Maestre, F. T., Kemp, P. R., Stafford-Smith, D. M. and Lambin E., 2007. Natural and human dimensions of land degradation in drylands: Causes and consequences. In: Canadell J. G., Pataki D.E., Pitelka L.F. (eds) Terrestrial Ecosystems in a Changing World. Global Change - The IGBP Series. Springer, Berlin, Heidelberg.
Sreenivasulu, G., Jayaraju N. and Lakshmi P. T., 2014. Landuse and landcover analysis using remote Sensing and GIS: A case study in and around Rajampet, Kadapa District, Andhra Pradesh, India. IJMRD, 2(1), 186-191.
36.
Thomas, D. S. G. and Middleton, N. J., 1994. Desertification: Exploding the Myth. John Wiley & Sons Ltd., Chichester, UK.


 ,
Raghu Babu K 2
,
Raghu Babu K 2